Download to read offline


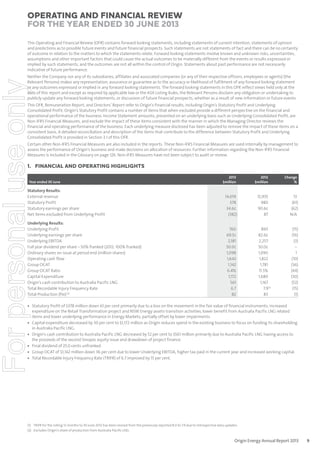
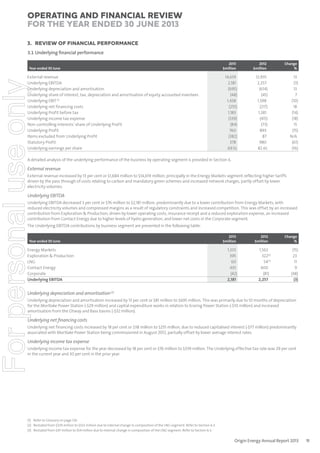
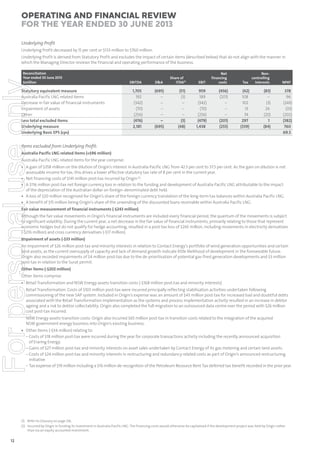
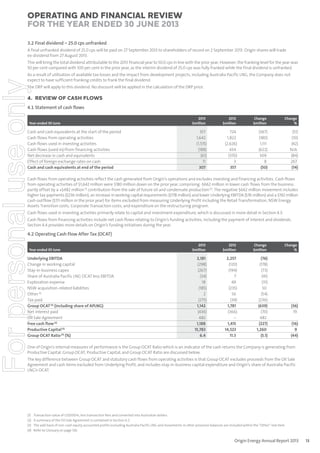

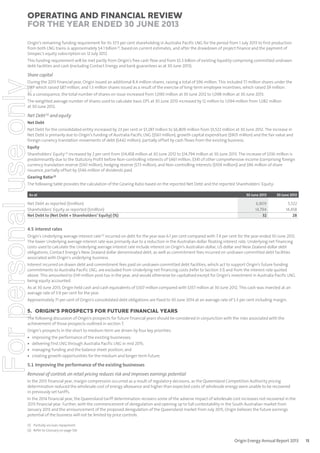

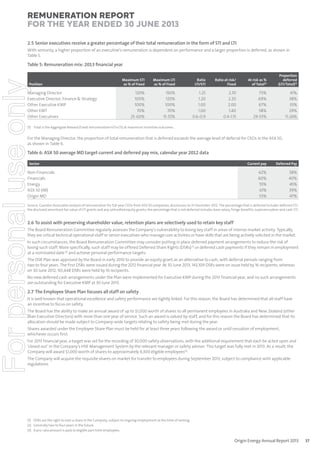
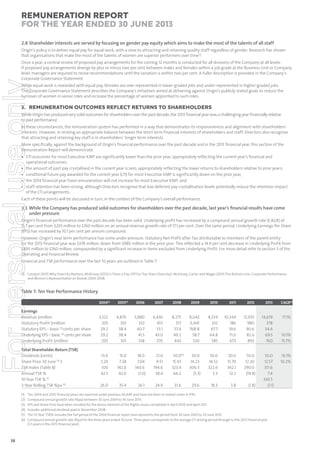
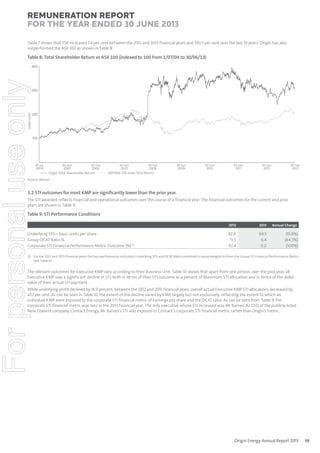
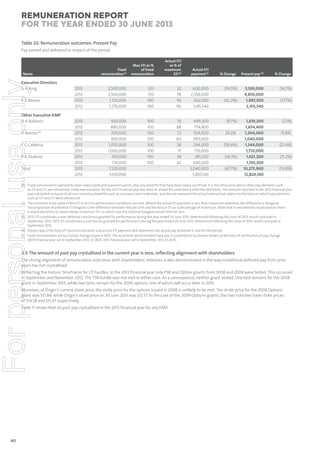


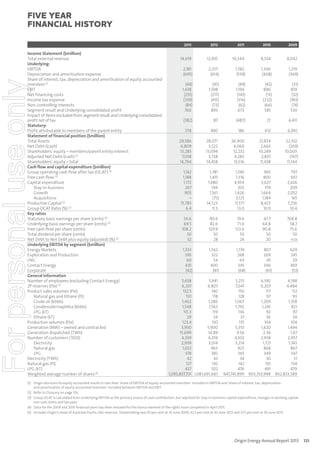


The document is Origin Energy's 2013 Annual Report. It provides an overview of Origin Energy's financial performance for the 2013 fiscal year, including a decrease in statutory profit to $378 million due to factors such as losses on financial instruments and increased retail transformation expenditures. Underlying profit decreased 15% to $760 million. Key highlights included sufficient liquidity to fund Australia Pacific LNG requirements, underlying business performance, and operating effectiveness improving in Energy Markets. The report discusses future prospects such as delivering the Australia Pacific LNG project on schedule and improving performance across existing businesses.


