The document provides an overview of operations management concepts including:
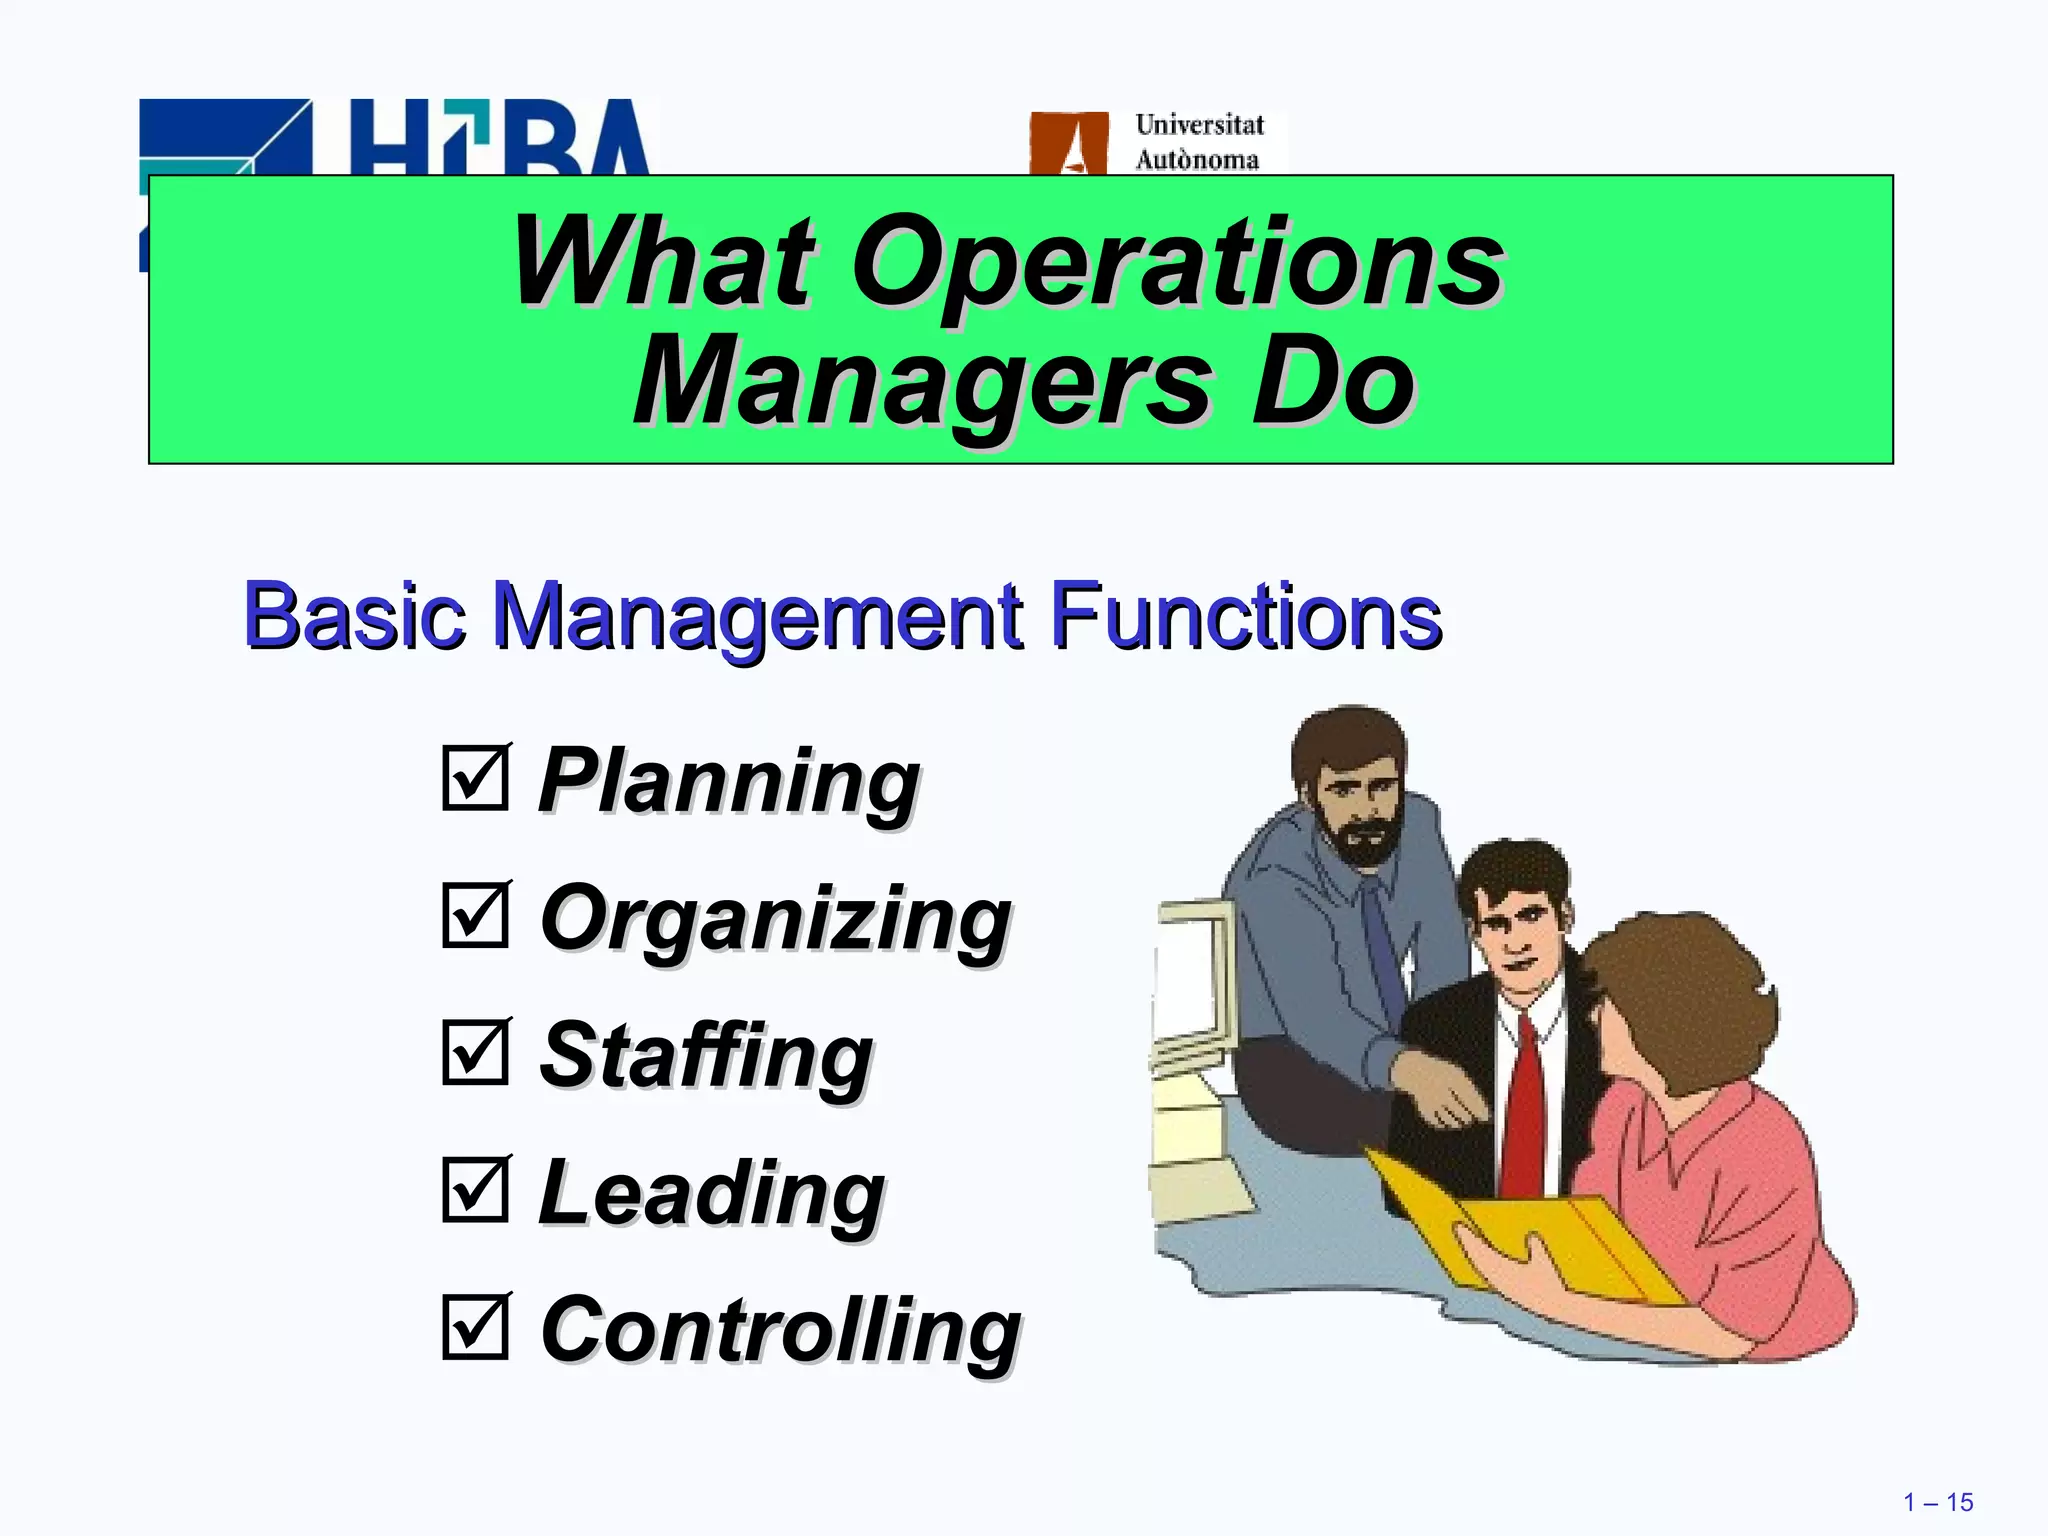
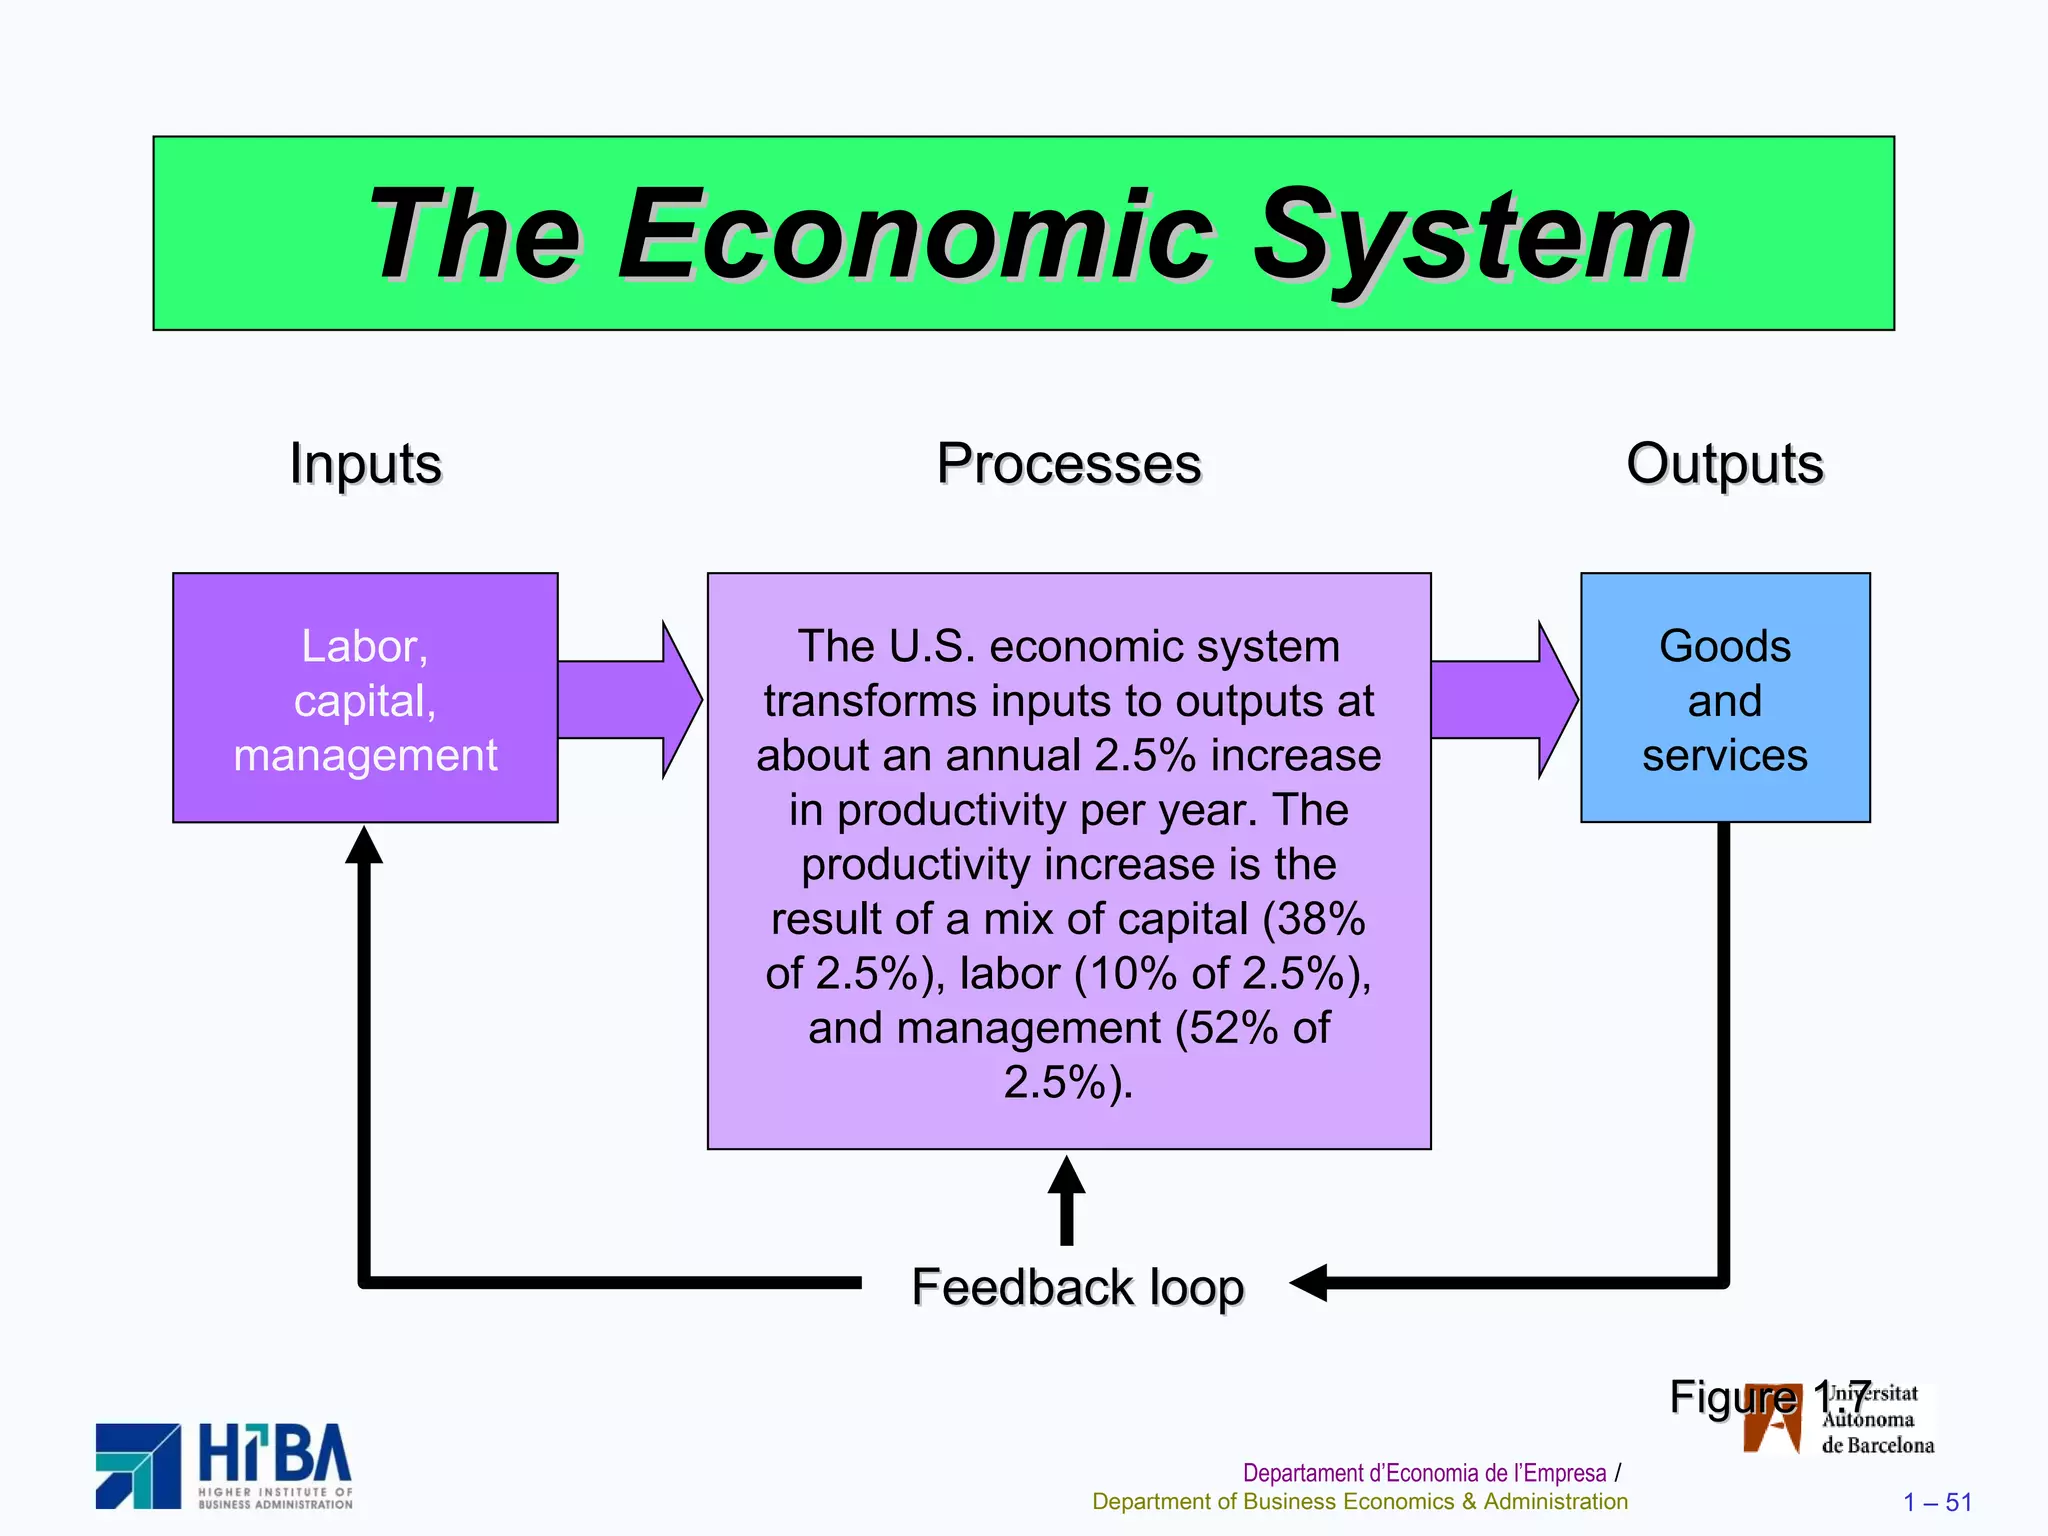
1) It defines operations management as managing the processes that transform inputs into outputs in the form of goods and services.
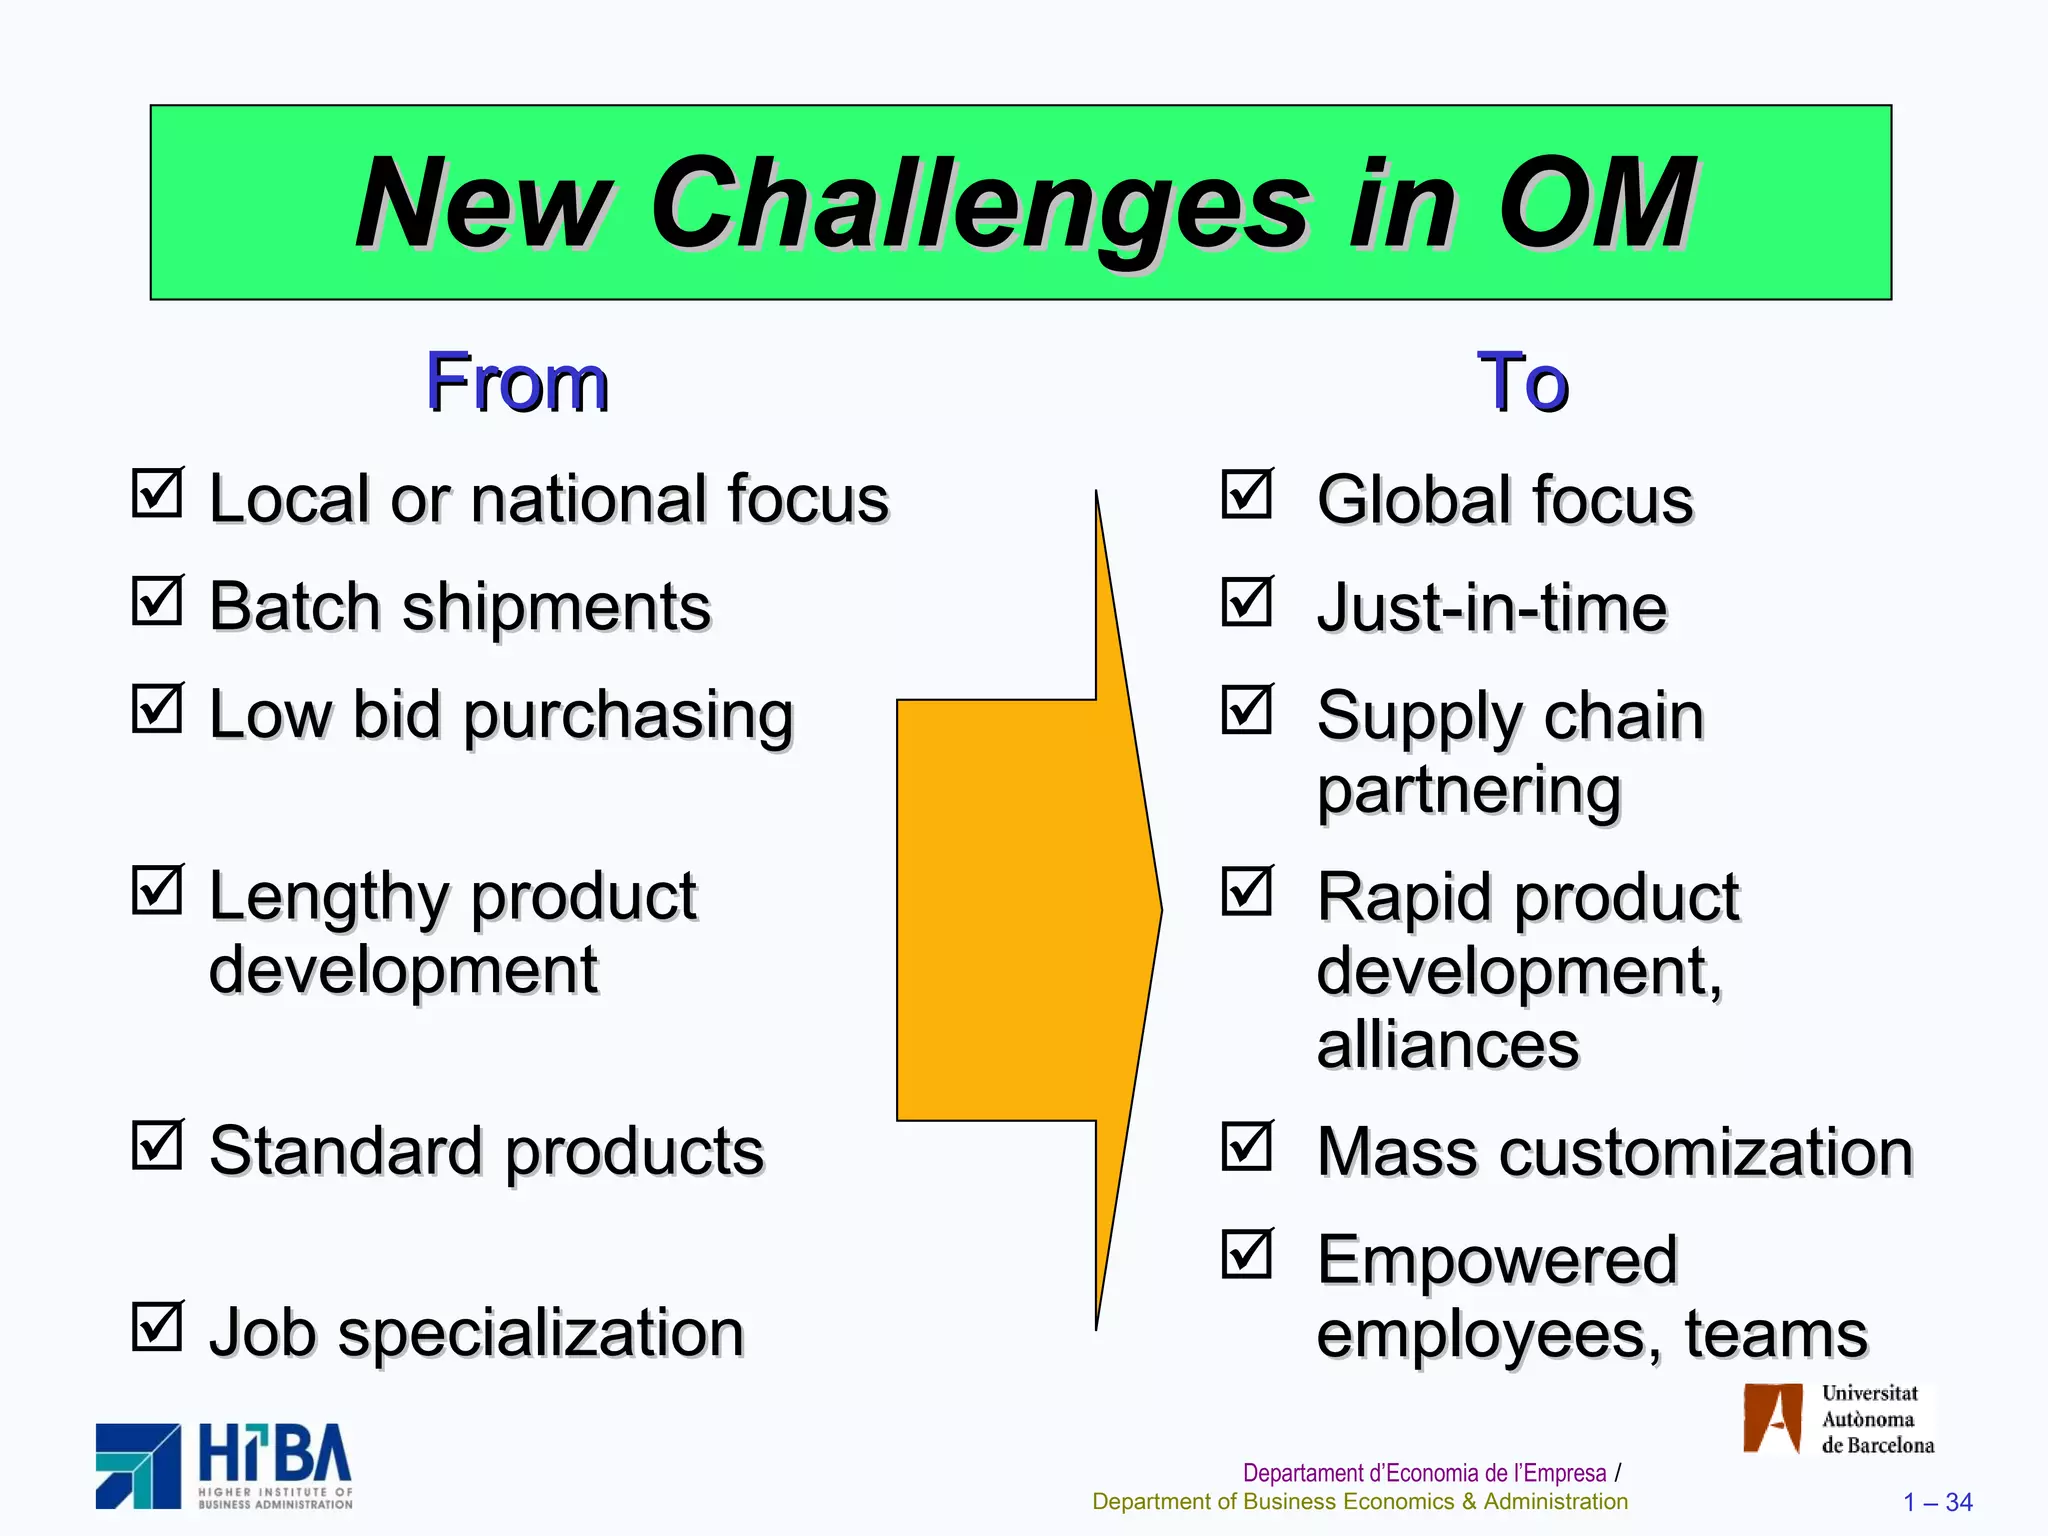
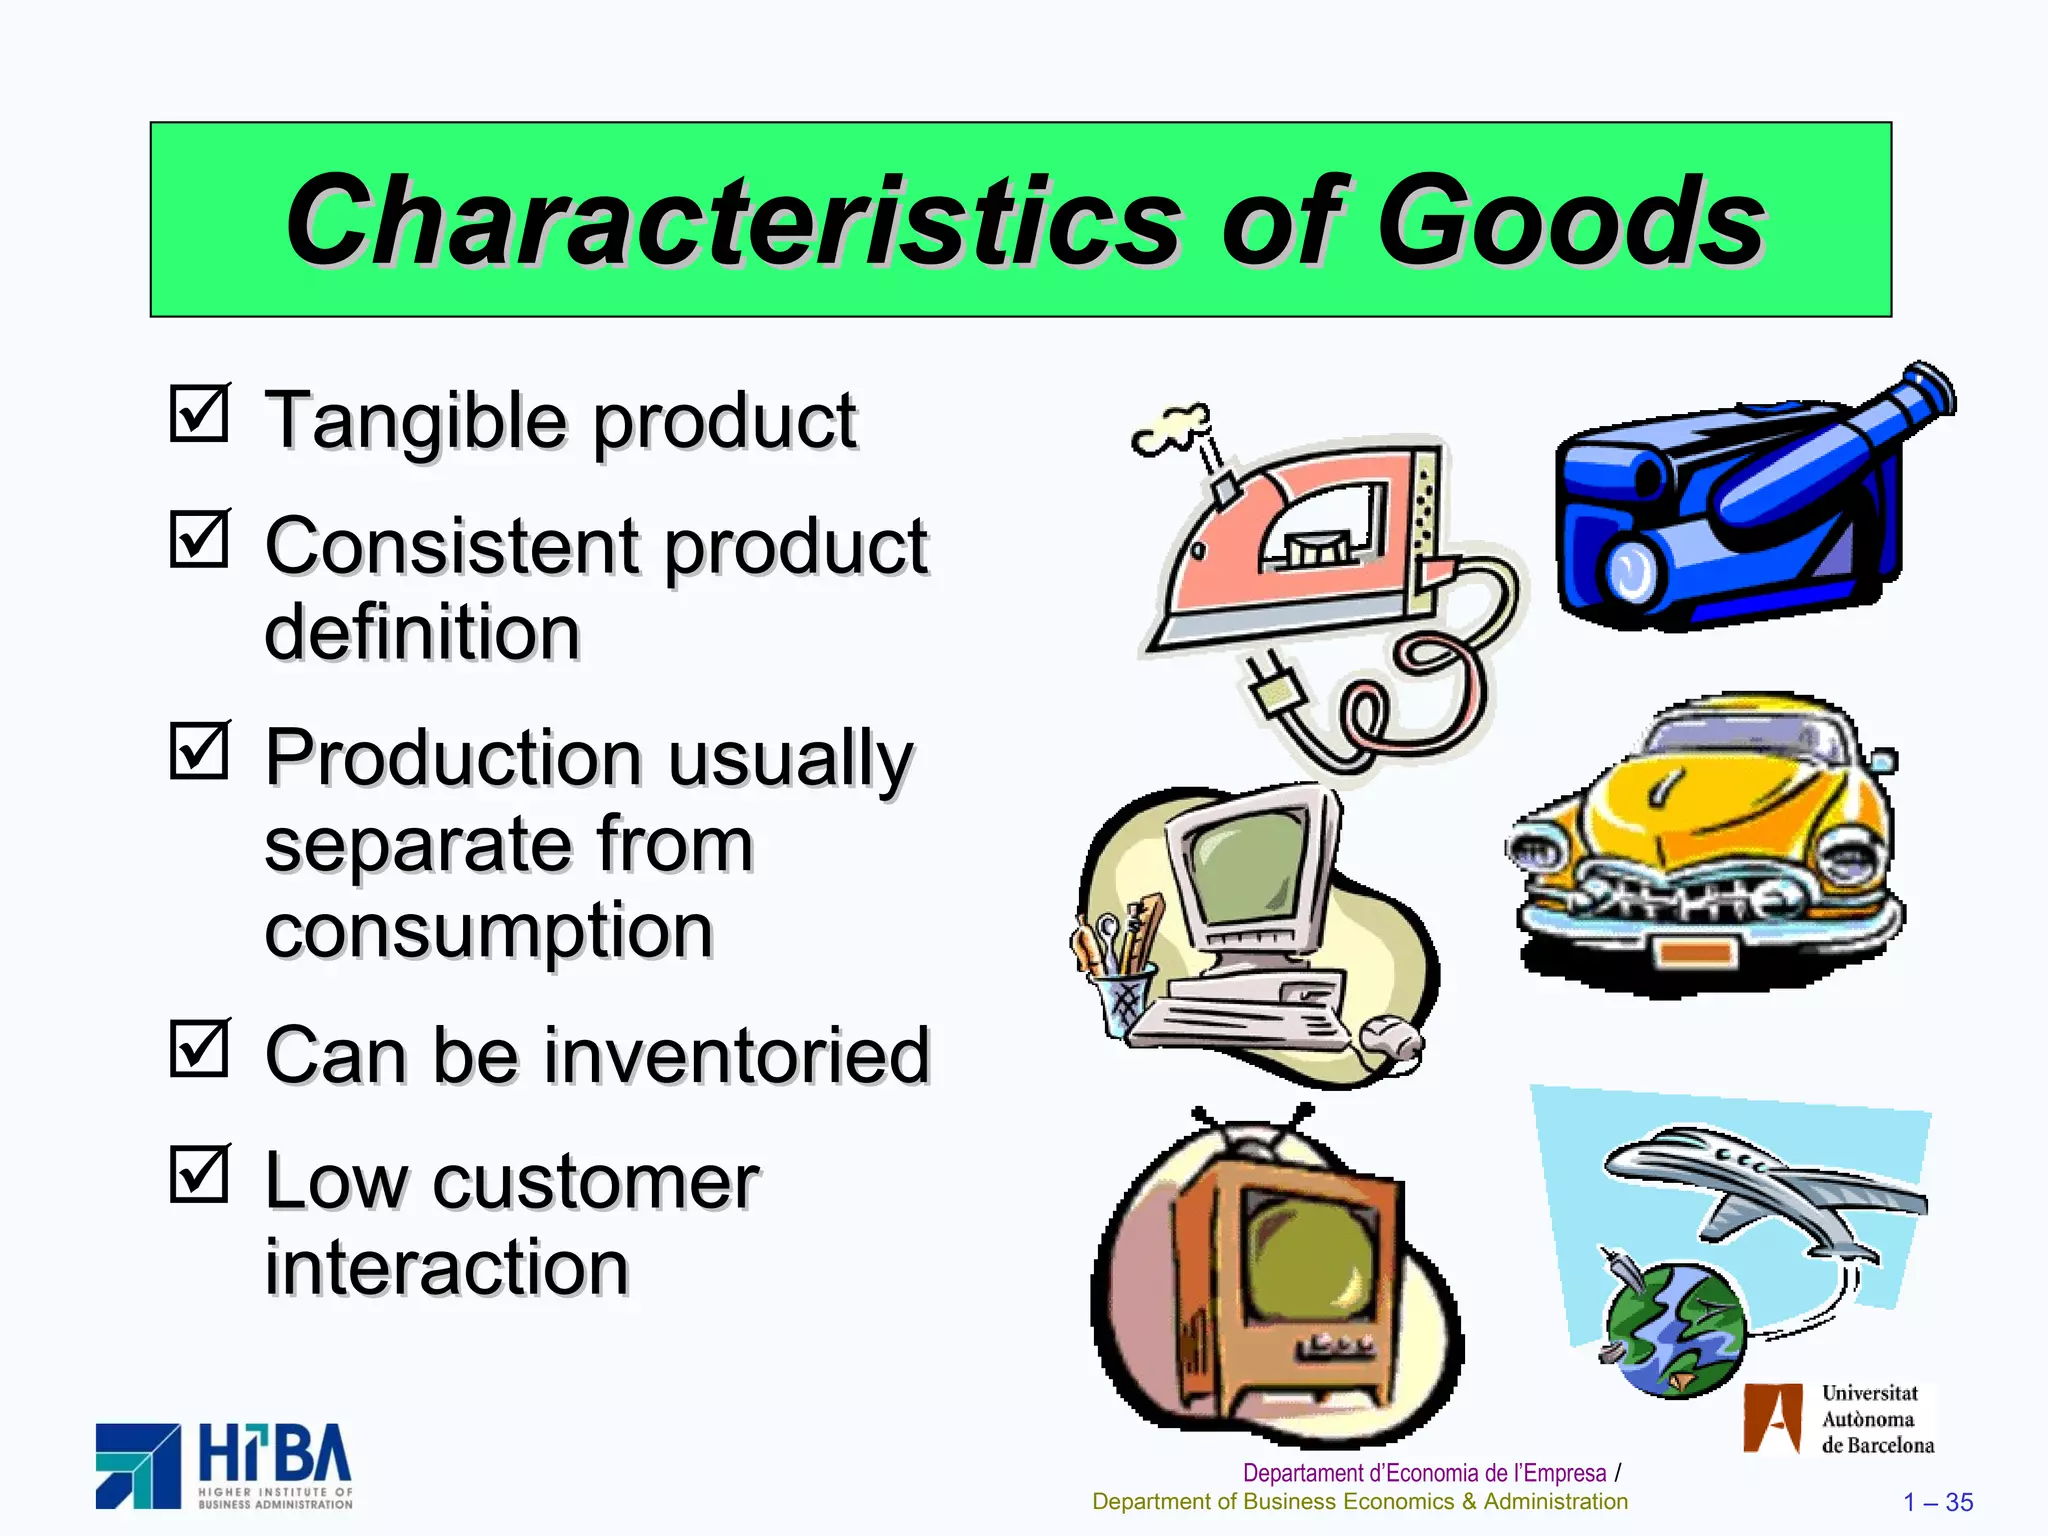
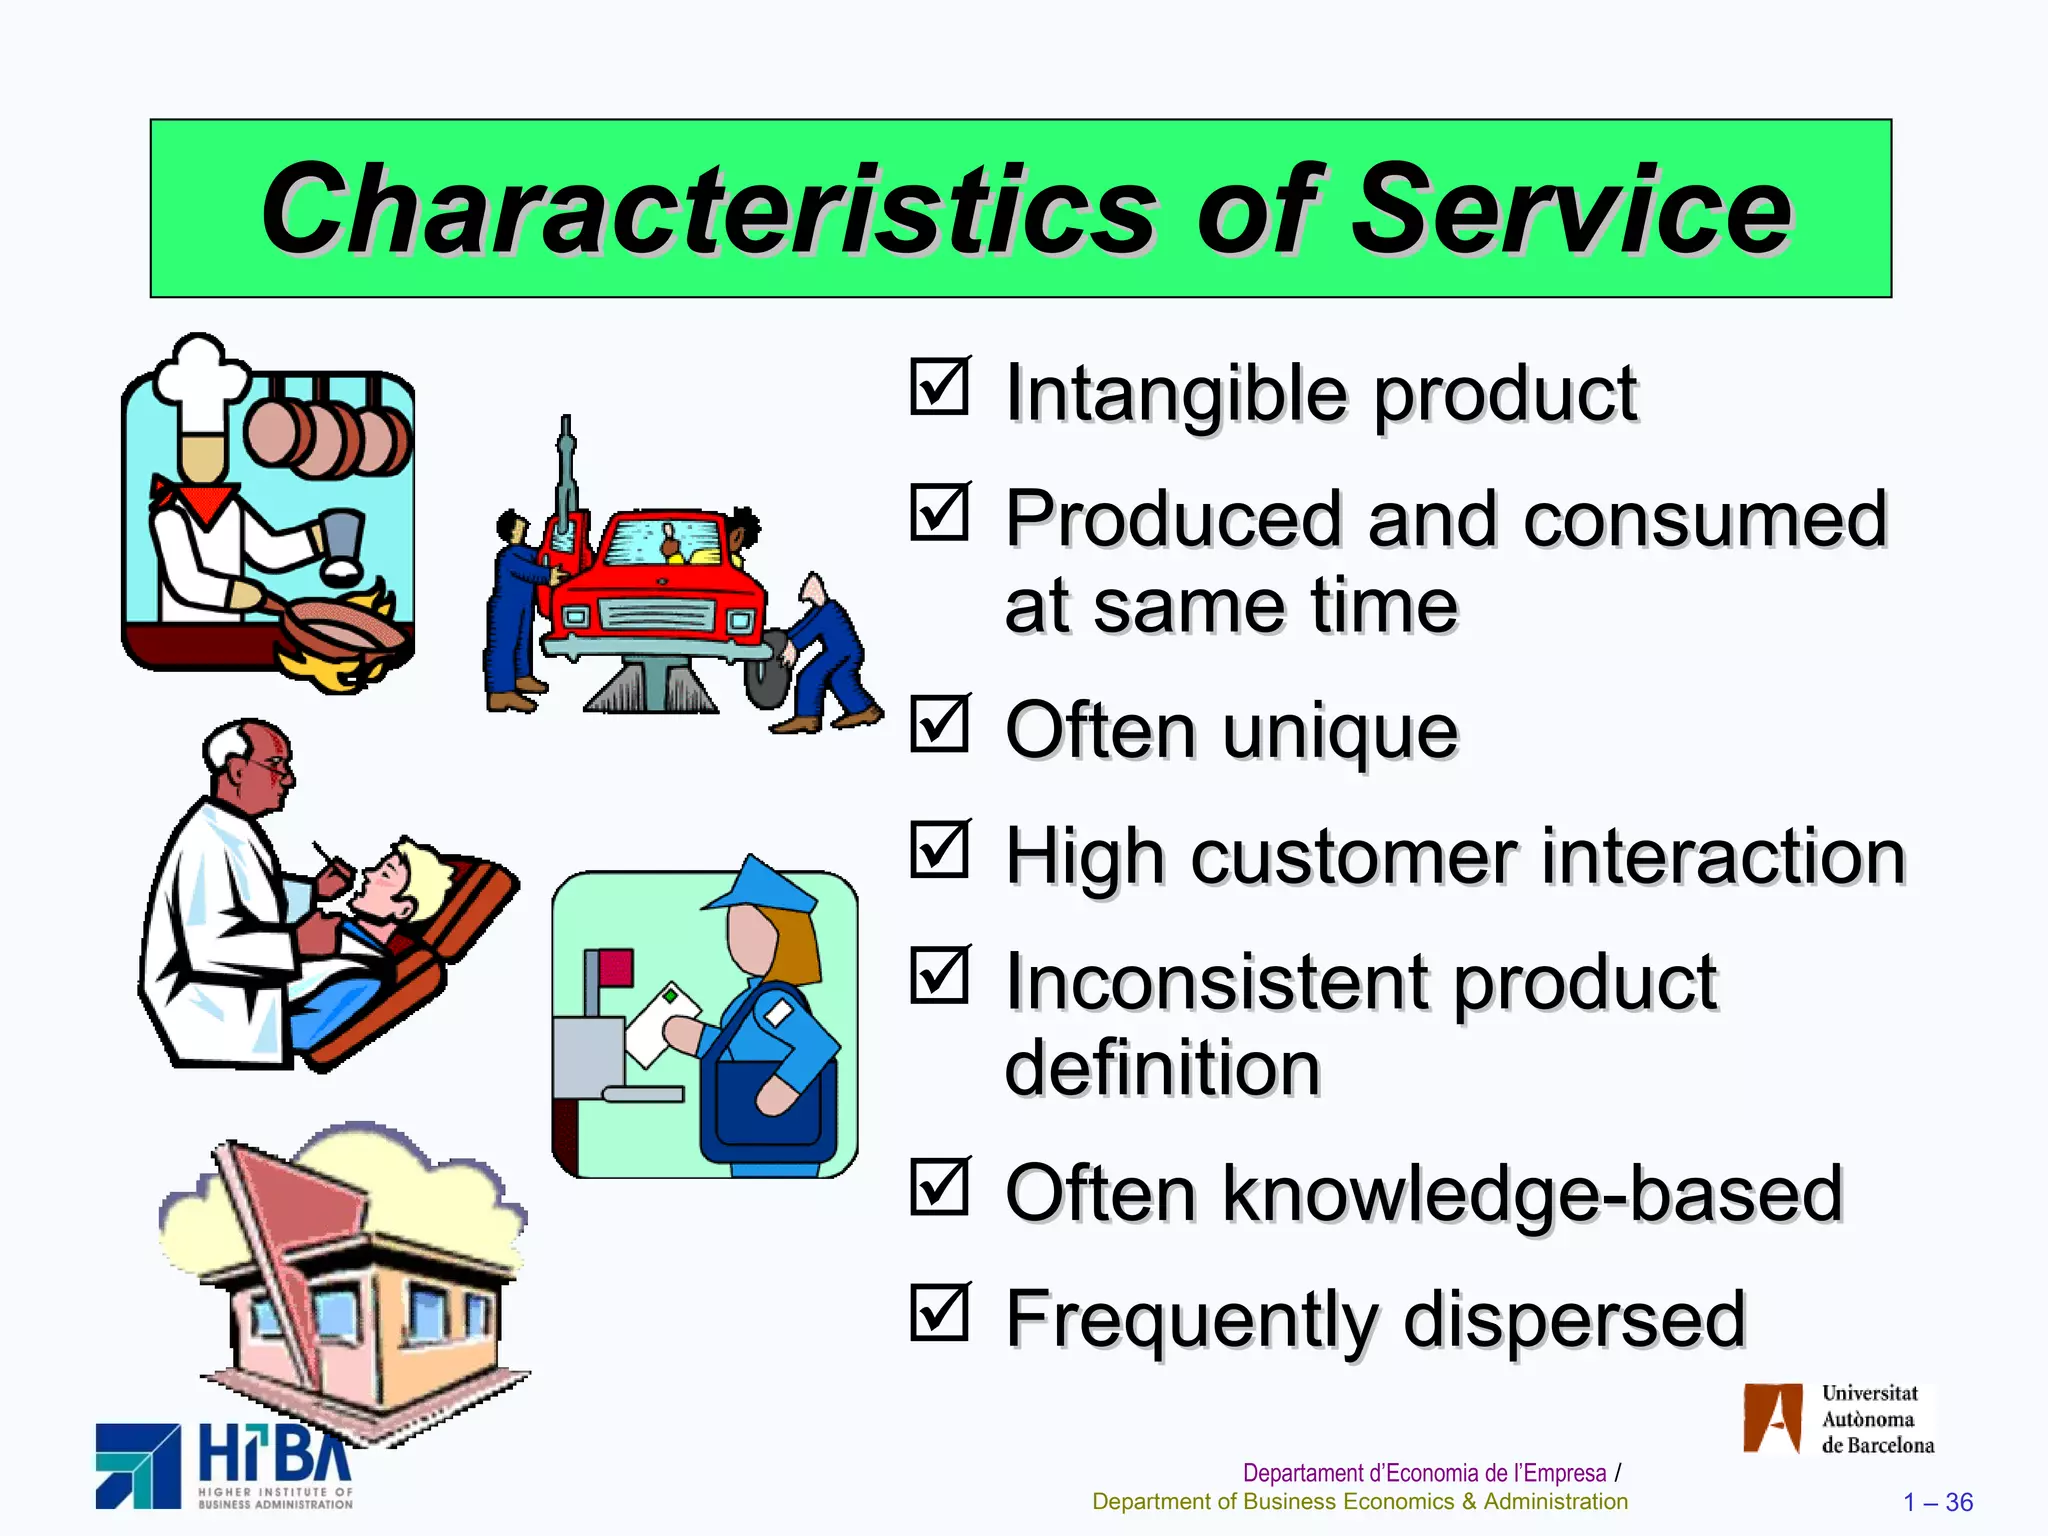
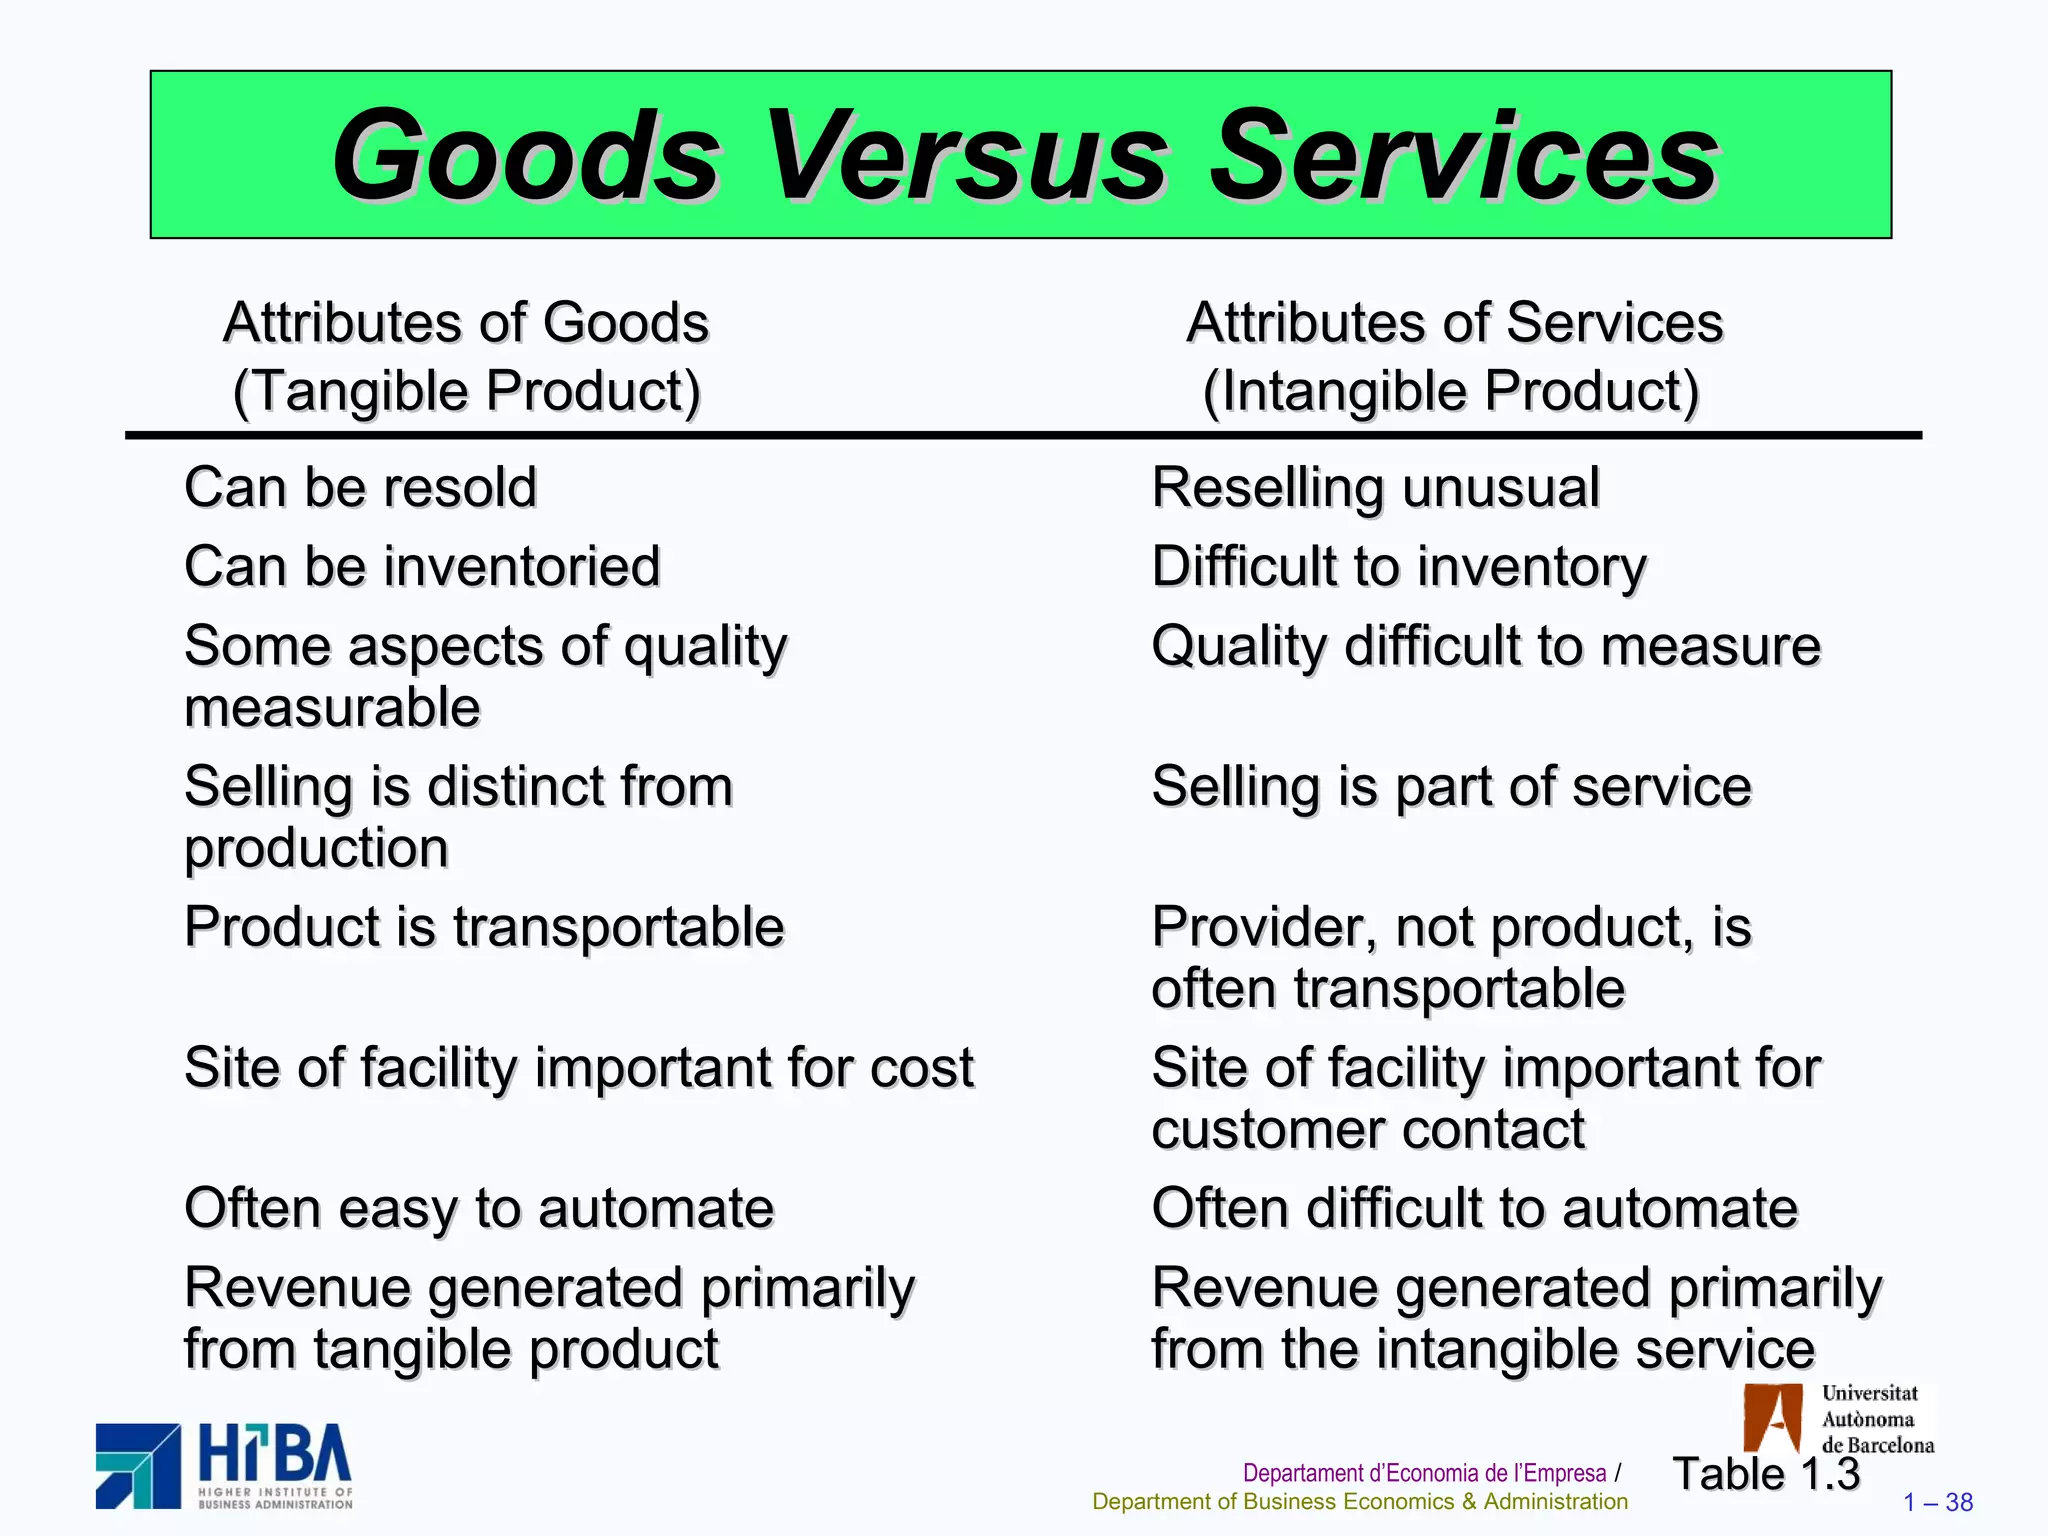
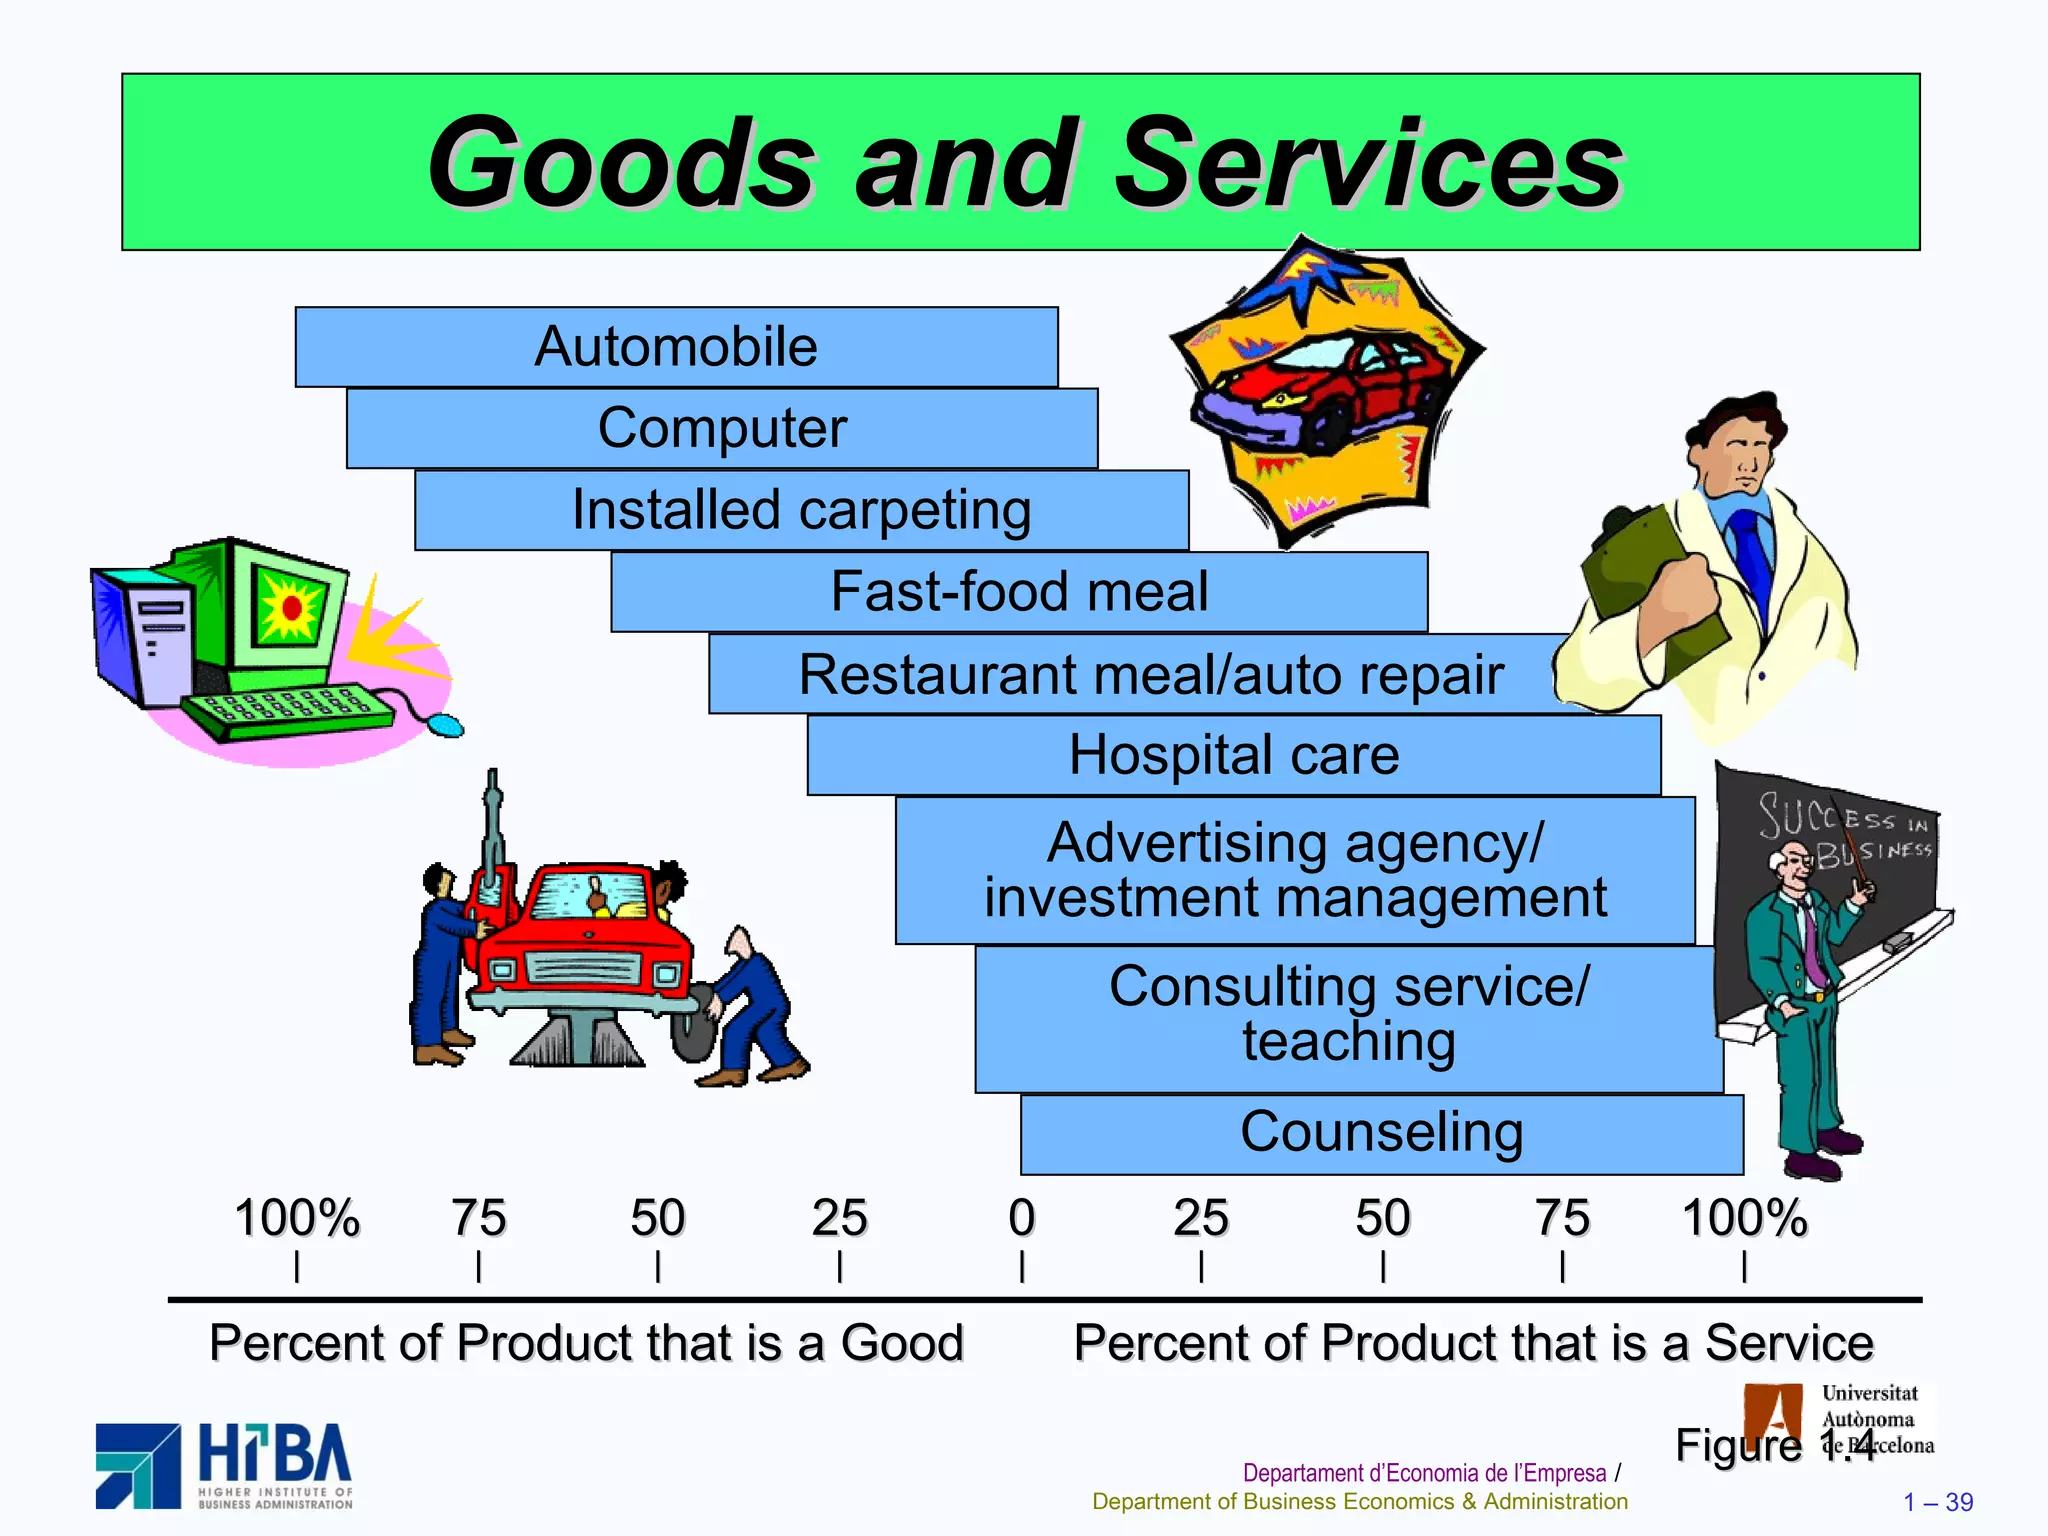
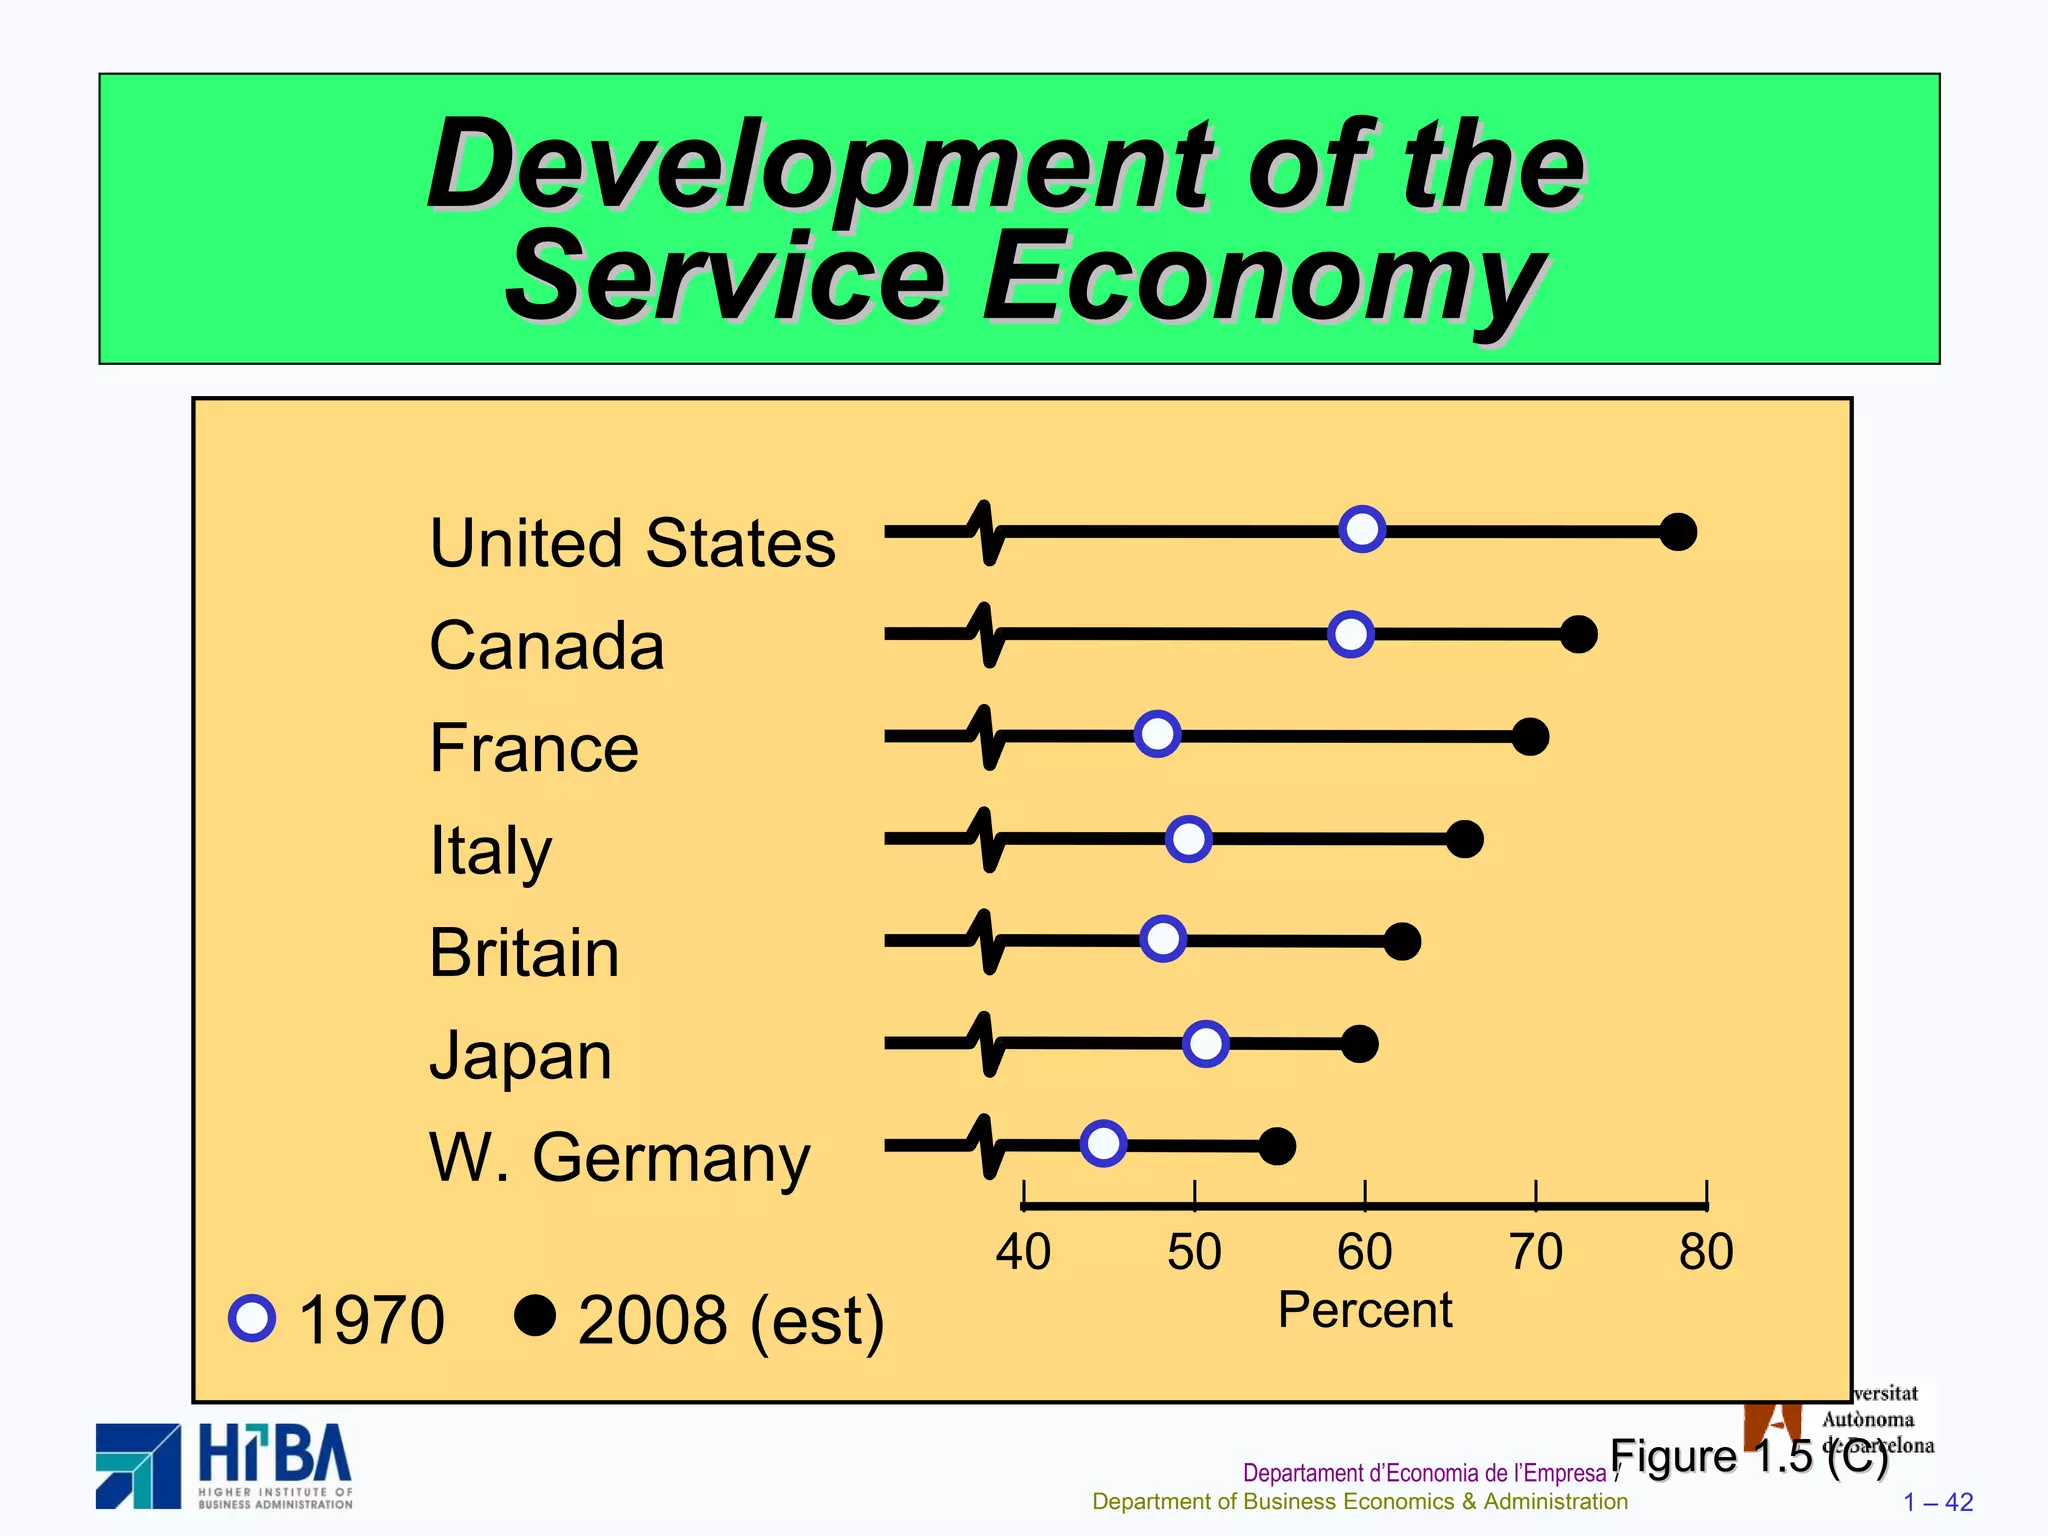
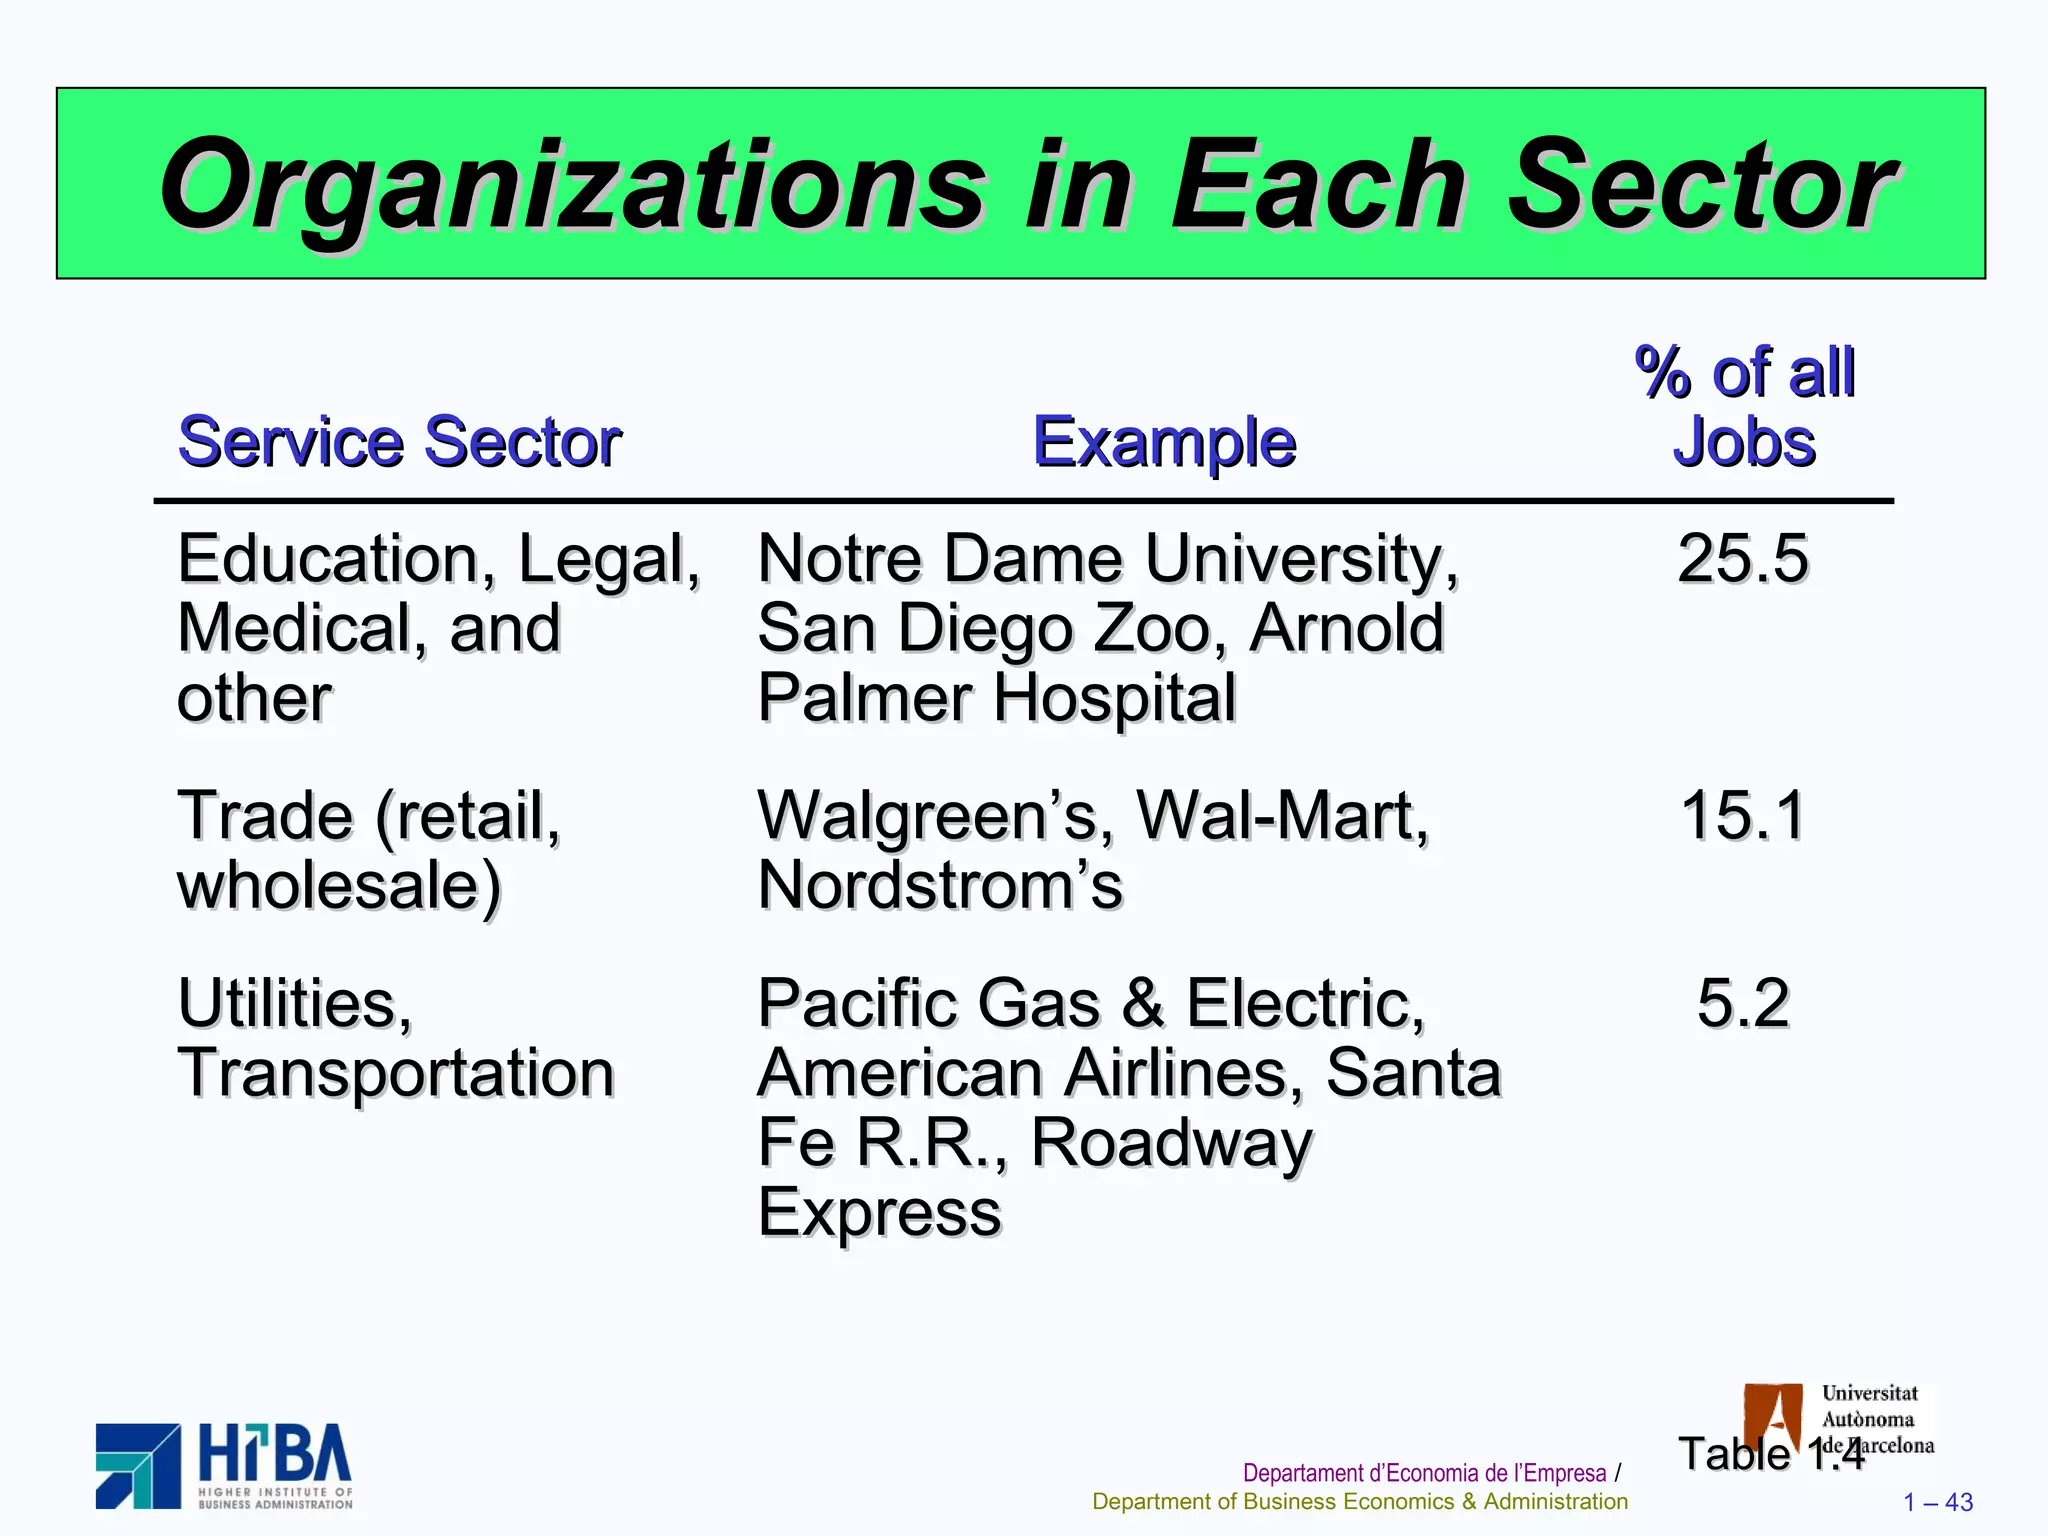
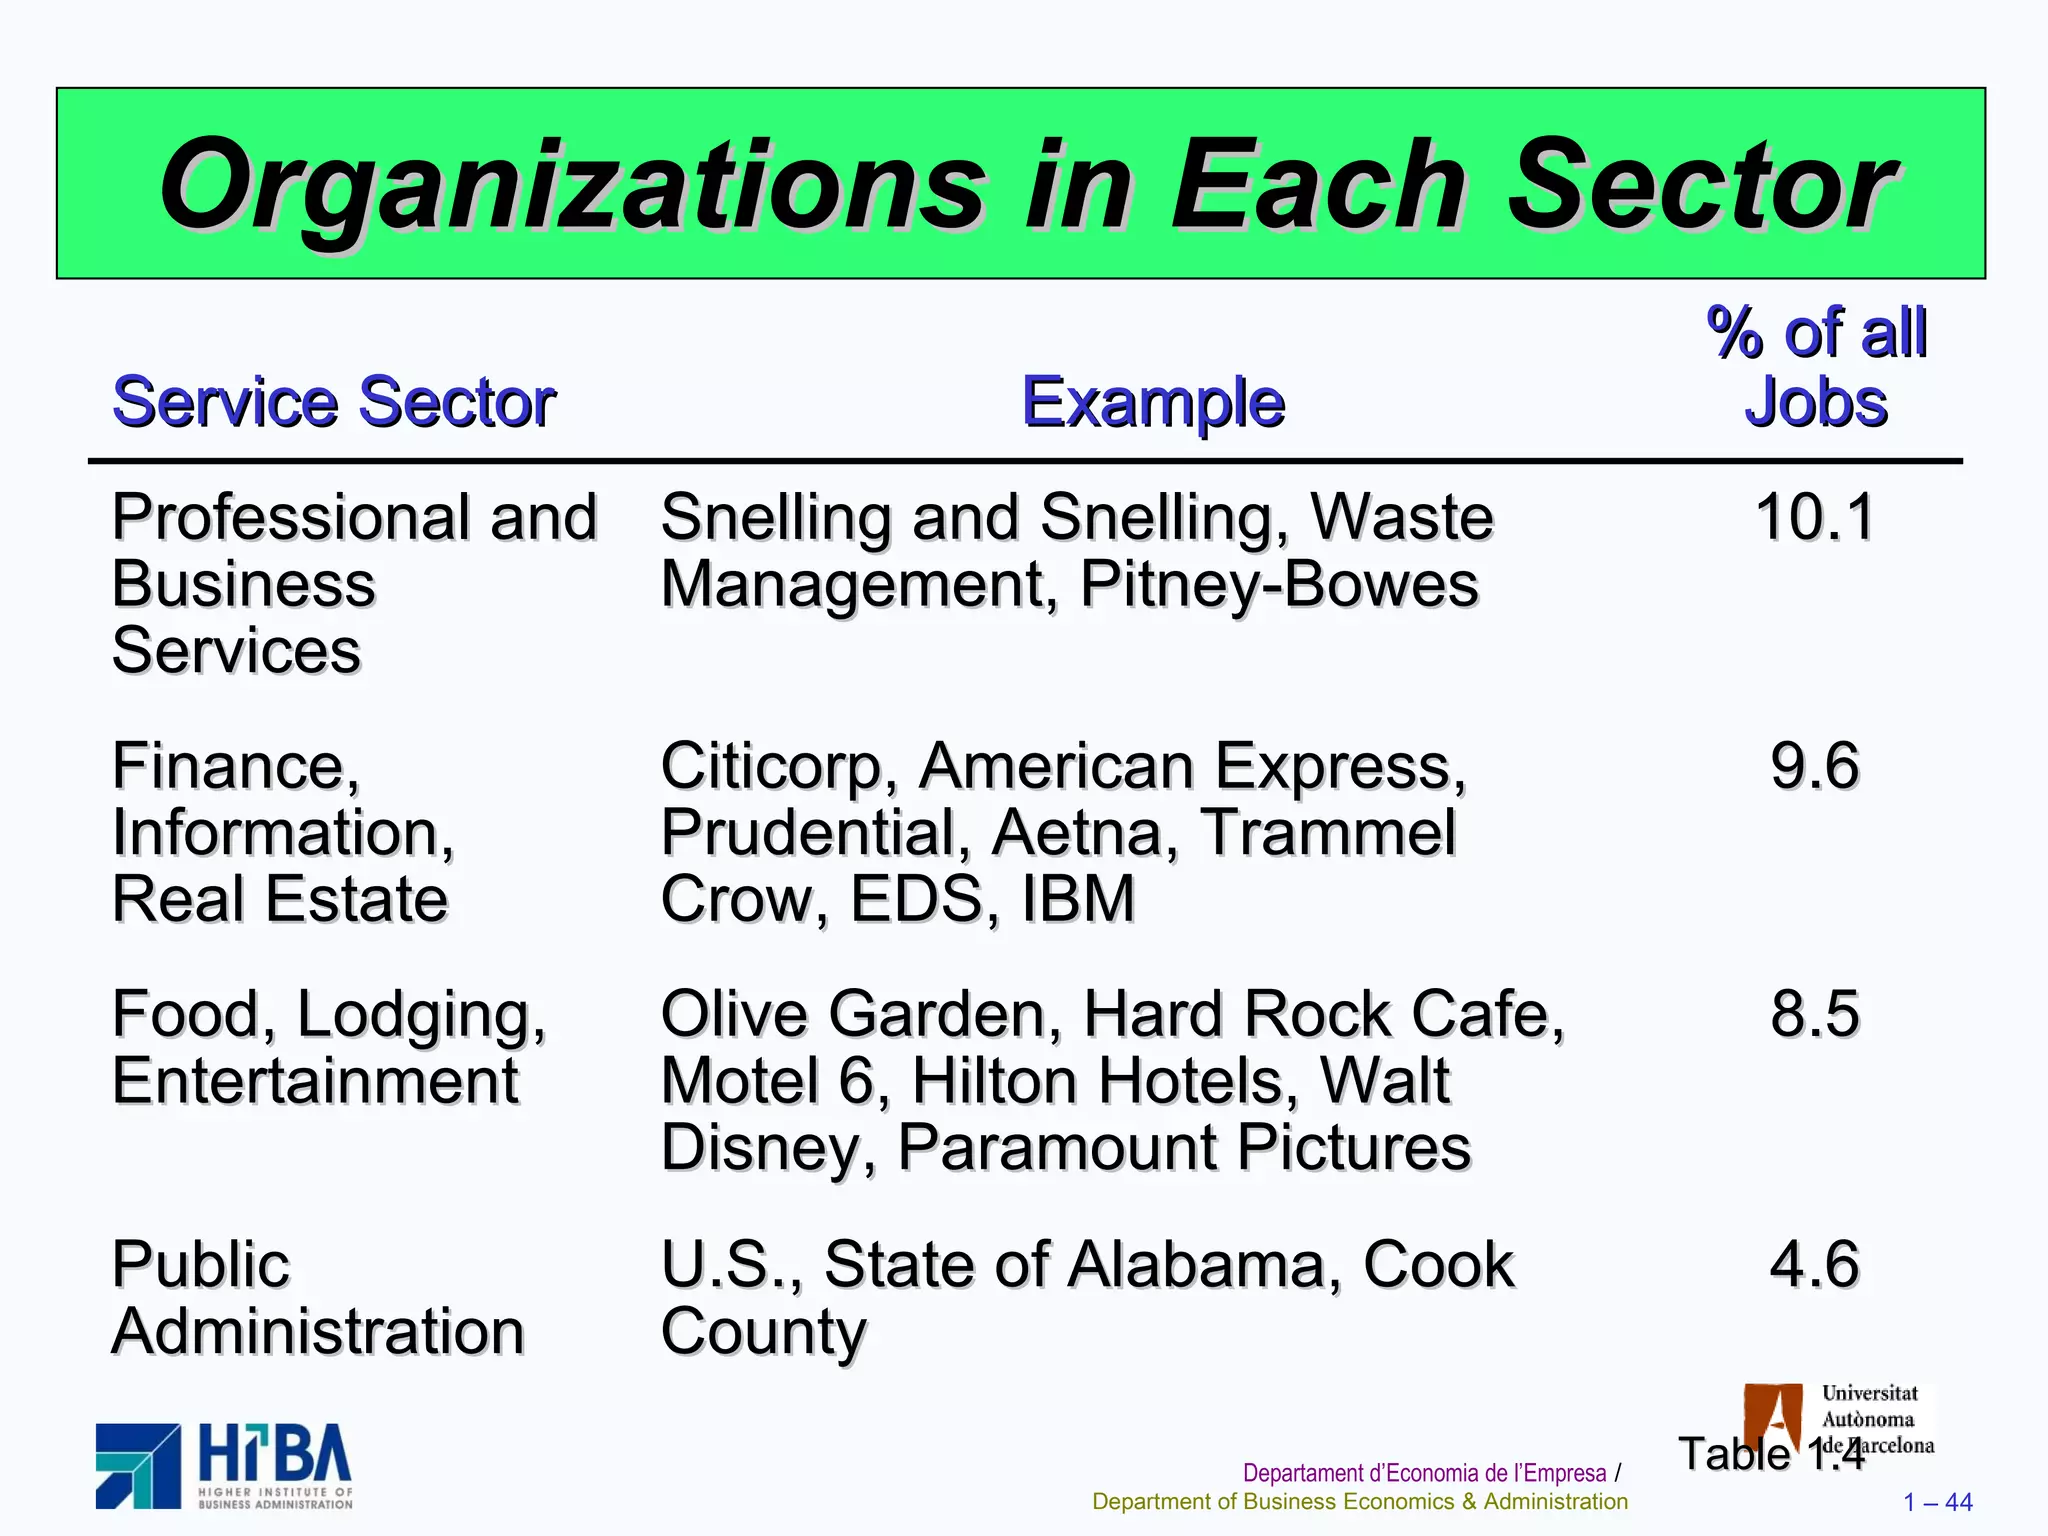
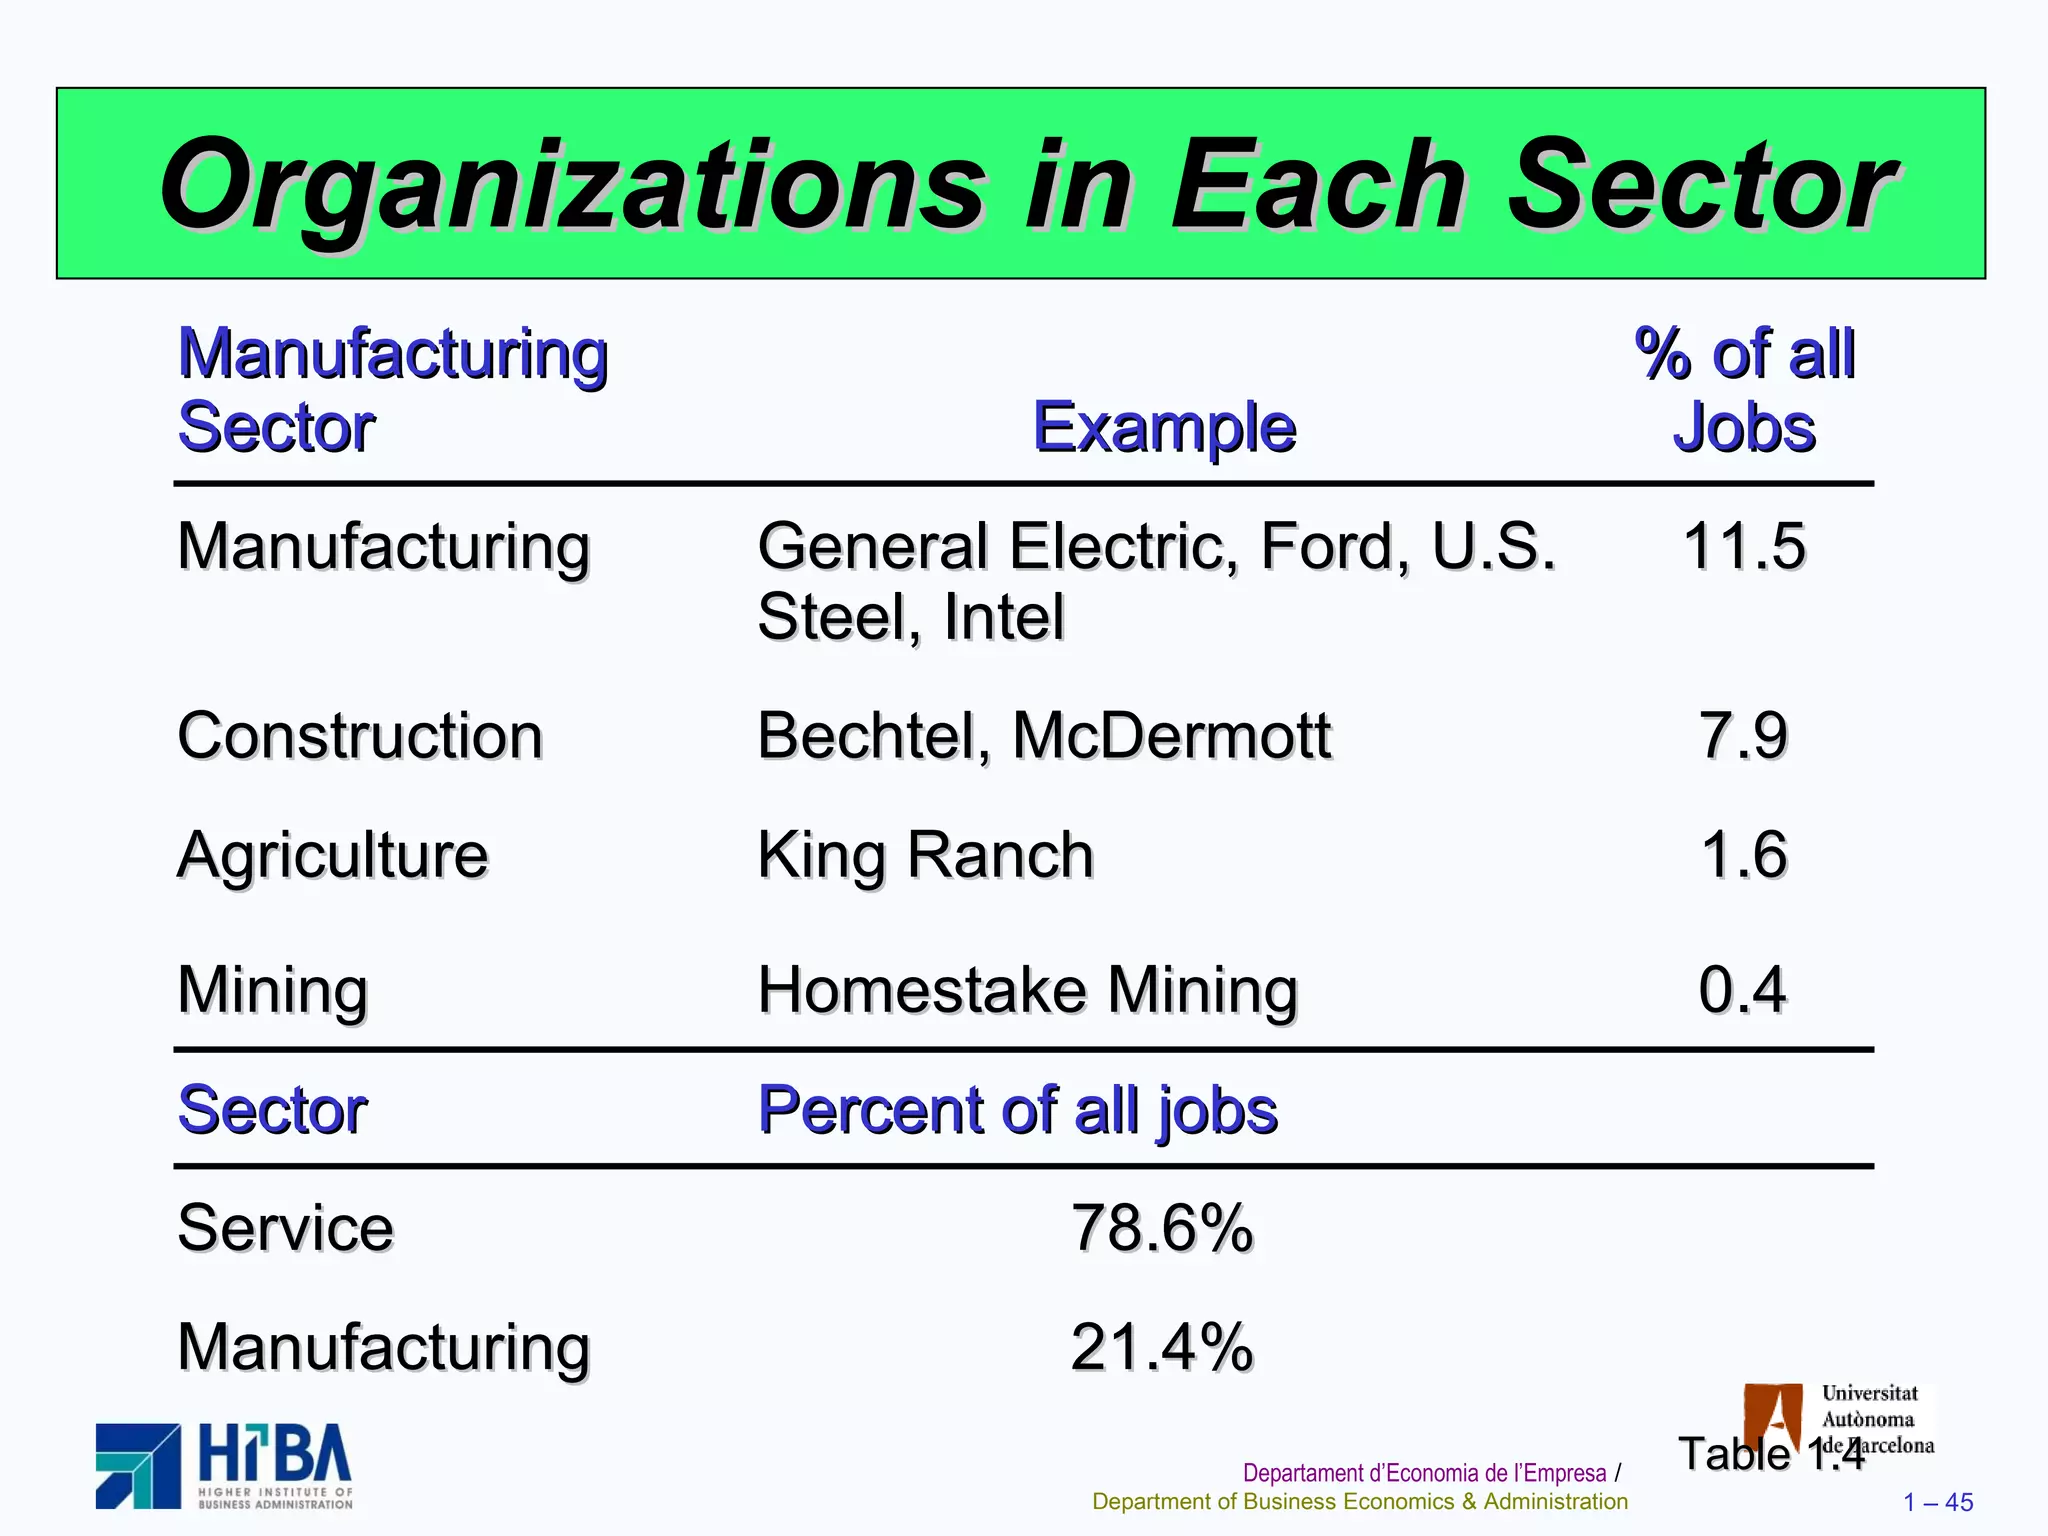
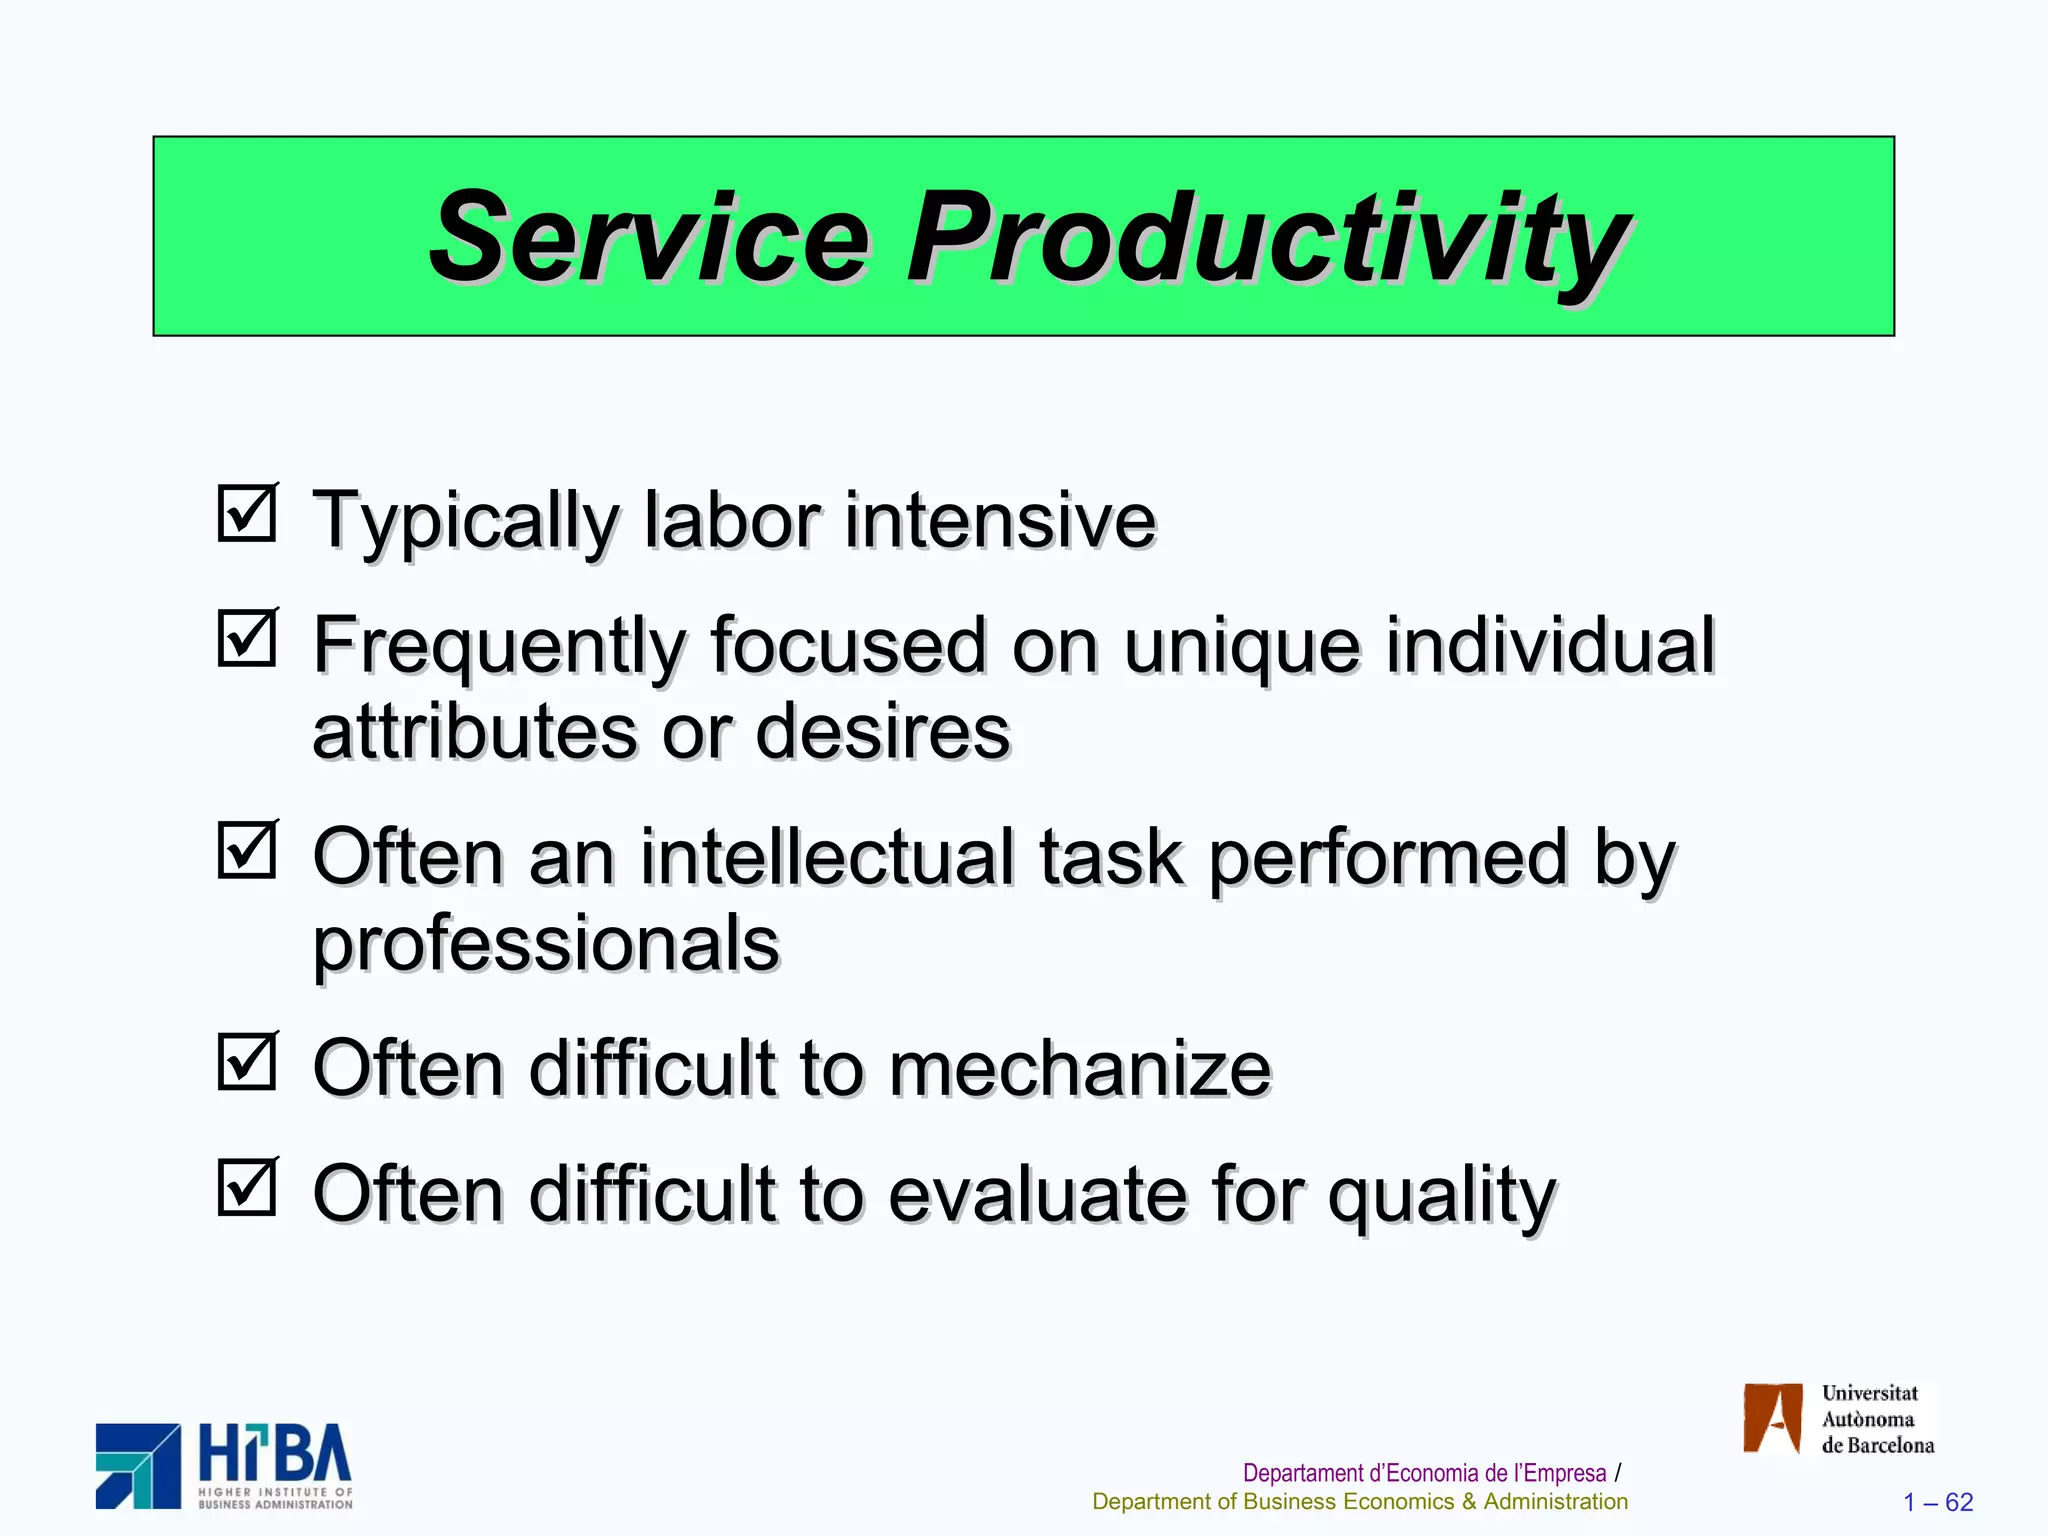
2) It discusses the differences between goods and services, noting services are intangible, produced and consumed simultaneously, and have inconsistent quality definitions.
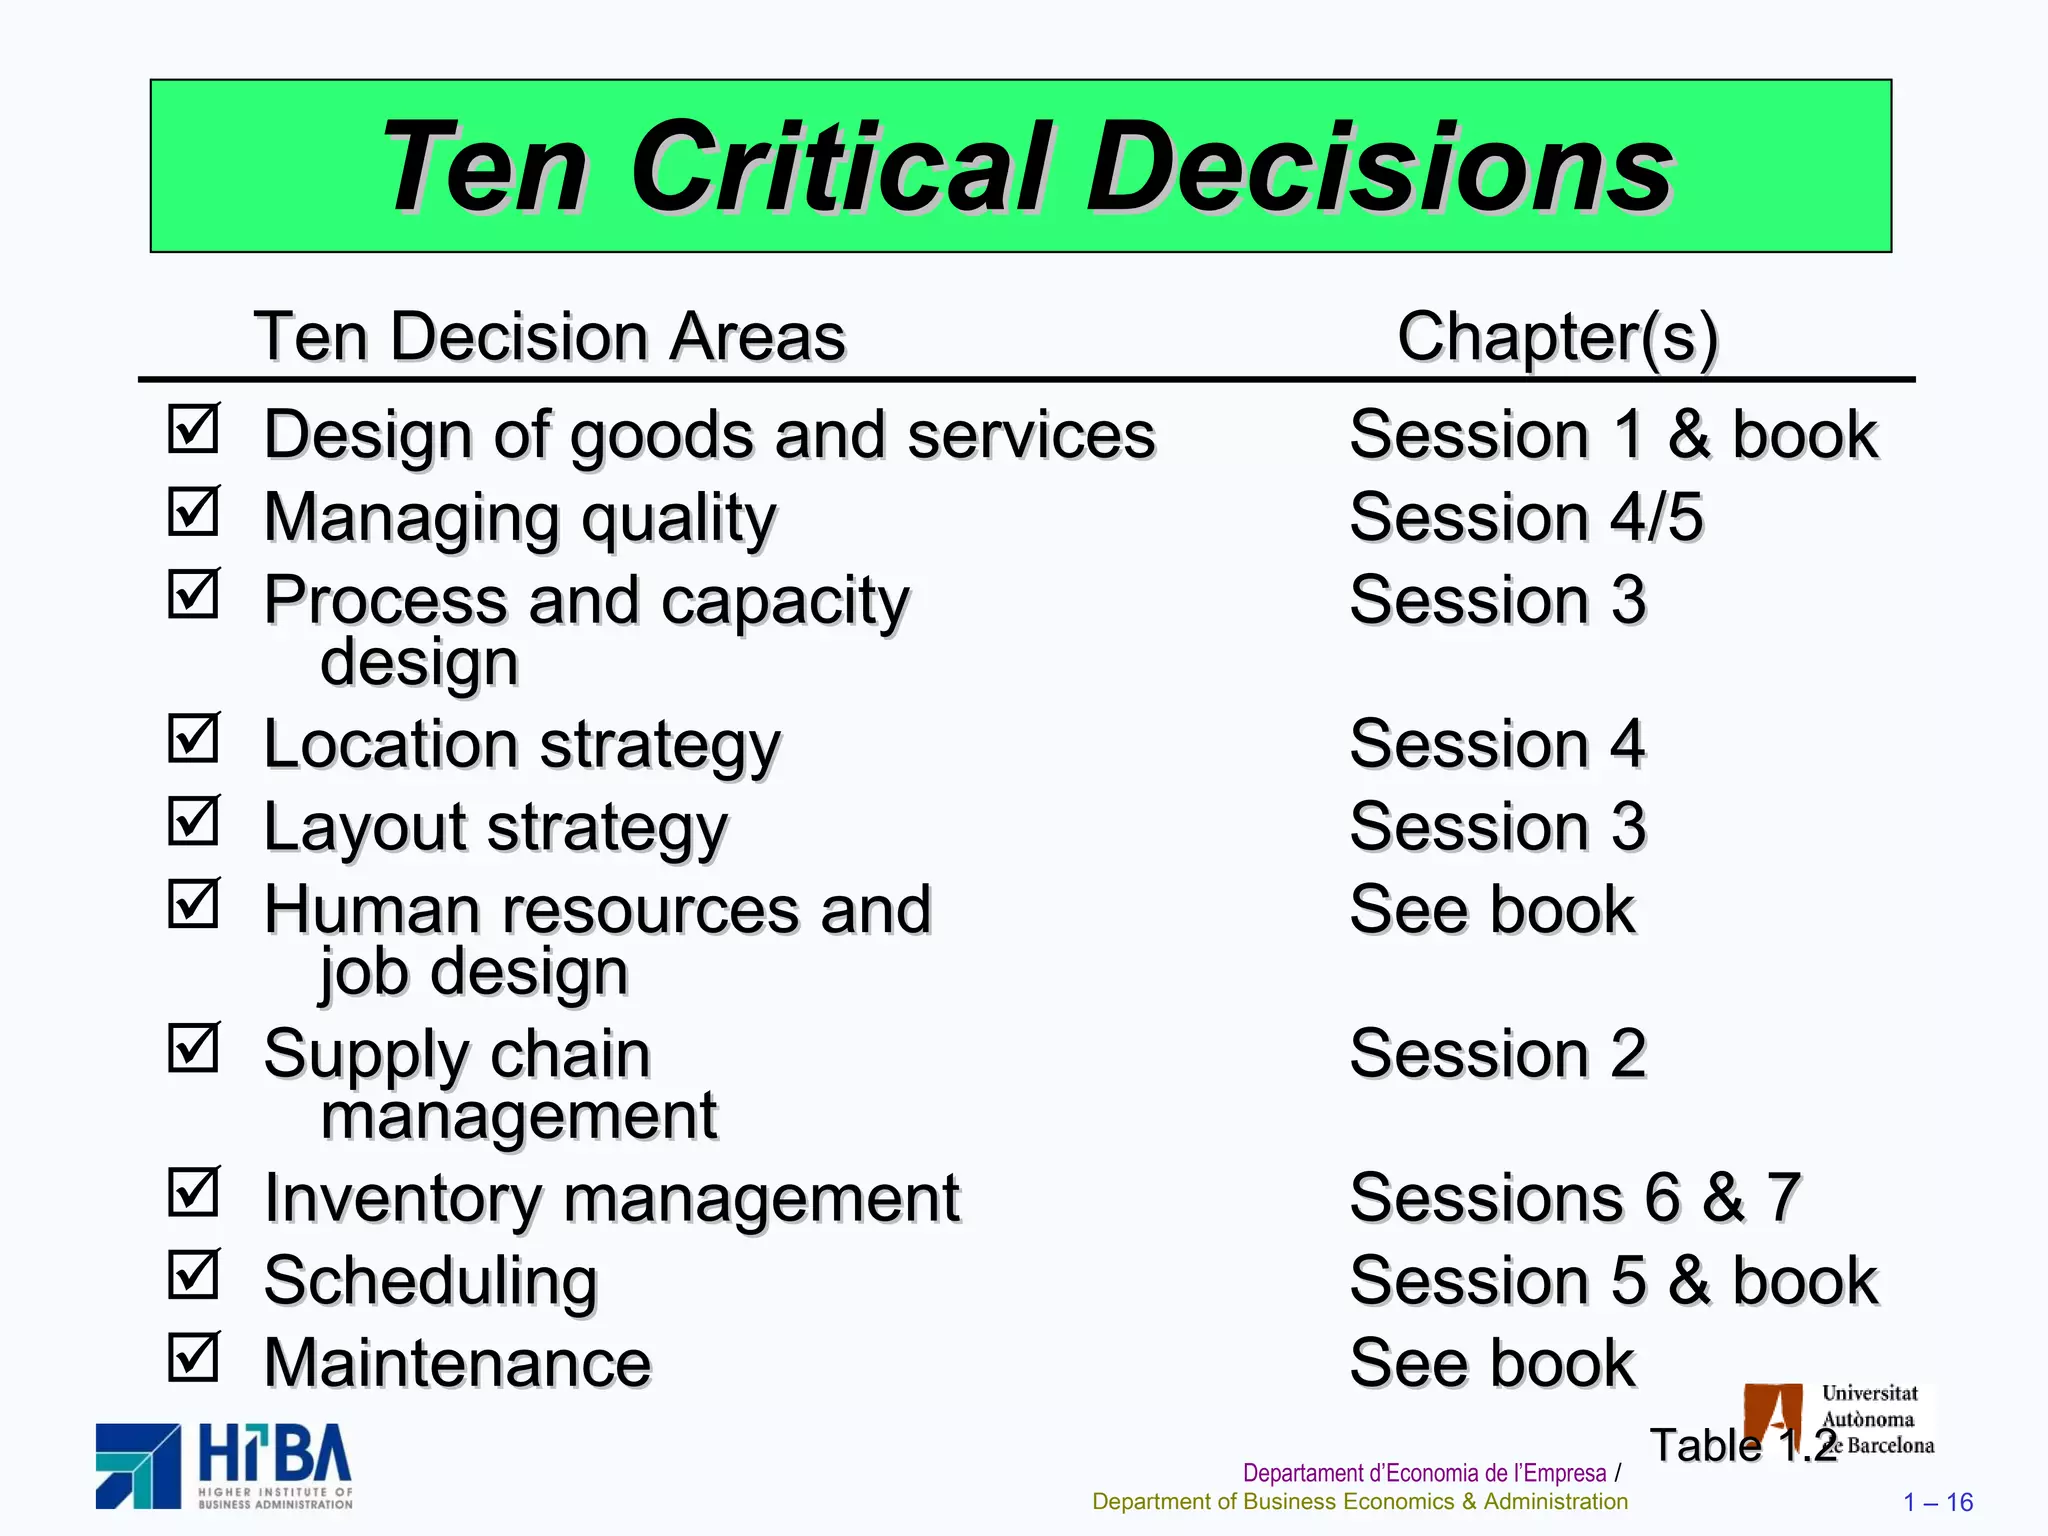
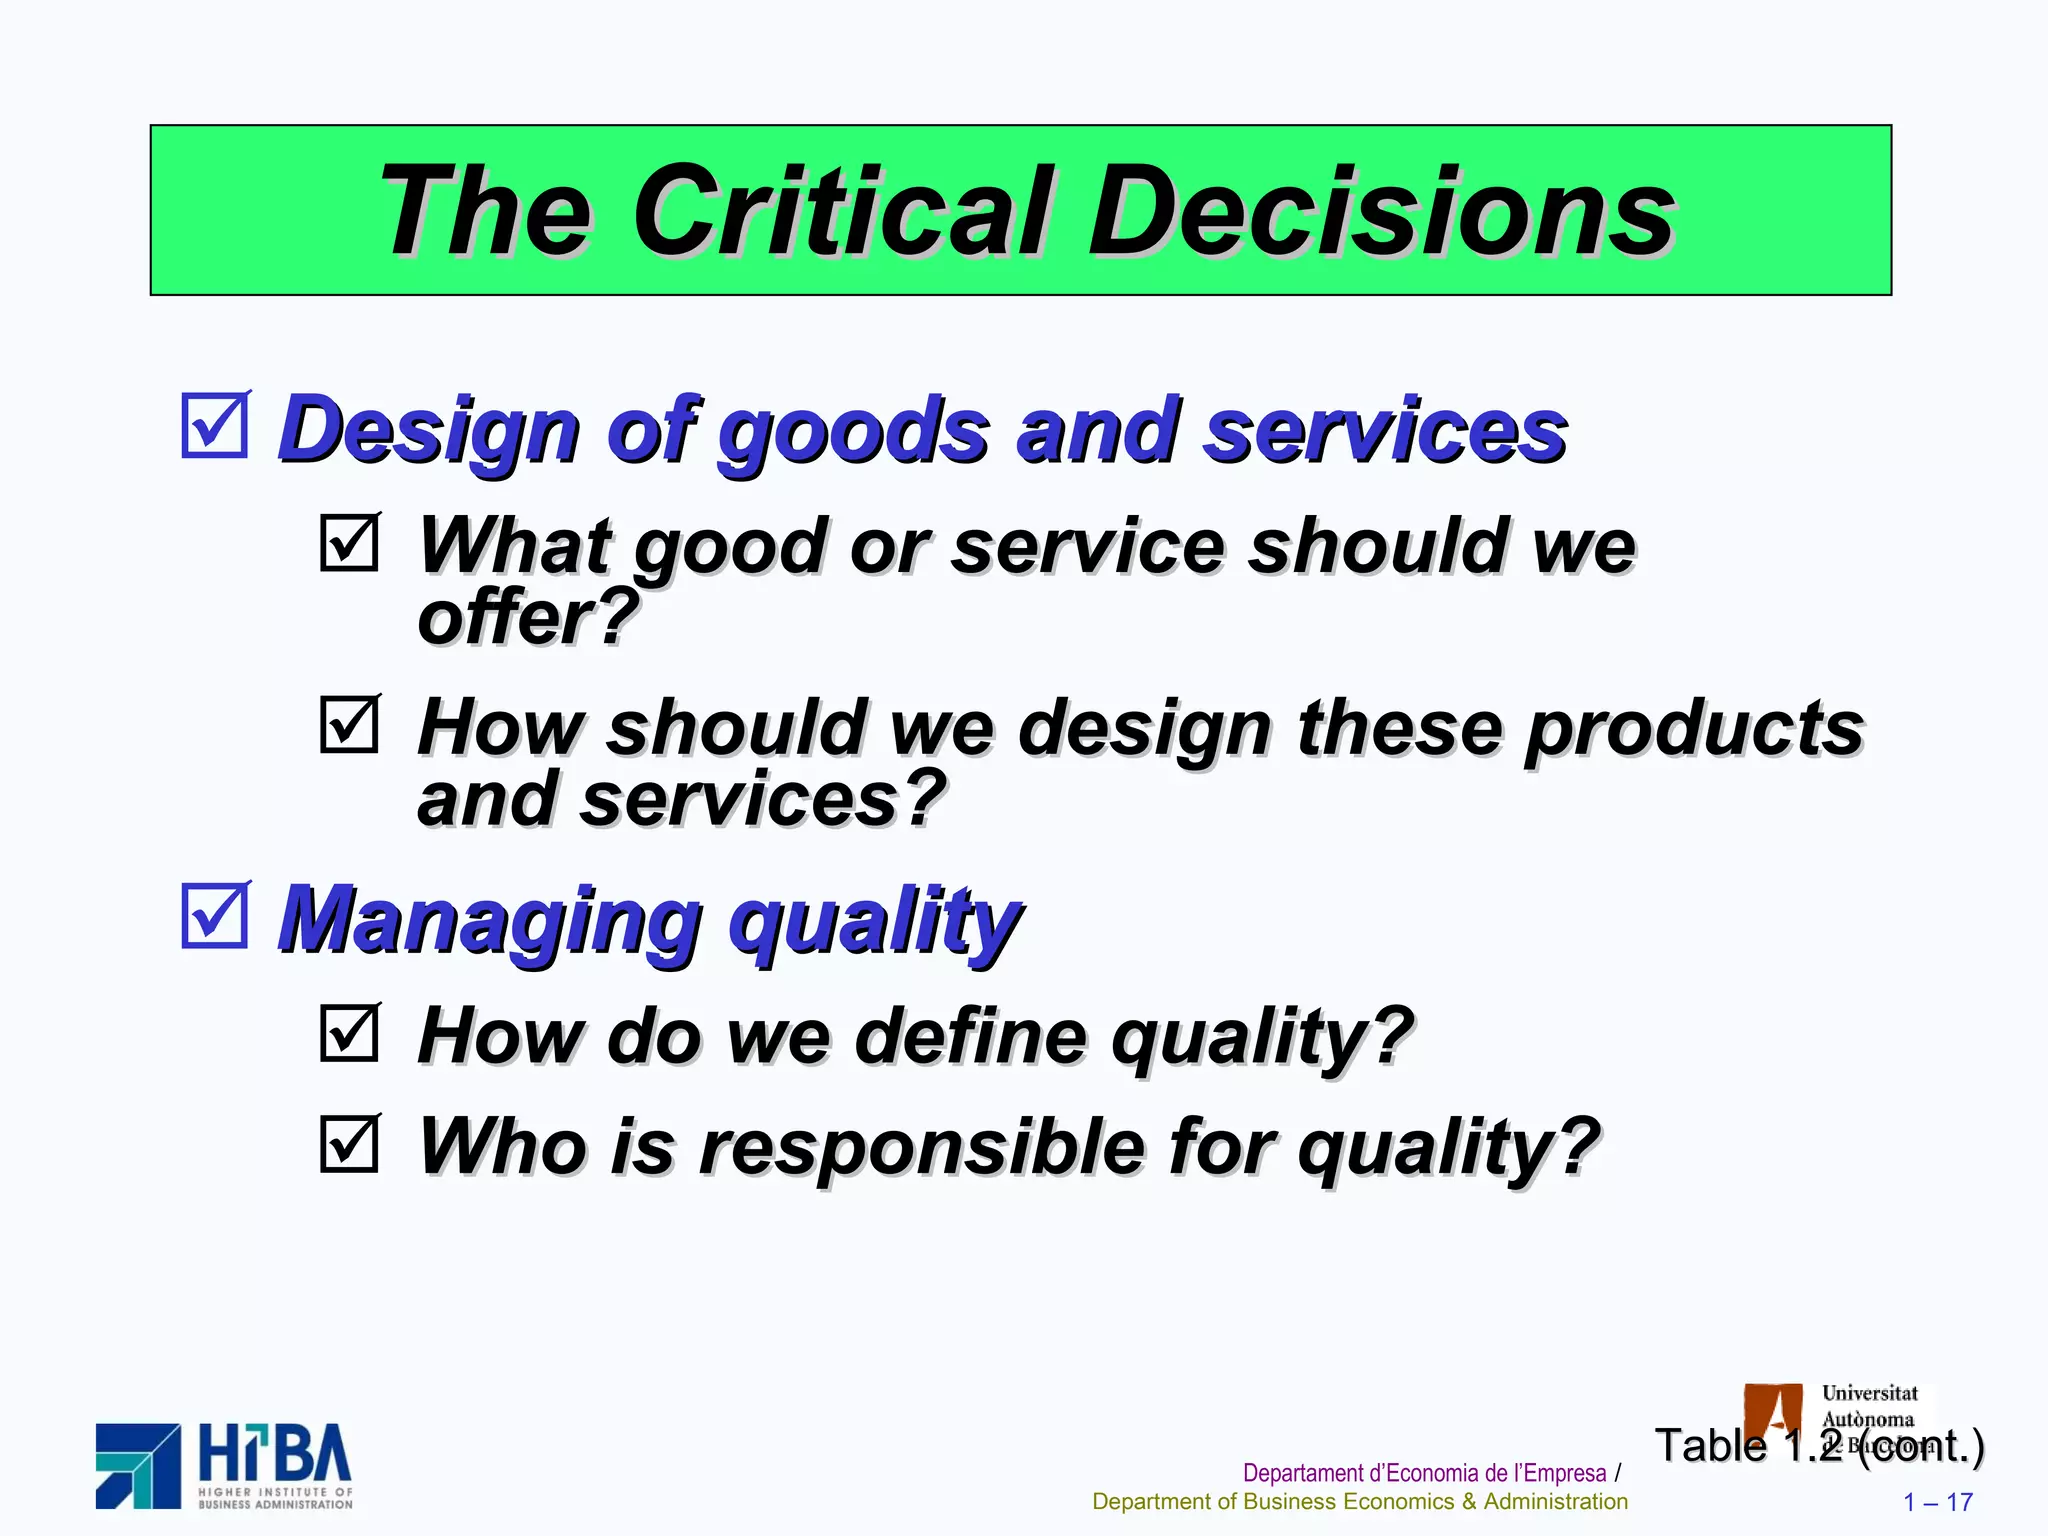
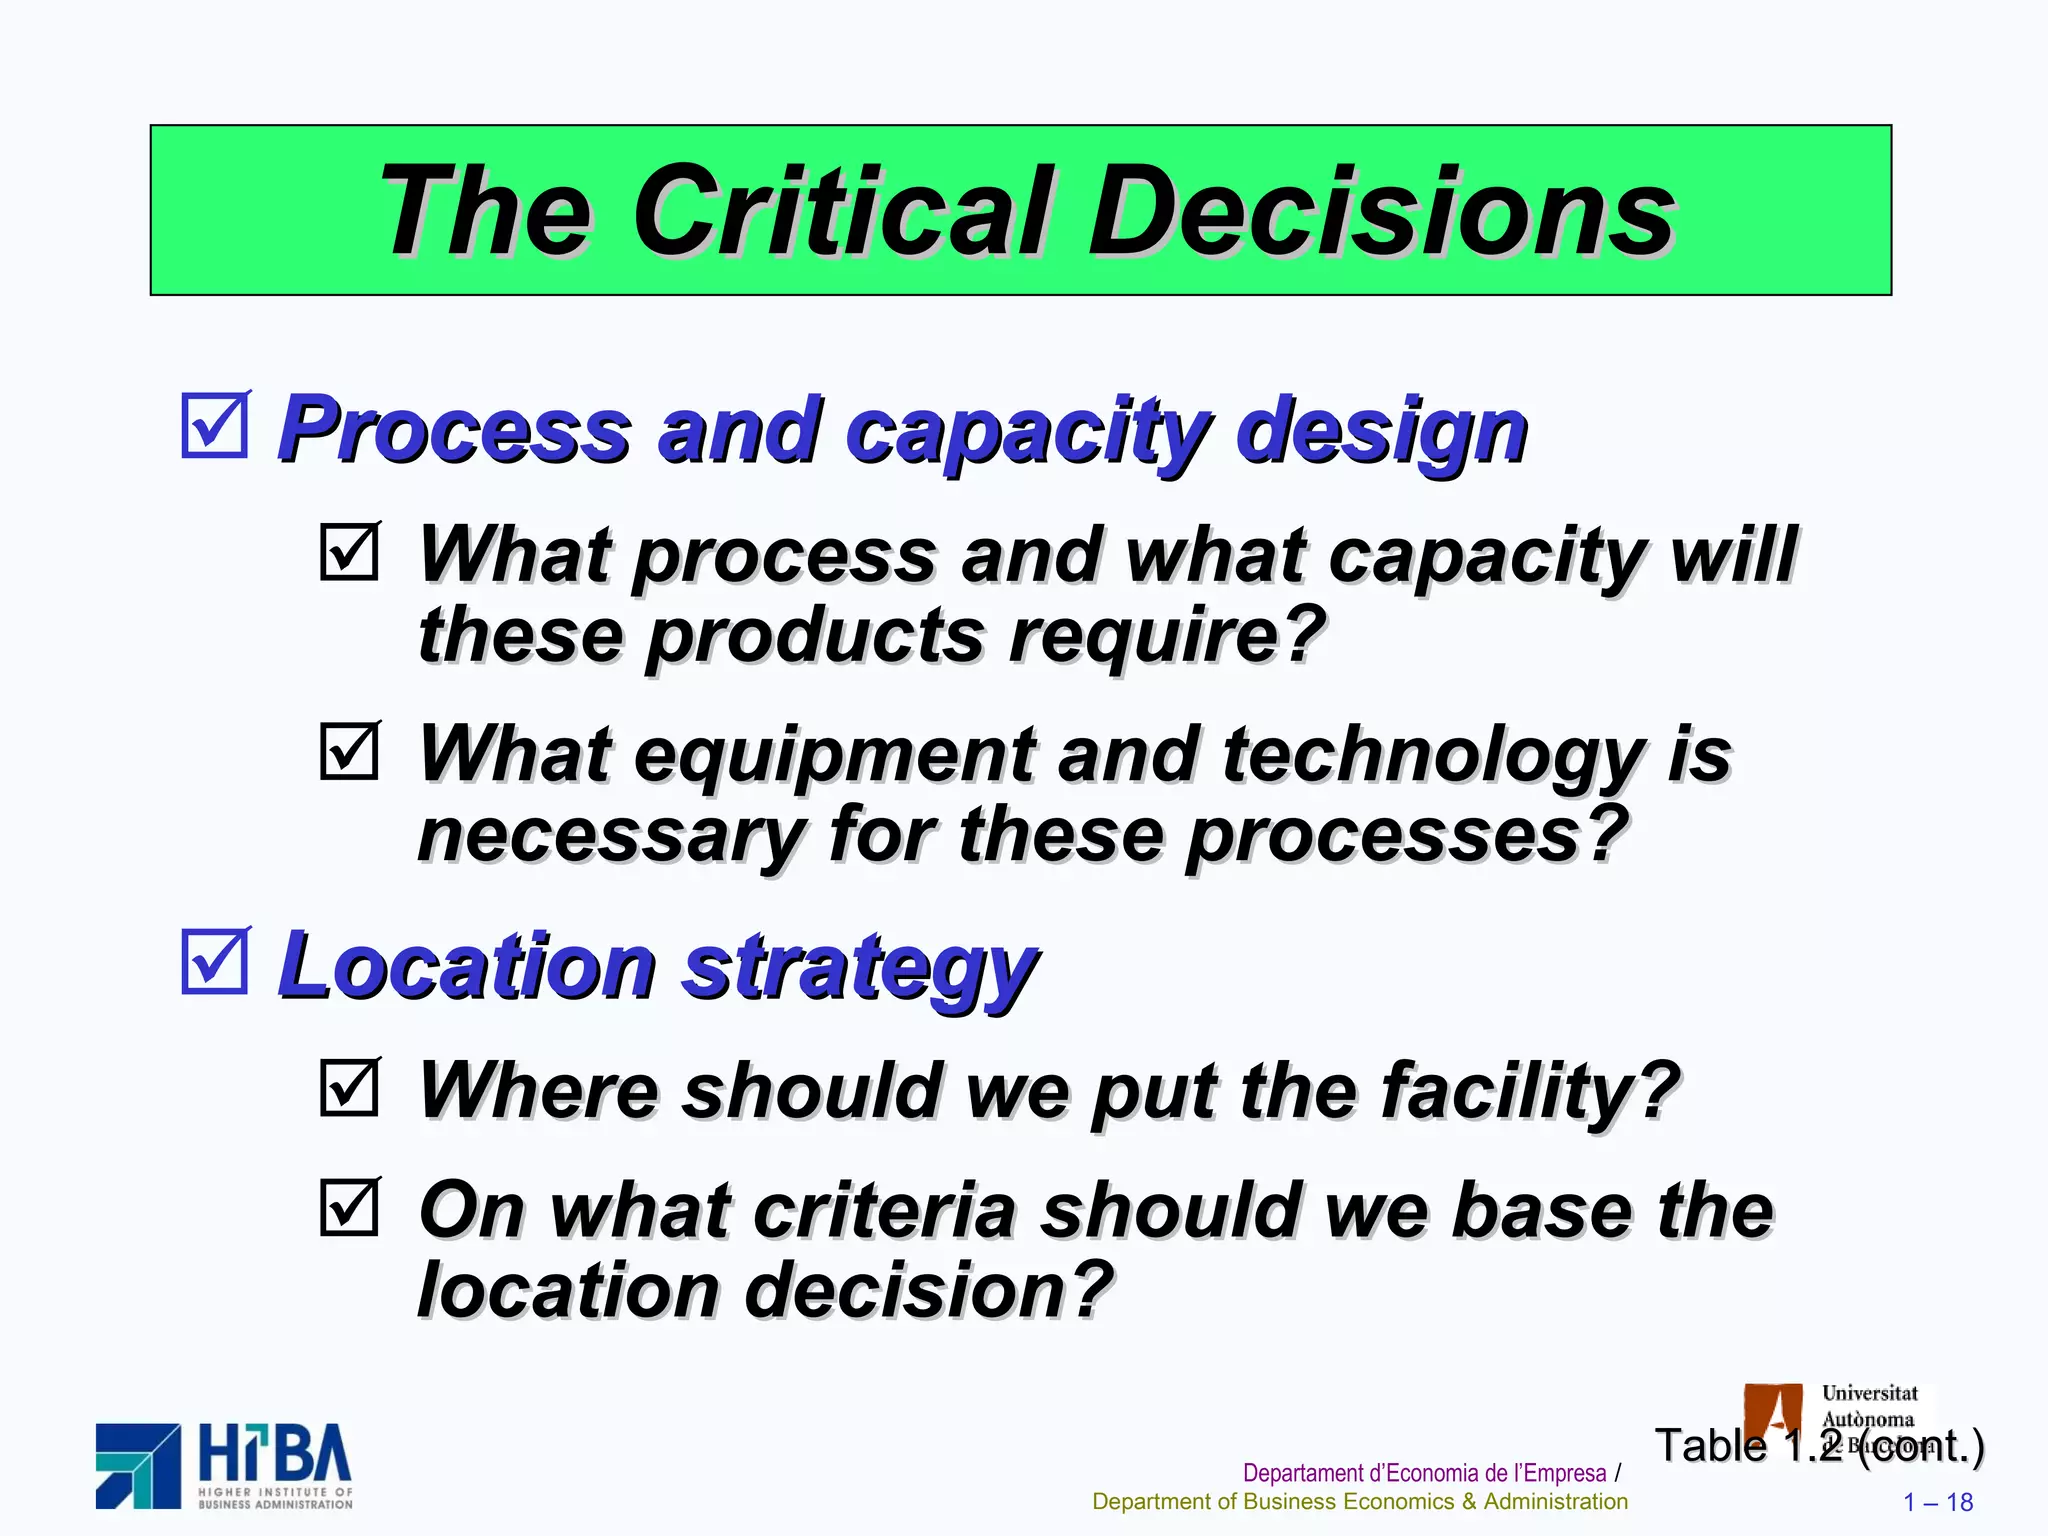
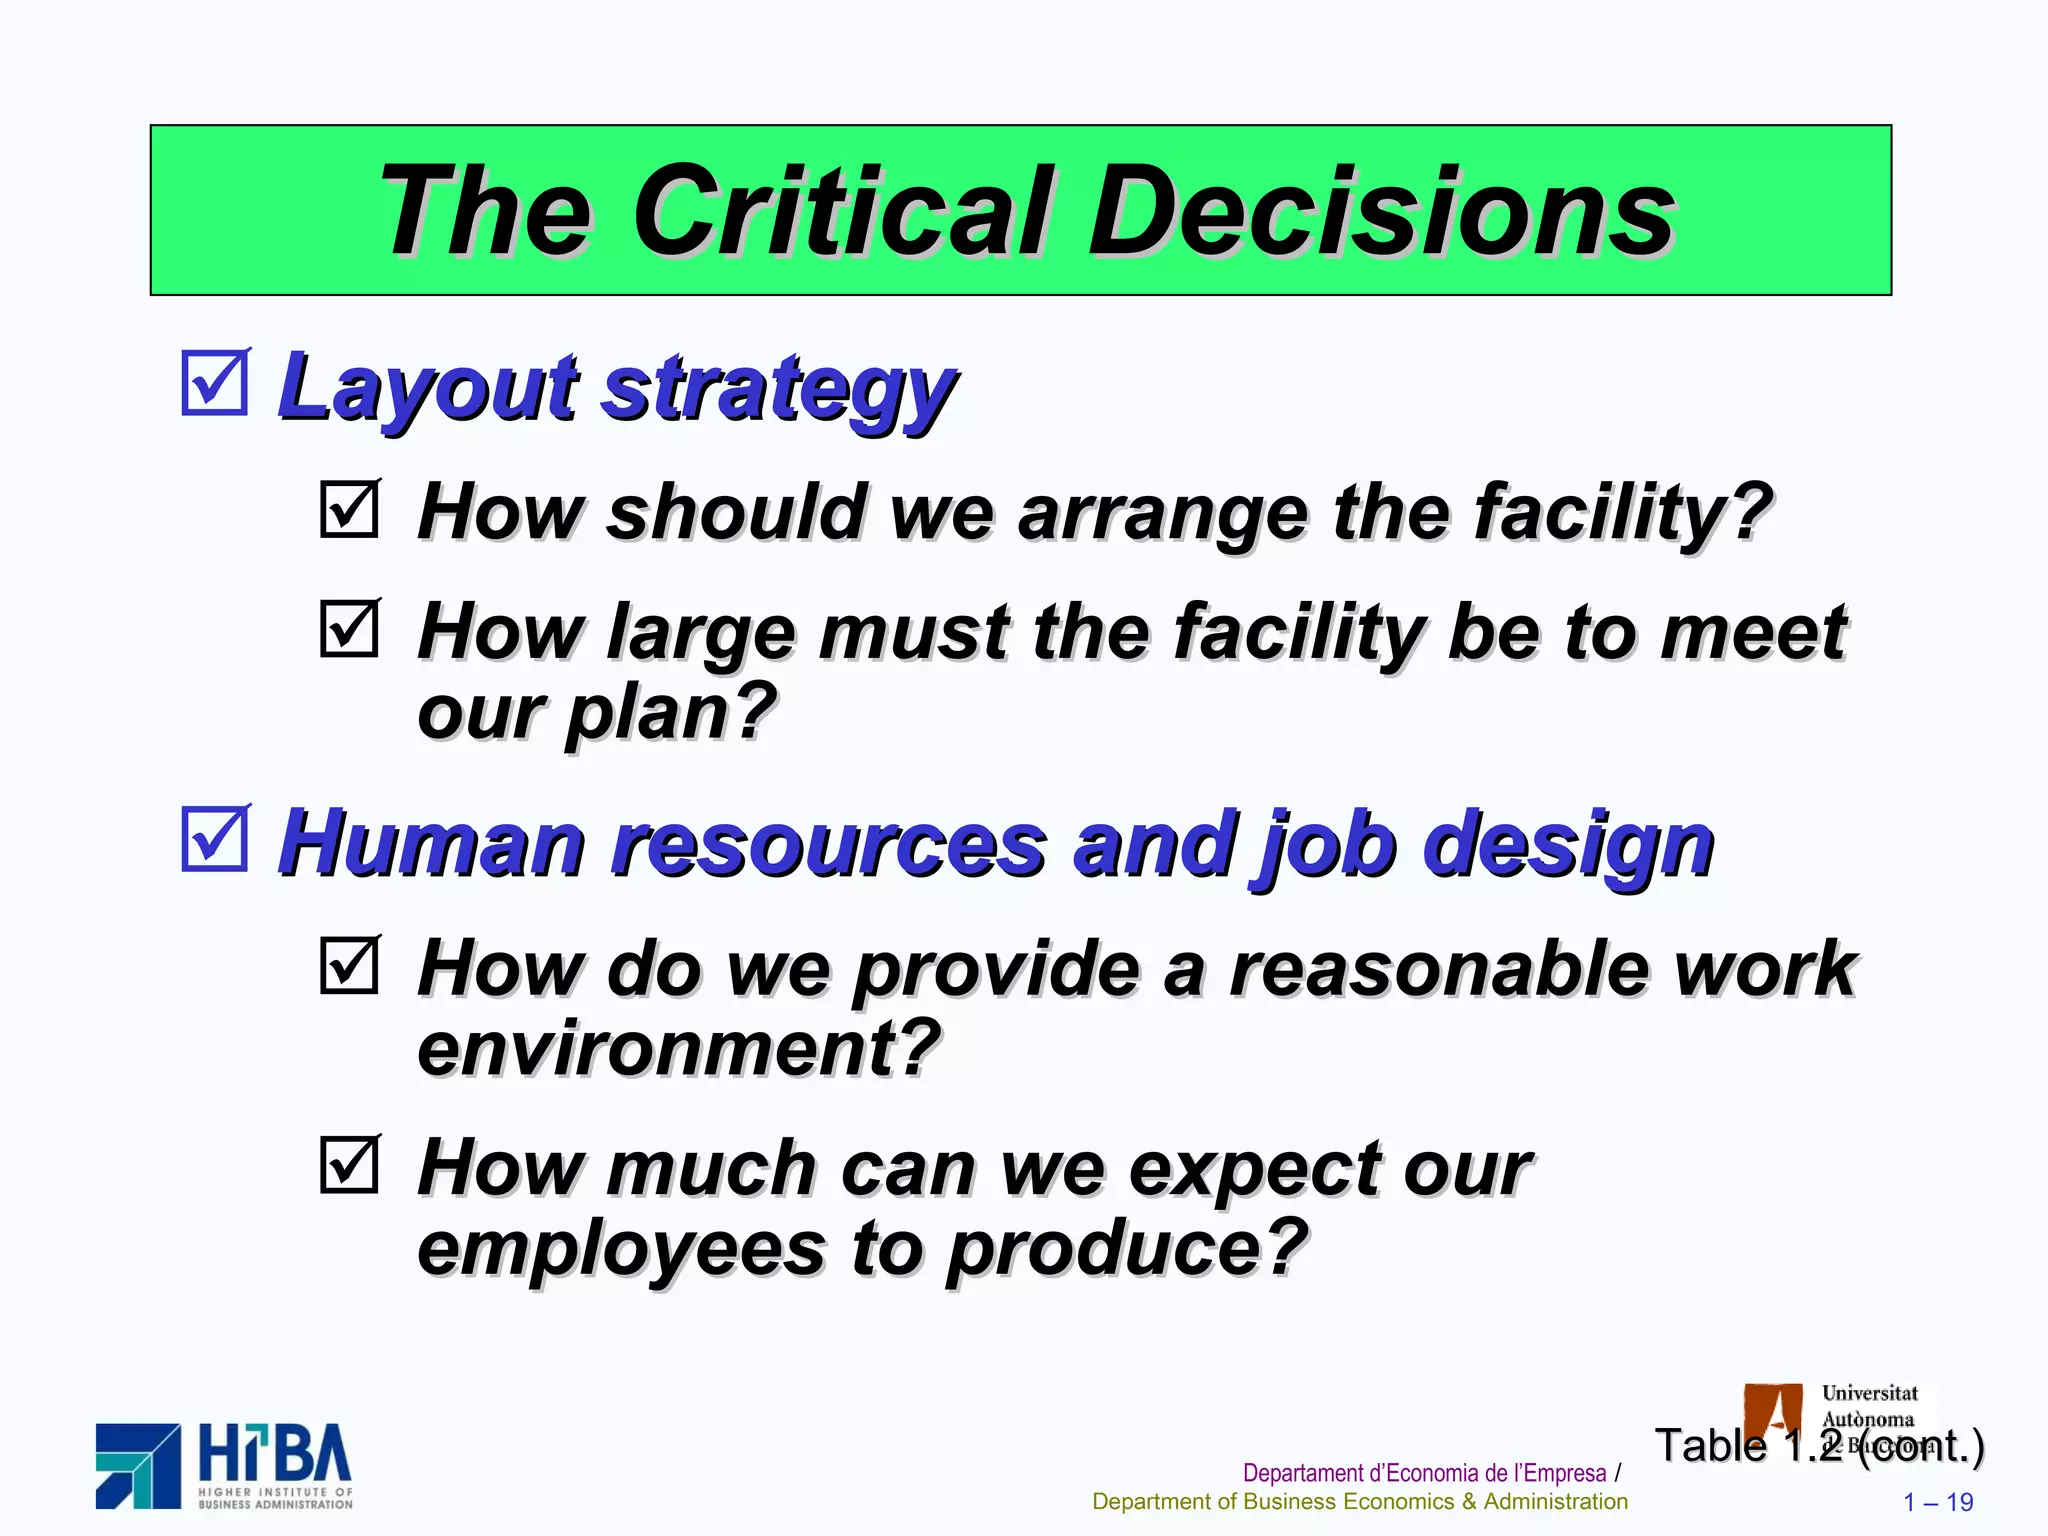
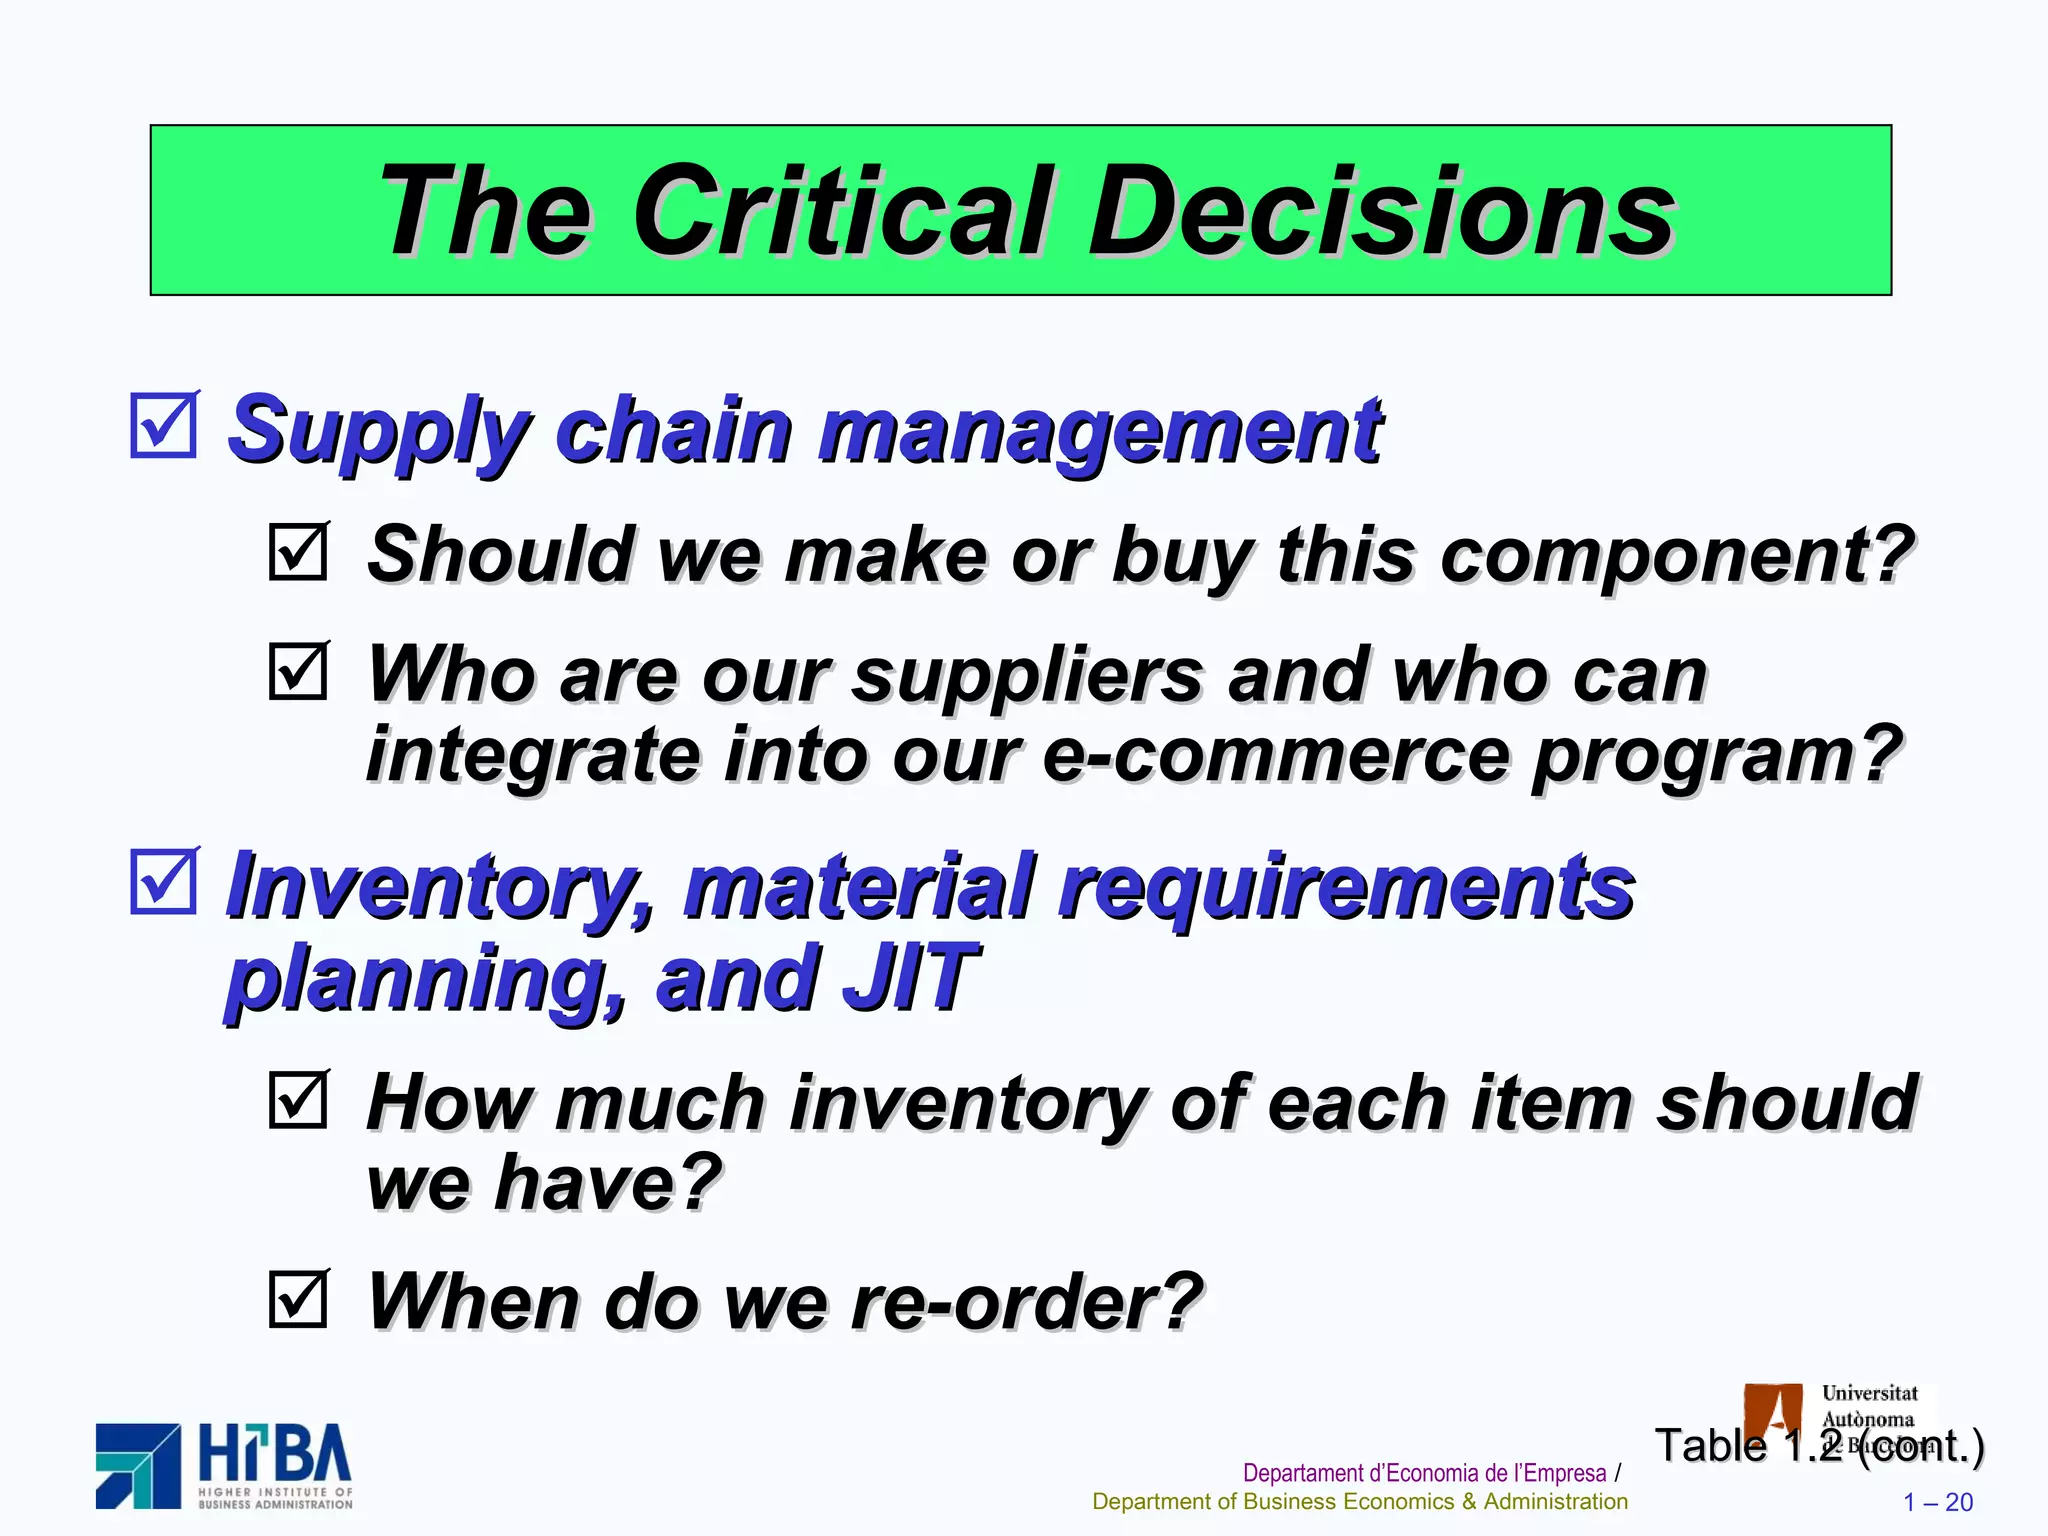
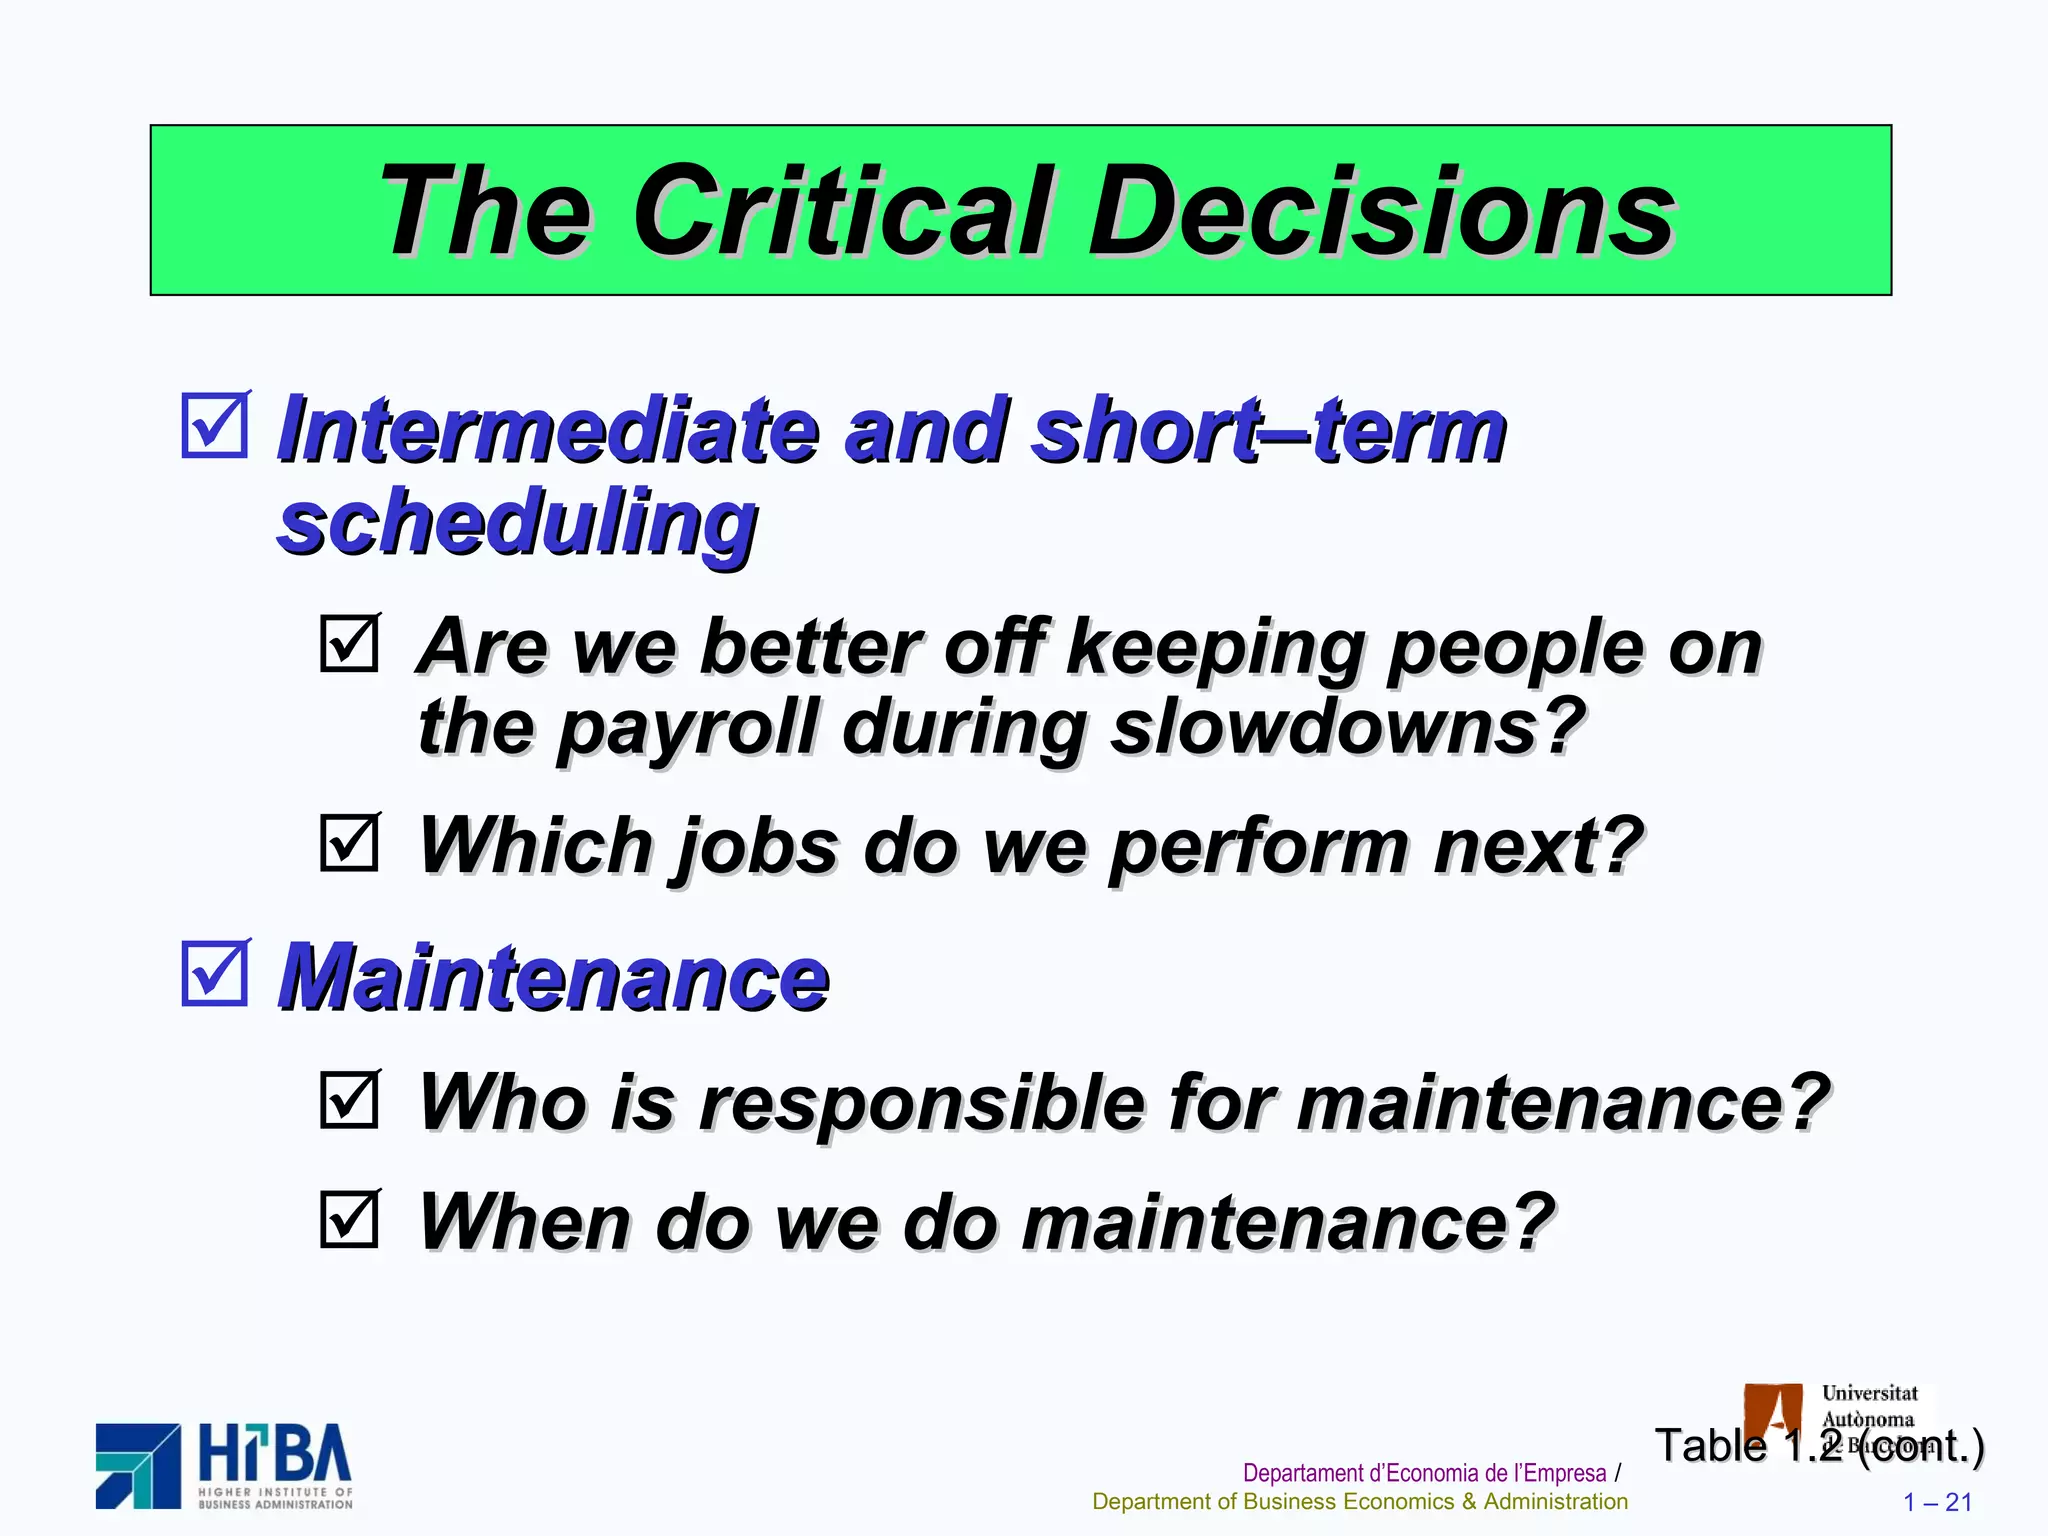
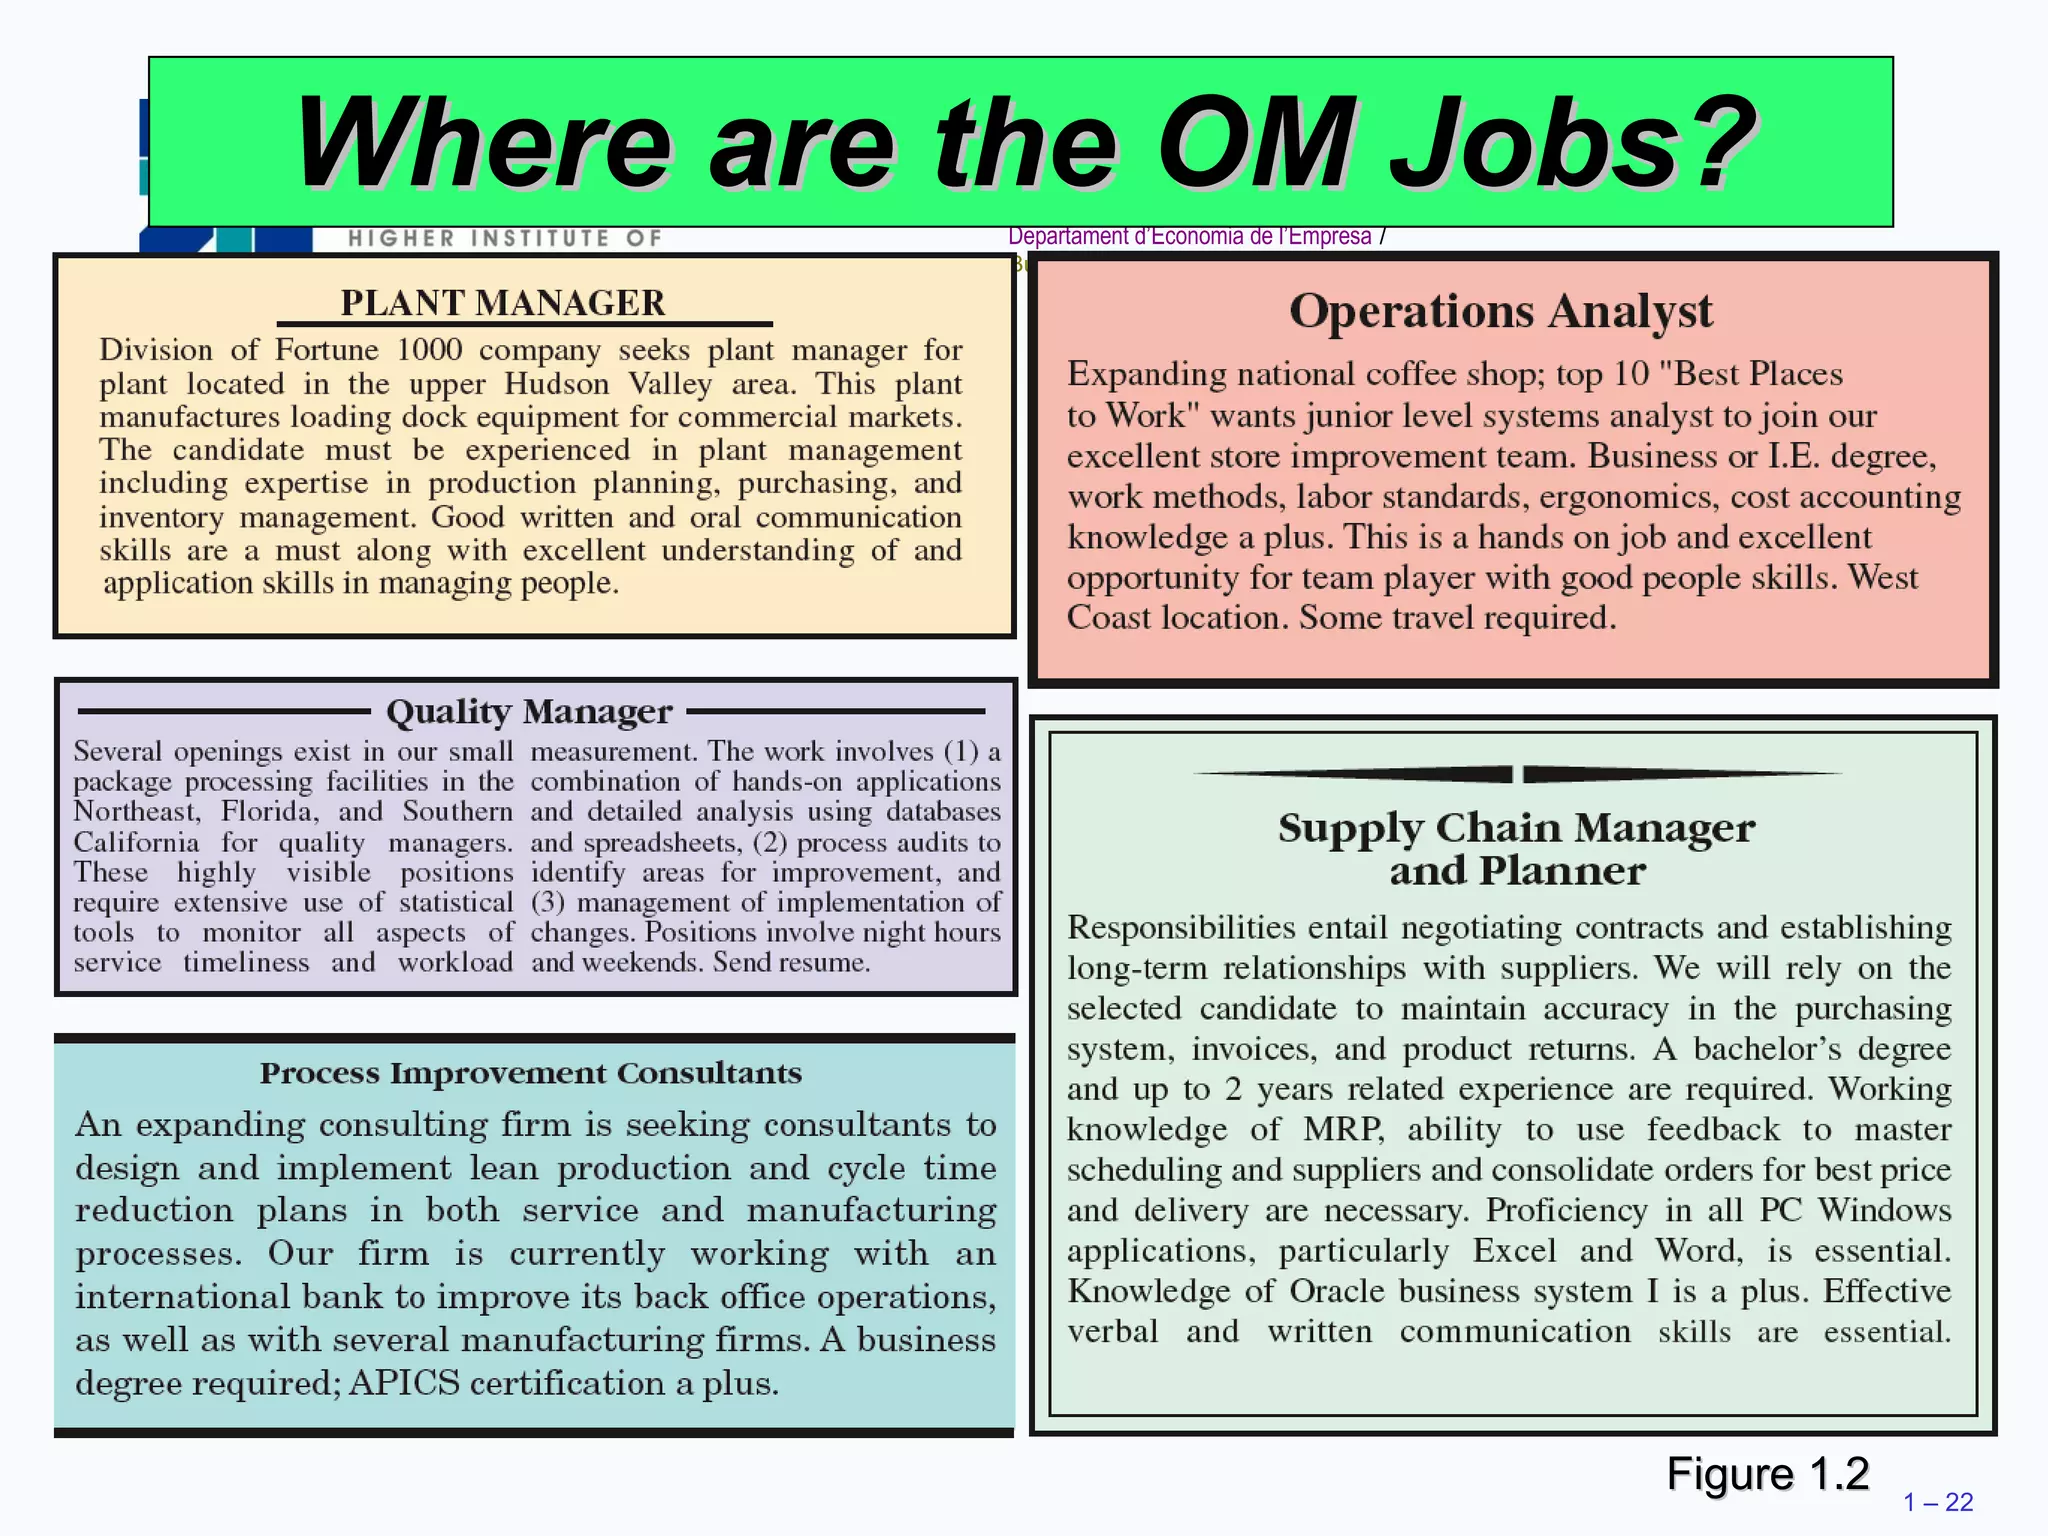
3) It outlines 10 critical decision areas operations managers must address such as design, quality management, and supply chain management.


![Operational Management Chapter - [01].ppt](https://cdn.slidesharecdn.com/ss_thumbnails/op01-240303184106-469fa322-thumbnail.jpg?width=640&height=640&fit=bounds)


