Neuroscience Graduate Program Annual Symposium Jan 20th 2017
1. All scanning was completed on 3.0T Siemens Trio System,
located on the University Park Campus at the University of
Southern California. Each of the two structural scans
(Structural MRI and Diffusion MRI) were repeated twice, with
averaging performed afterwards, as a means of preventing
loss of a complete dataset due to head movement during
image acquisition.
“Identifying advantageous Reading Strategies and
associated Neural Networks in Children with
Dyslexia”
Rita Barakat, Max Orozco, Hadley McGregor, Kristi Clark (PhD)
University of Southern California Neuroscience Graduate Program
Friday January 20th
, 2017Introduction and
Background
Magnetic Resonance
Imaging
Preliminary Results
In the last several years, the early diagnosis of dyslexia,
during the time period before a child begins their formal
literacy training, has posed an incredible challenge for
clinicians around the world. Thus, many children have
gone undiagnosed for extended periods of their reading
education, leading researchers to ask whether the neural
networks of these children can adapt to the literacy training
they were exposed to in development. This potential for
enhanced plasticity in these networks during a child’s
development gestures to a possible role for early
therapeutic intervention as a means of preventing further
difficulty in acquiring literacy. In addition, having a greater
understanding of the structural and functional connectivity
of these networks can allow for the tailoring of reading
education towards strategies that employ networks which
exhibit greater relative strength and efficiency and are,
theoretically, associated with more positive reading
performance in children with dyslexia.
Participants
As of December 2016, 22 children with dyslexia (ages 7-
12, 12 female, 10 male) and 25 healthy age-matched and
reading-level-matched controls (ages 7-12, 15 female, 10
male) were recruited from the local community to
participate in four hours of neuropsychological testing and
just over an hour of scanning. Dyslexia participants were
those diagnosed with selected reading/ language-related
disorders and otherwise normal IQ. Standard exclusion
criteria were as follows: mental retardation and diagnoses
of other impairments, including ADHD, neurological
impairment, and any visual or hearing impairments
(including color blindness). To mitigate any potential
confounds of a second language, only children who were
monolingual, native English speakers were included.
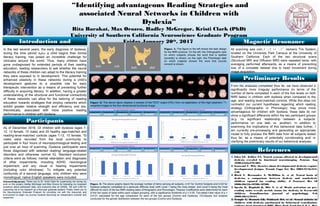
Figure 3: The above graphs depict the average number of items (among all subjects, n=31 for Control Subjects and n=22 for
Dyslexia subjects) completed at a particular difficulty level (with Level 1 being the most simple, and Level 5 being the most
difficult) for each of the two fMRI reading tasks (Orthographic and Phonologic). Pearson Coefficients were determined for each
of the two types of tasks within each subject grouping, with a significance threshold of p < 0.05. Two-tailed t-test value of p =
0.0121 calculated for the age comparison for each of the two groups (Control and Dyslexia). Chi-Square 2x2 analysis
conducted for the gender distribution between the two groups (Control and Dyslexia).
References
Acknowledgements: Thank you to Dr. Kristi Clark for supervising me during my
work on this project, Hadley McGregor and Max Orozco for tolerating my incessant
questions about participant data, and everyone else at CANDL, INI and LONI for
supporting me in my research as a first-year graduate student. Finally, thank you to
the Neuroscience Graduate Program for providing me with the resources and
environment to begin my journey towards becoming an independent scientist and
researcher.
Figure 2: The above figure displays a sample of the FEAT output (FSL) from co-registration of the high-resolution T1-
weighted images to the four-dimensional functional image.
Figure 1: The figure to the left shows the task design
for the fMRI protocol. On the left, the Orthographic task
(in which subjects choose the word that is spelled
correctly) is shown; on the right, the Phonologic task
(in which subjects choose the word that sounds
correct) is shown.
1. Eden GF, Zeffiro TA. Neural systems affected in developmental
dyslexia revealed by functional neuroimaging. Neuron. Aug
1998;21(2):279-282.
2. Goswami U. Why theories about developmental dyslexia require
developmental designs. Trends Cogn Sci. Dec 2003;7(12):534-
540.
3. Hoeft F, Hernandez A, McMillon G, et al. Neural basis of
dyslexia: a comparison between dyslexic and nondyslexic
children equated for reading ability. J Neurosci. Oct 18
2006;26(42):10700-10708.
4. Specht K, Hugdahl K, Ofte S, et al. Brain activation on pre-
reading tasks reveals at-risk status for dyslexia in 6-year-old
children. Scandinavian journal of psychology. Feb
2009;50(1):79-91.
5. Temple E, Deutsch GK, Poldrack RA, et al. Neural deficits in
children with dyslexia ameliorated by behavioral remediation:
From the analyses completed thus far, we have observed a
significantly more irregular performance (in terms of the
number of items completed in each of the five levels on both
fMRI tasks) in children with dyslexia when compared to the
age- and reading level-matched controls. While this does not
contradict our current hypotheses regarding which reading
strategy (Orthographic or Phonologic) may prove more
advantageous for children with dyslexia, these data do not
show a significant difference within the two participant groups
(e.g. no significant relationship between a subjects’
performance on one task vs. another). In addition to
examining the implications of this behavioral data further, I
am currently pre-processing and generating an appropriate
model to fully process the fMRI data from all subjects tested
thus far, as a means of potentially corroborating and/ or
clarifying the preliminary results of our behavioral analyses.