SlideShare a Scribd company logo
1 of 12
Russia Risk Conference
PRMIA and Cbonds
Moscow, 21 November 2012


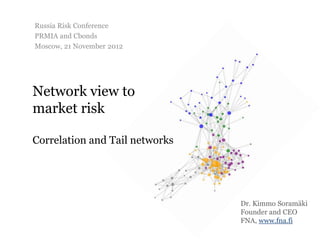
Network view to
market risk

Correlation and Tail networks


                                Dr. Kimmo Soramäki
                                Founder and CEO
                                FNA, www.fna.fi
Network Theory and Financial Cartography

Main premise of network theory:           Maps reduce data and encode
Structure of links between nodes          relevant data to graphical elements
matters                                   within a representation system


                                   +


          Network Theory provides the representation system for
          financial maps like Cartography does to geographic maps
                                                                                2
Outline
Maps enable visual insights from          The maps: Heat Maps, Trees,
complex financial data                    Networks and Sammon’s
                                          Projections
    – Reduce complexity
    – Identify price driving themes and
      market dynamics
    – Spot anomalies
    – Build intuition
    – Aid communication of results


These methods are showcased for
visualizing correlations among a wide
range of assets around the collapse of
Lehman Brothers on 15 September
2008
                                                                        3
i) Heat Maps
                 2004-2007
Corporate
Bonds
                 151 assets in 5
                 asset classes:
CDS on           equities, gov.
Government
Debt
                 bonds, corp.
                 bonds, cds and
                 foreign
FX Rates         exchange


Government
Bond Yields
                Correlation

                        +1
Stock
Exchange                0
Indices
                        -1
                              4
Collapse of Lehman, t=month

2004-2007           t-2                   t-1


   t+1             t+2                    t+3
ii) Asset Trees
Originally proposed by Rosario Mantegna in 1999

Used currently by some major financial institutions
for market analysis and portfolio optimization and
visualization

Methodology in a nutshell                                     MST


    1.   Calculate (daily) asset returns
    2.   Calculate pairwise Pearson correlations of returns
    3.   Convert correlations to distances
    4.   Extract Minimum Spanning Tree (MST)

    5.   Visualize
                                                                    6
Demo


Click here for interactive visualization   7
Correlation filtering
Balance between too much and too     New graph, information-theory,
little information (Tumminello,      economics & statistics -based models
Lillo, Mantegna 1999)                are being actively developed

                                     E.g.: Network Estimation for Time-
                                     Series (Barigozzi & Brownlees)


One of many methods to create
networks from correlation/distance
matrices (PMFGs, Partial
Correlation Networks, Influence
Networks, Granger Causality, etc.)


                                                                      8
iii) Sammon’s Projection
Proposed by John W. Sammon in IEEE Transactions on Computers 18: 401–409
(1969)

A nonlinear projection method to map a
high dimensional space onto a space of
lower dimensionality. Example:

                                                                  Iris Setosa


                                                                Iris Versicolor


                                                                 Iris Virginica
                                                                           9
Demo


Click here for interactive visualization   10
Tail dependence
•   Correlation is a linear dependence. The same visual maps can be extended
    to non-linear dependences.
•   Joint work with Firamis (Jochen Papenbrock) and RC Banken (Frank
    Schmielewski), see www.extreme-value-theory.com
•   Instead of correlation, links and positions measure similarity of distances to
    tail losses


                     Tail Tree                                 Tail Sammon
    (Click here for interactive visualization)   (click here for interactive visualization) 11
Blog, Library and Demos at www.fna.fi


Dr. Kimmo Soramäki
kimmo@soramaki.net
Twitter: soramaki

More Related Content

Similar to Network View to Market Risk

Financial Networks and Financial Stability
Financial Networks and Financial StabilityFinancial Networks and Financial Stability
Financial Networks and Financial StabilityKimmo Soramaki
 
Mapping Financial Landscapes @ PRMIA
Mapping Financial Landscapes @ PRMIAMapping Financial Landscapes @ PRMIA
Mapping Financial Landscapes @ PRMIAKimmo Soramaki
 
Financial Network Analysis @ Central Bank of Bolivia
Financial Network Analysis @ Central Bank of BoliviaFinancial Network Analysis @ Central Bank of Bolivia
Financial Network Analysis @ Central Bank of BoliviaKimmo Soramaki
 
Financial Network Analysis - Talk at Oslo University 25 March 2011
Financial Network Analysis - Talk at Oslo University 25 March 2011Financial Network Analysis - Talk at Oslo University 25 March 2011
Financial Network Analysis - Talk at Oslo University 25 March 2011Kimmo Soramaki
 
Financial Network Analyzer - Workshop at West Point Military Academy on 8 Apr...
Financial Network Analyzer - Workshop at West Point Military Academy on 8 Apr...Financial Network Analyzer - Workshop at West Point Military Academy on 8 Apr...
Financial Network Analyzer - Workshop at West Point Military Academy on 8 Apr...Kimmo Soramaki
 
Financial Cartography at Bogazici University
Financial Cartography at Bogazici UniversityFinancial Cartography at Bogazici University
Financial Cartography at Bogazici UniversityKimmo Soramaki
 
Financial Network Analysis - Seminar at IBM Watson Labs 7 April 2011
Financial Network Analysis - Seminar at IBM Watson Labs 7 April 2011Financial Network Analysis - Seminar at IBM Watson Labs 7 April 2011
Financial Network Analysis - Seminar at IBM Watson Labs 7 April 2011Kimmo Soramaki
 
Network Approaches for Interbank Markets
Network Approaches for Interbank MarketsNetwork Approaches for Interbank Markets
Network Approaches for Interbank MarketsKimmo Soramaki
 
Latsis 2012
Latsis 2012Latsis 2012
Latsis 2012gfagiolo
 
Financial Network Analytics @ Liverpool University
Financial Network Analytics @ Liverpool UniversityFinancial Network Analytics @ Liverpool University
Financial Network Analytics @ Liverpool UniversityKimmo Soramaki
 
Visualizing Financial Stress - Talk at European Central Bank
Visualizing Financial Stress - Talk at European Central BankVisualizing Financial Stress - Talk at European Central Bank
Visualizing Financial Stress - Talk at European Central BankKimmo Soramaki
 
Visualizing Eurozone Bond Crisis
Visualizing Eurozone Bond CrisisVisualizing Eurozone Bond Crisis
Visualizing Eurozone Bond CrisisAlan Laubsch
 
UNSCRAMBLING CODES: FROM HIEROGLYPHS TO MARKET NEWS
UNSCRAMBLING CODES: FROM HIEROGLYPHS TO MARKET NEWSUNSCRAMBLING CODES: FROM HIEROGLYPHS TO MARKET NEWS
UNSCRAMBLING CODES: FROM HIEROGLYPHS TO MARKET NEWSkevig
 
UNSCRAMBLING CODES: FROM HIEROGLYPHS TO MARKET NEWS
UNSCRAMBLING CODES: FROM HIEROGLYPHS TO MARKET NEWSUNSCRAMBLING CODES: FROM HIEROGLYPHS TO MARKET NEWS
UNSCRAMBLING CODES: FROM HIEROGLYPHS TO MARKET NEWSkevig
 
Towards XMAS: eXplainability through Multi-Agent Systems
Towards XMAS: eXplainability through Multi-Agent SystemsTowards XMAS: eXplainability through Multi-Agent Systems
Towards XMAS: eXplainability through Multi-Agent SystemsGiovanni Ciatto
 
Financial Network Analytics @ London School of Economics
Financial Network Analytics @ London School of EconomicsFinancial Network Analytics @ London School of Economics
Financial Network Analytics @ London School of EconomicsKimmo Soramaki
 
Sara de freitas the gamification of everyday life - seserv se workshop june...
Sara de freitas   the gamification of everyday life - seserv se workshop june...Sara de freitas   the gamification of everyday life - seserv se workshop june...
Sara de freitas the gamification of everyday life - seserv se workshop june...ictseserv
 
Financial Cartography for Payments and Markets
Financial Cartography for Payments and MarketsFinancial Cartography for Payments and Markets
Financial Cartography for Payments and MarketsKimmo Soramaki
 

Similar to Network View to Market Risk (20)

Financial Networks and Financial Stability
Financial Networks and Financial StabilityFinancial Networks and Financial Stability
Financial Networks and Financial Stability
 
Mapping Financial Landscapes @ PRMIA
Mapping Financial Landscapes @ PRMIAMapping Financial Landscapes @ PRMIA
Mapping Financial Landscapes @ PRMIA
 
Financial Network Analysis @ Central Bank of Bolivia
Financial Network Analysis @ Central Bank of BoliviaFinancial Network Analysis @ Central Bank of Bolivia
Financial Network Analysis @ Central Bank of Bolivia
 
Financial Network Analysis - Talk at Oslo University 25 March 2011
Financial Network Analysis - Talk at Oslo University 25 March 2011Financial Network Analysis - Talk at Oslo University 25 March 2011
Financial Network Analysis - Talk at Oslo University 25 March 2011
 
Financial Network Analyzer - Workshop at West Point Military Academy on 8 Apr...
Financial Network Analyzer - Workshop at West Point Military Academy on 8 Apr...Financial Network Analyzer - Workshop at West Point Military Academy on 8 Apr...
Financial Network Analyzer - Workshop at West Point Military Academy on 8 Apr...
 
Financial Cartography at Bogazici University
Financial Cartography at Bogazici UniversityFinancial Cartography at Bogazici University
Financial Cartography at Bogazici University
 
Financial Network Analysis - Seminar at IBM Watson Labs 7 April 2011
Financial Network Analysis - Seminar at IBM Watson Labs 7 April 2011Financial Network Analysis - Seminar at IBM Watson Labs 7 April 2011
Financial Network Analysis - Seminar at IBM Watson Labs 7 April 2011
 
Network Approaches for Interbank Markets
Network Approaches for Interbank MarketsNetwork Approaches for Interbank Markets
Network Approaches for Interbank Markets
 
Latsis 2012
Latsis 2012Latsis 2012
Latsis 2012
 
Financial Network Analytics @ Liverpool University
Financial Network Analytics @ Liverpool UniversityFinancial Network Analytics @ Liverpool University
Financial Network Analytics @ Liverpool University
 
Visualizing Financial Stress - Talk at European Central Bank
Visualizing Financial Stress - Talk at European Central BankVisualizing Financial Stress - Talk at European Central Bank
Visualizing Financial Stress - Talk at European Central Bank
 
Fbk Seminar Michela Ferron
Fbk Seminar Michela FerronFbk Seminar Michela Ferron
Fbk Seminar Michela Ferron
 
Visualizing Eurozone Bond Crisis
Visualizing Eurozone Bond CrisisVisualizing Eurozone Bond Crisis
Visualizing Eurozone Bond Crisis
 
Understanding and predicting biological complex system.
Understanding and predicting biological complex system.Understanding and predicting biological complex system.
Understanding and predicting biological complex system.
 
UNSCRAMBLING CODES: FROM HIEROGLYPHS TO MARKET NEWS
UNSCRAMBLING CODES: FROM HIEROGLYPHS TO MARKET NEWSUNSCRAMBLING CODES: FROM HIEROGLYPHS TO MARKET NEWS
UNSCRAMBLING CODES: FROM HIEROGLYPHS TO MARKET NEWS
 
UNSCRAMBLING CODES: FROM HIEROGLYPHS TO MARKET NEWS
UNSCRAMBLING CODES: FROM HIEROGLYPHS TO MARKET NEWSUNSCRAMBLING CODES: FROM HIEROGLYPHS TO MARKET NEWS
UNSCRAMBLING CODES: FROM HIEROGLYPHS TO MARKET NEWS
 
Towards XMAS: eXplainability through Multi-Agent Systems
Towards XMAS: eXplainability through Multi-Agent SystemsTowards XMAS: eXplainability through Multi-Agent Systems
Towards XMAS: eXplainability through Multi-Agent Systems
 
Financial Network Analytics @ London School of Economics
Financial Network Analytics @ London School of EconomicsFinancial Network Analytics @ London School of Economics
Financial Network Analytics @ London School of Economics
 
Sara de freitas the gamification of everyday life - seserv se workshop june...
Sara de freitas   the gamification of everyday life - seserv se workshop june...Sara de freitas   the gamification of everyday life - seserv se workshop june...
Sara de freitas the gamification of everyday life - seserv se workshop june...
 
Financial Cartography for Payments and Markets
Financial Cartography for Payments and MarketsFinancial Cartography for Payments and Markets
Financial Cartography for Payments and Markets
 

More from Kimmo Soramaki

Applications of Network Theory in Finance
Applications of Network Theory in FinanceApplications of Network Theory in Finance
Applications of Network Theory in FinanceKimmo Soramaki
 
Applications of Network Theory in Finance and Production
Applications of Network Theory in Finance and ProductionApplications of Network Theory in Finance and Production
Applications of Network Theory in Finance and ProductionKimmo Soramaki
 
Global Network of Payment Flows - Presentation at Commerzbank Cash Forum
Global Network of Payment Flows - Presentation at Commerzbank Cash ForumGlobal Network of Payment Flows - Presentation at Commerzbank Cash Forum
Global Network of Payment Flows - Presentation at Commerzbank Cash ForumKimmo Soramaki
 
Network Simulations for Business Continuity
Network Simulations for Business ContinuityNetwork Simulations for Business Continuity
Network Simulations for Business ContinuityKimmo Soramaki
 
Quantitative Oversight of Financial Market Infrastructures
Quantitative Oversight of Financial Market InfrastructuresQuantitative Oversight of Financial Market Infrastructures
Quantitative Oversight of Financial Market InfrastructuresKimmo Soramaki
 
Emerging Stress Scenarios
Emerging Stress ScenariosEmerging Stress Scenarios
Emerging Stress ScenariosKimmo Soramaki
 
System shock analysis and complex network effects
System shock analysis and complex network effectsSystem shock analysis and complex network effects
System shock analysis and complex network effectsKimmo Soramaki
 
Adaptive Stress Testing
Adaptive Stress TestingAdaptive Stress Testing
Adaptive Stress TestingKimmo Soramaki
 
Illuminating Interconnectedness and Contagion
Illuminating Interconnectedness and ContagionIlluminating Interconnectedness and Contagion
Illuminating Interconnectedness and ContagionKimmo Soramaki
 
Financial Networks VI - Correlation Networks
Financial Networks VI - Correlation NetworksFinancial Networks VI - Correlation Networks
Financial Networks VI - Correlation NetworksKimmo Soramaki
 
Financial Networks IV. Analyzing and Visualizing Exposures
Financial Networks IV. Analyzing and Visualizing ExposuresFinancial Networks IV. Analyzing and Visualizing Exposures
Financial Networks IV. Analyzing and Visualizing ExposuresKimmo Soramaki
 
Financial Networks III. Centrality and Systemic Importance
Financial Networks III. Centrality and Systemic ImportanceFinancial Networks III. Centrality and Systemic Importance
Financial Networks III. Centrality and Systemic ImportanceKimmo Soramaki
 
Financial Networks: II. Fundamentals of Network Theory and FNA
Financial Networks: II. Fundamentals of Network Theory and FNAFinancial Networks: II. Fundamentals of Network Theory and FNA
Financial Networks: II. Fundamentals of Network Theory and FNAKimmo Soramaki
 
Practical implementation of the BCBS Monitoring indicators for intraday liqui...
Practical implementation of the BCBS Monitoring indicators for intraday liqui...Practical implementation of the BCBS Monitoring indicators for intraday liqui...
Practical implementation of the BCBS Monitoring indicators for intraday liqui...Kimmo Soramaki
 
Identifying systemically important banks in payment systems
Identifying systemically important banks in payment systemsIdentifying systemically important banks in payment systems
Identifying systemically important banks in payment systemsKimmo Soramaki
 
Identifying Systemically Important Banks in Payment Systems
Identifying Systemically Important Banks in Payment SystemsIdentifying Systemically Important Banks in Payment Systems
Identifying Systemically Important Banks in Payment SystemsKimmo Soramaki
 

More from Kimmo Soramaki (18)

Applications of Network Theory in Finance
Applications of Network Theory in FinanceApplications of Network Theory in Finance
Applications of Network Theory in Finance
 
Applications of Network Theory in Finance and Production
Applications of Network Theory in Finance and ProductionApplications of Network Theory in Finance and Production
Applications of Network Theory in Finance and Production
 
Global Network of Payment Flows - Presentation at Commerzbank Cash Forum
Global Network of Payment Flows - Presentation at Commerzbank Cash ForumGlobal Network of Payment Flows - Presentation at Commerzbank Cash Forum
Global Network of Payment Flows - Presentation at Commerzbank Cash Forum
 
Financial Cartography
Financial CartographyFinancial Cartography
Financial Cartography
 
Network Simulations for Business Continuity
Network Simulations for Business ContinuityNetwork Simulations for Business Continuity
Network Simulations for Business Continuity
 
Quantitative Oversight of Financial Market Infrastructures
Quantitative Oversight of Financial Market InfrastructuresQuantitative Oversight of Financial Market Infrastructures
Quantitative Oversight of Financial Market Infrastructures
 
Emerging Stress Scenarios
Emerging Stress ScenariosEmerging Stress Scenarios
Emerging Stress Scenarios
 
System shock analysis and complex network effects
System shock analysis and complex network effectsSystem shock analysis and complex network effects
System shock analysis and complex network effects
 
Adaptive Stress Testing
Adaptive Stress TestingAdaptive Stress Testing
Adaptive Stress Testing
 
Illuminating Interconnectedness and Contagion
Illuminating Interconnectedness and ContagionIlluminating Interconnectedness and Contagion
Illuminating Interconnectedness and Contagion
 
Financial Networks VI - Correlation Networks
Financial Networks VI - Correlation NetworksFinancial Networks VI - Correlation Networks
Financial Networks VI - Correlation Networks
 
Financial Networks IV. Analyzing and Visualizing Exposures
Financial Networks IV. Analyzing and Visualizing ExposuresFinancial Networks IV. Analyzing and Visualizing Exposures
Financial Networks IV. Analyzing and Visualizing Exposures
 
Financial Networks III. Centrality and Systemic Importance
Financial Networks III. Centrality and Systemic ImportanceFinancial Networks III. Centrality and Systemic Importance
Financial Networks III. Centrality and Systemic Importance
 
Financial Networks: II. Fundamentals of Network Theory and FNA
Financial Networks: II. Fundamentals of Network Theory and FNAFinancial Networks: II. Fundamentals of Network Theory and FNA
Financial Networks: II. Fundamentals of Network Theory and FNA
 
Practical implementation of the BCBS Monitoring indicators for intraday liqui...
Practical implementation of the BCBS Monitoring indicators for intraday liqui...Practical implementation of the BCBS Monitoring indicators for intraday liqui...
Practical implementation of the BCBS Monitoring indicators for intraday liqui...
 
Clearing Networks
Clearing NetworksClearing Networks
Clearing Networks
 
Identifying systemically important banks in payment systems
Identifying systemically important banks in payment systemsIdentifying systemically important banks in payment systems
Identifying systemically important banks in payment systems
 
Identifying Systemically Important Banks in Payment Systems
Identifying Systemically Important Banks in Payment SystemsIdentifying Systemically Important Banks in Payment Systems
Identifying Systemically Important Banks in Payment Systems
 

Network View to Market Risk

  • 1. Russia Risk Conference PRMIA and Cbonds Moscow, 21 November 2012 Network view to market risk Correlation and Tail networks Dr. Kimmo Soramäki Founder and CEO FNA, www.fna.fi
  • 2. Network Theory and Financial Cartography Main premise of network theory: Maps reduce data and encode Structure of links between nodes relevant data to graphical elements matters within a representation system + Network Theory provides the representation system for financial maps like Cartography does to geographic maps 2
  • 3. Outline Maps enable visual insights from The maps: Heat Maps, Trees, complex financial data Networks and Sammon’s Projections – Reduce complexity – Identify price driving themes and market dynamics – Spot anomalies – Build intuition – Aid communication of results These methods are showcased for visualizing correlations among a wide range of assets around the collapse of Lehman Brothers on 15 September 2008 3
  • 4. i) Heat Maps 2004-2007 Corporate Bonds 151 assets in 5 asset classes: CDS on equities, gov. Government Debt bonds, corp. bonds, cds and foreign FX Rates exchange Government Bond Yields Correlation +1 Stock Exchange 0 Indices -1 4
  • 5. Collapse of Lehman, t=month 2004-2007 t-2 t-1 t+1 t+2 t+3
  • 6. ii) Asset Trees Originally proposed by Rosario Mantegna in 1999 Used currently by some major financial institutions for market analysis and portfolio optimization and visualization Methodology in a nutshell MST 1. Calculate (daily) asset returns 2. Calculate pairwise Pearson correlations of returns 3. Convert correlations to distances 4. Extract Minimum Spanning Tree (MST) 5. Visualize 6
  • 7. Demo Click here for interactive visualization 7
  • 8. Correlation filtering Balance between too much and too New graph, information-theory, little information (Tumminello, economics & statistics -based models Lillo, Mantegna 1999) are being actively developed E.g.: Network Estimation for Time- Series (Barigozzi & Brownlees) One of many methods to create networks from correlation/distance matrices (PMFGs, Partial Correlation Networks, Influence Networks, Granger Causality, etc.) 8
  • 9. iii) Sammon’s Projection Proposed by John W. Sammon in IEEE Transactions on Computers 18: 401–409 (1969) A nonlinear projection method to map a high dimensional space onto a space of lower dimensionality. Example: Iris Setosa Iris Versicolor Iris Virginica 9
  • 10. Demo Click here for interactive visualization 10
  • 11. Tail dependence • Correlation is a linear dependence. The same visual maps can be extended to non-linear dependences. • Joint work with Firamis (Jochen Papenbrock) and RC Banken (Frank Schmielewski), see www.extreme-value-theory.com • Instead of correlation, links and positions measure similarity of distances to tail losses Tail Tree Tail Sammon (Click here for interactive visualization) (click here for interactive visualization) 11
  • 12. Blog, Library and Demos at www.fna.fi Dr. Kimmo Soramäki kimmo@soramaki.net Twitter: soramaki