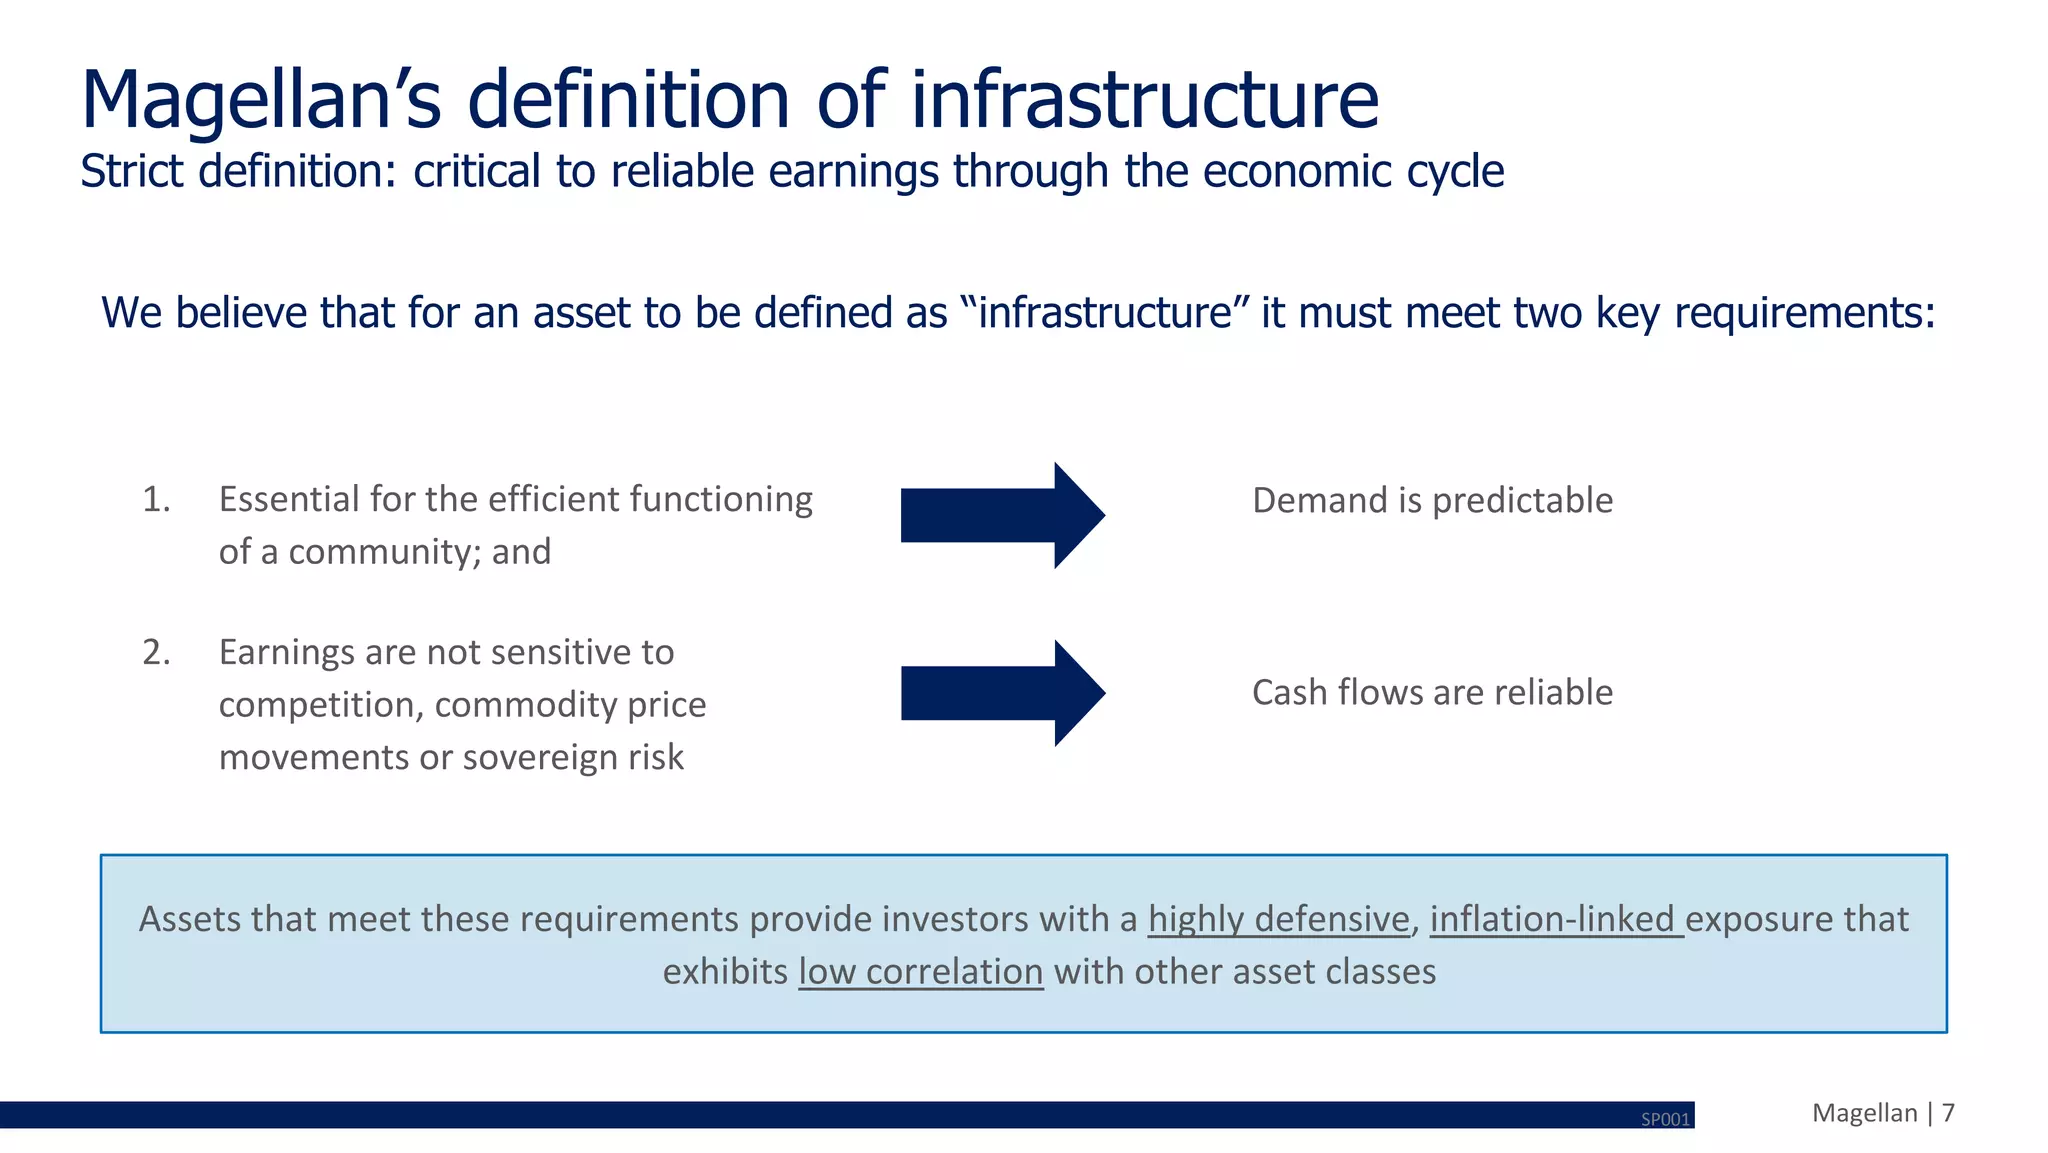
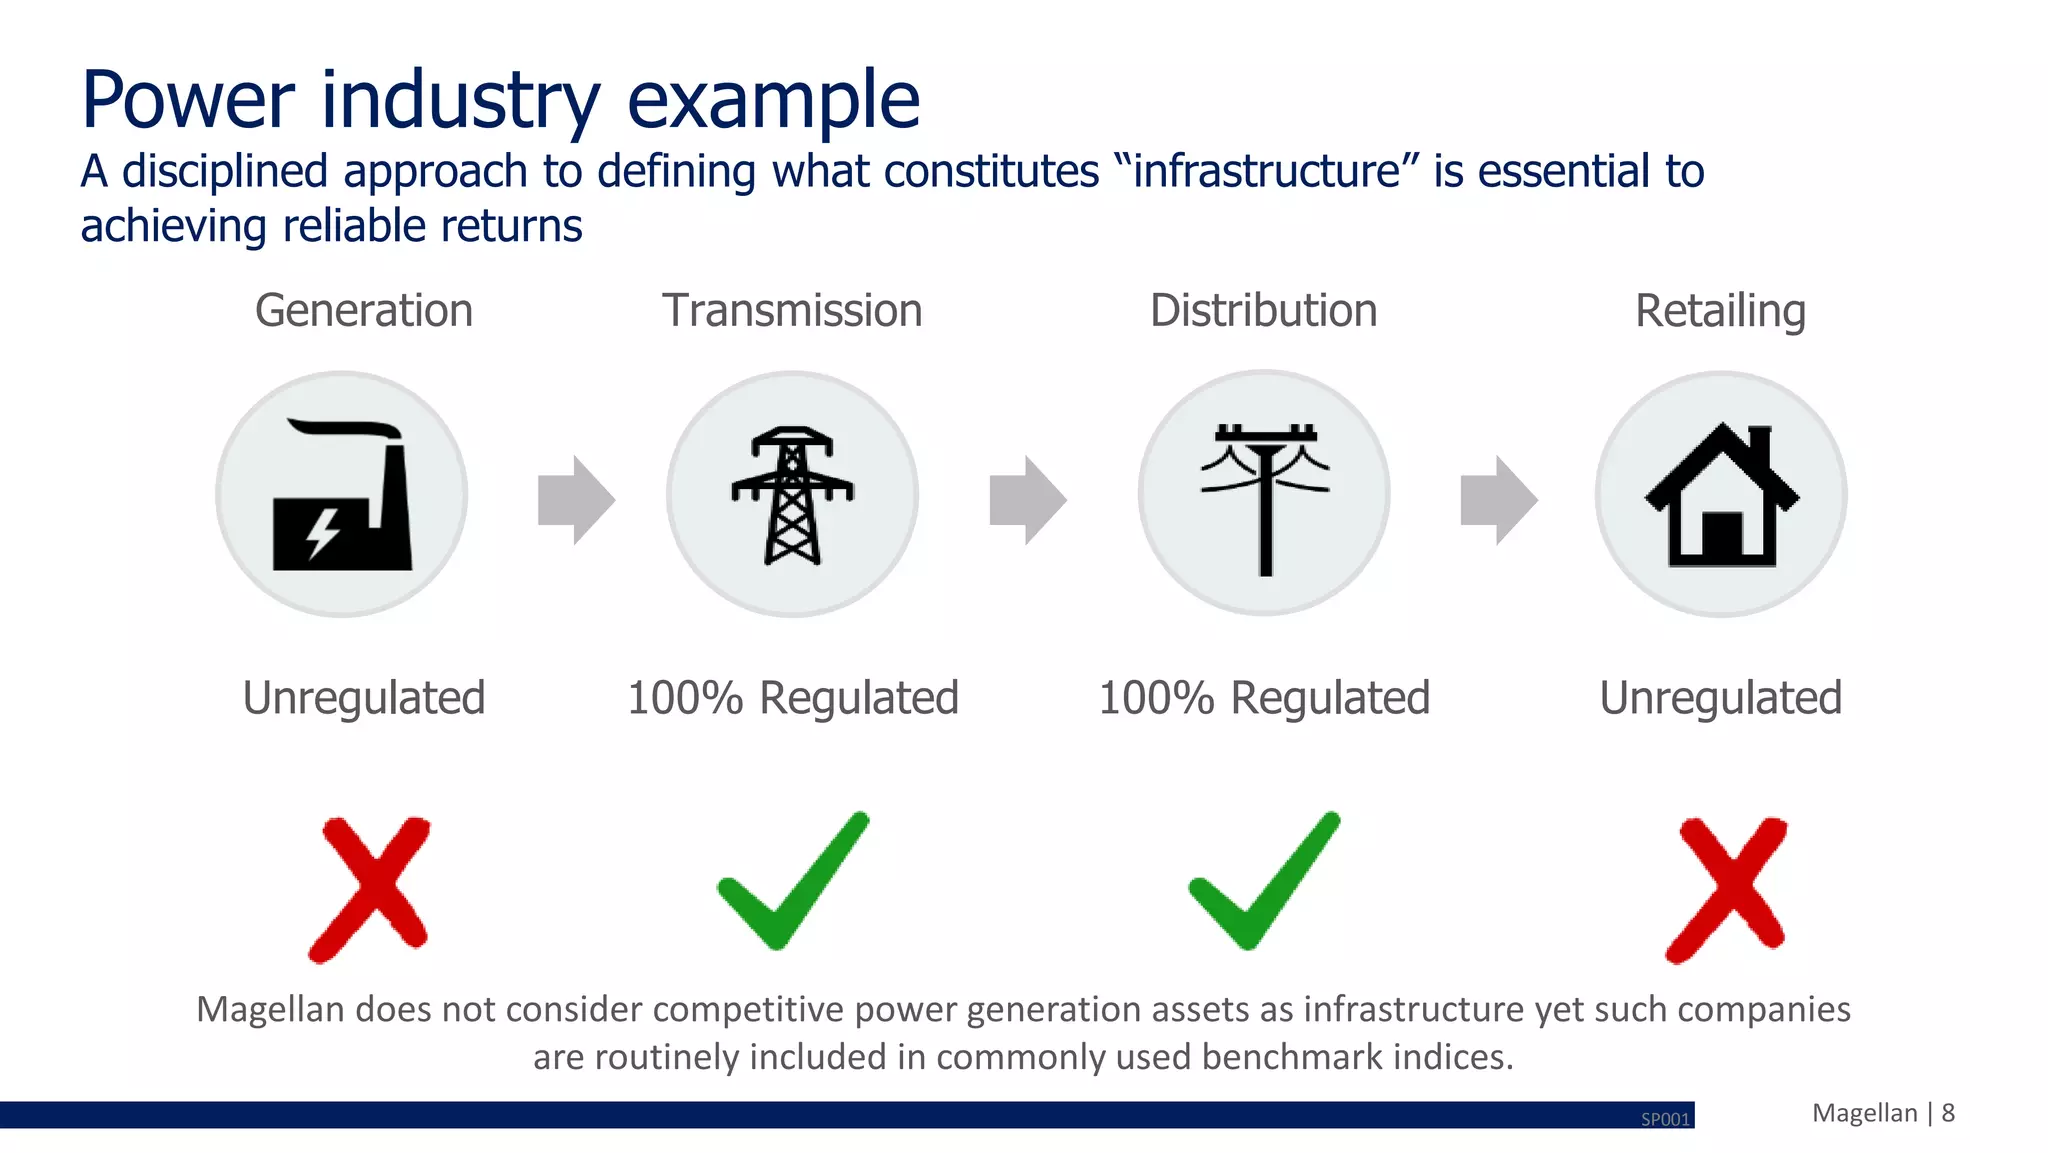
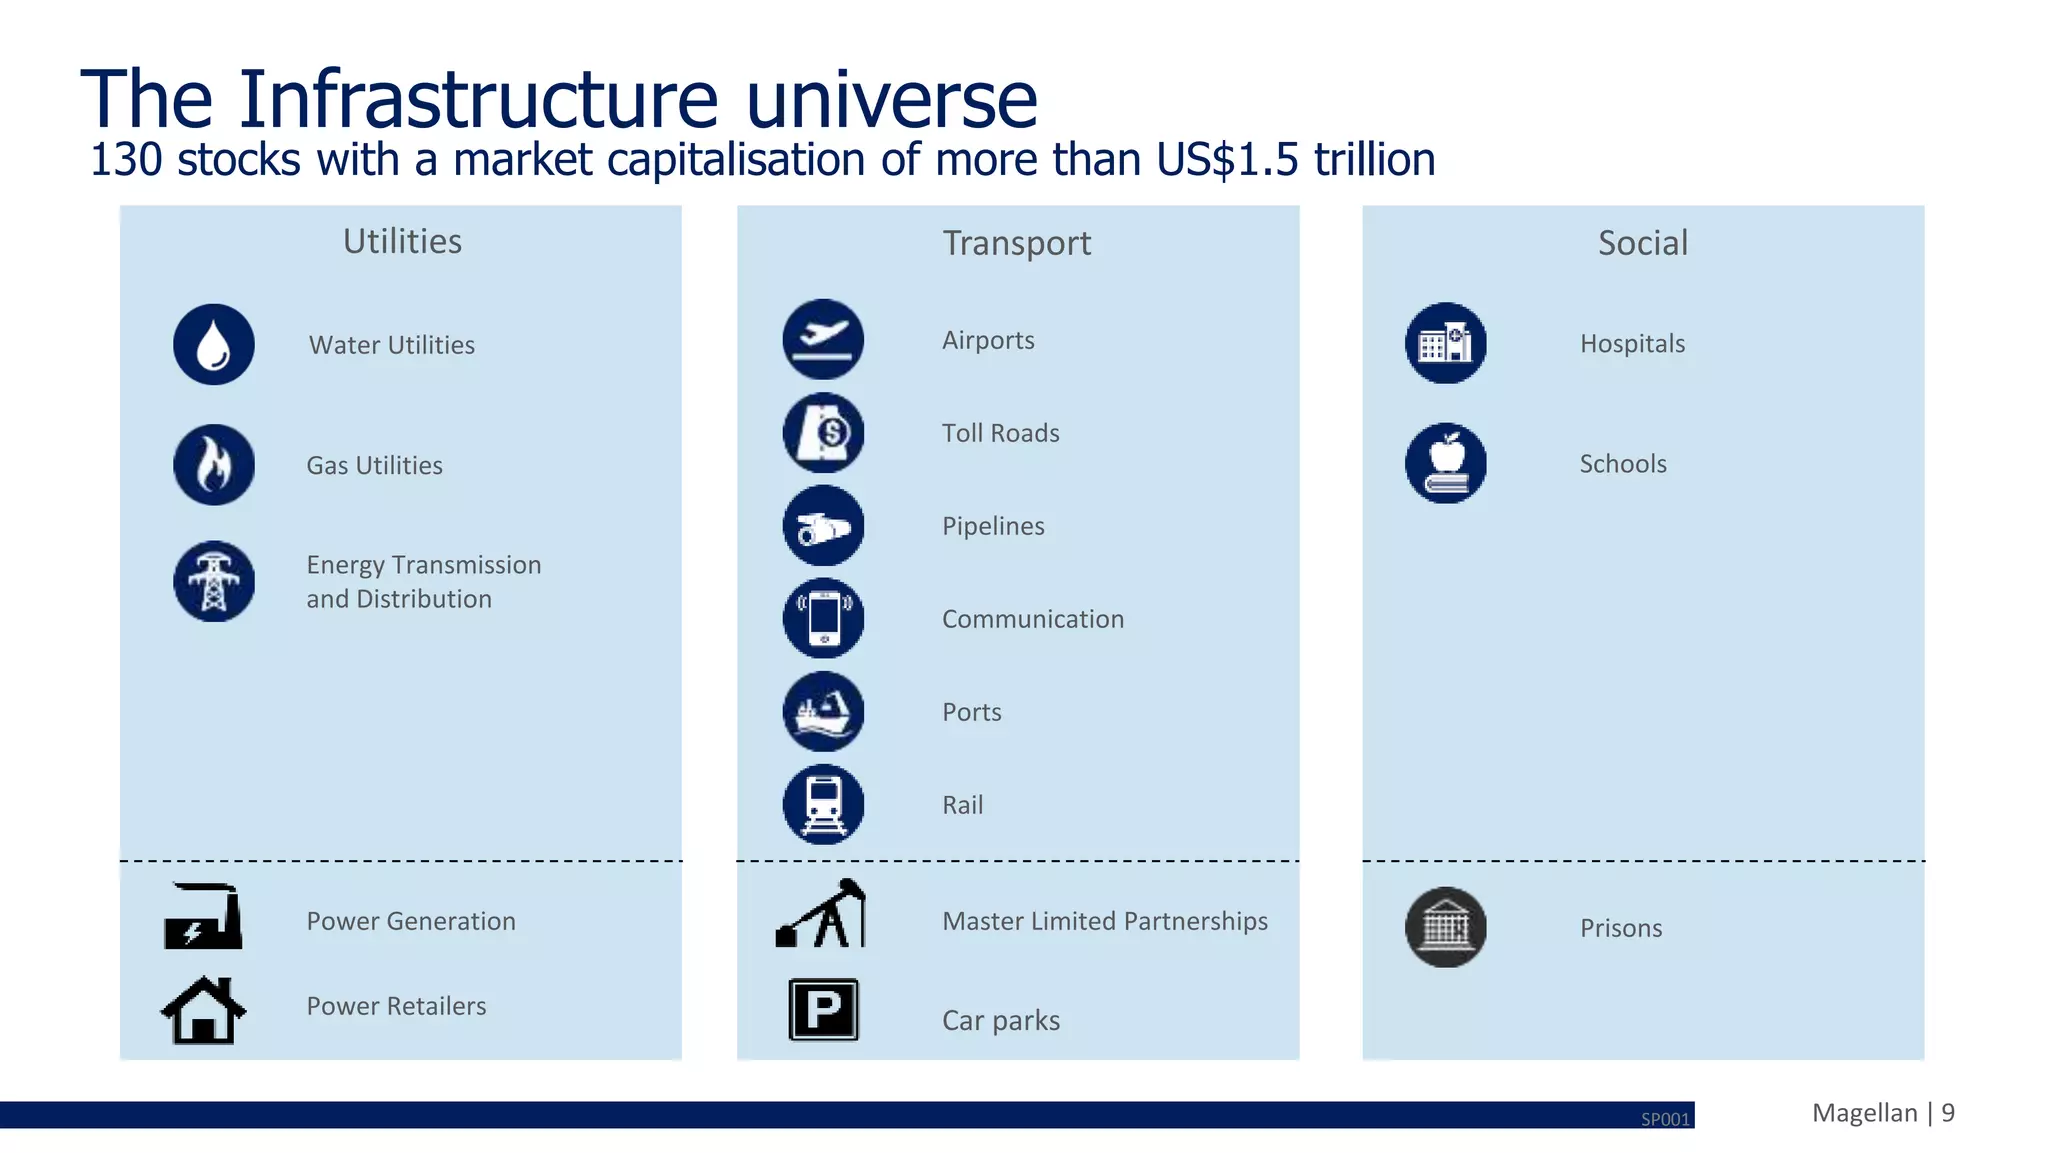
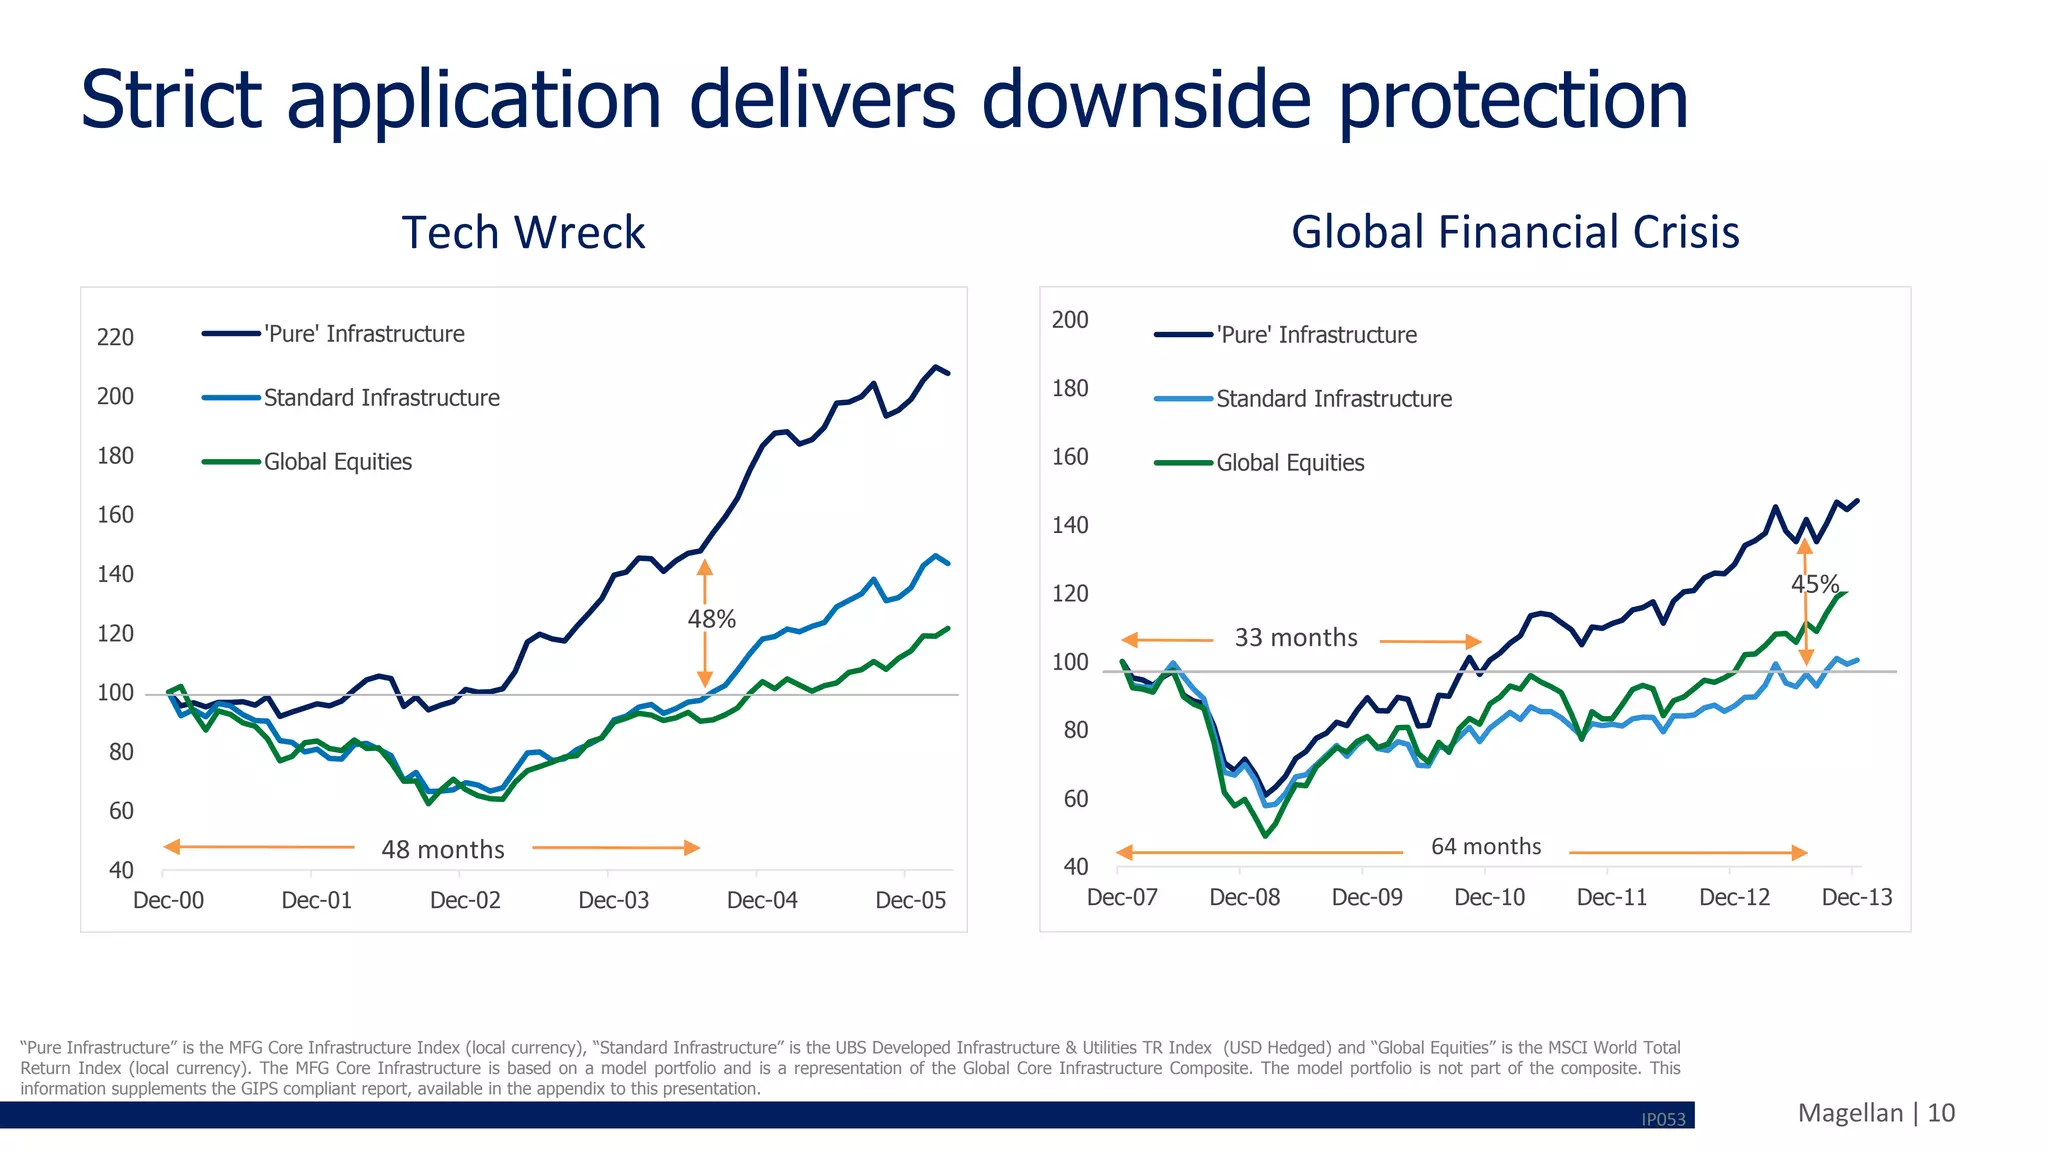
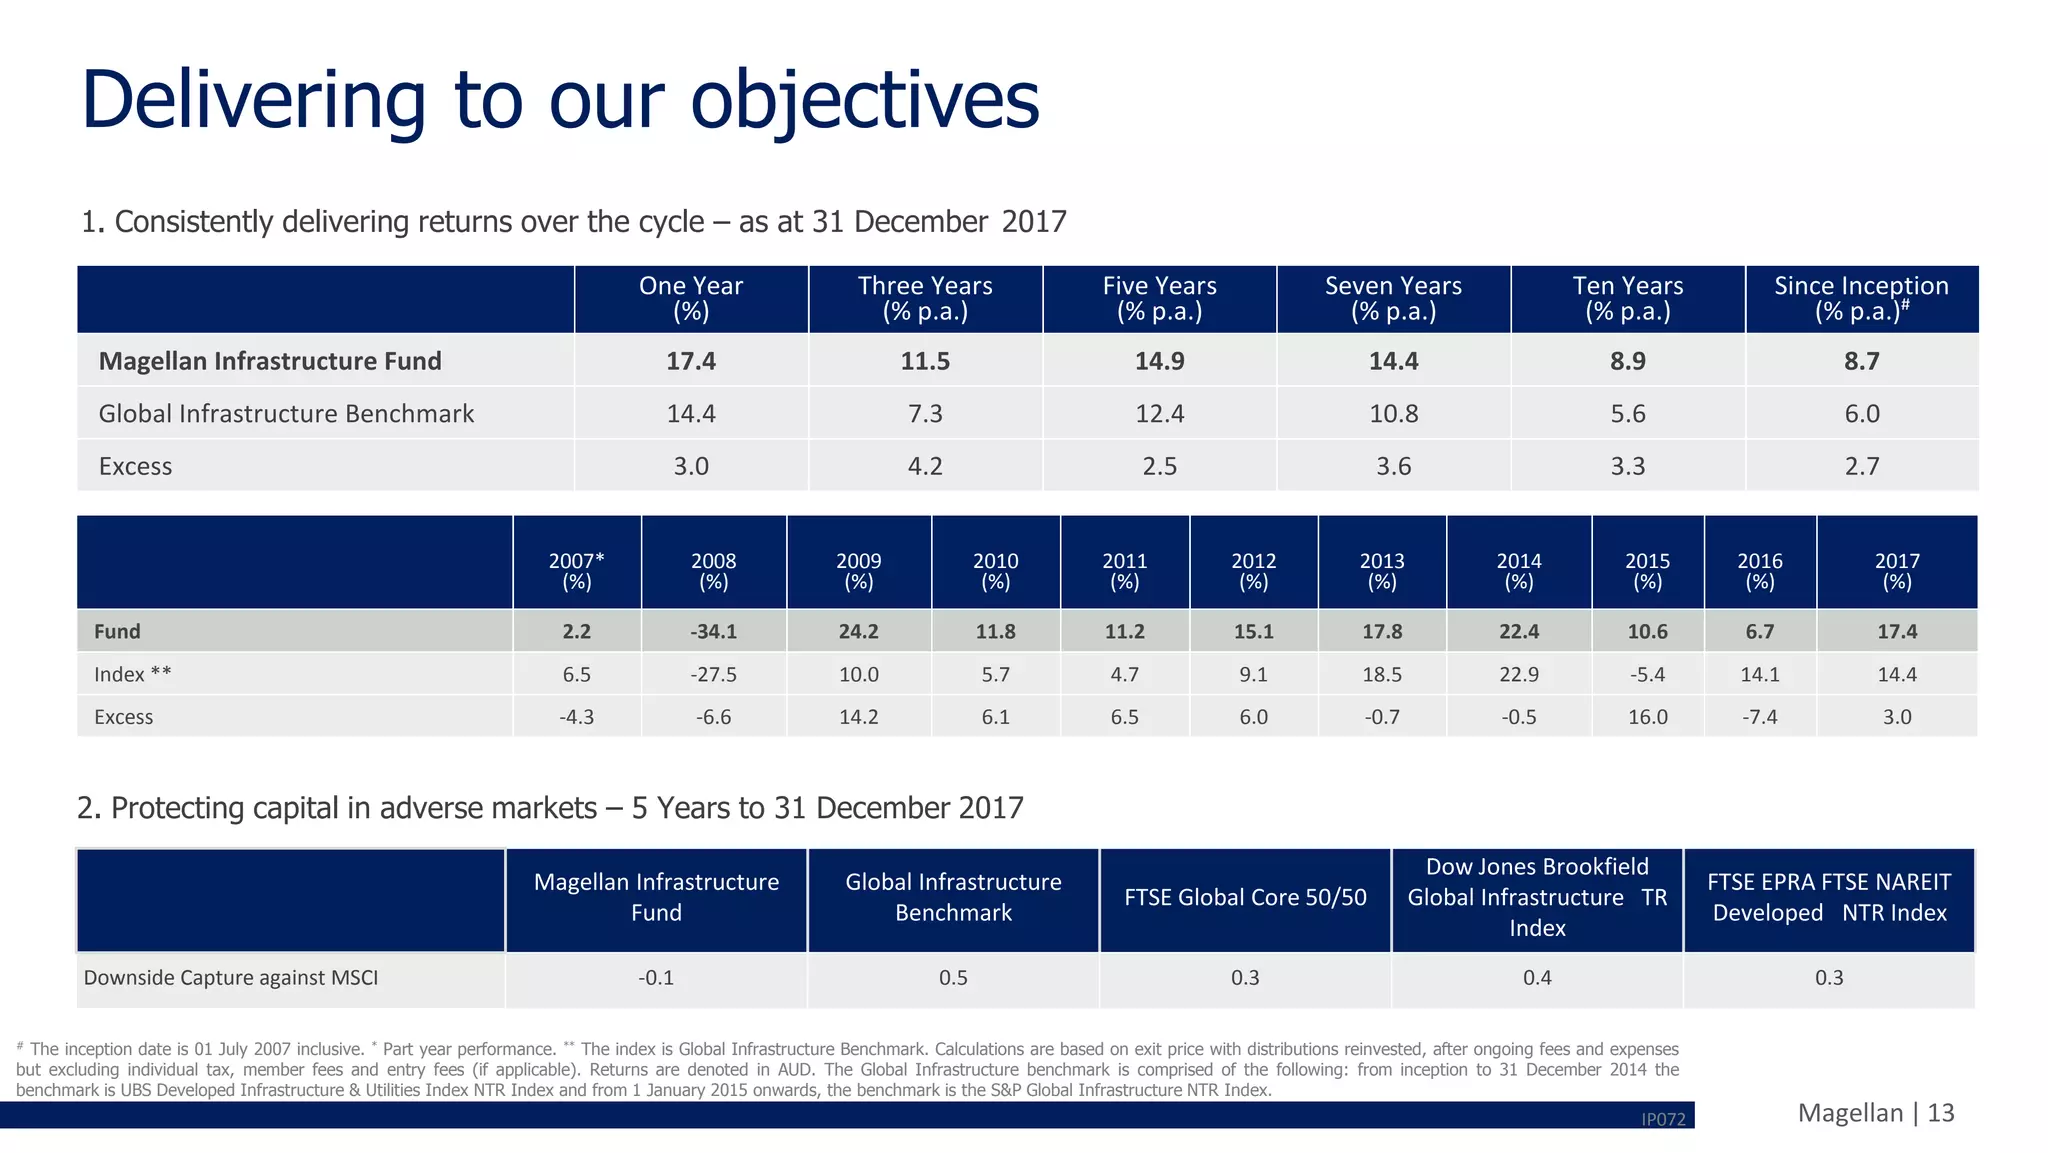
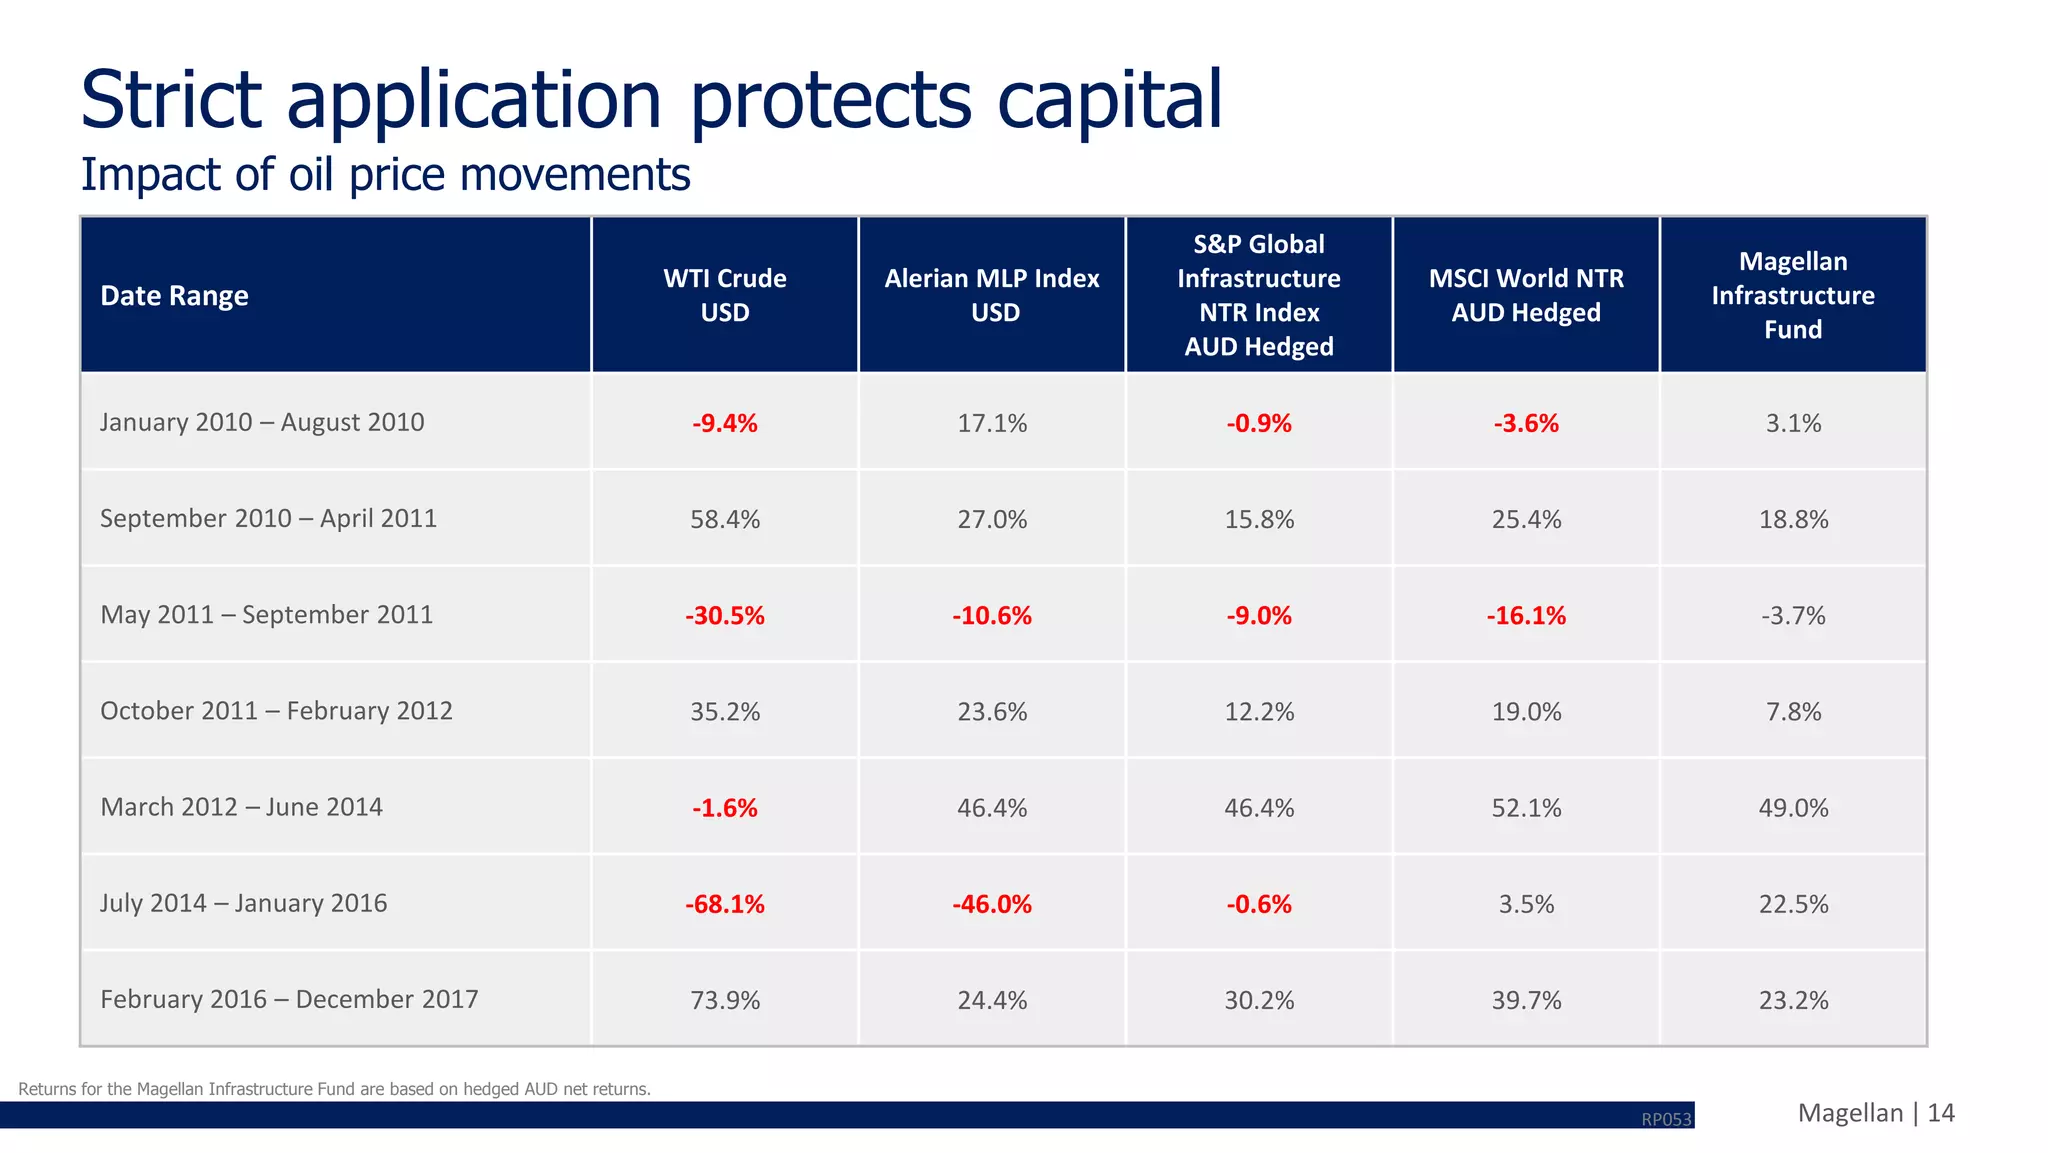
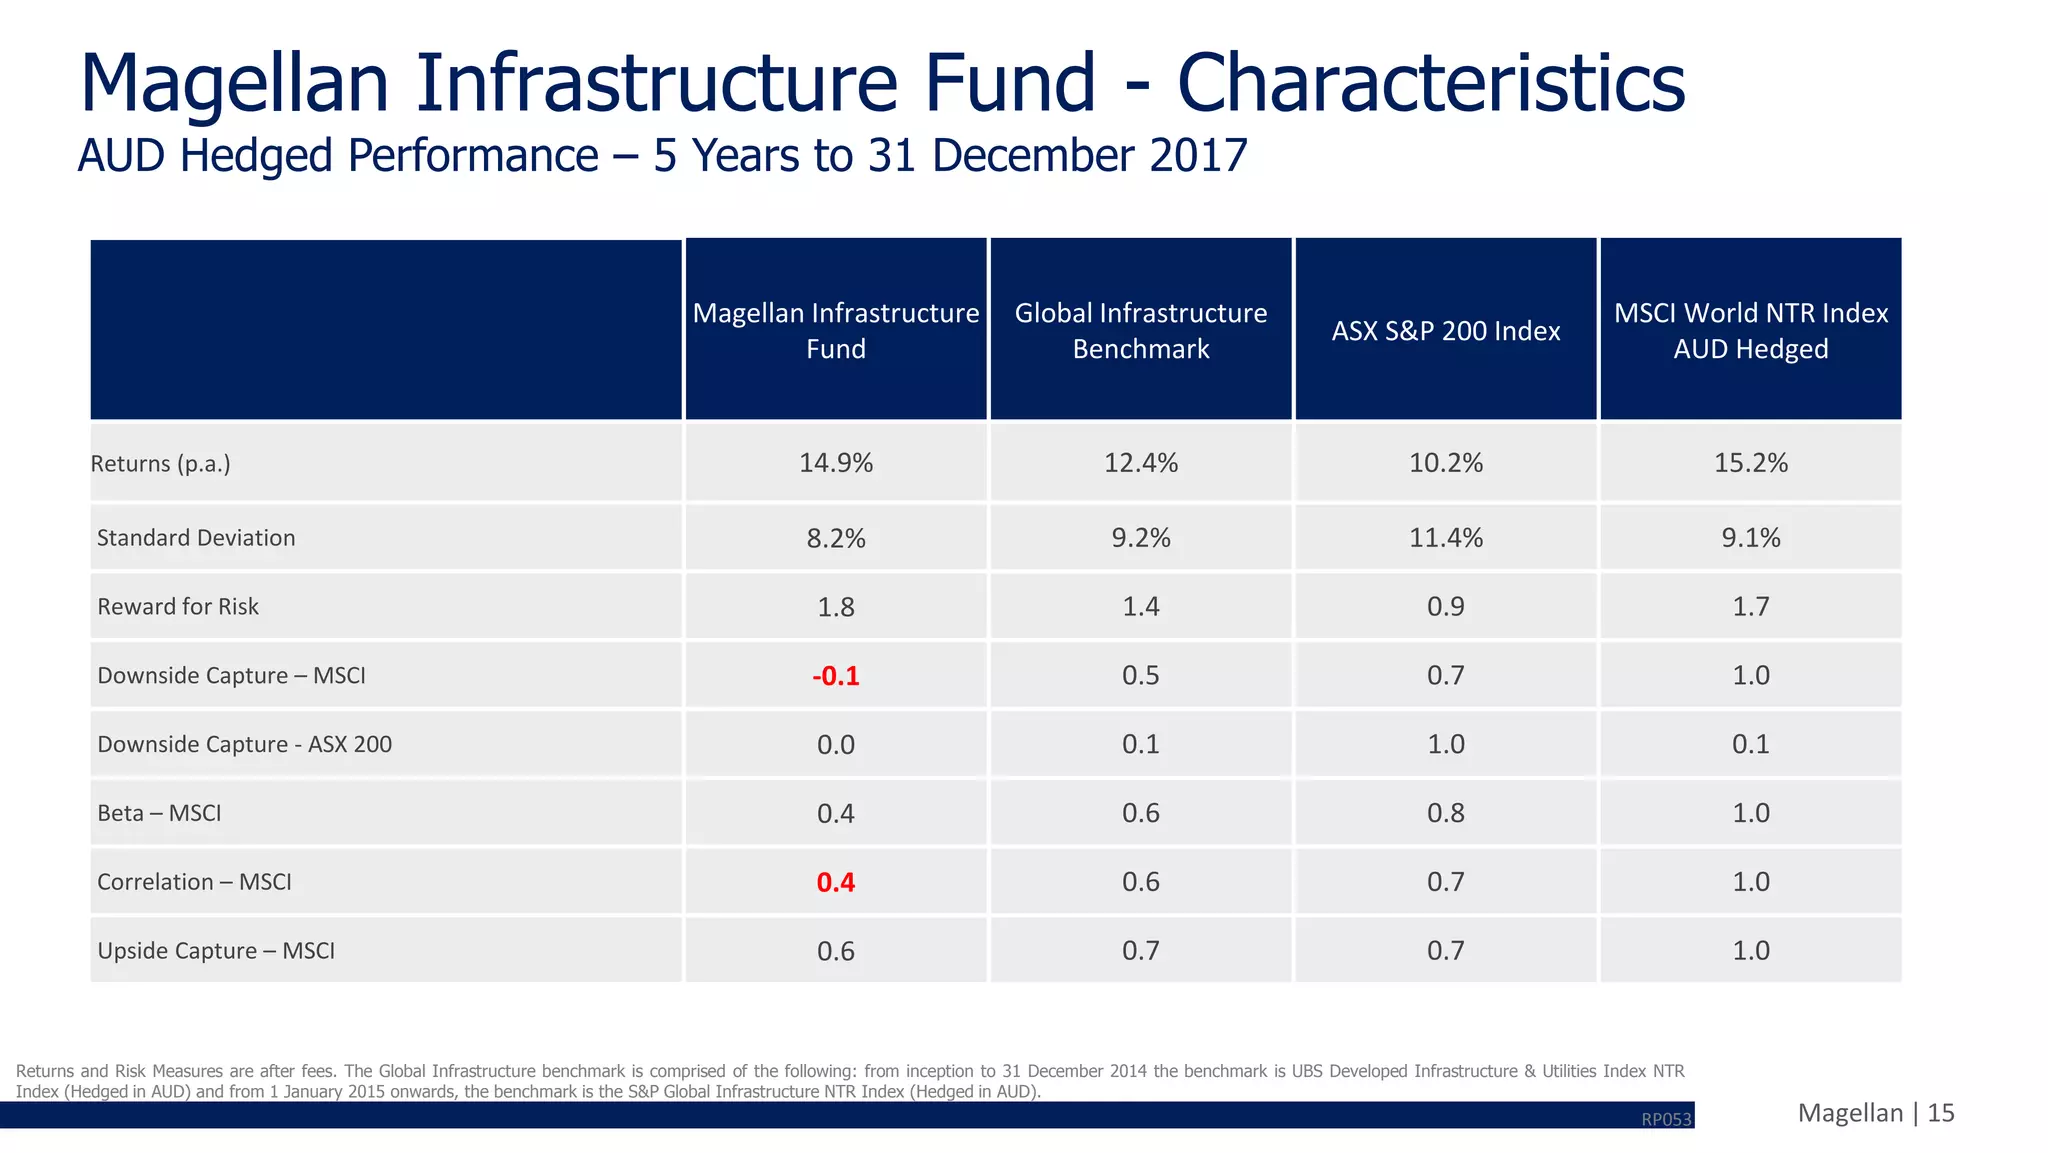
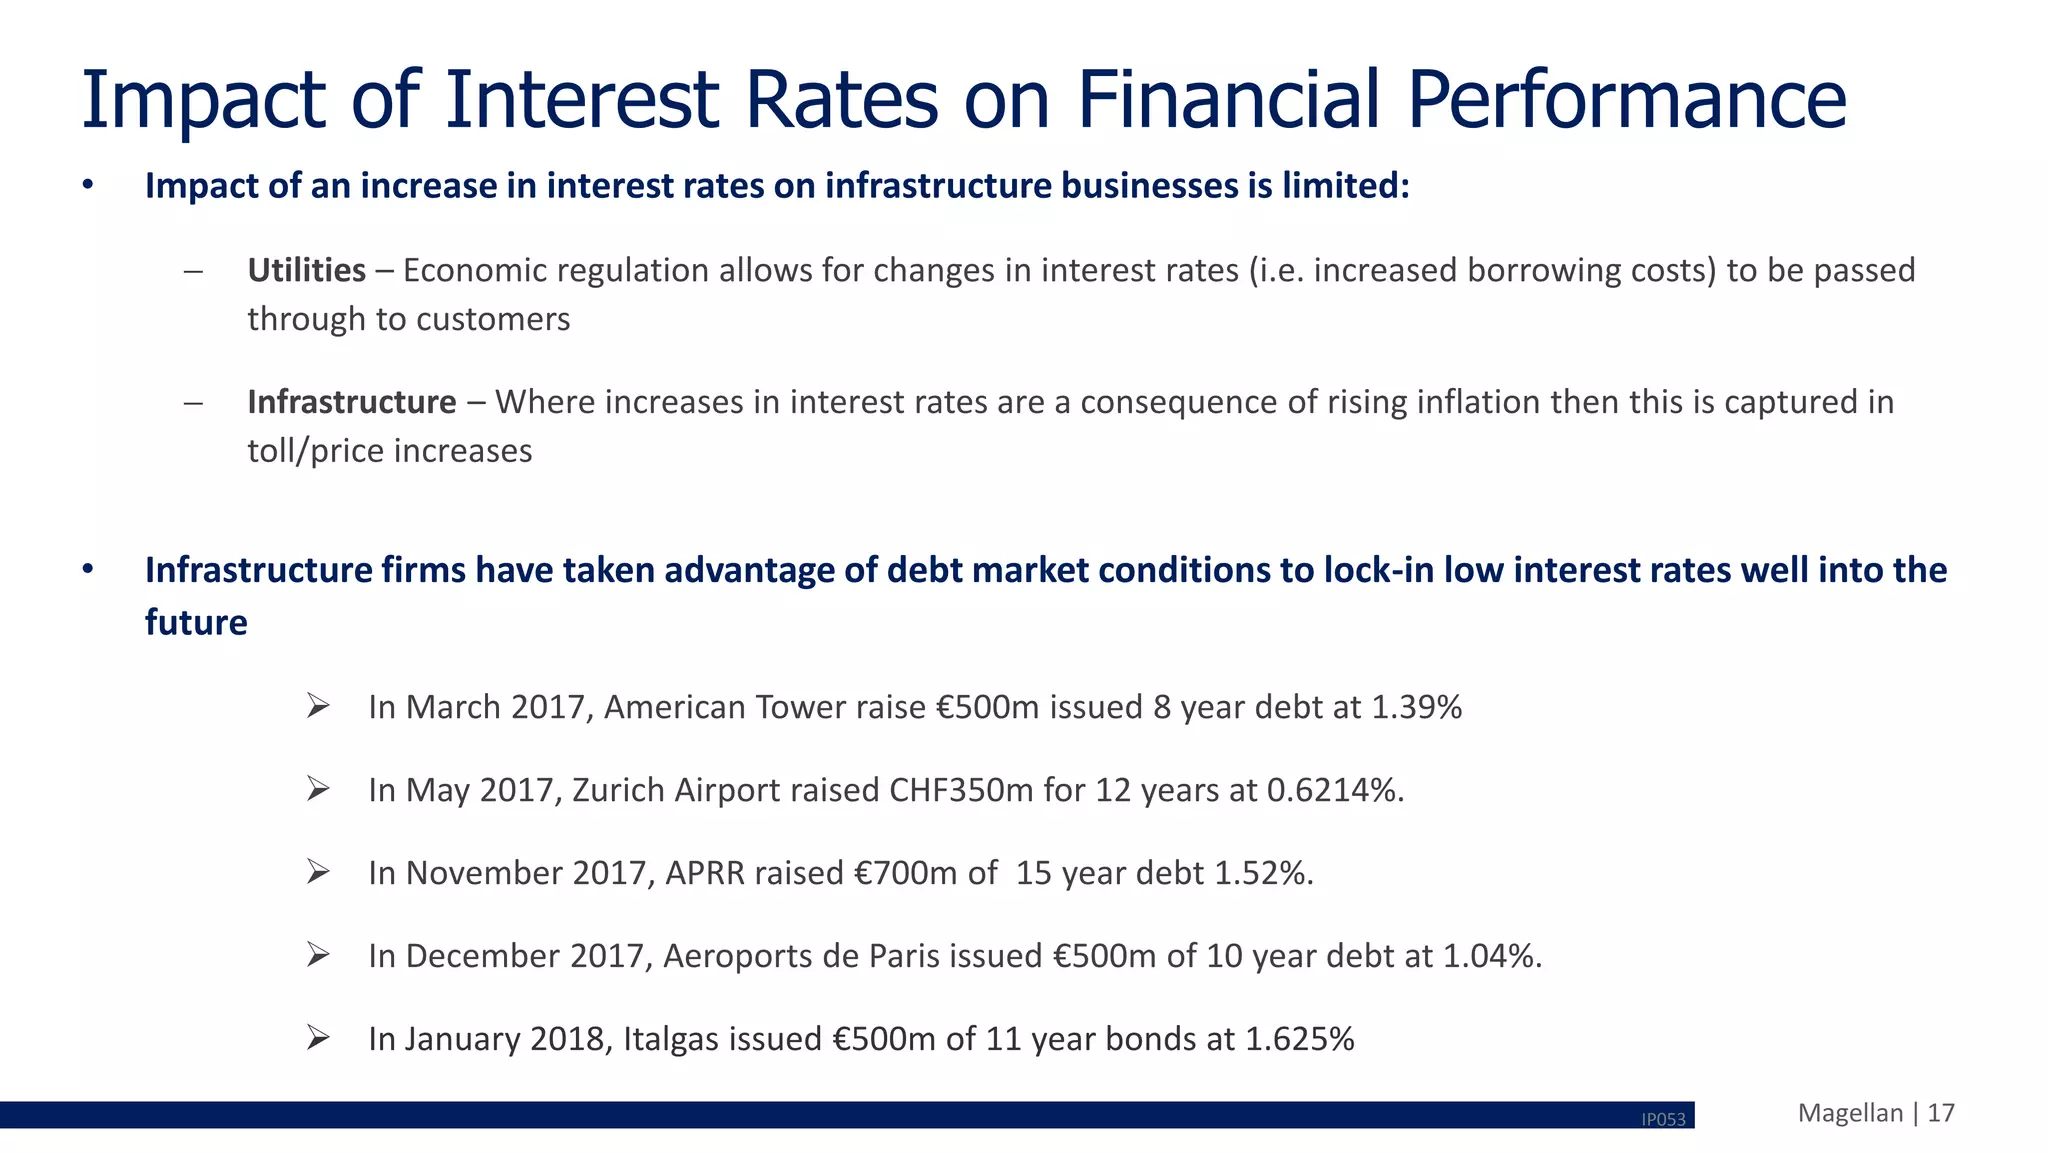
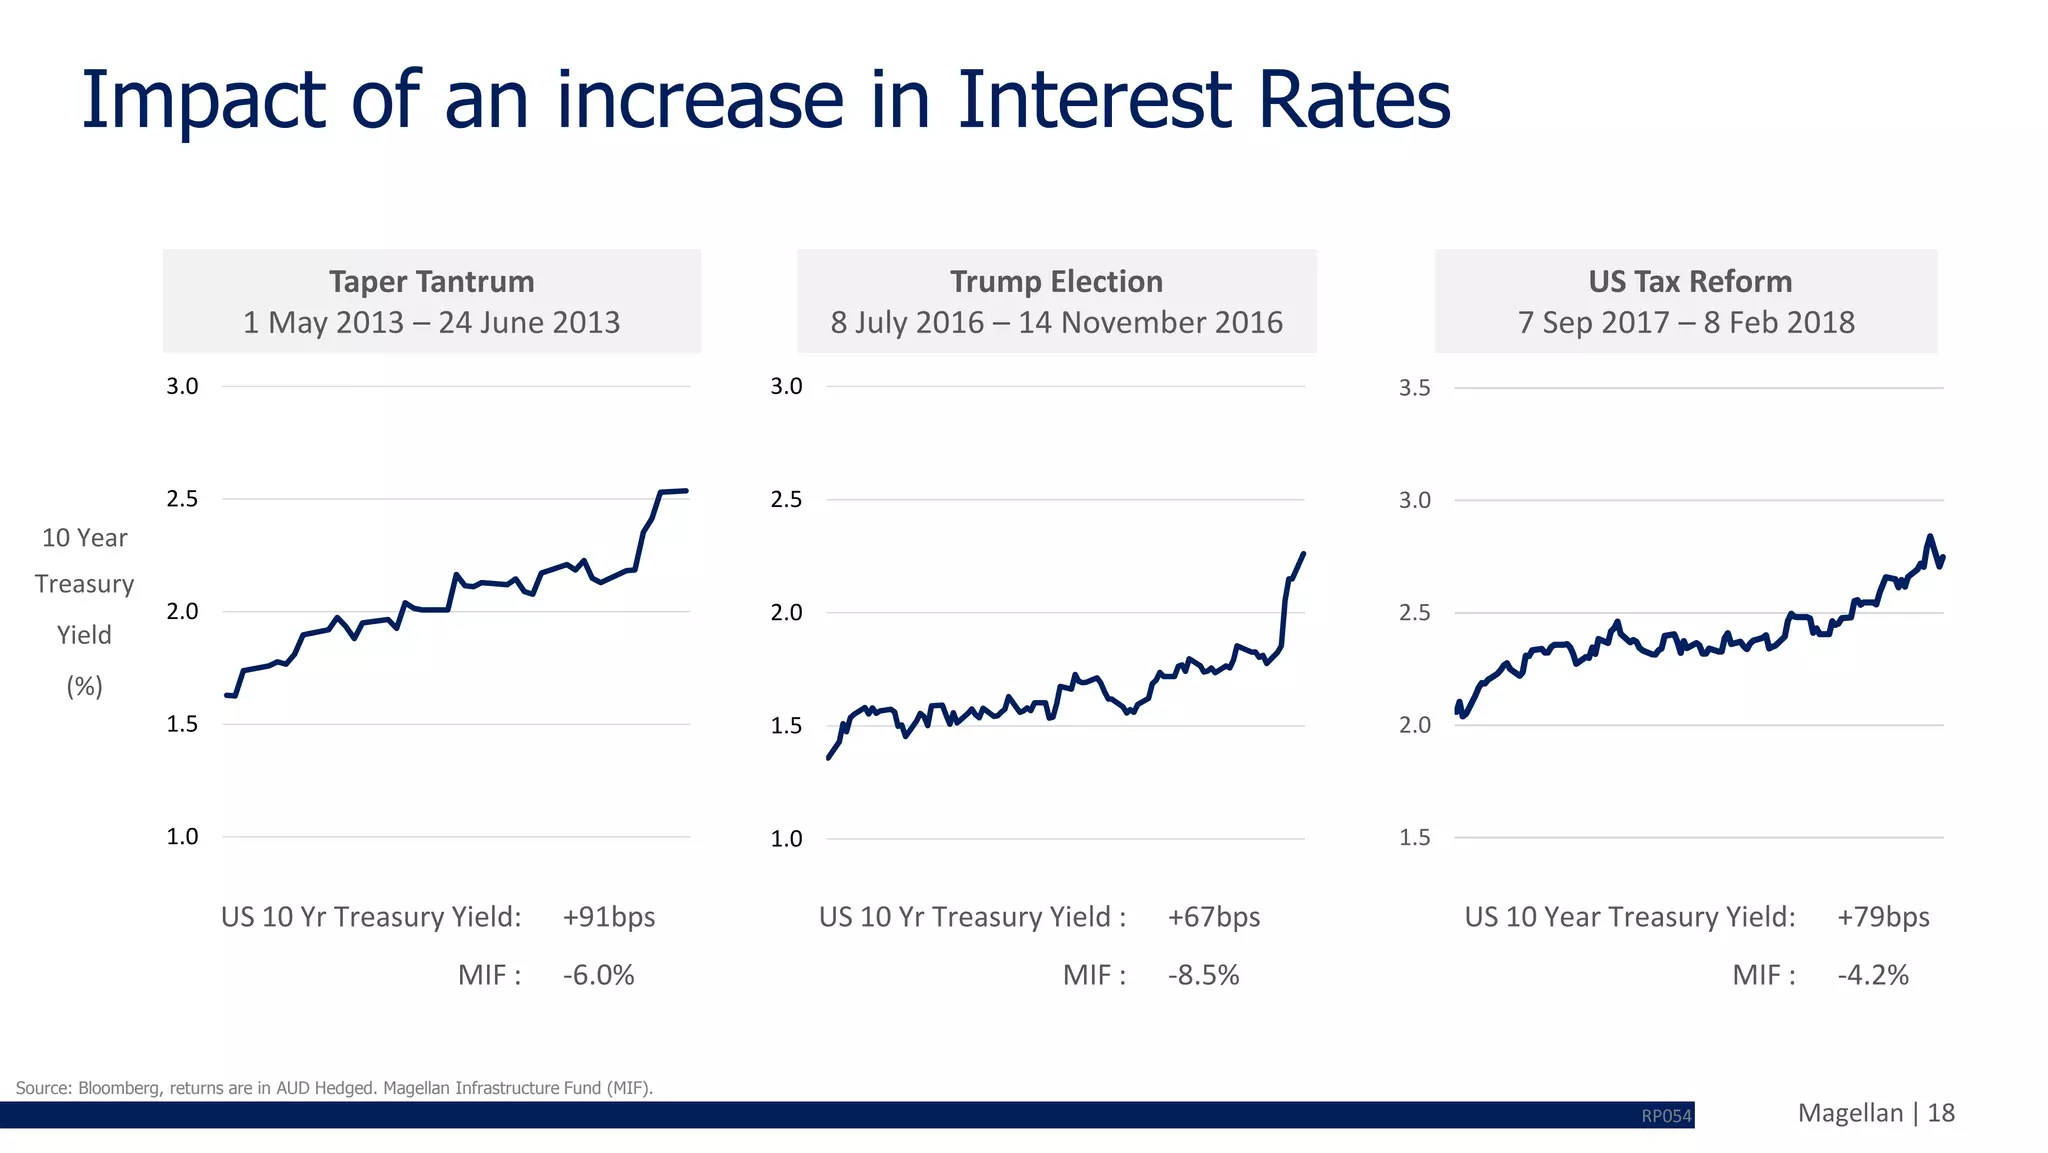
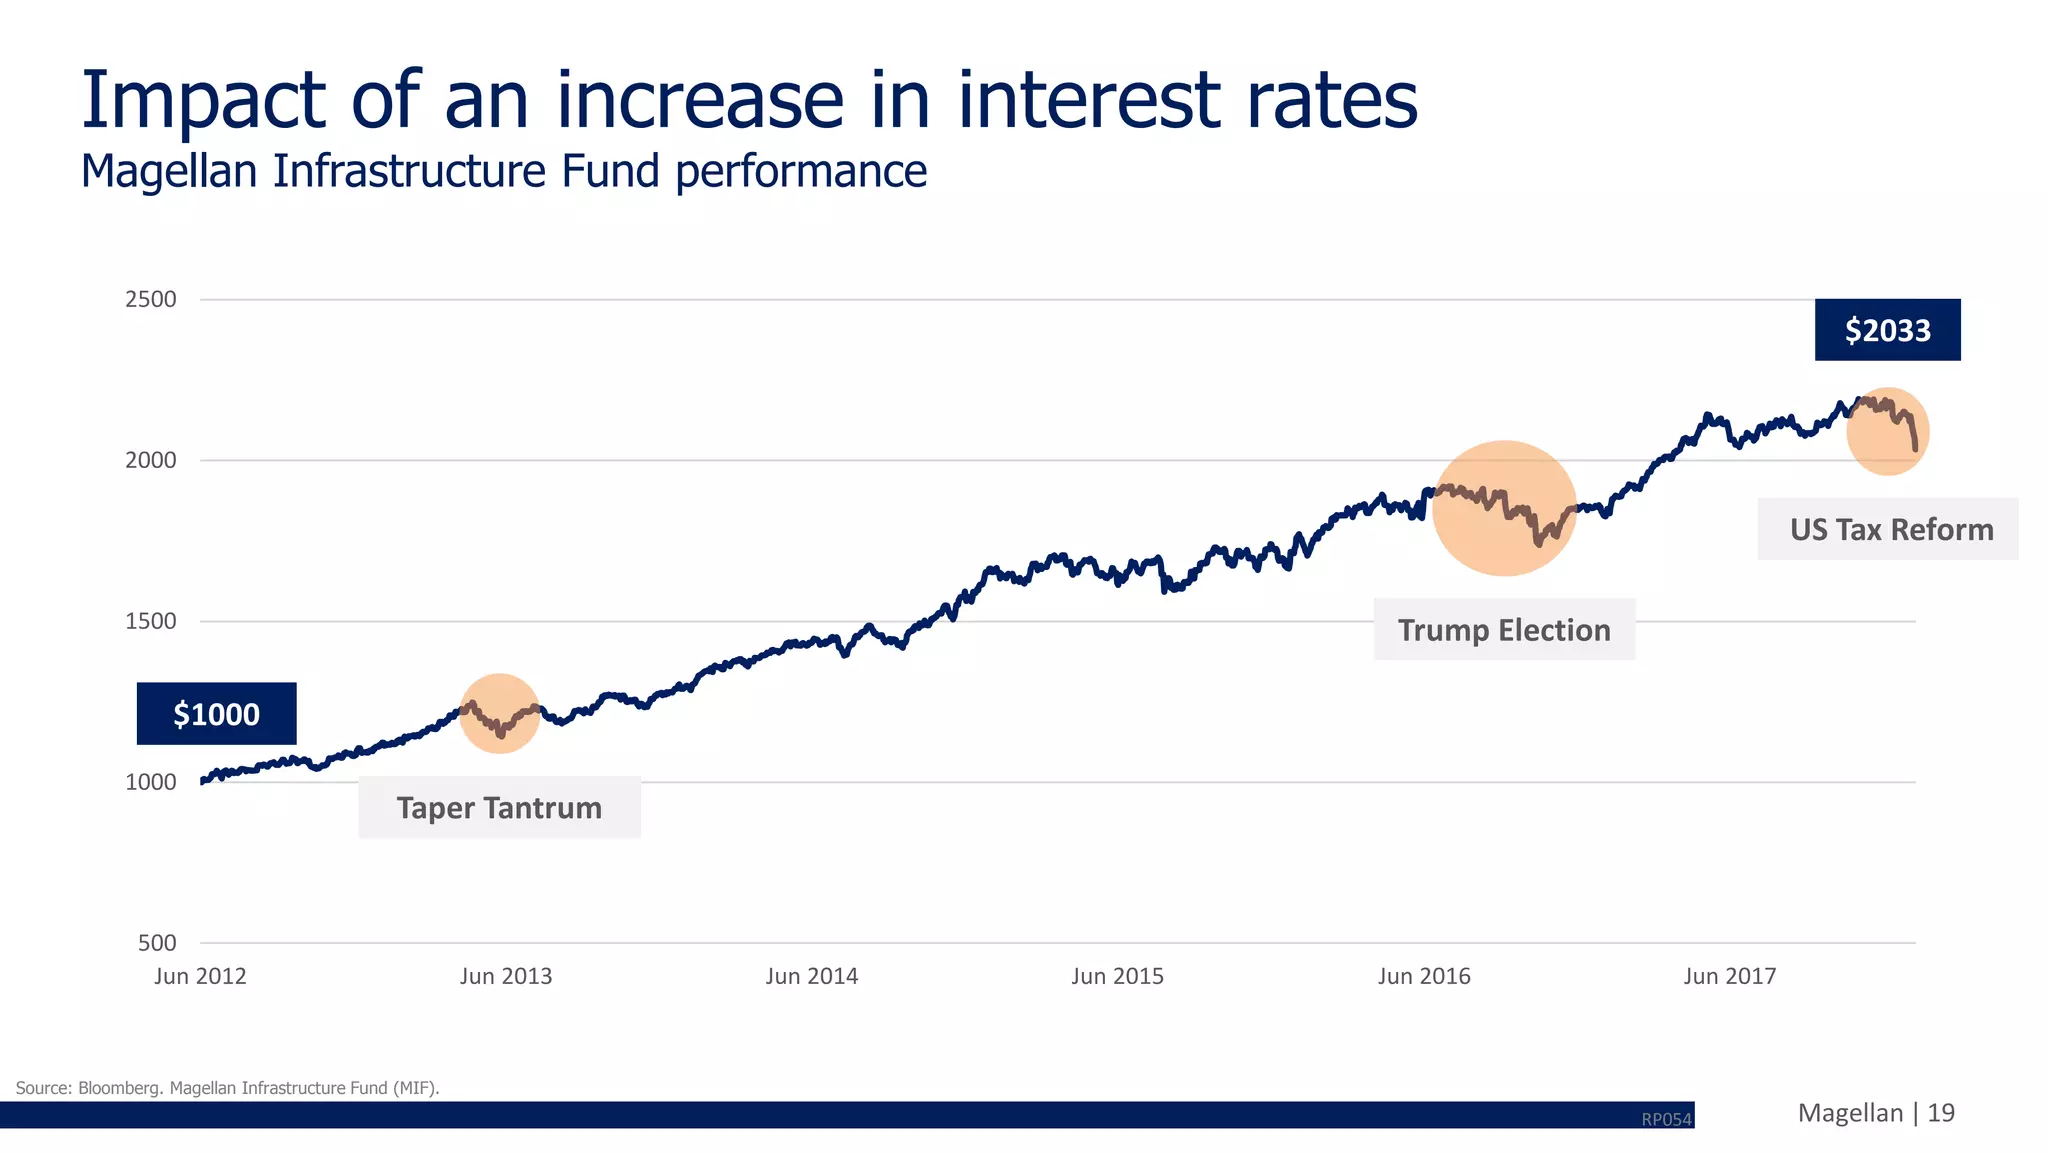
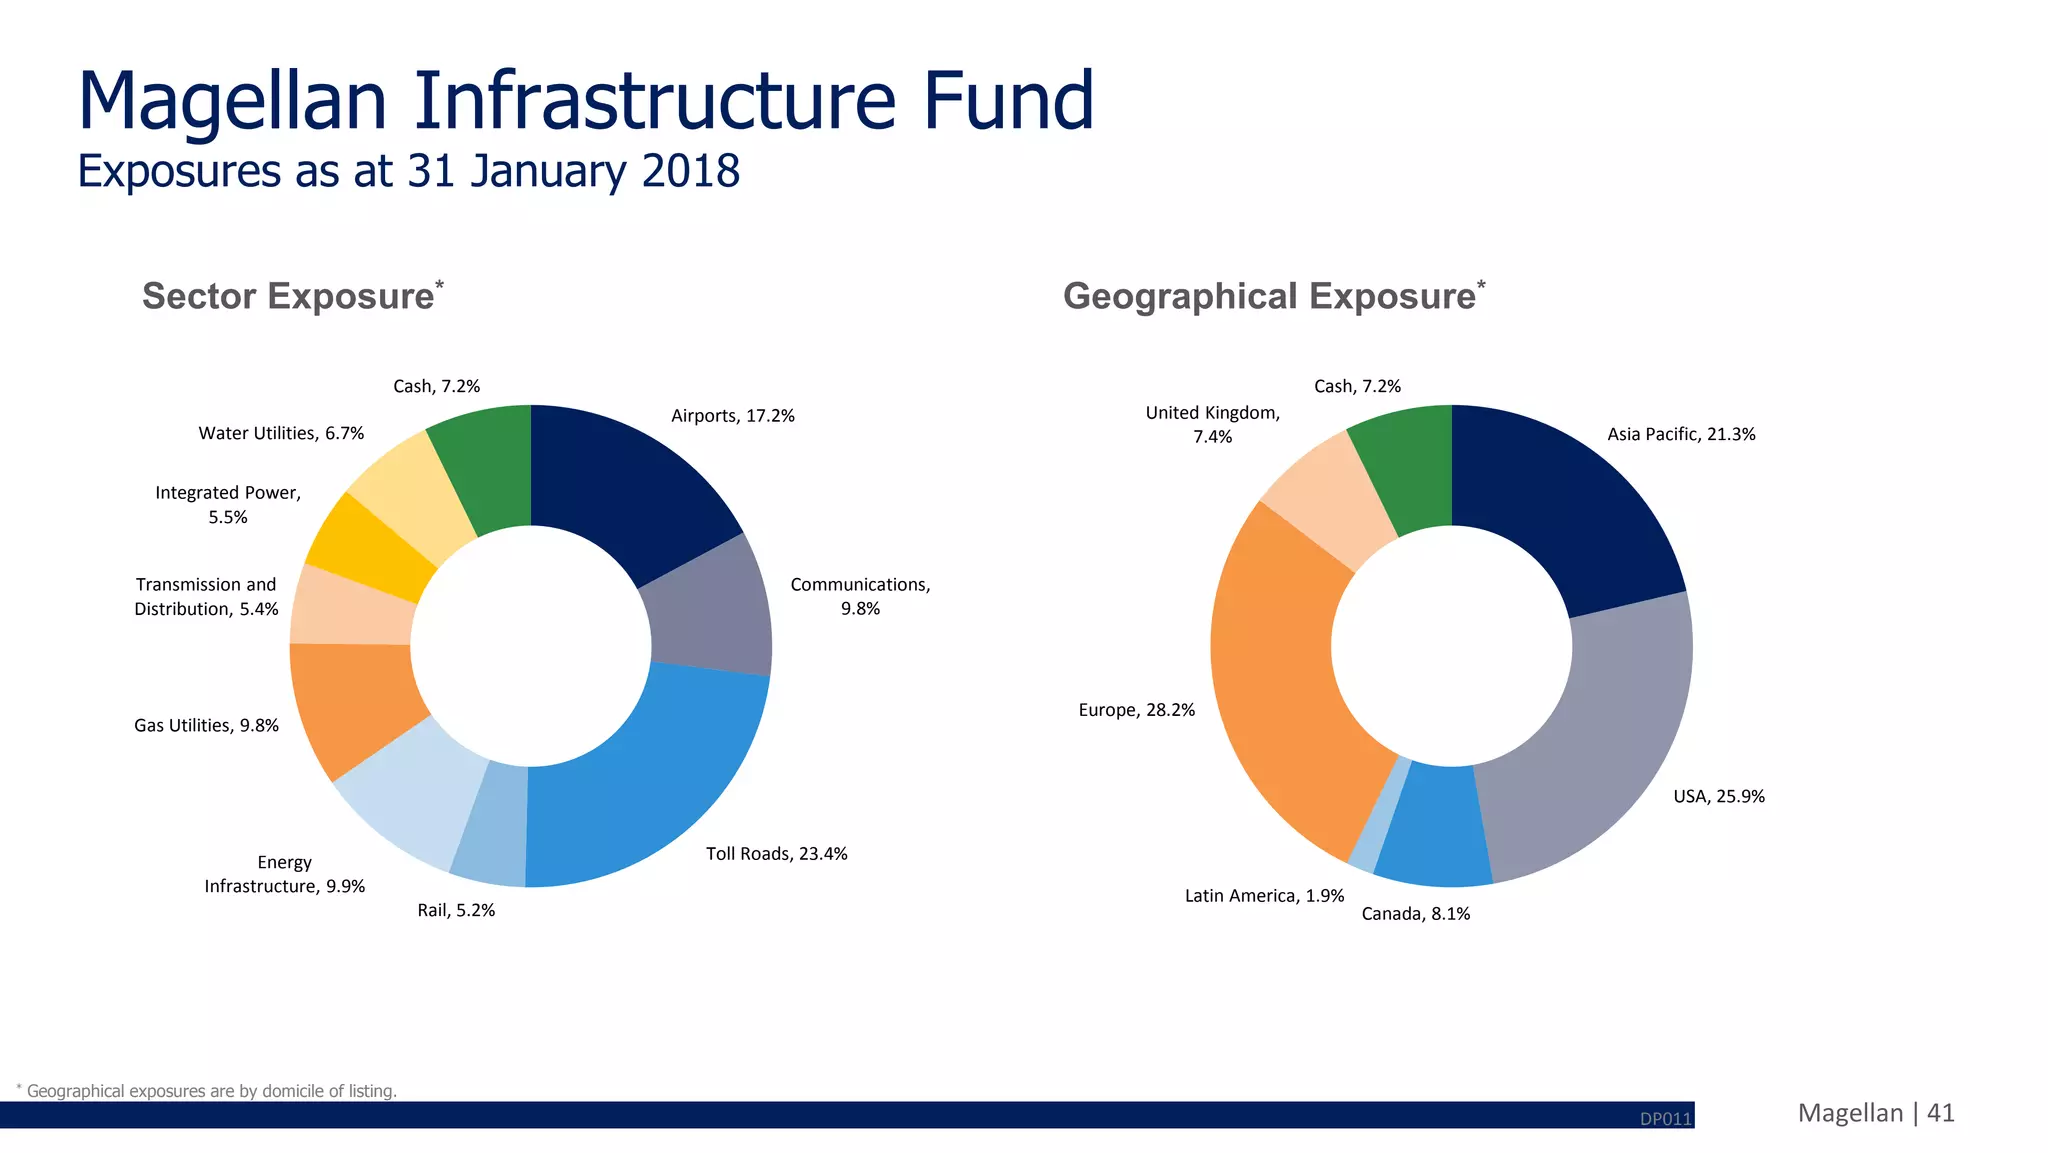
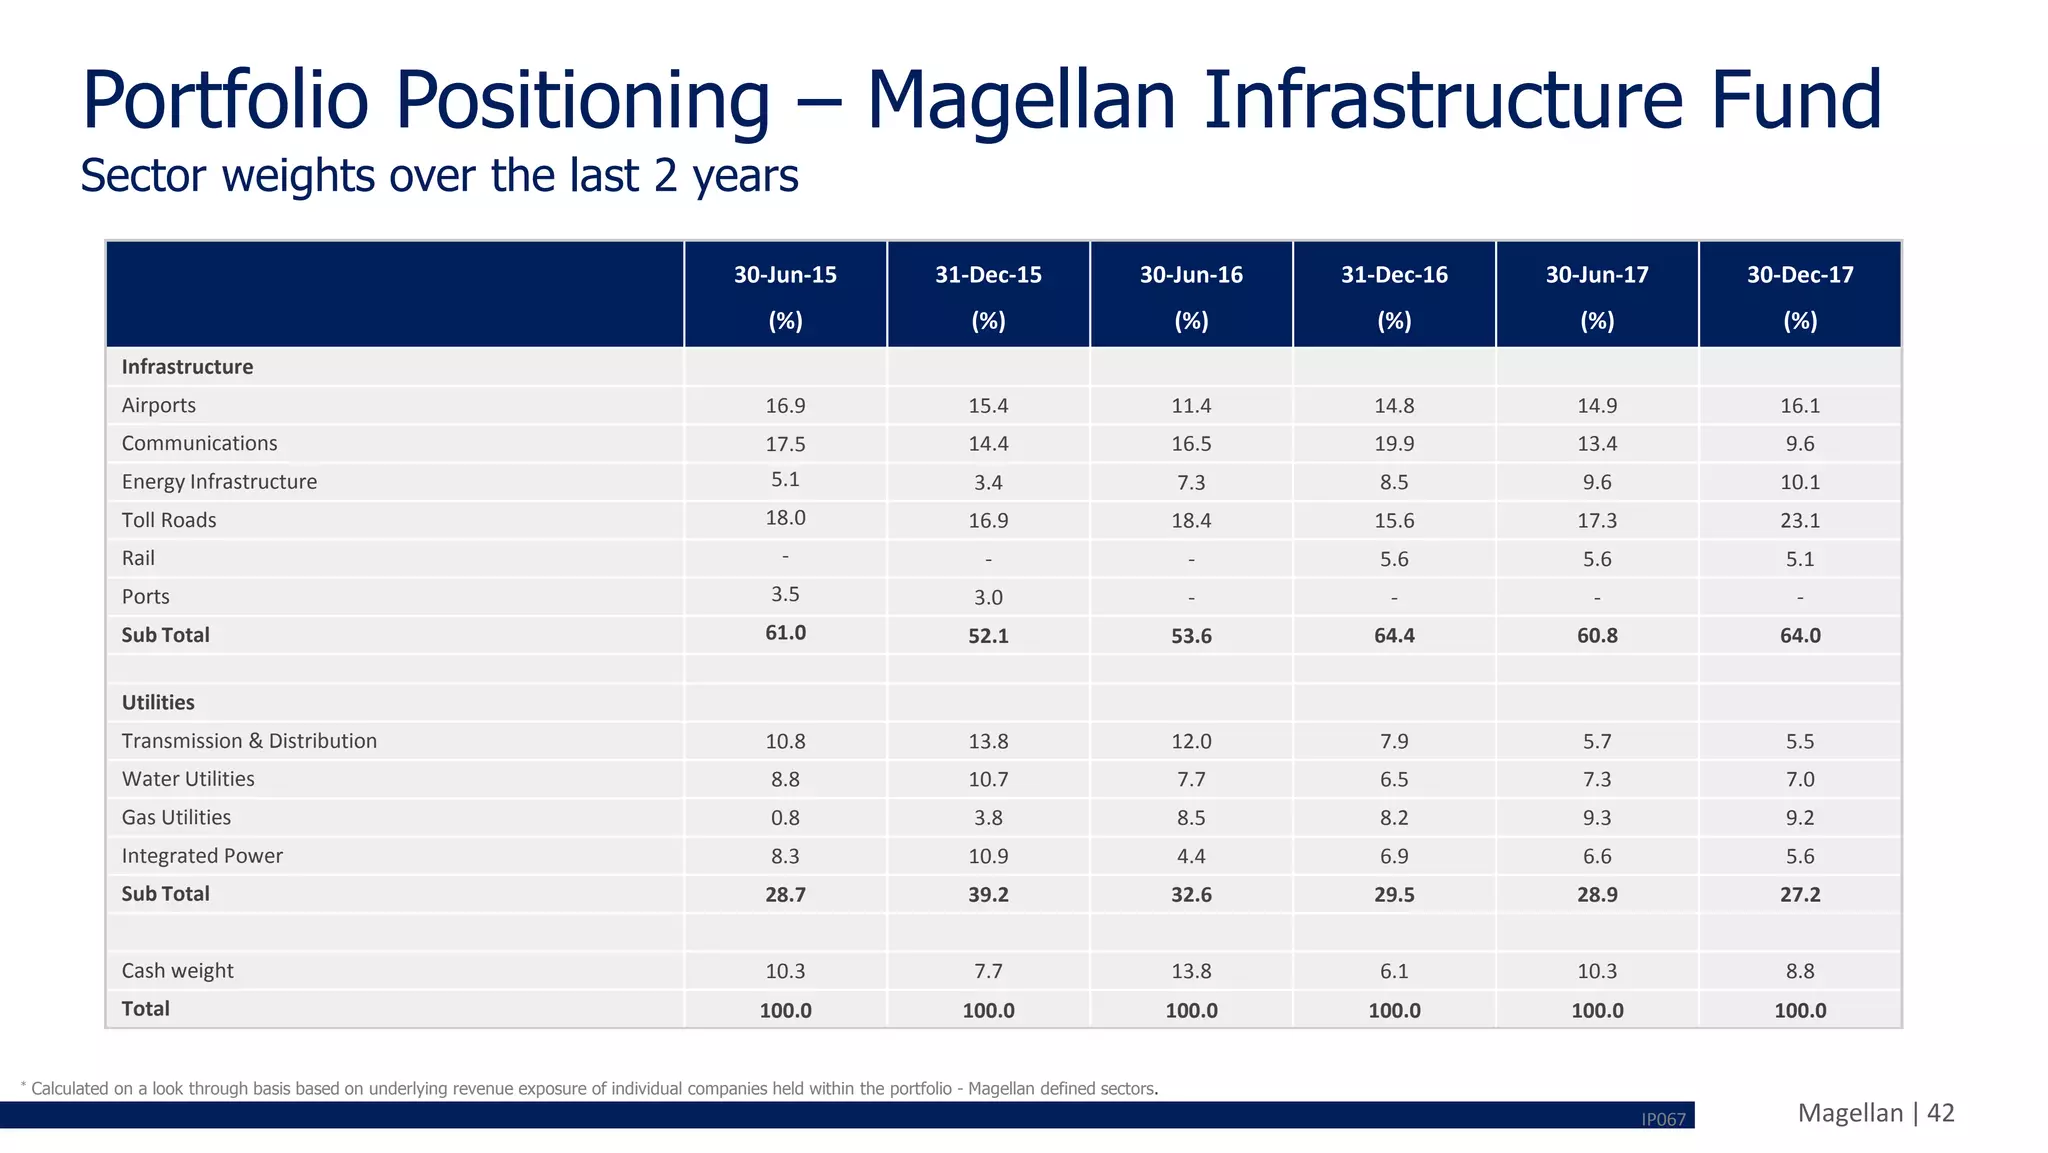
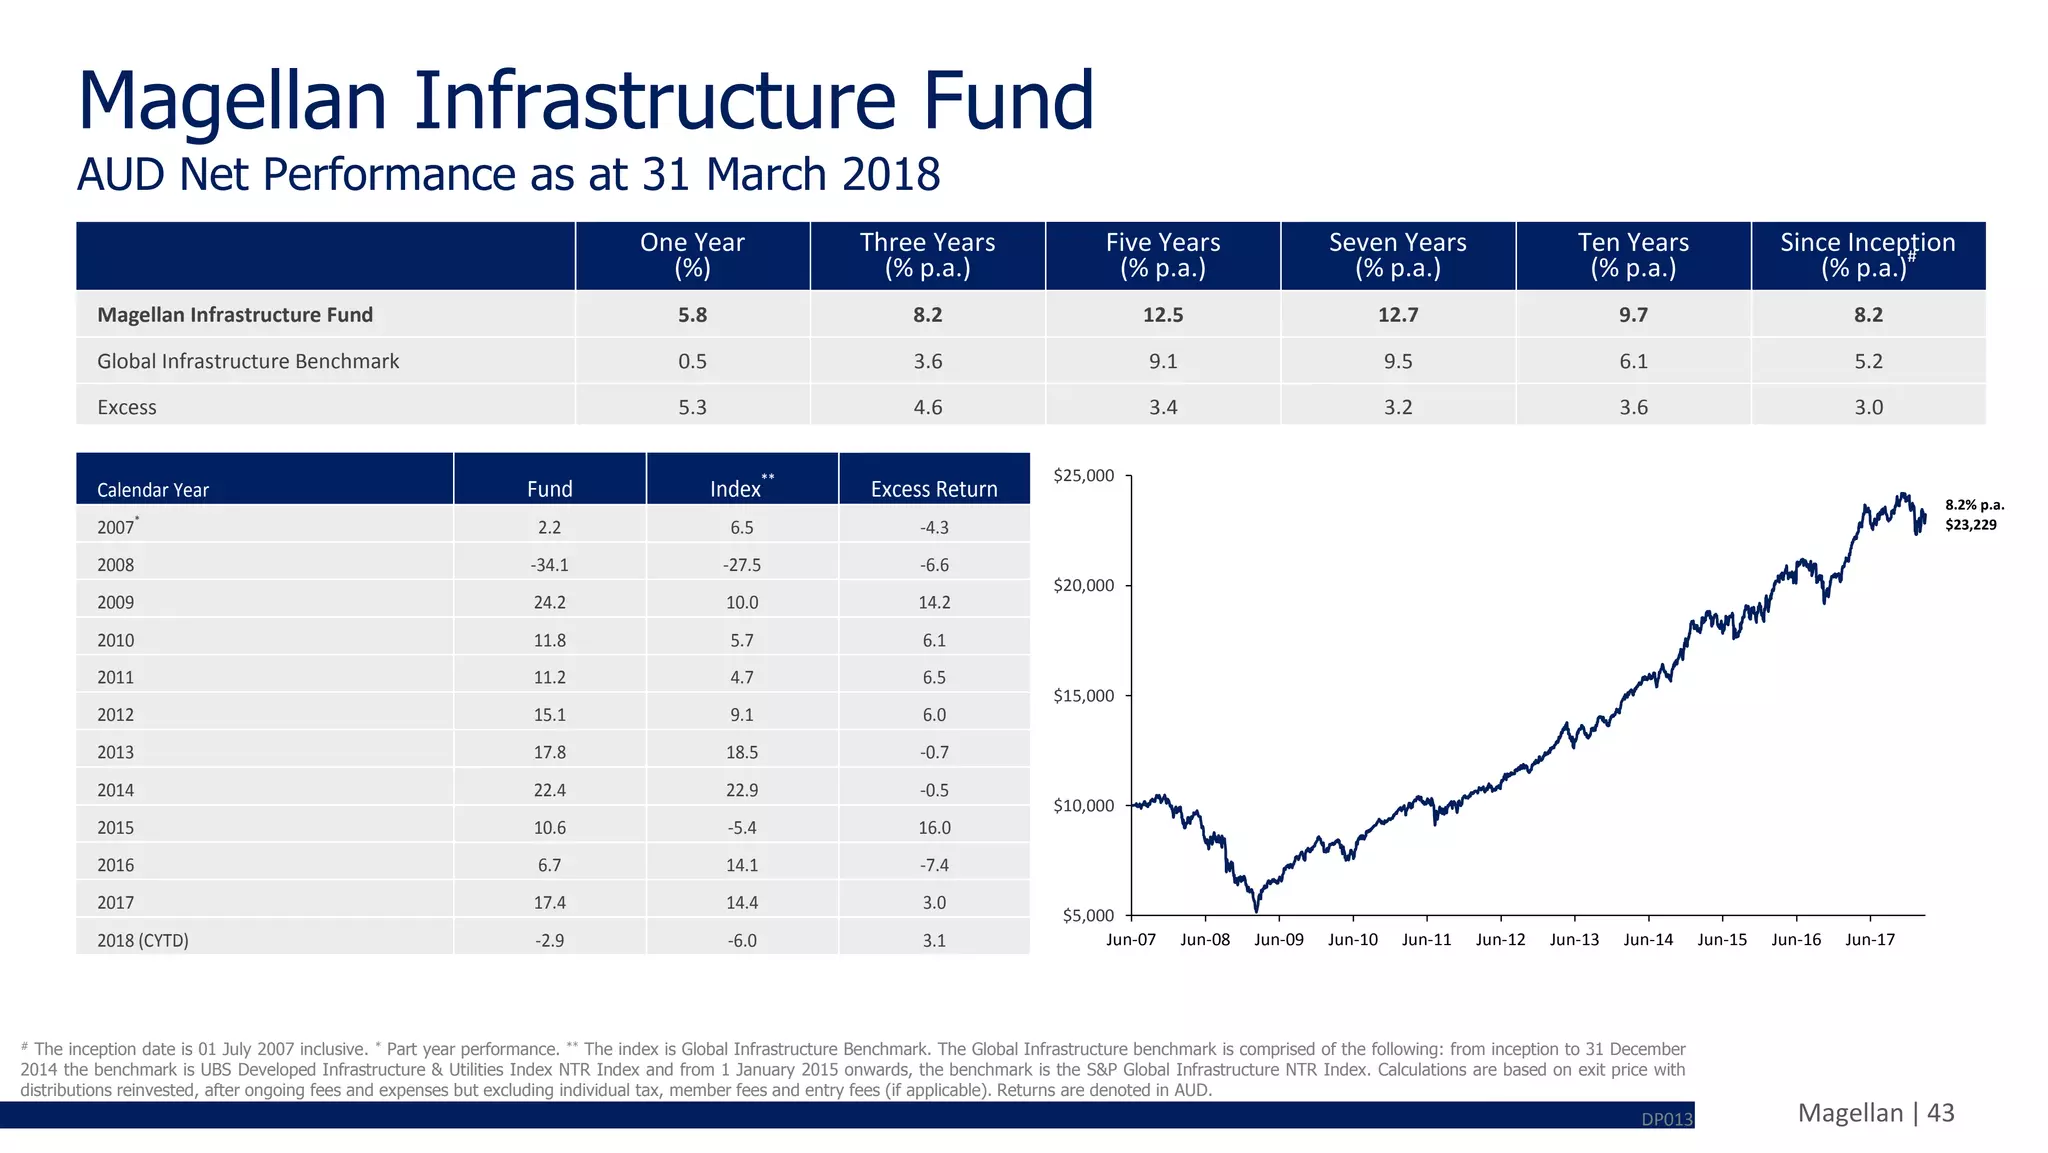
Protecting your portfolio
with infrastructure
Presented by
Ofer Karliner
Portfolio Manager
Magellan Asset Management
18 April 2018
| netwealth
This webinar is being recorded.
• Slides will be sent to you after the webinar
Enter your questions in the chat.
• We will get to them at the end of the webinar
Posting to social?
• Make sure to use #netwealthinvest or tweet @netwealthInvest
2
Housekeeping
Webinar Series
| netwealth3
This webinar and information has been prepared and issued by Netwealth Investments Limited (Netwealth),ABN 85 090 569 109,
AFSL 230975. It contains factual information and general financial product advice only and has been prepared without taking into
account the objectives, financial situation or needs of any individual.The information provided is not intended to be a substitute for
professional financial product advice and you should determine its appropriateness having regard to you or your client’s particular
circumstances.The relevant disclosure document should be obtained from Netwealth and considered before deciding whether to
acquire, dispose of, or to continue to hold, an investment in any Netwealth product.
While all care has been taken in the preparation of this document (using sources believed to be reliable and accurate), no person,
including Netwealth, or any other member of the Netwealth group of companies, accepts responsibility for any loss suffered by any
person arising from reliance on this information.
Disclaimer
Webinar Series
| netwealth Webinar Series4
Ofer Karliner
Portfolio Manager
Magellan Asset
Management
Meet today’s speaker
Magellan | 5
Important Information
This presentation (‘Presentation’) has been produced by Magellan Asset Management Limited (‘Magellan’) ABN 31 120 593 946, AFS Licence No 304 301 and has been prepared for informational and
discussion purposes only and does not constitute an offer to sell or a solicitation of an offer to purchase any security or financial product or service. Any such offer or solicitation shall be made only
pursuant to a Product Disclosure Statement, Information Memorandum or other offer document (collectively ‘Offer Document’) relating to a Magellan financial product or service. A copy of the relevant
Offer Document relating to a Magellan product or service may be obtained by calling Magellan on +61 2 9235 4888 or by visiting www.magellangroup.com.au. This Presentation does not constitute a
part of any Offer Document issued by Magellan. The information contained in this Presentation may not be reproduced, used or disclosed, in whole or in part, without the prior written consent of
Magellan.
Past performance is not necessarily indicative of future results and no person guarantees the performance of any Magellan financial product or service or the amount or timing of any return from it.
There can be no assurance that a Magellan financial product or service will achieve any targeted returns, that asset allocations will be met or that a Magellan financial product or service will be able to
implement its investment strategy and investment approach or achieve its investment objective.
Statements contained in this Presentation that are not historical facts are based on current expectations, estimates, projections, opinions and beliefs of Magellan. Such statements involve known and
unknown risks, uncertainties and other factors, and undue reliance should not be placed thereon. Additionally, this Presentation may contain “forward-looking statements”. Actual events or results or
the actual performance of a Magellan financial product or service may differ materially from those reflected or contemplated in such forward-looking statements.
Certain economic, market or company information contained herein has been obtained from published sources prepared by third parties. While such sources are believed to be reliable, neither
Magellan or any of its respective officers or employees assumes any responsibility for the accuracy or completeness of such information. None of Magellan or any of its respective officers or employees
has made any representation or warranty, express or implied, with respect to the correctness, accuracy, reasonableness or completeness of any of the information contained in this and they expressly
disclaim any responsibility or liability therefore. No person, including Magellan has any responsibility to update any of the information provided in this Presentation.
Neither this Presentation nor the provision of any Offer Document issued by Magellan is, and must not be regarded as, advice or a recommendation or opinion in relation to a Magellan financial product
or service, or that an investment in a Magellan financial product or service is suitable for you or any other person. Neither this Presentation nor any Offer Document issued by Magellan takes into
account your investment objectives, financial situation and particular needs. In addition to carefully reading the relevant Offer Document issued by Magellan you should, before deciding whether to
invest in a Magellan financial product or service, consider the appropriateness of investing or continuing to invest, having regard to your own objectives, financial situation or needs. Magellan strongly
recommends that you obtain independent financial, legal and taxation advice before deciding whether to invest in a Magellan financial product or service.
Any trademarks, logos, and service marks contained herein may be the registered and unregistered trademarks of their respective owners. Nothing contained herein should be construed as granting by
implication, or otherwise, any license or right to use any trademark displayed without the written permission of the owner.
Magellan | 6
Infrastructure - the importance of definition
Magellan | 7
Magellan’s definition of infrastructure
Strict definition: critical to reliable earnings through the economic cycle
We believe that for an asset to be defined as “infrastructure” it must meet two key requirements:
Assets that meet these requirements provide investors with a highly defensive, inflation-linked exposure that
exhibits low correlation with other asset classes
1. Essential for the efficient functioning
of a community; and
2. Earnings are not sensitive to
competition, commodity price
movements or sovereign risk
Demand is predictable
Cash flows are reliable
SP001
Magellan | 8
Power industry example
A disciplined approach to defining what constitutes “infrastructure” is essential to
achieving reliable returns
Generation
Unregulated
Retailing
Unregulated
Transmission
100% Regulated
Distribution
100% Regulated
Magellan does not consider competitive power generation assets as infrastructure yet such companies
are routinely included in commonly used benchmark indices.
SP001
Magellan | 9
The Infrastructure universe
130 stocks with a market capitalisation of more than US$1.5 trillion
Transport SocialUtilities
Water Utilities
Gas Utilities
Energy Transmission
and Distribution
Airports
Toll Roads
Ports
Rail
Pipelines
Communication
Hospitals
Schools
PrisonsPower Generation Master Limited Partnerships
Car parksPower Retailers
SP001
Magellan | 10
Strict application delivers downside protection
“Pure Infrastructure” is the MFG Core Infrastructure Index (local currency), “Standard Infrastructure” is the UBS Developed Infrastructure & Utilities TR Index (USD Hedged) and “Global Equities” is the MSCI World Total
Return Index (local currency). The MFG Core Infrastructure is based on a model portfolio and is a representation of the Global Core Infrastructure Composite. The model portfolio is not part of the composite. This
information supplements the GIPS compliant report, available in the appendix to this presentation.
Tech Wreck Global Financial Crisis
40
60
80
100
120
140
160
180
200
220
Dec-00 Dec-01 Dec-02 Dec-03 Dec-04 Dec-05
'Pure' Infrastructure
Standard Infrastructure
Global Equities
48 months
48%
40
60
80
100
120
140
160
180
200
Dec-07 Dec-08 Dec-09 Dec-10 Dec-11 Dec-12 Dec-13
'Pure' Infrastructure
Standard Infrastructure
Global Equities
33 months
64 months
45%
IP053
Magellan | 11
Investment objectives & outcomes
Magellan | 12
Infrastructure investment objective
Achieve attractive risk-adjusted returns
over the medium to long term
(Target returns of at least CPI + 5% through the economic cycle)
Protect capital in adverse markets
IP053
Magellan | 13
# The inception date is 01 July 2007 inclusive. * Part year performance. ** The index is Global Infrastructure Benchmark. Calculations are based on exit price with distributions reinvested, after ongoing fees and expenses
but excluding individual tax, member fees and entry fees (if applicable). Returns are denoted in AUD. The Global Infrastructure benchmark is comprised of the following: from inception to 31 December 2014 the
benchmark is UBS Developed Infrastructure & Utilities Index NTR Index and from 1 January 2015 onwards, the benchmark is the S&P Global Infrastructure NTR Index.
2007*
(%)
2008
(%)
2009
(%)
2010
(%)
2011
(%)
2012
(%)
2013
(%)
2014
(%)
2015
(%)
2016
(%)
2017
(%)
Fund 2.2 -34.1 24.2 11.8 11.2 15.1 17.8 22.4 10.6 6.7 17.4
Index ** 6.5 -27.5 10.0 5.7 4.7 9.1 18.5 22.9 -5.4 14.1 14.4
Excess -4.3 -6.6 14.2 6.1 6.5 6.0 -0.7 -0.5 16.0 -7.4 3.0
Magellan Infrastructure
Fund
Global Infrastructure
Benchmark
FTSE Global Core 50/50
Dow Jones Brookfield
Global Infrastructure TR
Index
FTSE EPRA FTSE NAREIT
Developed NTR Index
Downside Capture against MSCI -0.1 0.5 0.3 0.4 0.3
2. Protecting capital in adverse markets – 5 Years to 31 December 2017
Delivering to our objectives
1. Consistently delivering returns over the cycle – as at 31 December 2017
IP072
One Year
(%)
Three Years
(% p.a.)
Five Years
(% p.a.)
Seven Years
(% p.a.)
Ten Years
(% p.a.)
Since Inception
(% p.a.)#
Magellan Infrastructure Fund 17.4 11.5 14.9 14.4 8.9 8.7
Global Infrastructure Benchmark 14.4 7.3 12.4 10.8 5.6 6.0
Excess 3.0 4.2 2.5 3.6 3.3 2.7
Magellan | 14
Strict application protects capital
Date Range
WTI Crude
USD
Alerian MLP Index
USD
S&P Global
Infrastructure
NTR Index
AUD Hedged
MSCI World NTR
AUD Hedged
Magellan
Infrastructure
Fund
January 2010 – August 2010 -9.4% 17.1% -0.9% -3.6% 3.1%
September 2010 – April 2011 58.4% 27.0% 15.8% 25.4% 18.8%
May 2011 – September 2011 -30.5% -10.6% -9.0% -16.1% -3.7%
October 2011 – February 2012 35.2% 23.6% 12.2% 19.0% 7.8%
March 2012 – June 2014 -1.6% 46.4% 46.4% 52.1% 49.0%
July 2014 – January 2016 -68.1% -46.0% -0.6% 3.5% 22.5%
February 2016 – December 2017 73.9% 24.4% 30.2% 39.7% 23.2%
Impact of oil price movements
Returns for the Magellan Infrastructure Fund are based on hedged AUD net returns.
RP053
Magellan | 15
Returns and Risk Measures are after fees. The Global Infrastructure benchmark is comprised of the following: from inception to 31 December 2014 the benchmark is UBS Developed Infrastructure & Utilities Index NTR
Index (Hedged in AUD) and from 1 January 2015 onwards, the benchmark is the S&P Global Infrastructure NTR Index (Hedged in AUD).
Magellan Infrastructure
Fund
Global Infrastructure
Benchmark
ASX S&P 200 Index
MSCI World NTR Index
AUD Hedged
Returns (p.a.) 14.9% 12.4% 10.2% 15.2%
Standard Deviation 8.2% 9.2% 11.4% 9.1%
Reward for Risk 1.8 1.4 0.9 1.7
Downside Capture – MSCI -0.1 0.5 0.7 1.0
Downside Capture - ASX 200 0.0 0.1 1.0 0.1
Beta – MSCI 0.4 0.6 0.8 1.0
Correlation – MSCI 0.4 0.6 0.7 1.0
Upside Capture – MSCI 0.6 0.7 0.7 1.0
Magellan Infrastructure Fund - Characteristics
AUD Hedged Performance – 5 Years to 31 December 2017
RP053
Magellan | 16
What about interest rates?
Magellan | 17
Impact of Interest Rates on Financial Performance
• Impact of an increase in interest rates on infrastructure businesses is limited:
 Utilities – Economic regulation allows for changes in interest rates (i.e. increased borrowing costs) to be passed
through to customers
 Infrastructure – Where increases in interest rates are a consequence of rising inflation then this is captured in
toll/price increases
• Infrastructure firms have taken advantage of debt market conditions to lock-in low interest rates well into the
future
 In March 2017, American Tower raise €500m issued 8 year debt at 1.39%
 In May 2017, Zurich Airport raised CHF350m for 12 years at 0.6214%.
 In November 2017, APRR raised €700m of 15 year debt 1.52%.
 In December 2017, Aeroports de Paris issued €500m of 10 year debt at 1.04%.
 In January 2018, Italgas issued €500m of 11 year bonds at 1.625%
IP053
Magellan | 18
Impact of an increase in Interest Rates
Source: Bloomberg, returns are in AUD Hedged. Magellan Infrastructure Fund (MIF).
Taper Tantrum
1 May 2013 – 24 June 2013
Trump Election
8 July 2016 – 14 November 2016
10 Year
Treasury
Yield
(%)
1.0
1.5
2.0
2.5
3.0
1.0
1.5
2.0
2.5
3.0
1.5
2.0
2.5
3.0
3.5
US Tax Reform
7 Sep 2017 – 8 Feb 2018
US 10 Yr Treasury Yield: +91bps
MIF : -6.0%
US 10 Yr Treasury Yield : +67bps
MIF : -8.5%
US 10 Year Treasury Yield: +79bps
MIF : -4.2%
RP054
Magellan | 19
500
1000
1500
2000
2500
Jun 2012 Jun 2013 Jun 2014 Jun 2015 Jun 2016 Jun 2017
Impact of an increase in interest rates
Magellan Infrastructure Fund performance
Source: Bloomberg. Magellan Infrastructure Fund (MIF).
RP054
Taper Tantrum
Trump Election
US Tax Reform
$2033
$1000
Magellan | 20
Infrastructure – reliable earnings
Magellan | 21
Utilities – Nature of Returns
The regulation of utility earnings leads to stable financial results and
ultimately stable investment returns
Regulation typically allows utilities
to earn fair returns with low
potential for loss. the utility is
protected from:
− Changes in demand;
− Inflation; and
− Changes in interest rates.
Regulation is administered by a
government body and is
transparent and simple.
The regulation of earnings
leads to stable financial results
Stable financial results and
transparent regulation lead
to stable values for utilities.
SP001
Magellan | 22
Why is Financial Performance so Stable?
Magellan Asset Management Limited analysis.
Regulators allow utilities to generate a fair return on the capital used in their businesses
5%
6%
7%
8%
9%
10%
11%
12%
13%
14%
15%
US Electricity and Gas Utilities - Regulated ROEs
Average Regulated ROE = 10.5%
RP012
Magellan | 23
Utilities - Financial Performance
Because of the regulated nature of utilities, the historical returns from regulated utilities
have been stable through the recession
Source: Company accounts, Magellan Asset Management Limited analysis. Utility group includes Alliant Energy, Atmos Energy, Consolidated Edison, ITC, Southwest Gas, Southern Company, Westar Energy, WGL,
Wisconsin Energy & Xcel Energy.
6%
7%
8%
9%
10%
11%
12%
13%
14%
15%
2005 2006 2007 2008 2009 2010 2011 2012 2013 2014 2015
Return On Equity from 2005 to 2015 for the
Magellan US Regulated Energy Utilities Index
RP012
Magellan | 24
Cost
($ per megawatt-hour)
Total Cost
(LCOE)
Tax credits
Net cost
(LCOE)
Combined-Cycle Gas Turbine
(conventional)
58.6 na 58.6
Nuclear 96.2 na 96.2
Wind (onshore) 55.9 -11.6 44.3
Solar PV 73.7 -15.6 58.1
Technology Impacts
“Grid Scale” Renewables – becoming cost competitive
Source: Left, International Energy Agency 2016, estimated levelized cost of energy (LCOE) for plants entering service in 2022. Right, National Geographic.
RP041
Magellan | 25
Technology impacts
“Distributed Power” – costs continue to decline
Source: Left, Lawrence Berkeley National Laboratory, Tracking the Sun IX, August 2016. Right, Renew Economy.
RP041
Magellan | 26
Batteries could provide a solution to this problem
Does Distributed Generation + Batteries = End of the Grid?
We don’t see this as likely
(1) creating reliable stand-alone system is expensive
(2) being connected to the grid provides huge redundancy
(3) not all houses can self generate
A single Tesla Power wall has peak capacity of 7kW, and continuous
capacity of 5kW. A kettle is at least 2.5kW, a hairdyer is 2kW, and
basic air conditioners are more than 3.5kW for a single unit.
Technology impacts
What about the rise of batteries?
Source: Tesla
RP041
Magellan | 27
Disconnecting from the grid expensive:
Grid power = Cheaper + More reliable
What do grids provide?
Grid power = redundancy + shared assets
Source: Grattan Institute – Sundown, sunrise, 2015
Technology impacts
Batteries – remain prohibitively expensive
RP041
Magellan | 28
Source: Tesla, BMW
Electric cars still a small percentage of the global fleet
However, households that purchase EVs will require
significantly larger amounts of energy:
– Average Sydney house consumes 6.9MWh of
electricity each year
– Adding a Tesla Model S that is driven the 14,600km
per year, electricity consumption increases ~60%.
Technology impacts
Electric cars
RP041
Magellan | 29
Transport – nature of returns
Because revenues and earnings grow in line with patronage growth, infrastructure
assets are able to earn high returns
Revenue = Volume X Price
Toll Road Revenue = Number of cars x Average Toll
Airport Revenue = Number of passengers x Average Price
Port Revenue = Number of containers x Average Charge
1. Earnings are not
constrained by regulation
2. Patronage growth has a
direct impact on financial
returns
Regulation is typically imposed on
prices not earnings
SP001
Magellan | 30
Urban toll roads
Source: Transurban Group, Magellan Asset Management Limited analysis.
-
0.50
1.00
1.50
2.00
2.50
3.00
2006 2007 2008 2009 2010 2011 2012 2013 2014 2015 2016
Index CityLink - Traffic, Revenue and EBITDA (2006 to 2016)
Traffic Index Revenue Index EBITDA Index
EBITDA
CAGR 9.3%
Revenue
CAGR 8.1%
Traffic
CAGR 2.5%
Reliable earnings growth reflects patronage growth combined with inflation indexation.
RP012
Magellan | 31
Cars dominate large city transport
The complexity of modern trips and the historic focus of public transport on the CBD
makes car travel unavoidable for most people
Source: Transport NSW, Magellan Asset Management Limited analysis.
0%
10%
20%
30%
40%
50%
60%
70%
80%
90%
Car Train Bus Walk Only Other
Weekday Trips in Sydney
Distance Travelled in 2011/12
RP012
Magellan | 32
Demand for roads is linked to wealth
Source: World Bank 2014, Magellan Asset Management Limited analysis.
0
100
200
300
400
500
600
700
800
900
$0 $10,000 $20,000 $30,000 $40,000 $50,000 $60,000 $70,000 $80,000 $90,000 $100,000
Vehiclesper1000people
GDP Per Capita US$
Wealth & Vehicle Ownership
USA
Barbados
Australia
Kuwait
Norway
Brunei
United Arab Emirates
Hong Kong
Singapore
Luxembourg
Greece
New Zealand
Canada
Iceland
Switzerland
China
Equatorial Guinea
Finland
Oman
TaiwanSaudi Arabia
Italy
Malta
Ireland
Brazil Chile
Spain
France
RP012
Magellan | 33
Demand for roads is linked to wealth
Source: Roads & Traffic Authority, NSW Government, Magellan Asset Management Limited.
-
50,000
100,000
150,000
200,000
250,000
300,000
1950 1953 1956 1959 1962 1965 1968 1971 1974 1977 1980 1983 1986 1989 1992 1995 1998 2001 2004 2007 2010 2013
No.Vehicles
SHB + SHT
Sydney Harbour Bridge (SHB) and Sydney Harbour Tunnel (SHT)
Average Daily Traffic (1950 - 2015)
RP012
Magellan | 34
New capacity can induce demand
Source: Roads & Traffic Authority, NSW Government, Magellan Asset Management Limited.
-
50,000
100,000
150,000
200,000
250,000
300,000
1932 1935 1938 1941 1944 1947 1950 1953 1956 1959 1962 1965 1968 1971 1974 1977 1980 1983 1986 1989 1992 1995 1998 2001 2004 2007 2010 2013
No.Vehicles
SHB SHT
Sydney Harbour Bridge (SHB) and Sydney Harbour Tunnel (SHT)
Average Daily Traffic (1950 – 2015)
RP011
Magellan | 35
Corridor effect - Toll roads capture bulk of traffic
The toll road is often the only available capacity within the corridor and so benefits
from all the growth in the total corridor
Source: RTA Traffic Data.
-
50,000
100,000
150,000
200,000
250,000
1987 1989 1991 1993 1996 1999 2002 2005 2012 2016
AverageDailyTraffic
Hume Highway Canterbury Rd M5 Main Toll Plaza
RP012
Traffic growth:
Corridor: 2.7%; free -0.1%; plaza +7.7%.
Magellan | 36
Toll Roads exhibit low price elasticity
Tolls on Sydney’s Eastern Distributor have been increased multiple times since it
opened with no measurable impact on traffic numbers
Source: Transurban Group.
RP012
20,000
25,000
30,000
35,000
40,000
45,000
50,000
55,000
60,000
2000 2001 2002 2003 2004 2005 2006 2007 2008 2009 2010 2011 2012 2013 2014 2015 2016
Eastern Distributor Average Daily Traffic
$3.00
$5.00
$4.50
$4.00
$3.50
$5.50 $6.00
$6.48
Tolls: Up 123%
Traffic: Up 106%
$6.34
$6.68
Magellan | 37
Technology impacts
• 1.2 million road deaths annually
• Cars are only utilised 5% of the time
• Second largest household capital expenditure
RP041
Source: SAE International.
What about driverless cars
Magellan | 38
Technology impacts
Source: University of Minnesota, Levinson, The End of Traffic and the Future of Transport Funding (Aug 2015). In this analysis, Level 4 represents complete self driving.
RP041
Most adoption timelines see rapid take-up
Magellan | 39
Technology impacts
• Highway grade roads will benefit disproportionality
 Initial use will be limited to highways
 Research suggest AVs will double capacity on highways, but only increase capacity 5-15% on arterial/suburban
roads
• AVs are expected to increase total VKT 3-10% despite car sharing
 Empty car trips
 Induced demand
 Reducing cost of time wasted in traffic, which will will encourage people to move further away from the urban
centre
Autonomous cars will likely be a net boon to most toll roads
RP041
Magellan | 40
Magellan Infrastructure Fund
Magellan | 41
Magellan Infrastructure Fund
Exposures as at 31 January 2018
Geographical Exposure*
Asia Pacific, 21.3%
USA, 25.9%
Canada, 8.1%
Latin America, 1.9%
Europe, 28.2%
United Kingdom,
7.4%
Cash, 7.2%
Sector Exposure*
Airports, 17.2%
Communications,
9.8%
Toll Roads, 23.4%
Rail, 5.2%
Energy
Infrastructure, 9.9%
Gas Utilities, 9.8%
Transmission and
Distribution, 5.4%
Integrated Power,
5.5%
Water Utilities, 6.7%
Cash, 7.2%
* Geographical exposures are by domicile of listing.
DP011
Magellan | 42
Portfolio Positioning – Magellan Infrastructure Fund
Sector weights over the last 2 years
* Calculated on a look through basis based on underlying revenue exposure of individual companies held within the portfolio - Magellan defined sectors.
30-Jun-15
(%)
31-Dec-15
(%)
30-Jun-16
(%)
31-Dec-16
(%)
30-Jun-17
(%)
30-Dec-17
(%)
Infrastructure
Airports 16.9 15.4 11.4 14.8 14.9 16.1
Communications 17.5 14.4 16.5 19.9 13.4 9.6
Energy Infrastructure 5.1 3.4 7.3 8.5 9.6 10.1
Toll Roads 18.0 16.9 18.4 15.6 17.3 23.1
Rail - - - 5.6 5.6 5.1
Ports 3.5 3.0 - - - -
Sub Total 61.0 52.1 53.6 64.4 60.8 64.0
Utilities
Transmission & Distribution 10.8 13.8 12.0 7.9 5.7 5.5
Water Utilities 8.8 10.7 7.7 6.5 7.3 7.0
Gas Utilities 0.8 3.8 8.5 8.2 9.3 9.2
Integrated Power 8.3 10.9 4.4 6.9 6.6 5.6
Sub Total 28.7 39.2 32.6 29.5 28.9 27.2
Cash weight 10.3 7.7 13.8 6.1 10.3 8.8
Total 100.0 100.0 100.0 100.0 100.0 100.0
IP067
Magellan | 43
AUD Net Performance as at 31 March 2018
One Year
(%)
Three Years
(% p.a.)
Five Years
(% p.a.)
Seven Years
(% p.a.)
Ten Years
(% p.a.)
Since Inception
(% p.a.)
#
Magellan Infrastructure Fund 5.8 8.2 12.5 12.7 9.7 8.2
Global Infrastructure Benchmark 0.5 3.6 9.1 9.5 6.1 5.2
Excess 5.3 4.6 3.4 3.2 3.6 3.0
Calendar Year Fund Index**
Excess Return
2007*
2.2 6.5 -4.3
2008 -34.1 -27.5 -6.6
2009 24.2 10.0 14.2
2010 11.8 5.7 6.1
2011 11.2 4.7 6.5
2012 15.1 9.1 6.0
2013 17.8 18.5 -0.7
2014 22.4 22.9 -0.5
2015 10.6 -5.4 16.0
2016 6.7 14.1 -7.4
2017 17.4 14.4 3.0
2018 (CYTD) -2.9 -6.0 3.1
$5,000
$10,000
$15,000
$20,000
$25,000
Jun-07 Jun-08 Jun-09 Jun-10 Jun-11 Jun-12 Jun-13 Jun-14 Jun-15 Jun-16 Jun-17
8.2% p.a.
$23,229
Magellan Infrastructure Fund
# The inception date is 01 July 2007 inclusive. * Part year performance. ** The index is Global Infrastructure Benchmark. The Global Infrastructure benchmark is comprised of the following: from inception to 31 December
2014 the benchmark is UBS Developed Infrastructure & Utilities Index NTR Index and from 1 January 2015 onwards, the benchmark is the S&P Global Infrastructure NTR Index. Calculations are based on exit price with
distributions reinvested, after ongoing fees and expenses but excluding individual tax, member fees and entry fees (if applicable). Returns are denoted in AUD.
DP013
Questions and answers
| netwealth45
This webinar and information has been prepared and issued by Netwealth Investments Limited (Netwealth),ABN 85 090 569 109,
AFSL 230975. It contains factual information and general financial product advice only and has been prepared without taking into
account the objectives, financial situation or needs of any individual.The information provided is not intended to be a substitute for
professional financial product advice and you should determine its appropriateness having regard to you or your client’s particular
circumstances.The relevant disclosure document should be obtained from Netwealth and considered before deciding whether to
acquire, dispose of, or to continue to hold, an investment in any Netwealth product.
While all care has been taken in the preparation of this document (using sources believed to be reliable and accurate), no person,
including Netwealth, or any other member of the Netwealth group of companies, accepts responsibility for any loss suffered by any
person arising from reliance on this information.
Disclaimer
Thank you
Webinar Series

Netwealth portfolio construction series - Protecting your portfolio with infrastructure

  • 1.
    Protecting your portfolio withinfrastructure Presented by Ofer Karliner Portfolio Manager Magellan Asset Management 18 April 2018
  • 2.
    | netwealth This webinaris being recorded. • Slides will be sent to you after the webinar Enter your questions in the chat. • We will get to them at the end of the webinar Posting to social? • Make sure to use #netwealthinvest or tweet @netwealthInvest 2 Housekeeping Webinar Series
  • 3.
    | netwealth3 This webinarand information has been prepared and issued by Netwealth Investments Limited (Netwealth),ABN 85 090 569 109, AFSL 230975. It contains factual information and general financial product advice only and has been prepared without taking into account the objectives, financial situation or needs of any individual.The information provided is not intended to be a substitute for professional financial product advice and you should determine its appropriateness having regard to you or your client’s particular circumstances.The relevant disclosure document should be obtained from Netwealth and considered before deciding whether to acquire, dispose of, or to continue to hold, an investment in any Netwealth product. While all care has been taken in the preparation of this document (using sources believed to be reliable and accurate), no person, including Netwealth, or any other member of the Netwealth group of companies, accepts responsibility for any loss suffered by any person arising from reliance on this information. Disclaimer Webinar Series
  • 4.
    | netwealth WebinarSeries4 Ofer Karliner Portfolio Manager Magellan Asset Management Meet today’s speaker
  • 5.
    Magellan | 5 ImportantInformation This presentation (‘Presentation’) has been produced by Magellan Asset Management Limited (‘Magellan’) ABN 31 120 593 946, AFS Licence No 304 301 and has been prepared for informational and discussion purposes only and does not constitute an offer to sell or a solicitation of an offer to purchase any security or financial product or service. Any such offer or solicitation shall be made only pursuant to a Product Disclosure Statement, Information Memorandum or other offer document (collectively ‘Offer Document’) relating to a Magellan financial product or service. A copy of the relevant Offer Document relating to a Magellan product or service may be obtained by calling Magellan on +61 2 9235 4888 or by visiting www.magellangroup.com.au. This Presentation does not constitute a part of any Offer Document issued by Magellan. The information contained in this Presentation may not be reproduced, used or disclosed, in whole or in part, without the prior written consent of Magellan. Past performance is not necessarily indicative of future results and no person guarantees the performance of any Magellan financial product or service or the amount or timing of any return from it. There can be no assurance that a Magellan financial product or service will achieve any targeted returns, that asset allocations will be met or that a Magellan financial product or service will be able to implement its investment strategy and investment approach or achieve its investment objective. Statements contained in this Presentation that are not historical facts are based on current expectations, estimates, projections, opinions and beliefs of Magellan. Such statements involve known and unknown risks, uncertainties and other factors, and undue reliance should not be placed thereon. Additionally, this Presentation may contain “forward-looking statements”. Actual events or results or the actual performance of a Magellan financial product or service may differ materially from those reflected or contemplated in such forward-looking statements. Certain economic, market or company information contained herein has been obtained from published sources prepared by third parties. While such sources are believed to be reliable, neither Magellan or any of its respective officers or employees assumes any responsibility for the accuracy or completeness of such information. None of Magellan or any of its respective officers or employees has made any representation or warranty, express or implied, with respect to the correctness, accuracy, reasonableness or completeness of any of the information contained in this and they expressly disclaim any responsibility or liability therefore. No person, including Magellan has any responsibility to update any of the information provided in this Presentation. Neither this Presentation nor the provision of any Offer Document issued by Magellan is, and must not be regarded as, advice or a recommendation or opinion in relation to a Magellan financial product or service, or that an investment in a Magellan financial product or service is suitable for you or any other person. Neither this Presentation nor any Offer Document issued by Magellan takes into account your investment objectives, financial situation and particular needs. In addition to carefully reading the relevant Offer Document issued by Magellan you should, before deciding whether to invest in a Magellan financial product or service, consider the appropriateness of investing or continuing to invest, having regard to your own objectives, financial situation or needs. Magellan strongly recommends that you obtain independent financial, legal and taxation advice before deciding whether to invest in a Magellan financial product or service. Any trademarks, logos, and service marks contained herein may be the registered and unregistered trademarks of their respective owners. Nothing contained herein should be construed as granting by implication, or otherwise, any license or right to use any trademark displayed without the written permission of the owner.
  • 6.
    Magellan | 6 Infrastructure- the importance of definition
  • 7.
    Magellan | 7 Magellan’sdefinition of infrastructure Strict definition: critical to reliable earnings through the economic cycle We believe that for an asset to be defined as “infrastructure” it must meet two key requirements: Assets that meet these requirements provide investors with a highly defensive, inflation-linked exposure that exhibits low correlation with other asset classes 1. Essential for the efficient functioning of a community; and 2. Earnings are not sensitive to competition, commodity price movements or sovereign risk Demand is predictable Cash flows are reliable SP001
  • 8.
    Magellan | 8 Powerindustry example A disciplined approach to defining what constitutes “infrastructure” is essential to achieving reliable returns Generation Unregulated Retailing Unregulated Transmission 100% Regulated Distribution 100% Regulated Magellan does not consider competitive power generation assets as infrastructure yet such companies are routinely included in commonly used benchmark indices. SP001
  • 9.
    Magellan | 9 TheInfrastructure universe 130 stocks with a market capitalisation of more than US$1.5 trillion Transport SocialUtilities Water Utilities Gas Utilities Energy Transmission and Distribution Airports Toll Roads Ports Rail Pipelines Communication Hospitals Schools PrisonsPower Generation Master Limited Partnerships Car parksPower Retailers SP001
  • 10.
    Magellan | 10 Strictapplication delivers downside protection “Pure Infrastructure” is the MFG Core Infrastructure Index (local currency), “Standard Infrastructure” is the UBS Developed Infrastructure & Utilities TR Index (USD Hedged) and “Global Equities” is the MSCI World Total Return Index (local currency). The MFG Core Infrastructure is based on a model portfolio and is a representation of the Global Core Infrastructure Composite. The model portfolio is not part of the composite. This information supplements the GIPS compliant report, available in the appendix to this presentation. Tech Wreck Global Financial Crisis 40 60 80 100 120 140 160 180 200 220 Dec-00 Dec-01 Dec-02 Dec-03 Dec-04 Dec-05 'Pure' Infrastructure Standard Infrastructure Global Equities 48 months 48% 40 60 80 100 120 140 160 180 200 Dec-07 Dec-08 Dec-09 Dec-10 Dec-11 Dec-12 Dec-13 'Pure' Infrastructure Standard Infrastructure Global Equities 33 months 64 months 45% IP053
  • 11.
    Magellan | 11 Investmentobjectives & outcomes
  • 12.
    Magellan | 12 Infrastructureinvestment objective Achieve attractive risk-adjusted returns over the medium to long term (Target returns of at least CPI + 5% through the economic cycle) Protect capital in adverse markets IP053
  • 13.
    Magellan | 13 #The inception date is 01 July 2007 inclusive. * Part year performance. ** The index is Global Infrastructure Benchmark. Calculations are based on exit price with distributions reinvested, after ongoing fees and expenses but excluding individual tax, member fees and entry fees (if applicable). Returns are denoted in AUD. The Global Infrastructure benchmark is comprised of the following: from inception to 31 December 2014 the benchmark is UBS Developed Infrastructure & Utilities Index NTR Index and from 1 January 2015 onwards, the benchmark is the S&P Global Infrastructure NTR Index. 2007* (%) 2008 (%) 2009 (%) 2010 (%) 2011 (%) 2012 (%) 2013 (%) 2014 (%) 2015 (%) 2016 (%) 2017 (%) Fund 2.2 -34.1 24.2 11.8 11.2 15.1 17.8 22.4 10.6 6.7 17.4 Index ** 6.5 -27.5 10.0 5.7 4.7 9.1 18.5 22.9 -5.4 14.1 14.4 Excess -4.3 -6.6 14.2 6.1 6.5 6.0 -0.7 -0.5 16.0 -7.4 3.0 Magellan Infrastructure Fund Global Infrastructure Benchmark FTSE Global Core 50/50 Dow Jones Brookfield Global Infrastructure TR Index FTSE EPRA FTSE NAREIT Developed NTR Index Downside Capture against MSCI -0.1 0.5 0.3 0.4 0.3 2. Protecting capital in adverse markets – 5 Years to 31 December 2017 Delivering to our objectives 1. Consistently delivering returns over the cycle – as at 31 December 2017 IP072 One Year (%) Three Years (% p.a.) Five Years (% p.a.) Seven Years (% p.a.) Ten Years (% p.a.) Since Inception (% p.a.)# Magellan Infrastructure Fund 17.4 11.5 14.9 14.4 8.9 8.7 Global Infrastructure Benchmark 14.4 7.3 12.4 10.8 5.6 6.0 Excess 3.0 4.2 2.5 3.6 3.3 2.7
  • 14.
    Magellan | 14 Strictapplication protects capital Date Range WTI Crude USD Alerian MLP Index USD S&P Global Infrastructure NTR Index AUD Hedged MSCI World NTR AUD Hedged Magellan Infrastructure Fund January 2010 – August 2010 -9.4% 17.1% -0.9% -3.6% 3.1% September 2010 – April 2011 58.4% 27.0% 15.8% 25.4% 18.8% May 2011 – September 2011 -30.5% -10.6% -9.0% -16.1% -3.7% October 2011 – February 2012 35.2% 23.6% 12.2% 19.0% 7.8% March 2012 – June 2014 -1.6% 46.4% 46.4% 52.1% 49.0% July 2014 – January 2016 -68.1% -46.0% -0.6% 3.5% 22.5% February 2016 – December 2017 73.9% 24.4% 30.2% 39.7% 23.2% Impact of oil price movements Returns for the Magellan Infrastructure Fund are based on hedged AUD net returns. RP053
  • 15.
    Magellan | 15 Returnsand Risk Measures are after fees. The Global Infrastructure benchmark is comprised of the following: from inception to 31 December 2014 the benchmark is UBS Developed Infrastructure & Utilities Index NTR Index (Hedged in AUD) and from 1 January 2015 onwards, the benchmark is the S&P Global Infrastructure NTR Index (Hedged in AUD). Magellan Infrastructure Fund Global Infrastructure Benchmark ASX S&P 200 Index MSCI World NTR Index AUD Hedged Returns (p.a.) 14.9% 12.4% 10.2% 15.2% Standard Deviation 8.2% 9.2% 11.4% 9.1% Reward for Risk 1.8 1.4 0.9 1.7 Downside Capture – MSCI -0.1 0.5 0.7 1.0 Downside Capture - ASX 200 0.0 0.1 1.0 0.1 Beta – MSCI 0.4 0.6 0.8 1.0 Correlation – MSCI 0.4 0.6 0.7 1.0 Upside Capture – MSCI 0.6 0.7 0.7 1.0 Magellan Infrastructure Fund - Characteristics AUD Hedged Performance – 5 Years to 31 December 2017 RP053
  • 16.
    Magellan | 16 Whatabout interest rates?
  • 17.
    Magellan | 17 Impactof Interest Rates on Financial Performance • Impact of an increase in interest rates on infrastructure businesses is limited:  Utilities – Economic regulation allows for changes in interest rates (i.e. increased borrowing costs) to be passed through to customers  Infrastructure – Where increases in interest rates are a consequence of rising inflation then this is captured in toll/price increases • Infrastructure firms have taken advantage of debt market conditions to lock-in low interest rates well into the future  In March 2017, American Tower raise €500m issued 8 year debt at 1.39%  In May 2017, Zurich Airport raised CHF350m for 12 years at 0.6214%.  In November 2017, APRR raised €700m of 15 year debt 1.52%.  In December 2017, Aeroports de Paris issued €500m of 10 year debt at 1.04%.  In January 2018, Italgas issued €500m of 11 year bonds at 1.625% IP053
  • 18.
    Magellan | 18 Impactof an increase in Interest Rates Source: Bloomberg, returns are in AUD Hedged. Magellan Infrastructure Fund (MIF). Taper Tantrum 1 May 2013 – 24 June 2013 Trump Election 8 July 2016 – 14 November 2016 10 Year Treasury Yield (%) 1.0 1.5 2.0 2.5 3.0 1.0 1.5 2.0 2.5 3.0 1.5 2.0 2.5 3.0 3.5 US Tax Reform 7 Sep 2017 – 8 Feb 2018 US 10 Yr Treasury Yield: +91bps MIF : -6.0% US 10 Yr Treasury Yield : +67bps MIF : -8.5% US 10 Year Treasury Yield: +79bps MIF : -4.2% RP054
  • 19.
    Magellan | 19 500 1000 1500 2000 2500 Jun2012 Jun 2013 Jun 2014 Jun 2015 Jun 2016 Jun 2017 Impact of an increase in interest rates Magellan Infrastructure Fund performance Source: Bloomberg. Magellan Infrastructure Fund (MIF). RP054 Taper Tantrum Trump Election US Tax Reform $2033 $1000
  • 20.
    Magellan | 20 Infrastructure– reliable earnings
  • 21.
    Magellan | 21 Utilities– Nature of Returns The regulation of utility earnings leads to stable financial results and ultimately stable investment returns Regulation typically allows utilities to earn fair returns with low potential for loss. the utility is protected from: − Changes in demand; − Inflation; and − Changes in interest rates. Regulation is administered by a government body and is transparent and simple. The regulation of earnings leads to stable financial results Stable financial results and transparent regulation lead to stable values for utilities. SP001
  • 22.
    Magellan | 22 Whyis Financial Performance so Stable? Magellan Asset Management Limited analysis. Regulators allow utilities to generate a fair return on the capital used in their businesses 5% 6% 7% 8% 9% 10% 11% 12% 13% 14% 15% US Electricity and Gas Utilities - Regulated ROEs Average Regulated ROE = 10.5% RP012
  • 23.
    Magellan | 23 Utilities- Financial Performance Because of the regulated nature of utilities, the historical returns from regulated utilities have been stable through the recession Source: Company accounts, Magellan Asset Management Limited analysis. Utility group includes Alliant Energy, Atmos Energy, Consolidated Edison, ITC, Southwest Gas, Southern Company, Westar Energy, WGL, Wisconsin Energy & Xcel Energy. 6% 7% 8% 9% 10% 11% 12% 13% 14% 15% 2005 2006 2007 2008 2009 2010 2011 2012 2013 2014 2015 Return On Equity from 2005 to 2015 for the Magellan US Regulated Energy Utilities Index RP012
  • 24.
    Magellan | 24 Cost ($per megawatt-hour) Total Cost (LCOE) Tax credits Net cost (LCOE) Combined-Cycle Gas Turbine (conventional) 58.6 na 58.6 Nuclear 96.2 na 96.2 Wind (onshore) 55.9 -11.6 44.3 Solar PV 73.7 -15.6 58.1 Technology Impacts “Grid Scale” Renewables – becoming cost competitive Source: Left, International Energy Agency 2016, estimated levelized cost of energy (LCOE) for plants entering service in 2022. Right, National Geographic. RP041
  • 25.
    Magellan | 25 Technologyimpacts “Distributed Power” – costs continue to decline Source: Left, Lawrence Berkeley National Laboratory, Tracking the Sun IX, August 2016. Right, Renew Economy. RP041
  • 26.
    Magellan | 26 Batteriescould provide a solution to this problem Does Distributed Generation + Batteries = End of the Grid? We don’t see this as likely (1) creating reliable stand-alone system is expensive (2) being connected to the grid provides huge redundancy (3) not all houses can self generate A single Tesla Power wall has peak capacity of 7kW, and continuous capacity of 5kW. A kettle is at least 2.5kW, a hairdyer is 2kW, and basic air conditioners are more than 3.5kW for a single unit. Technology impacts What about the rise of batteries? Source: Tesla RP041
  • 27.
    Magellan | 27 Disconnectingfrom the grid expensive: Grid power = Cheaper + More reliable What do grids provide? Grid power = redundancy + shared assets Source: Grattan Institute – Sundown, sunrise, 2015 Technology impacts Batteries – remain prohibitively expensive RP041
  • 28.
    Magellan | 28 Source:Tesla, BMW Electric cars still a small percentage of the global fleet However, households that purchase EVs will require significantly larger amounts of energy: – Average Sydney house consumes 6.9MWh of electricity each year – Adding a Tesla Model S that is driven the 14,600km per year, electricity consumption increases ~60%. Technology impacts Electric cars RP041
  • 29.
    Magellan | 29 Transport– nature of returns Because revenues and earnings grow in line with patronage growth, infrastructure assets are able to earn high returns Revenue = Volume X Price Toll Road Revenue = Number of cars x Average Toll Airport Revenue = Number of passengers x Average Price Port Revenue = Number of containers x Average Charge 1. Earnings are not constrained by regulation 2. Patronage growth has a direct impact on financial returns Regulation is typically imposed on prices not earnings SP001
  • 30.
    Magellan | 30 Urbantoll roads Source: Transurban Group, Magellan Asset Management Limited analysis. - 0.50 1.00 1.50 2.00 2.50 3.00 2006 2007 2008 2009 2010 2011 2012 2013 2014 2015 2016 Index CityLink - Traffic, Revenue and EBITDA (2006 to 2016) Traffic Index Revenue Index EBITDA Index EBITDA CAGR 9.3% Revenue CAGR 8.1% Traffic CAGR 2.5% Reliable earnings growth reflects patronage growth combined with inflation indexation. RP012
  • 31.
    Magellan | 31 Carsdominate large city transport The complexity of modern trips and the historic focus of public transport on the CBD makes car travel unavoidable for most people Source: Transport NSW, Magellan Asset Management Limited analysis. 0% 10% 20% 30% 40% 50% 60% 70% 80% 90% Car Train Bus Walk Only Other Weekday Trips in Sydney Distance Travelled in 2011/12 RP012
  • 32.
    Magellan | 32 Demandfor roads is linked to wealth Source: World Bank 2014, Magellan Asset Management Limited analysis. 0 100 200 300 400 500 600 700 800 900 $0 $10,000 $20,000 $30,000 $40,000 $50,000 $60,000 $70,000 $80,000 $90,000 $100,000 Vehiclesper1000people GDP Per Capita US$ Wealth & Vehicle Ownership USA Barbados Australia Kuwait Norway Brunei United Arab Emirates Hong Kong Singapore Luxembourg Greece New Zealand Canada Iceland Switzerland China Equatorial Guinea Finland Oman TaiwanSaudi Arabia Italy Malta Ireland Brazil Chile Spain France RP012
  • 33.
    Magellan | 33 Demandfor roads is linked to wealth Source: Roads & Traffic Authority, NSW Government, Magellan Asset Management Limited. - 50,000 100,000 150,000 200,000 250,000 300,000 1950 1953 1956 1959 1962 1965 1968 1971 1974 1977 1980 1983 1986 1989 1992 1995 1998 2001 2004 2007 2010 2013 No.Vehicles SHB + SHT Sydney Harbour Bridge (SHB) and Sydney Harbour Tunnel (SHT) Average Daily Traffic (1950 - 2015) RP012
  • 34.
    Magellan | 34 Newcapacity can induce demand Source: Roads & Traffic Authority, NSW Government, Magellan Asset Management Limited. - 50,000 100,000 150,000 200,000 250,000 300,000 1932 1935 1938 1941 1944 1947 1950 1953 1956 1959 1962 1965 1968 1971 1974 1977 1980 1983 1986 1989 1992 1995 1998 2001 2004 2007 2010 2013 No.Vehicles SHB SHT Sydney Harbour Bridge (SHB) and Sydney Harbour Tunnel (SHT) Average Daily Traffic (1950 – 2015) RP011
  • 35.
    Magellan | 35 Corridoreffect - Toll roads capture bulk of traffic The toll road is often the only available capacity within the corridor and so benefits from all the growth in the total corridor Source: RTA Traffic Data. - 50,000 100,000 150,000 200,000 250,000 1987 1989 1991 1993 1996 1999 2002 2005 2012 2016 AverageDailyTraffic Hume Highway Canterbury Rd M5 Main Toll Plaza RP012 Traffic growth: Corridor: 2.7%; free -0.1%; plaza +7.7%.
  • 36.
    Magellan | 36 TollRoads exhibit low price elasticity Tolls on Sydney’s Eastern Distributor have been increased multiple times since it opened with no measurable impact on traffic numbers Source: Transurban Group. RP012 20,000 25,000 30,000 35,000 40,000 45,000 50,000 55,000 60,000 2000 2001 2002 2003 2004 2005 2006 2007 2008 2009 2010 2011 2012 2013 2014 2015 2016 Eastern Distributor Average Daily Traffic $3.00 $5.00 $4.50 $4.00 $3.50 $5.50 $6.00 $6.48 Tolls: Up 123% Traffic: Up 106% $6.34 $6.68
  • 37.
    Magellan | 37 Technologyimpacts • 1.2 million road deaths annually • Cars are only utilised 5% of the time • Second largest household capital expenditure RP041 Source: SAE International. What about driverless cars
  • 38.
    Magellan | 38 Technologyimpacts Source: University of Minnesota, Levinson, The End of Traffic and the Future of Transport Funding (Aug 2015). In this analysis, Level 4 represents complete self driving. RP041 Most adoption timelines see rapid take-up
  • 39.
    Magellan | 39 Technologyimpacts • Highway grade roads will benefit disproportionality  Initial use will be limited to highways  Research suggest AVs will double capacity on highways, but only increase capacity 5-15% on arterial/suburban roads • AVs are expected to increase total VKT 3-10% despite car sharing  Empty car trips  Induced demand  Reducing cost of time wasted in traffic, which will will encourage people to move further away from the urban centre Autonomous cars will likely be a net boon to most toll roads RP041
  • 40.
    Magellan | 40 MagellanInfrastructure Fund
  • 41.
    Magellan | 41 MagellanInfrastructure Fund Exposures as at 31 January 2018 Geographical Exposure* Asia Pacific, 21.3% USA, 25.9% Canada, 8.1% Latin America, 1.9% Europe, 28.2% United Kingdom, 7.4% Cash, 7.2% Sector Exposure* Airports, 17.2% Communications, 9.8% Toll Roads, 23.4% Rail, 5.2% Energy Infrastructure, 9.9% Gas Utilities, 9.8% Transmission and Distribution, 5.4% Integrated Power, 5.5% Water Utilities, 6.7% Cash, 7.2% * Geographical exposures are by domicile of listing. DP011
  • 42.
    Magellan | 42 PortfolioPositioning – Magellan Infrastructure Fund Sector weights over the last 2 years * Calculated on a look through basis based on underlying revenue exposure of individual companies held within the portfolio - Magellan defined sectors. 30-Jun-15 (%) 31-Dec-15 (%) 30-Jun-16 (%) 31-Dec-16 (%) 30-Jun-17 (%) 30-Dec-17 (%) Infrastructure Airports 16.9 15.4 11.4 14.8 14.9 16.1 Communications 17.5 14.4 16.5 19.9 13.4 9.6 Energy Infrastructure 5.1 3.4 7.3 8.5 9.6 10.1 Toll Roads 18.0 16.9 18.4 15.6 17.3 23.1 Rail - - - 5.6 5.6 5.1 Ports 3.5 3.0 - - - - Sub Total 61.0 52.1 53.6 64.4 60.8 64.0 Utilities Transmission & Distribution 10.8 13.8 12.0 7.9 5.7 5.5 Water Utilities 8.8 10.7 7.7 6.5 7.3 7.0 Gas Utilities 0.8 3.8 8.5 8.2 9.3 9.2 Integrated Power 8.3 10.9 4.4 6.9 6.6 5.6 Sub Total 28.7 39.2 32.6 29.5 28.9 27.2 Cash weight 10.3 7.7 13.8 6.1 10.3 8.8 Total 100.0 100.0 100.0 100.0 100.0 100.0 IP067
  • 43.
    Magellan | 43 AUDNet Performance as at 31 March 2018 One Year (%) Three Years (% p.a.) Five Years (% p.a.) Seven Years (% p.a.) Ten Years (% p.a.) Since Inception (% p.a.) # Magellan Infrastructure Fund 5.8 8.2 12.5 12.7 9.7 8.2 Global Infrastructure Benchmark 0.5 3.6 9.1 9.5 6.1 5.2 Excess 5.3 4.6 3.4 3.2 3.6 3.0 Calendar Year Fund Index** Excess Return 2007* 2.2 6.5 -4.3 2008 -34.1 -27.5 -6.6 2009 24.2 10.0 14.2 2010 11.8 5.7 6.1 2011 11.2 4.7 6.5 2012 15.1 9.1 6.0 2013 17.8 18.5 -0.7 2014 22.4 22.9 -0.5 2015 10.6 -5.4 16.0 2016 6.7 14.1 -7.4 2017 17.4 14.4 3.0 2018 (CYTD) -2.9 -6.0 3.1 $5,000 $10,000 $15,000 $20,000 $25,000 Jun-07 Jun-08 Jun-09 Jun-10 Jun-11 Jun-12 Jun-13 Jun-14 Jun-15 Jun-16 Jun-17 8.2% p.a. $23,229 Magellan Infrastructure Fund # The inception date is 01 July 2007 inclusive. * Part year performance. ** The index is Global Infrastructure Benchmark. The Global Infrastructure benchmark is comprised of the following: from inception to 31 December 2014 the benchmark is UBS Developed Infrastructure & Utilities Index NTR Index and from 1 January 2015 onwards, the benchmark is the S&P Global Infrastructure NTR Index. Calculations are based on exit price with distributions reinvested, after ongoing fees and expenses but excluding individual tax, member fees and entry fees (if applicable). Returns are denoted in AUD. DP013
  • 44.
  • 45.
    | netwealth45 This webinarand information has been prepared and issued by Netwealth Investments Limited (Netwealth),ABN 85 090 569 109, AFSL 230975. It contains factual information and general financial product advice only and has been prepared without taking into account the objectives, financial situation or needs of any individual.The information provided is not intended to be a substitute for professional financial product advice and you should determine its appropriateness having regard to you or your client’s particular circumstances.The relevant disclosure document should be obtained from Netwealth and considered before deciding whether to acquire, dispose of, or to continue to hold, an investment in any Netwealth product. While all care has been taken in the preparation of this document (using sources believed to be reliable and accurate), no person, including Netwealth, or any other member of the Netwealth group of companies, accepts responsibility for any loss suffered by any person arising from reliance on this information. Disclaimer Thank you Webinar Series