Download to read offline


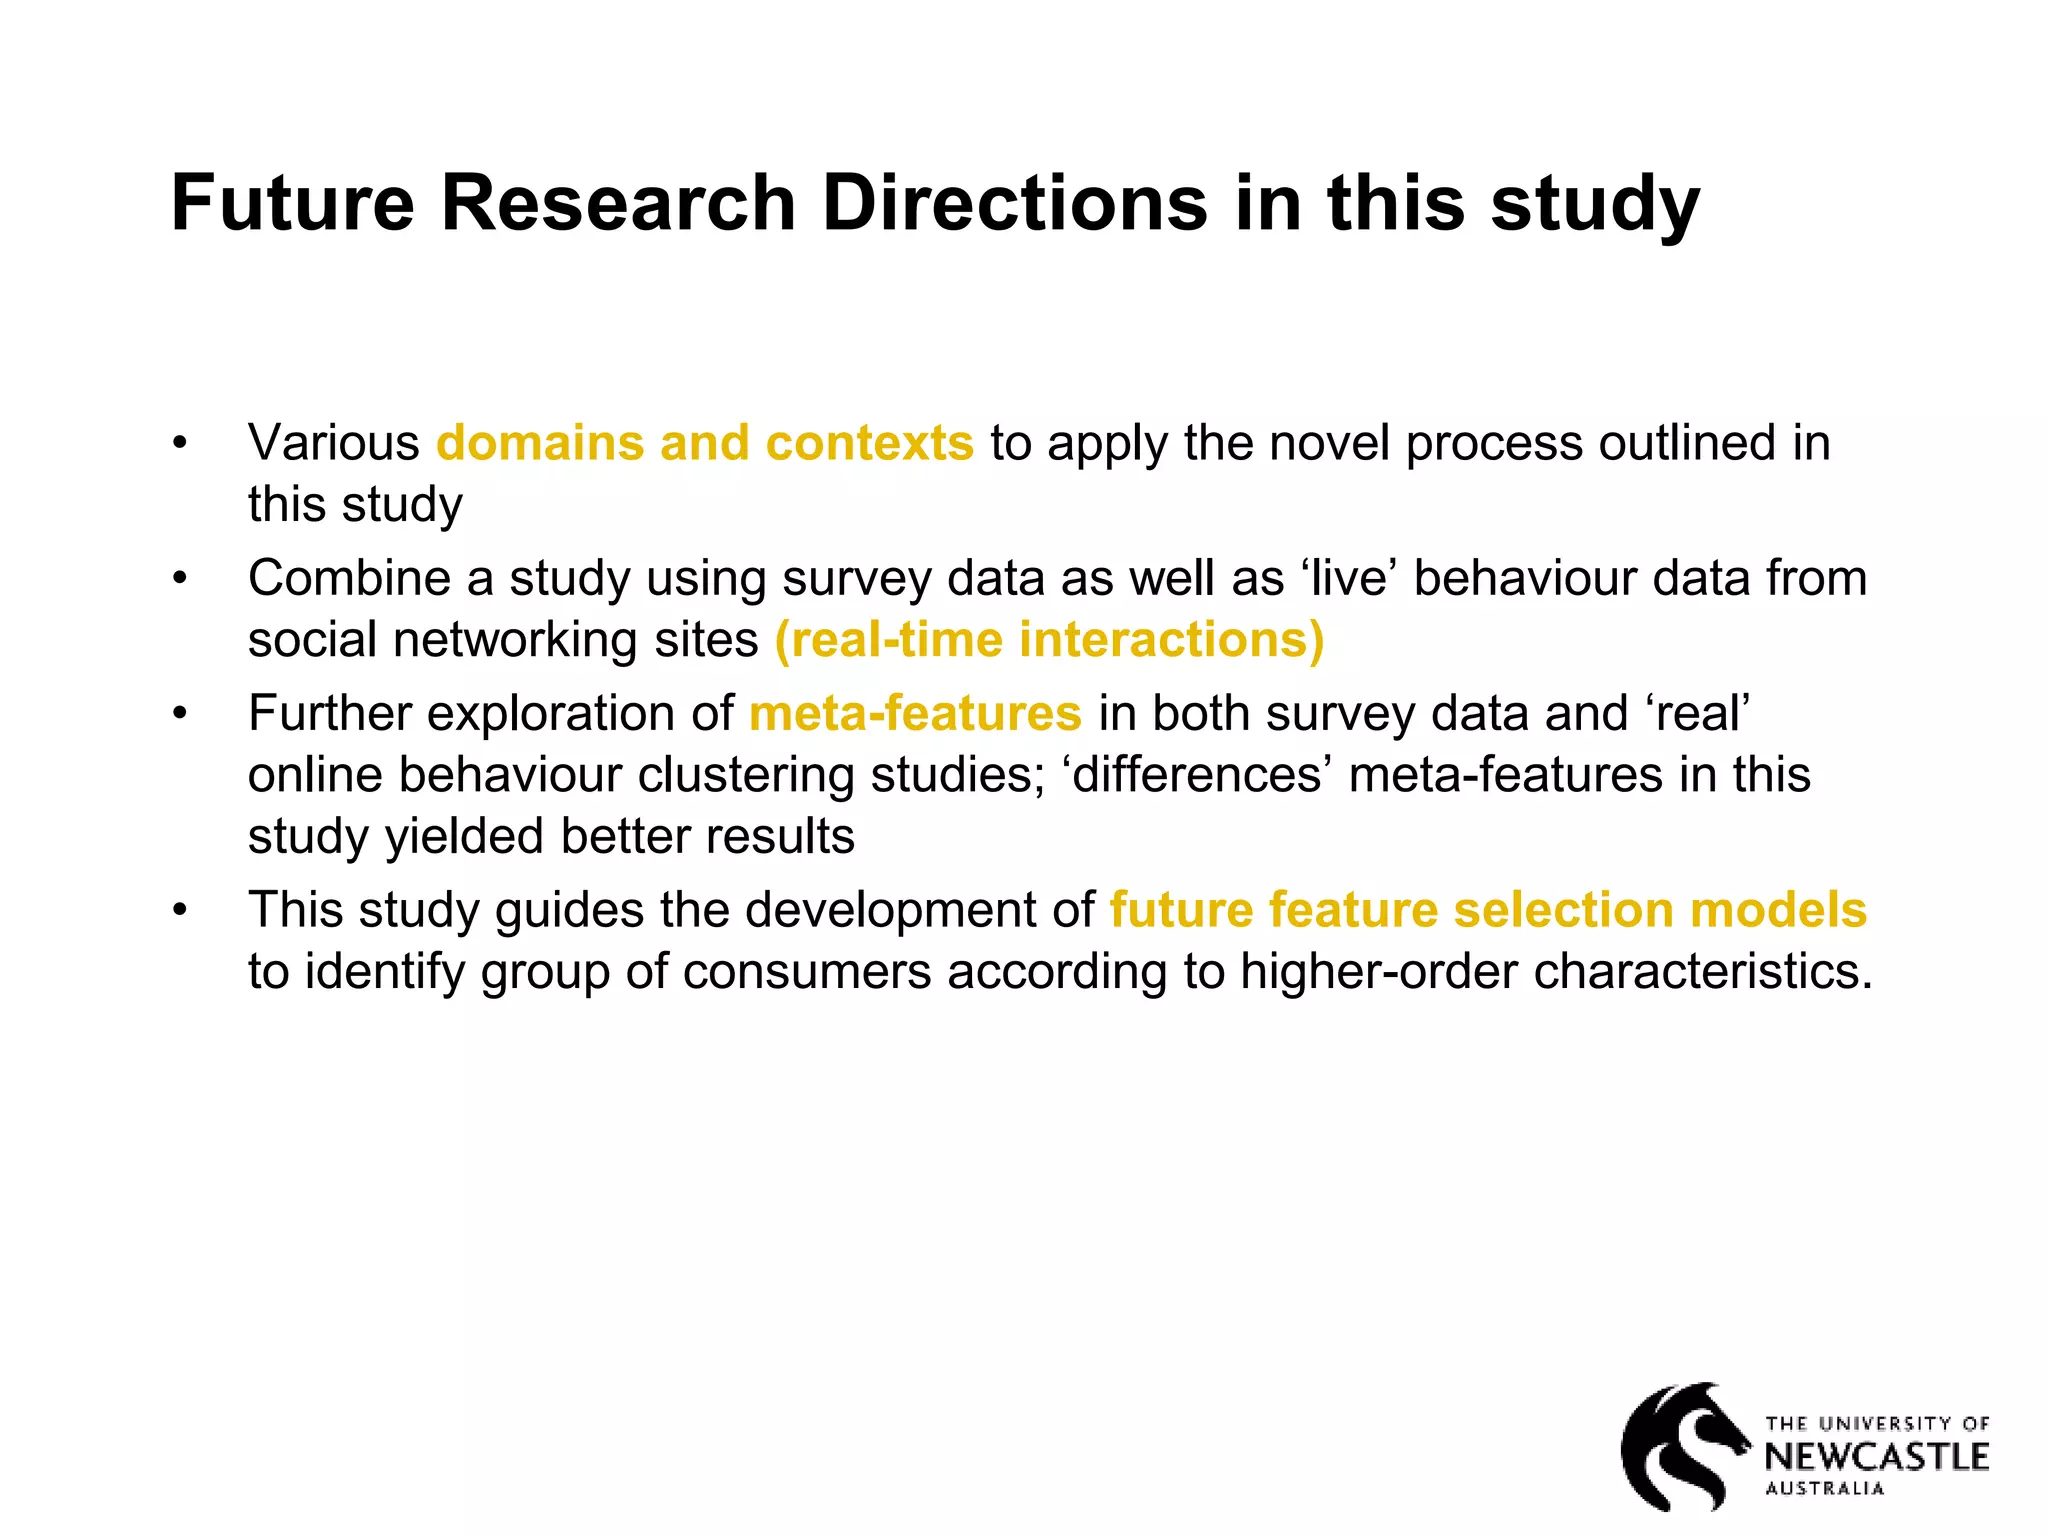


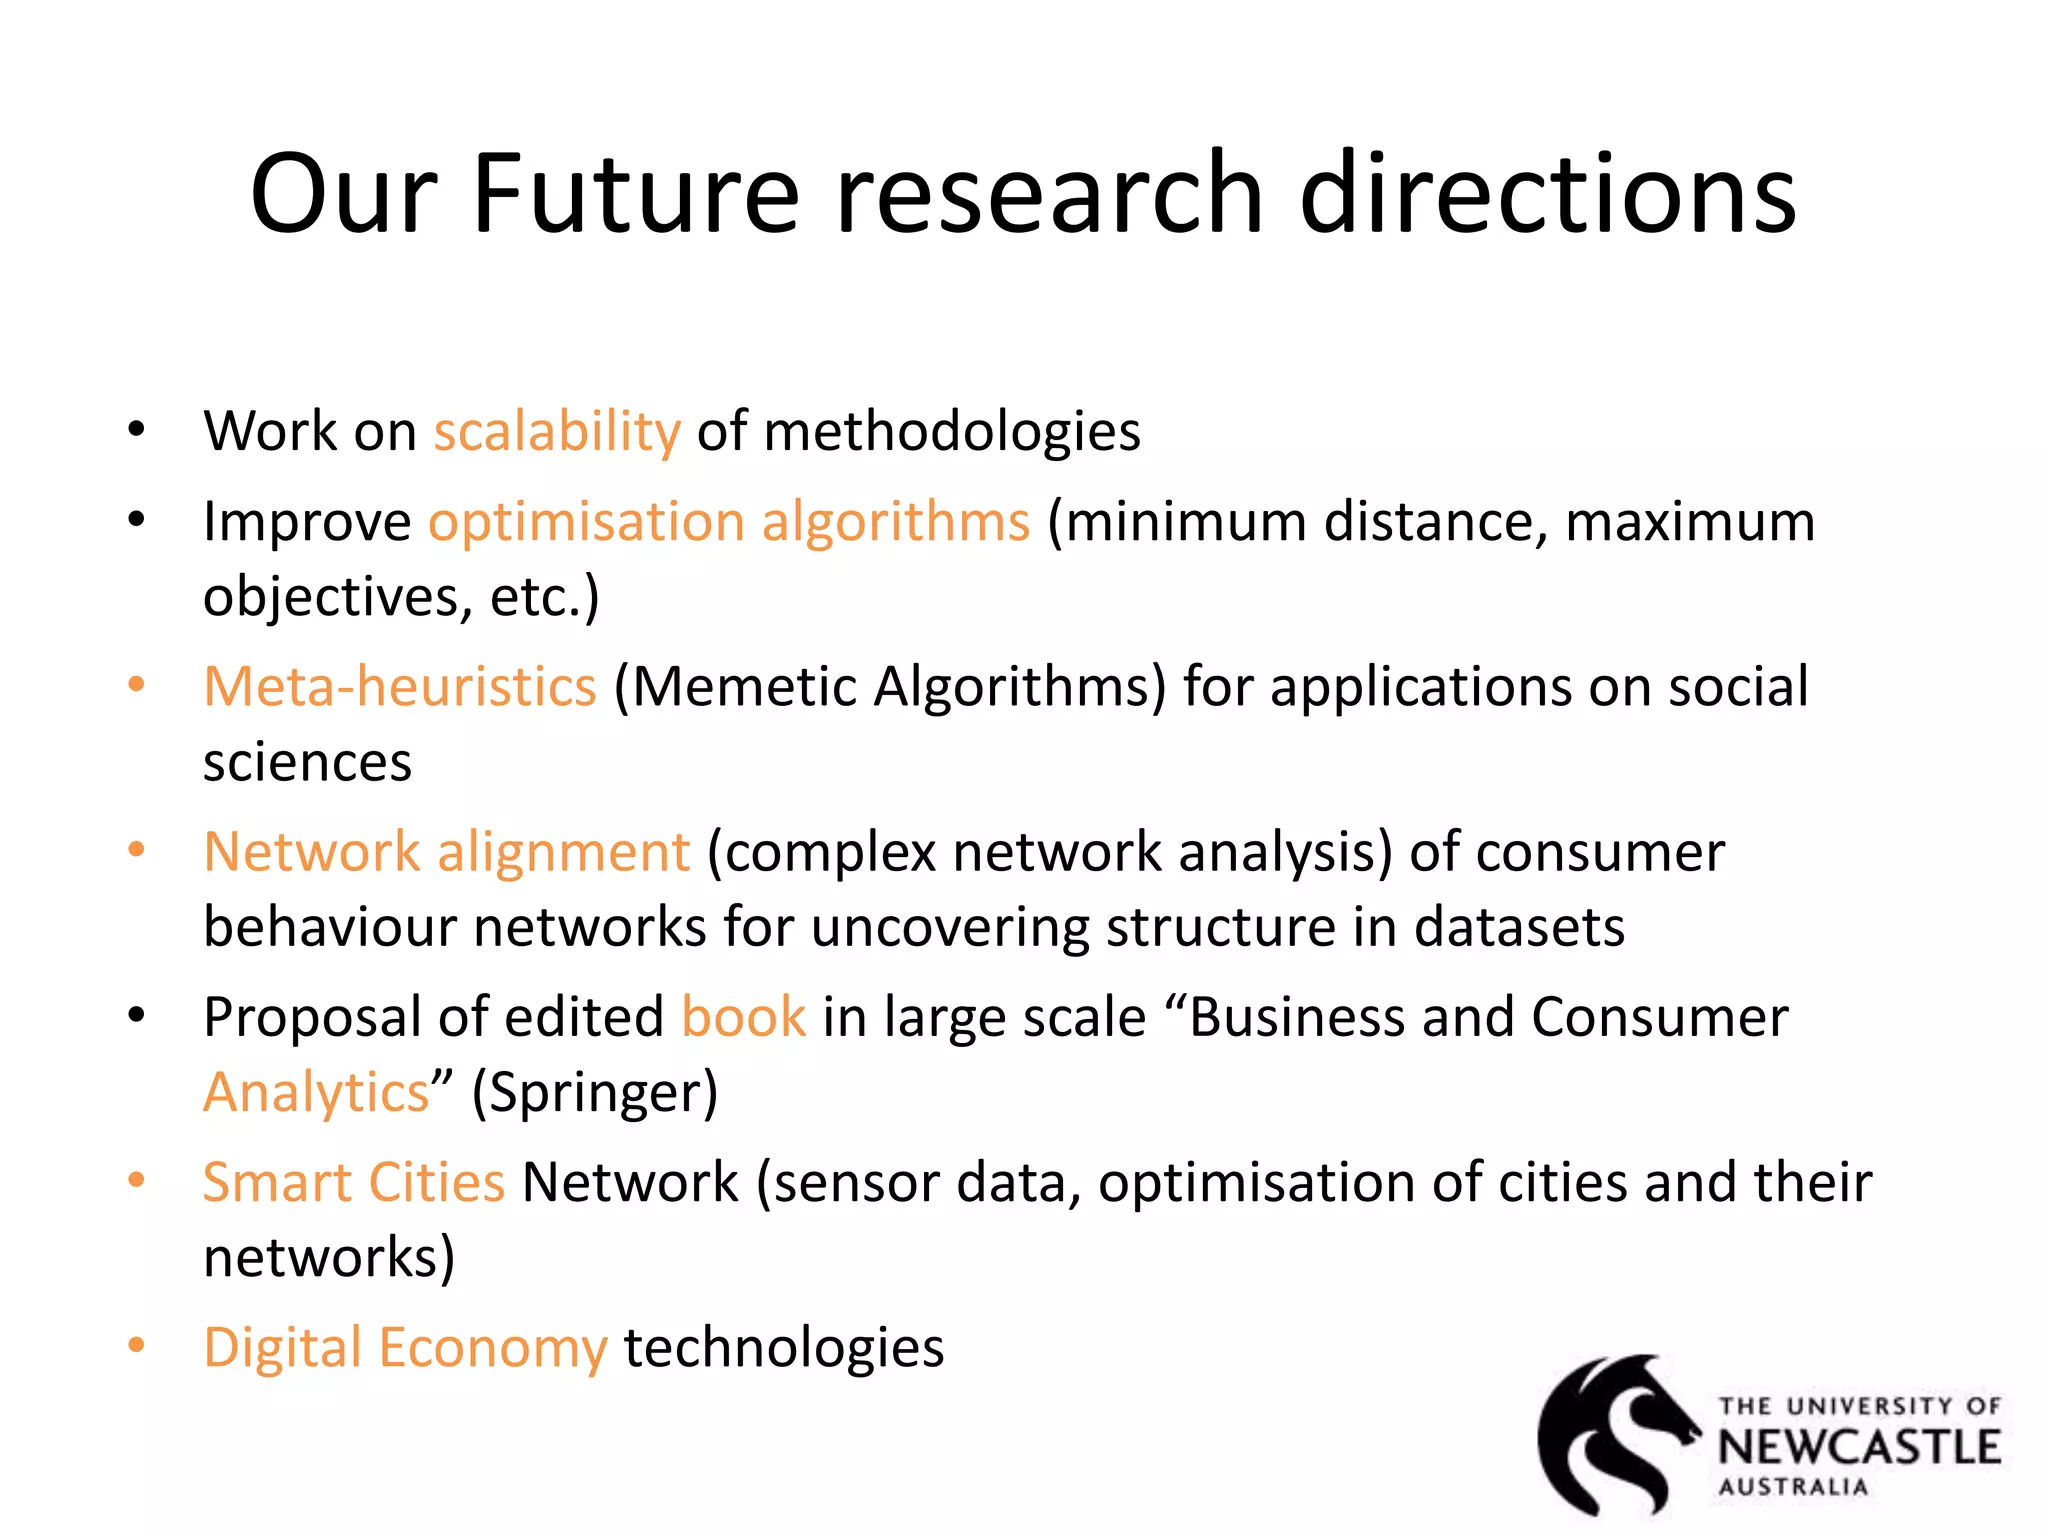


The document discusses the interdisciplinary approach of the Centre for Bioinformatics, Biomarker Discovery, and Information-Based Medicine at the University of Newcastle, emphasizing the integration of computer science with social sciences and consumer behavior research. It outlines methodologies for clustering and modeling consumer engagement behaviors using extensive data analytics techniques. Future research directions include exploring consumer insights through real-time data from social media and enhancing methodologies for diverse applications in various domains.


![10[1].1.1.115.9508](https://cdn.slidesharecdn.com/ss_thumbnails/101-1-1-115-9508-101121024800-phpapp01-thumbnail.jpg?width=640&height=640&fit=bounds)


![[IJCT-V3I2P30] Authors: Sunny Sharma](https://cdn.slidesharecdn.com/ss_thumbnails/ijct-v3i2p30-160609071130-thumbnail.jpg?width=640&height=640&fit=bounds)