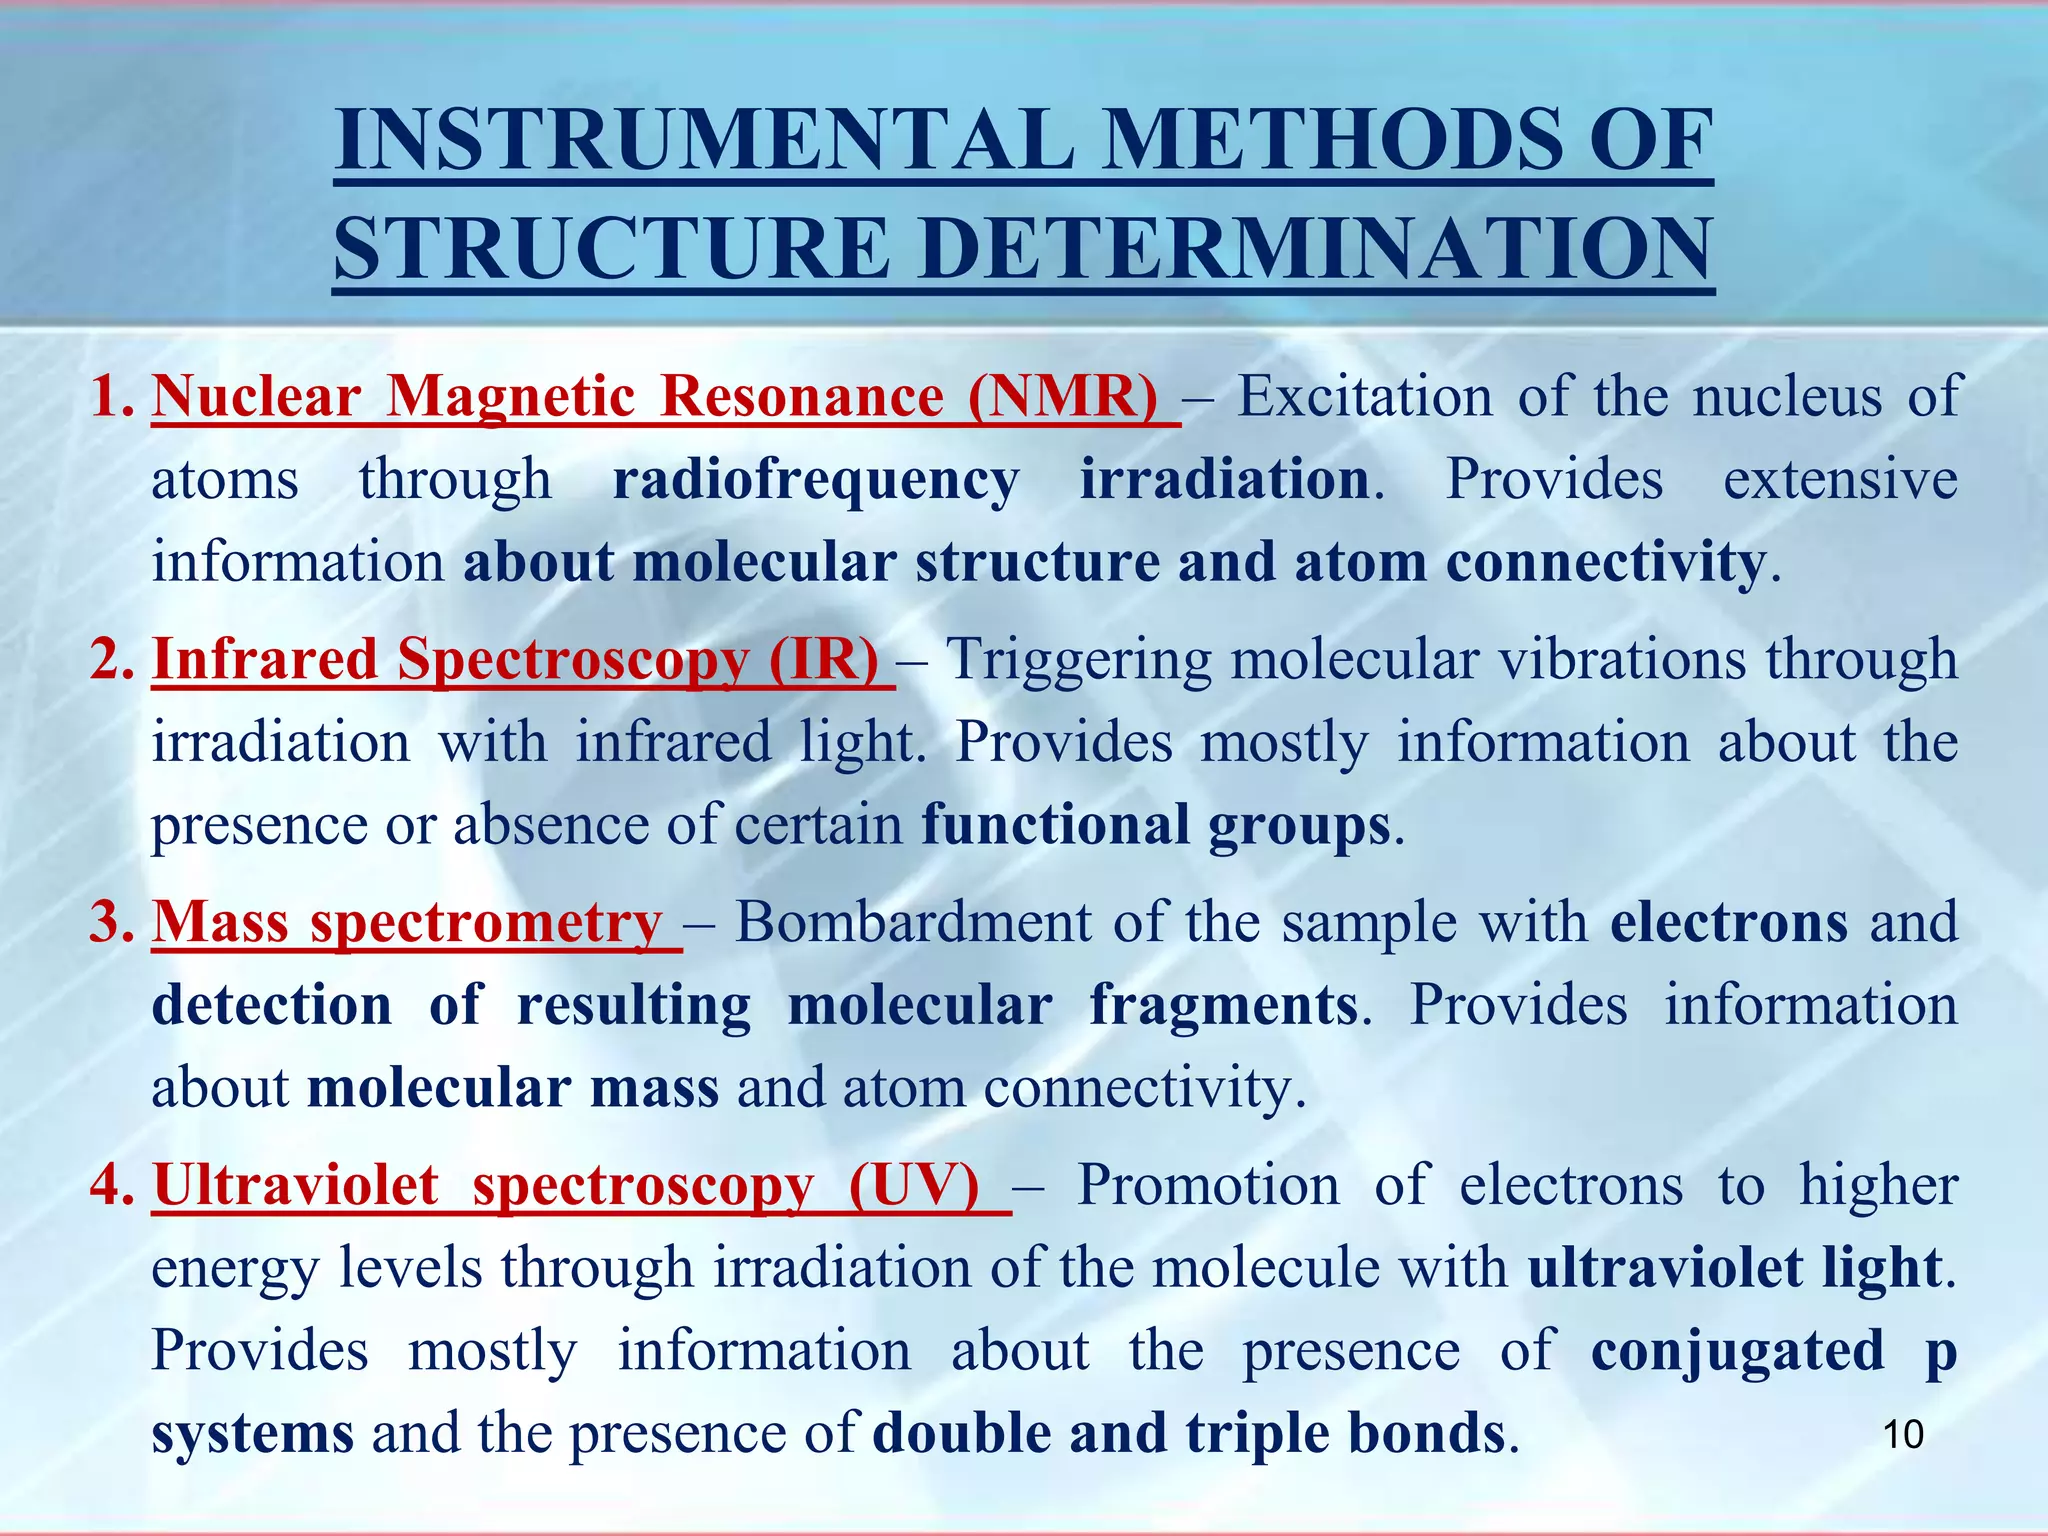
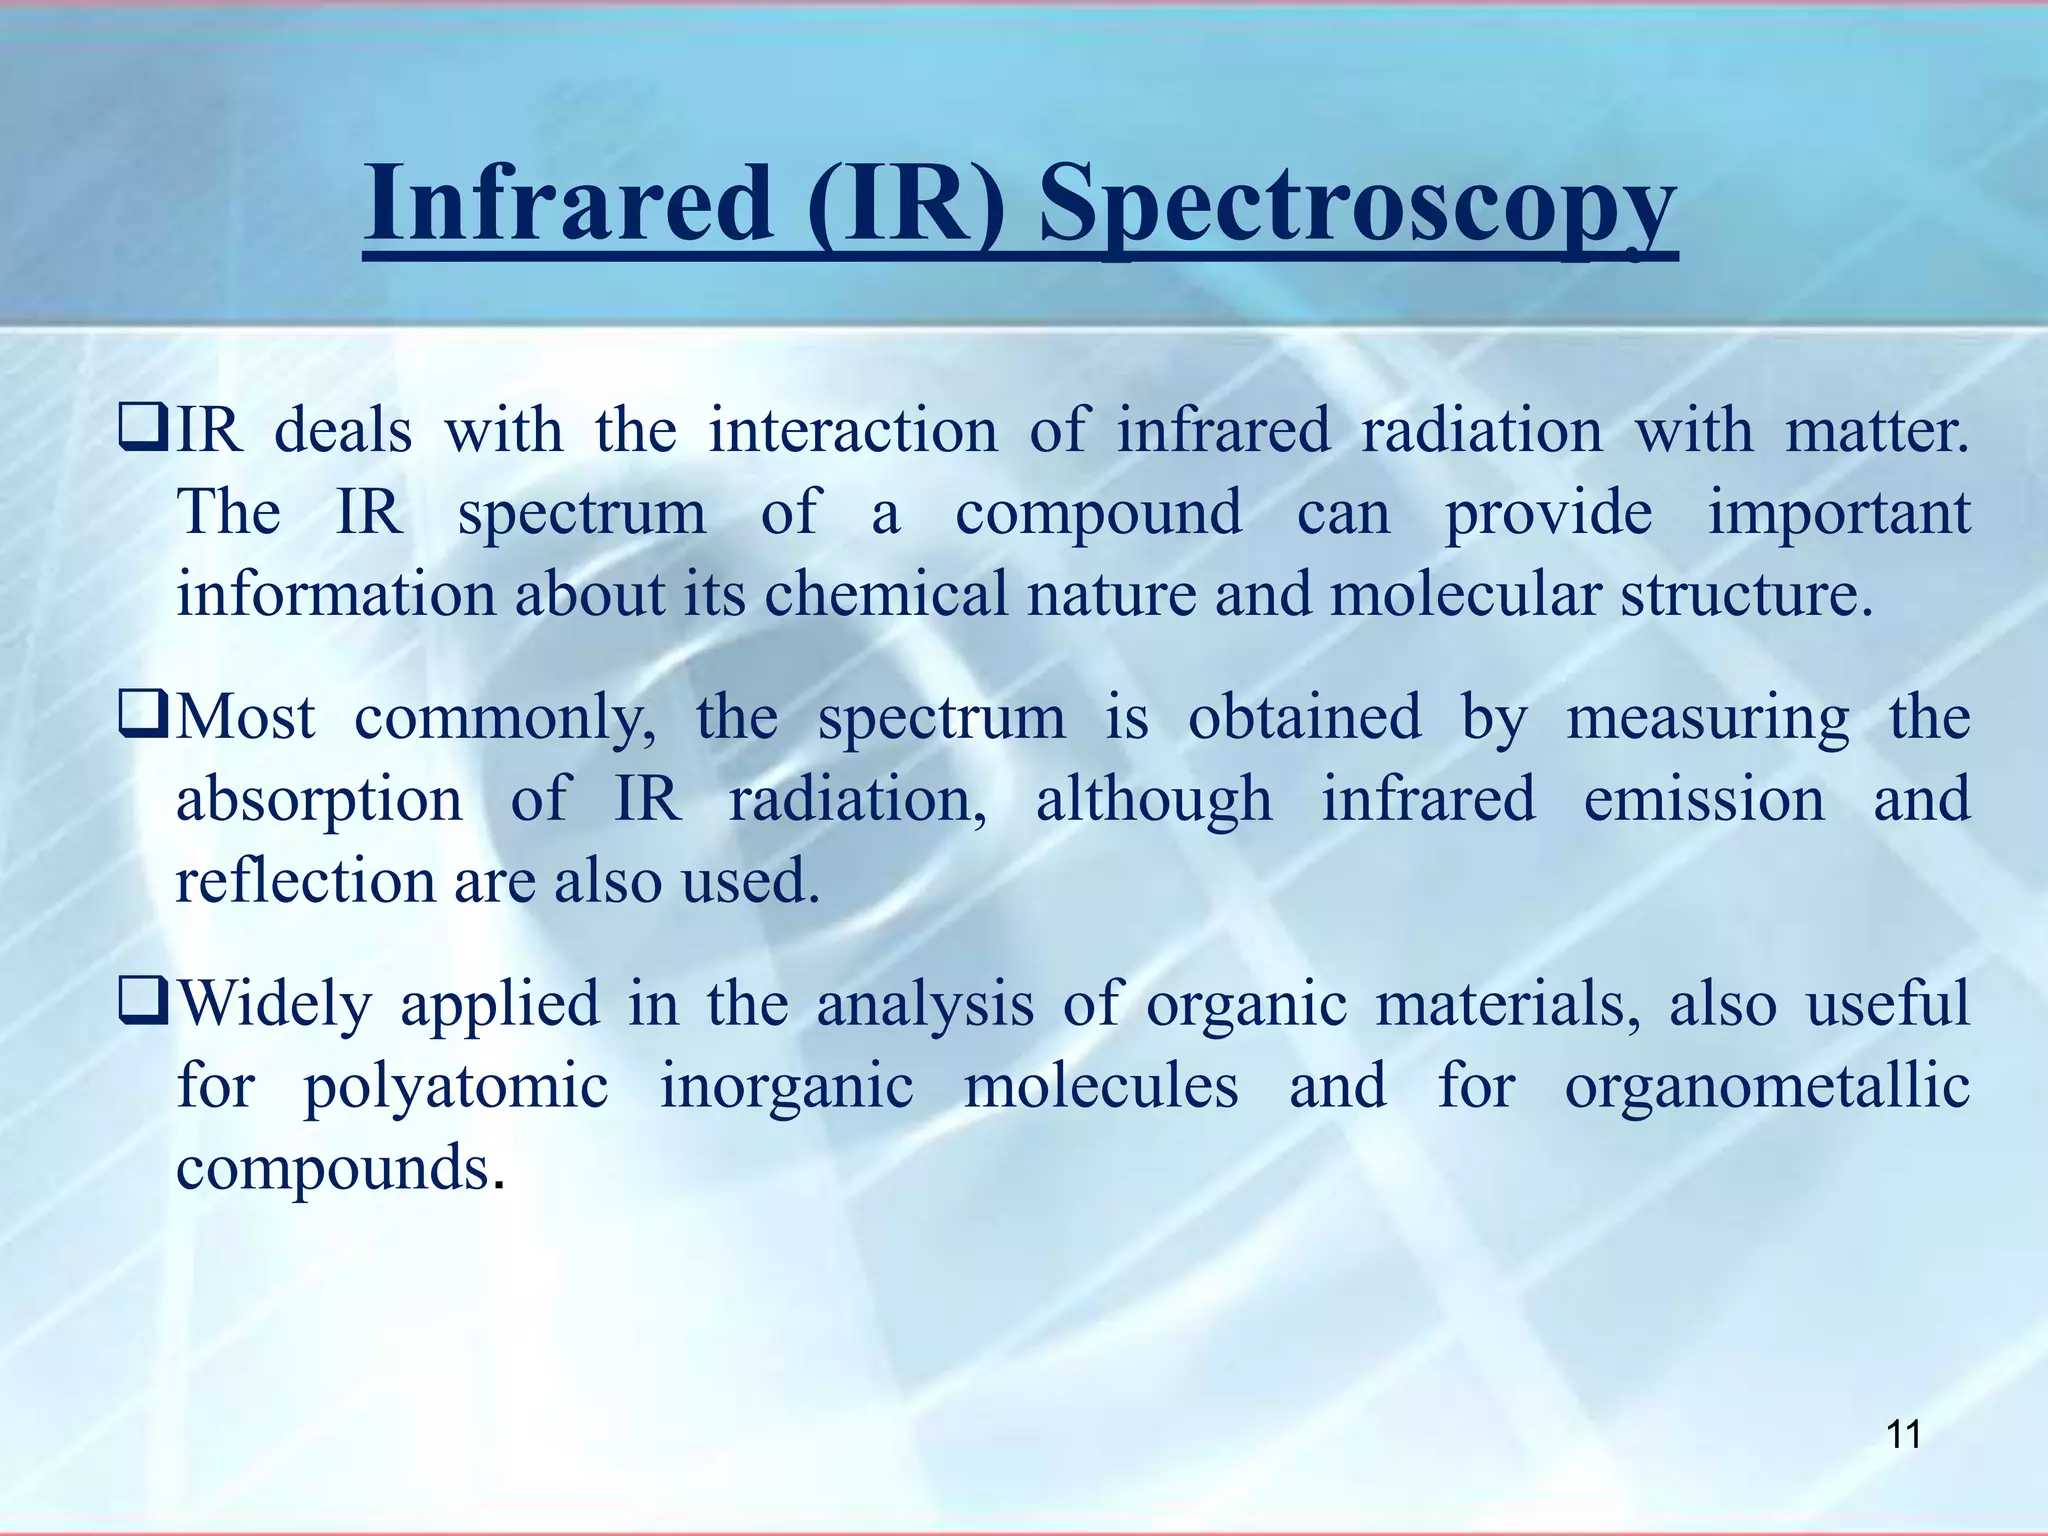
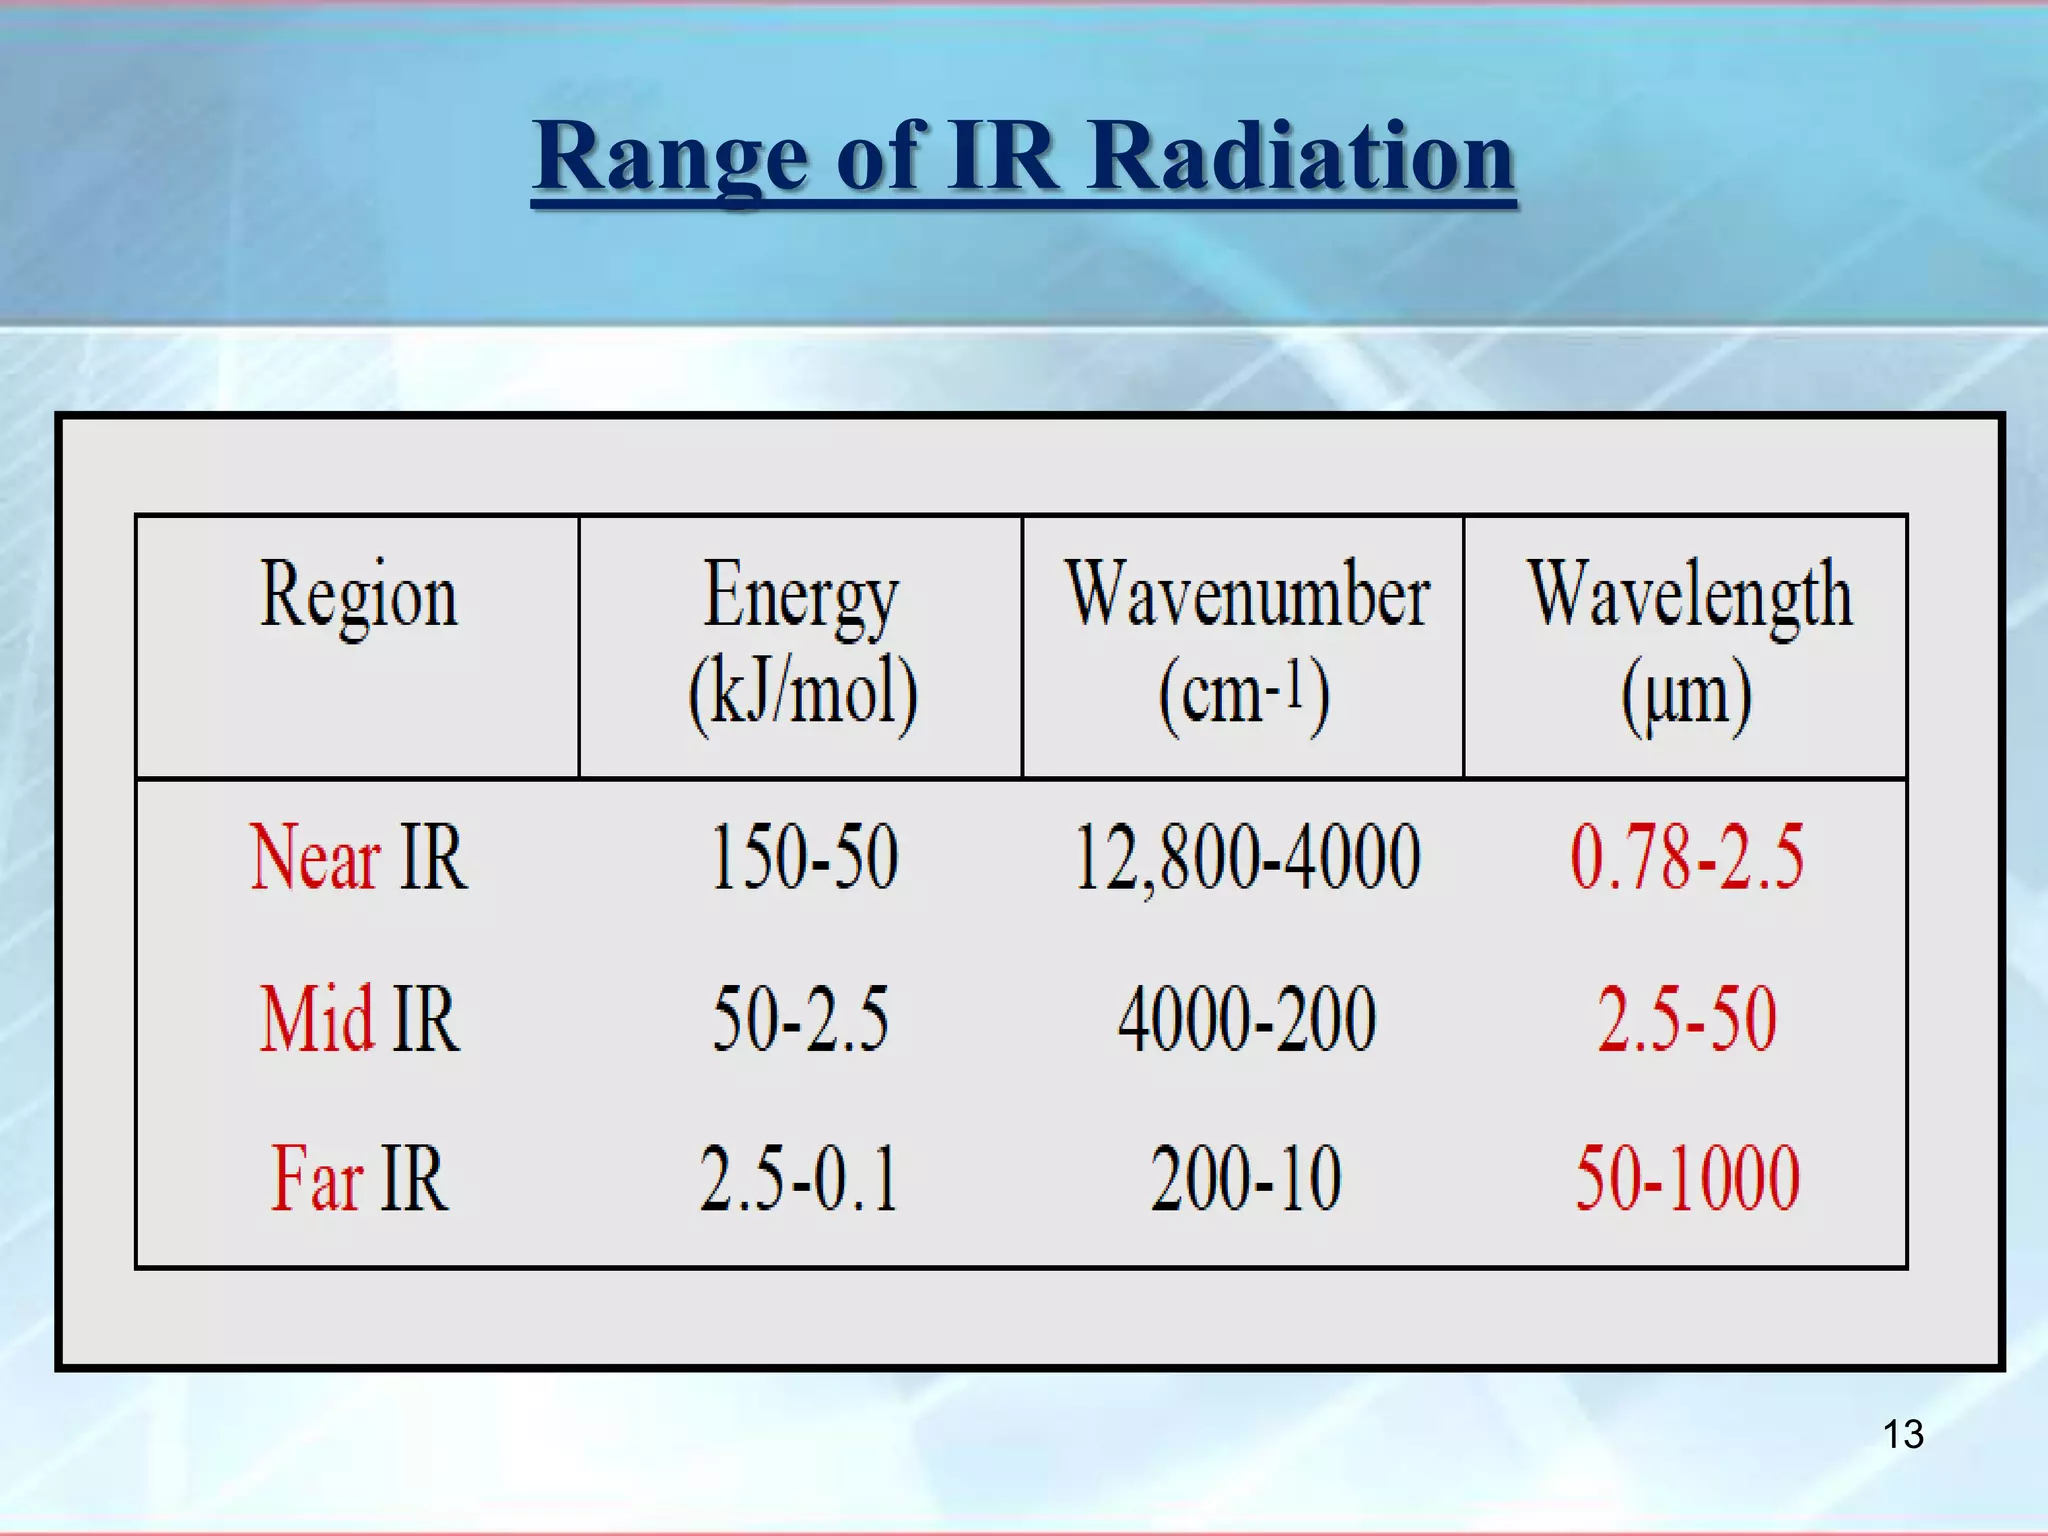
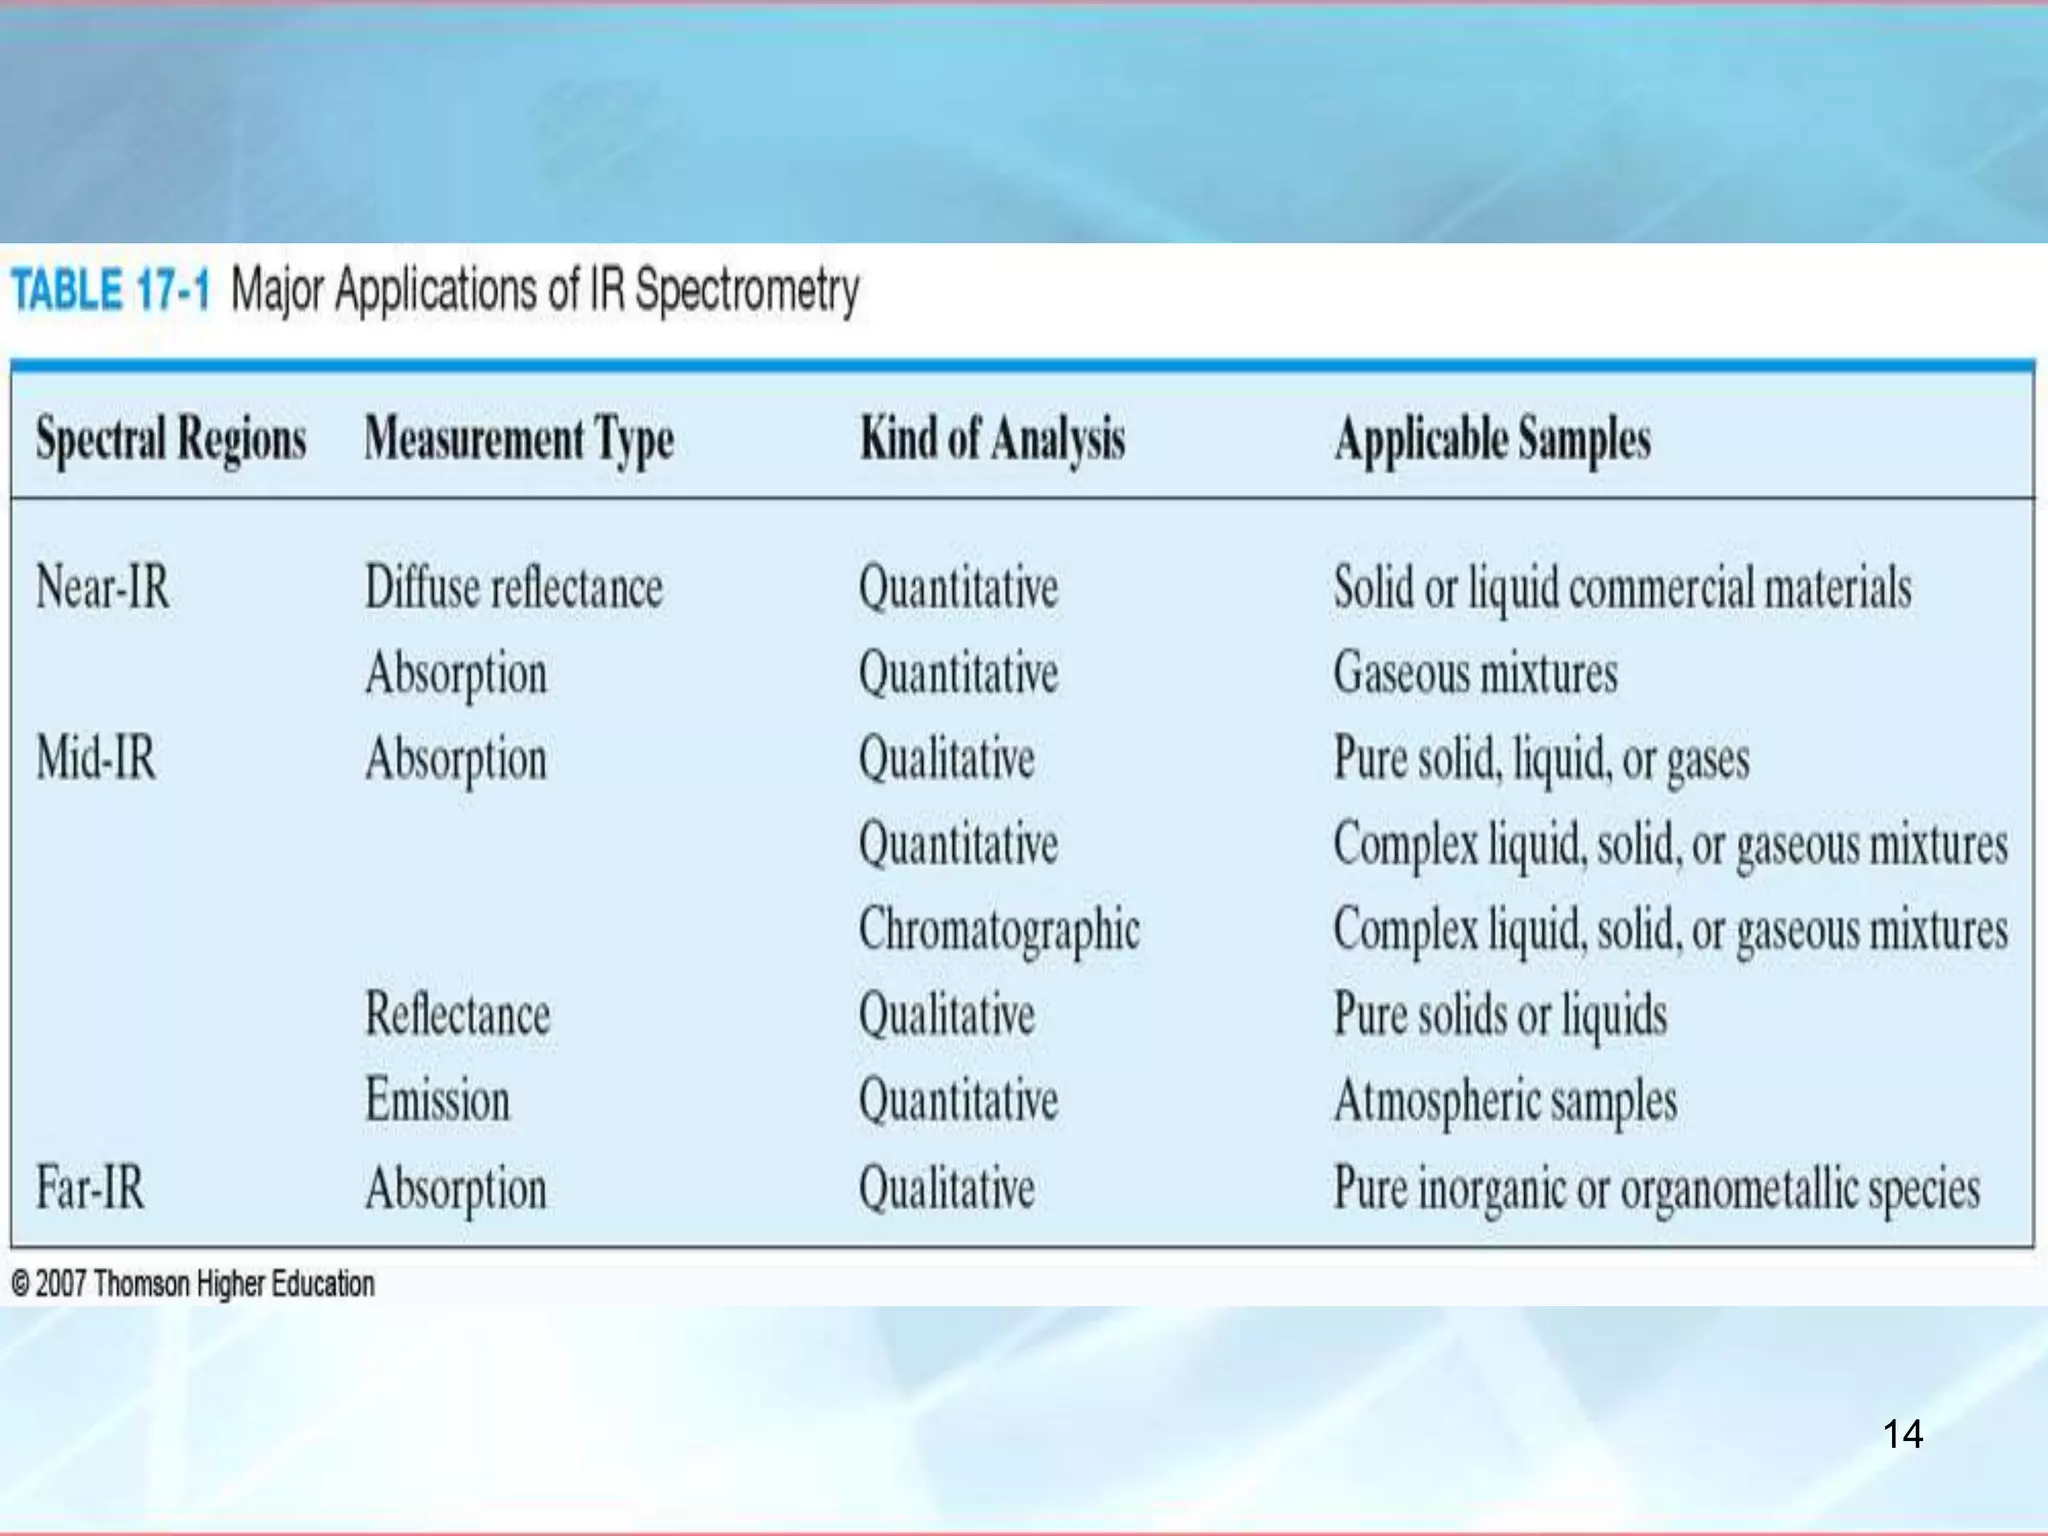
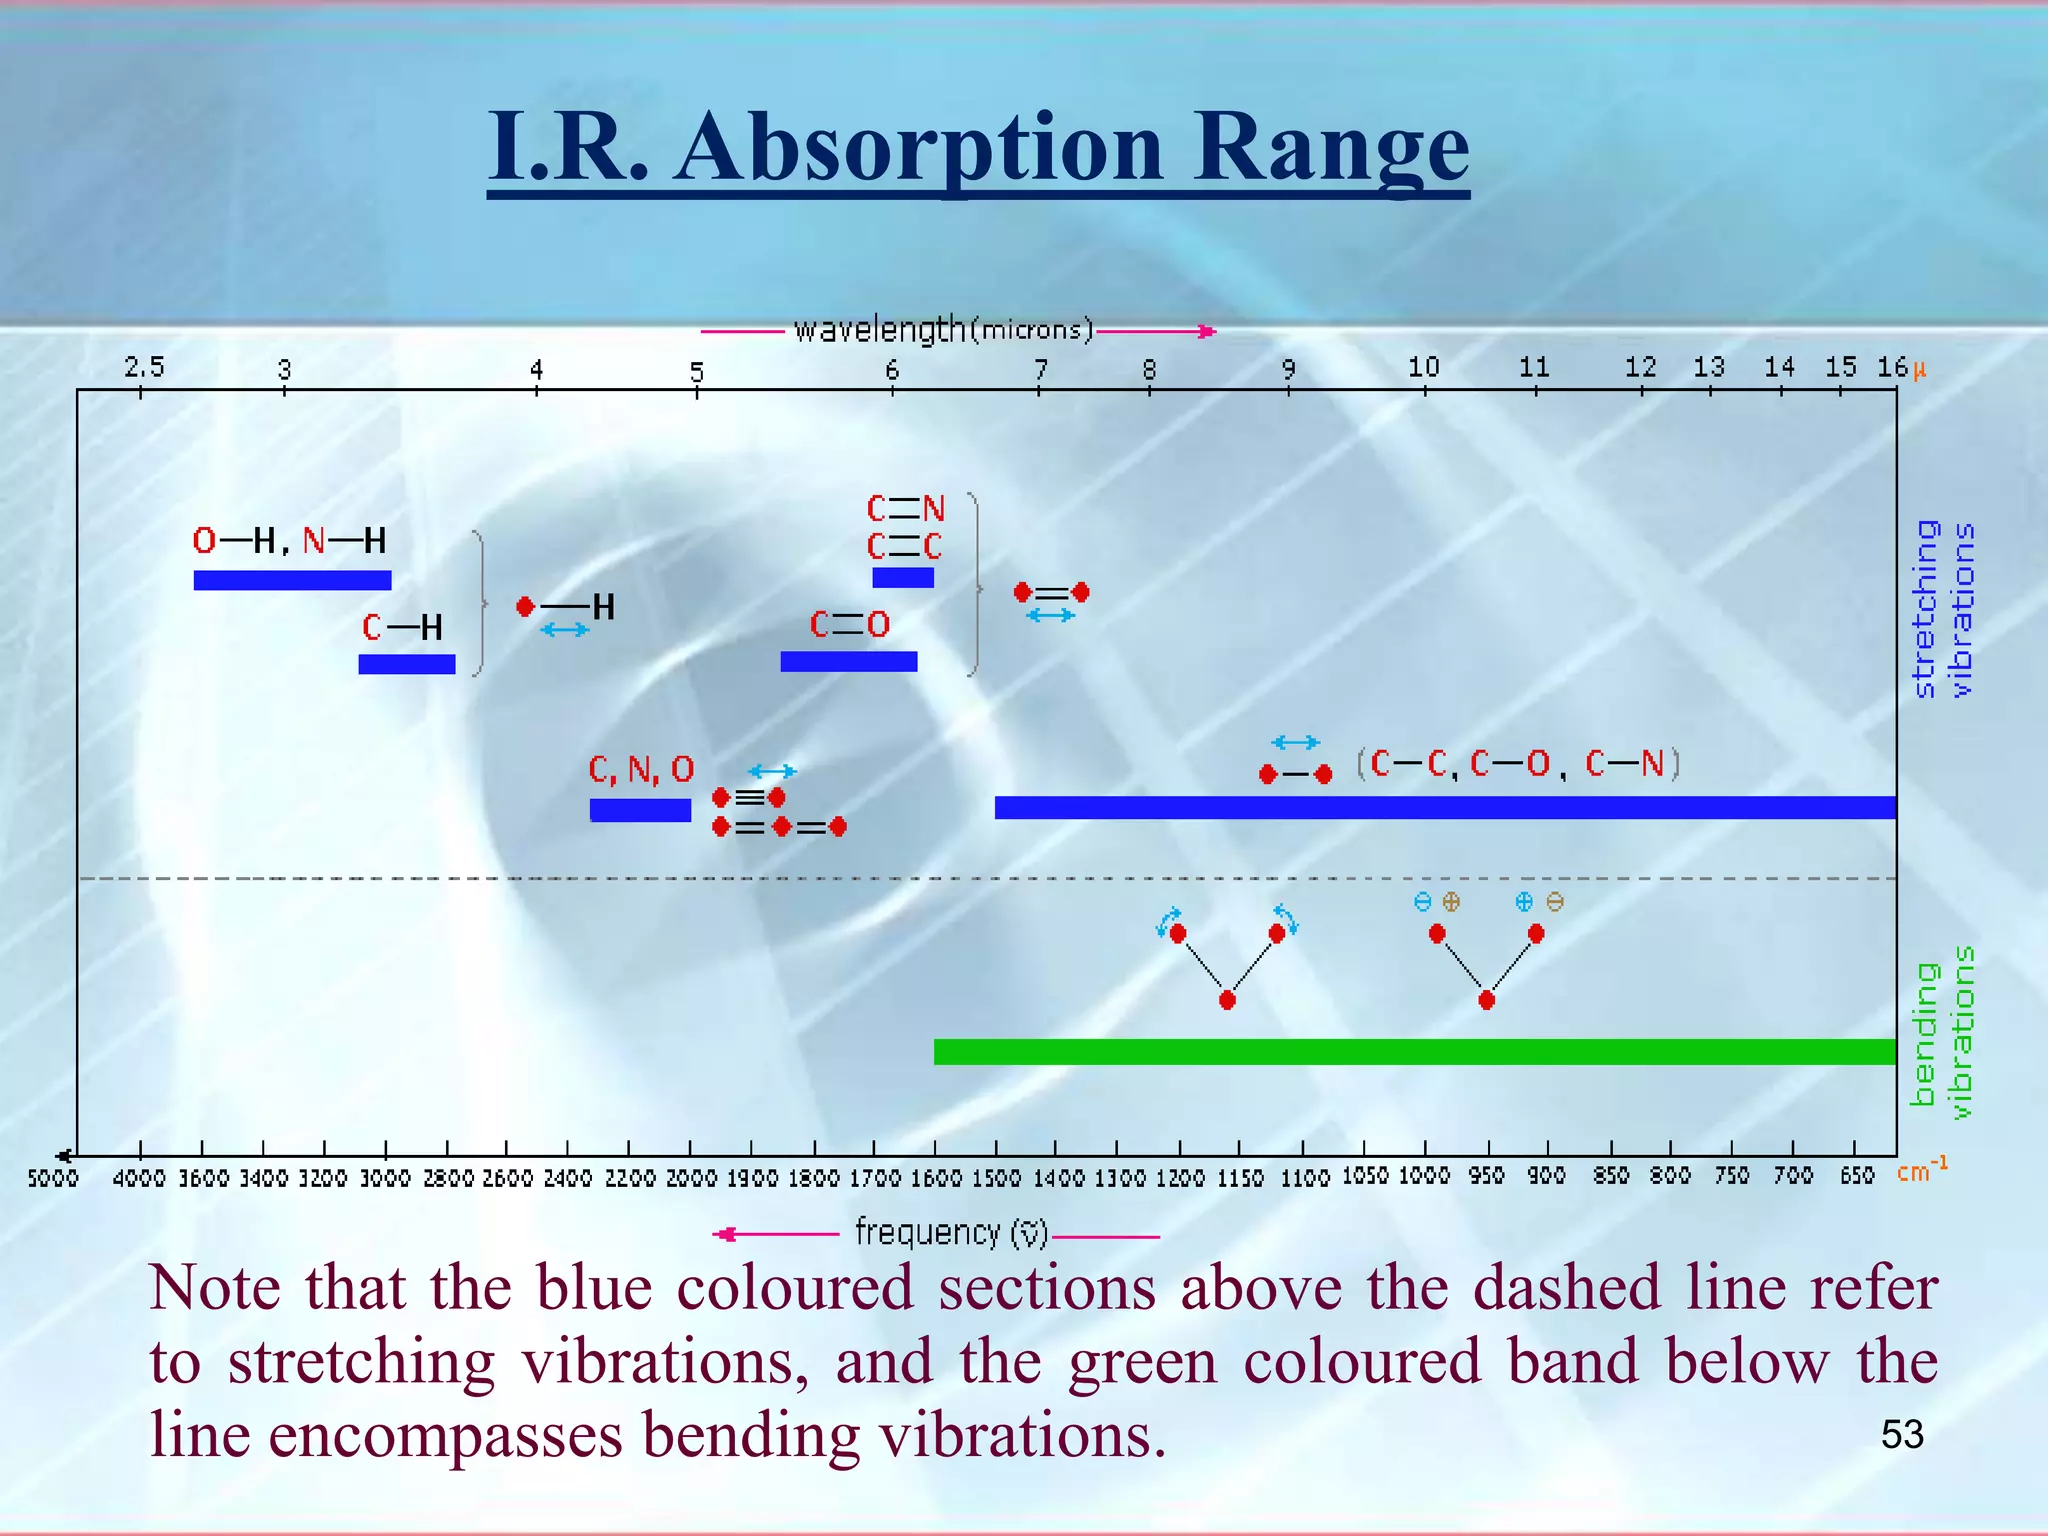
Infrared spectroscopy is a technique that uses infrared light to analyze chemical bonding and molecular structure. It works by detecting the frequencies at which molecules vibrate or rotate when exposed to infrared radiation. The document discusses the principles of infrared spectroscopy, including how molecular vibrations can be excited when their frequency matches the frequency of infrared radiation. It also covers factors that determine infrared absorption frequencies and the types of molecular vibrations that are infrared active.


![INTERPRETATION OF IR SPECTRA
Amino Acids [RCH(NH2)COOH]
- IR spectrum is related to salts of amines and salts of acids
- Broad CH bands that overlap with each other
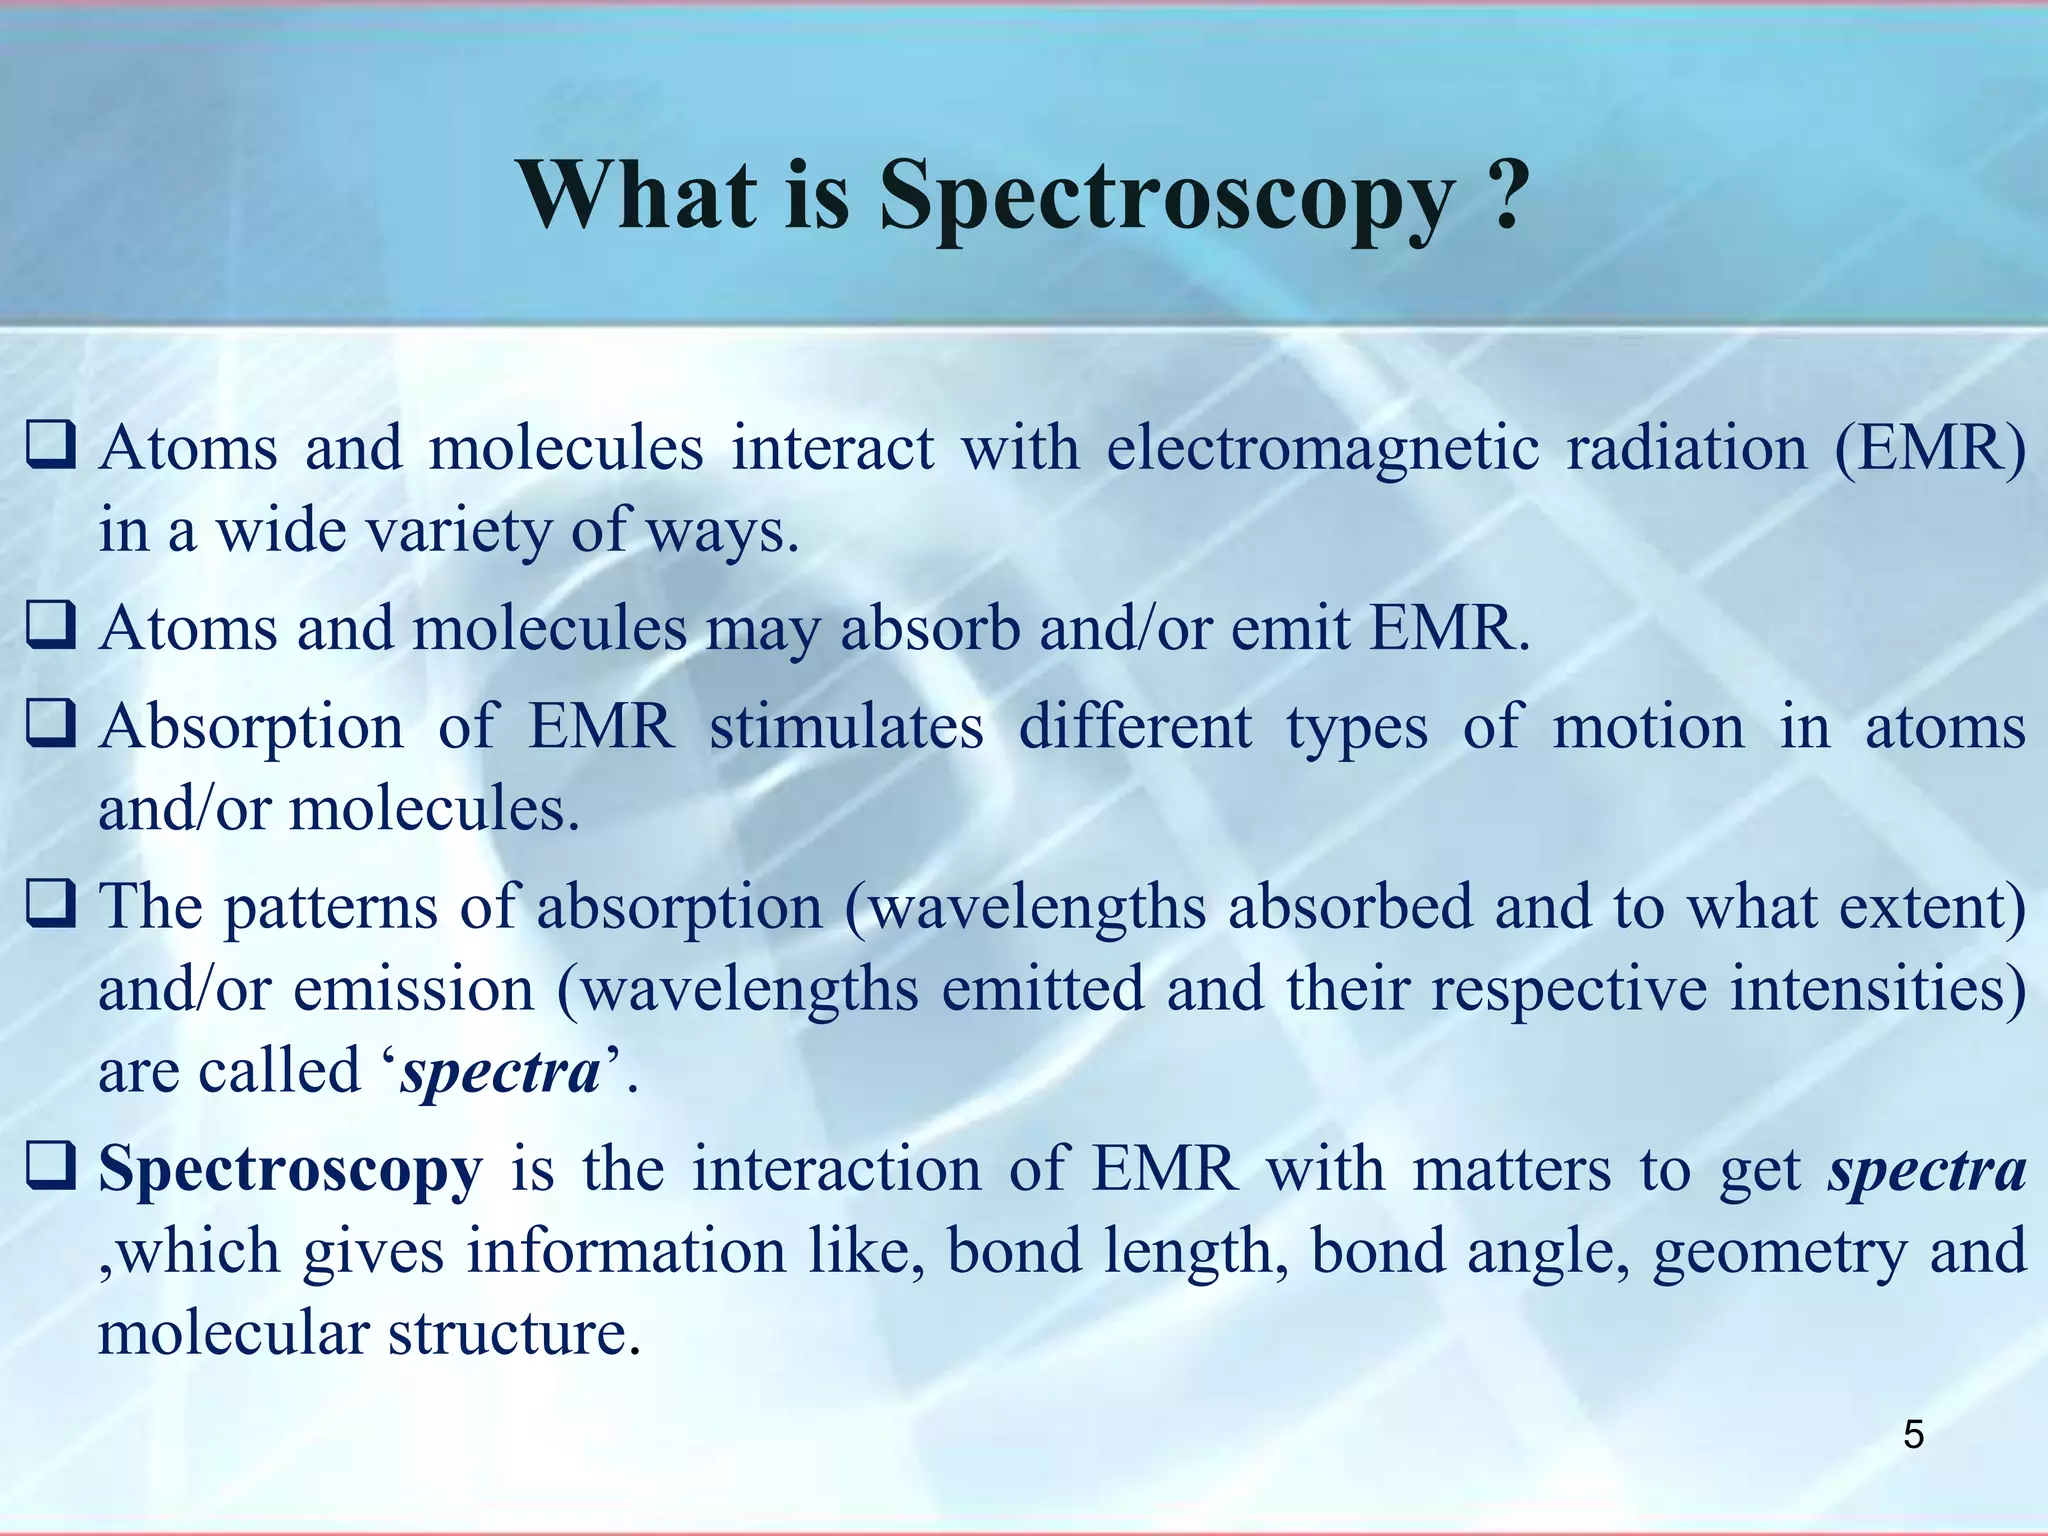
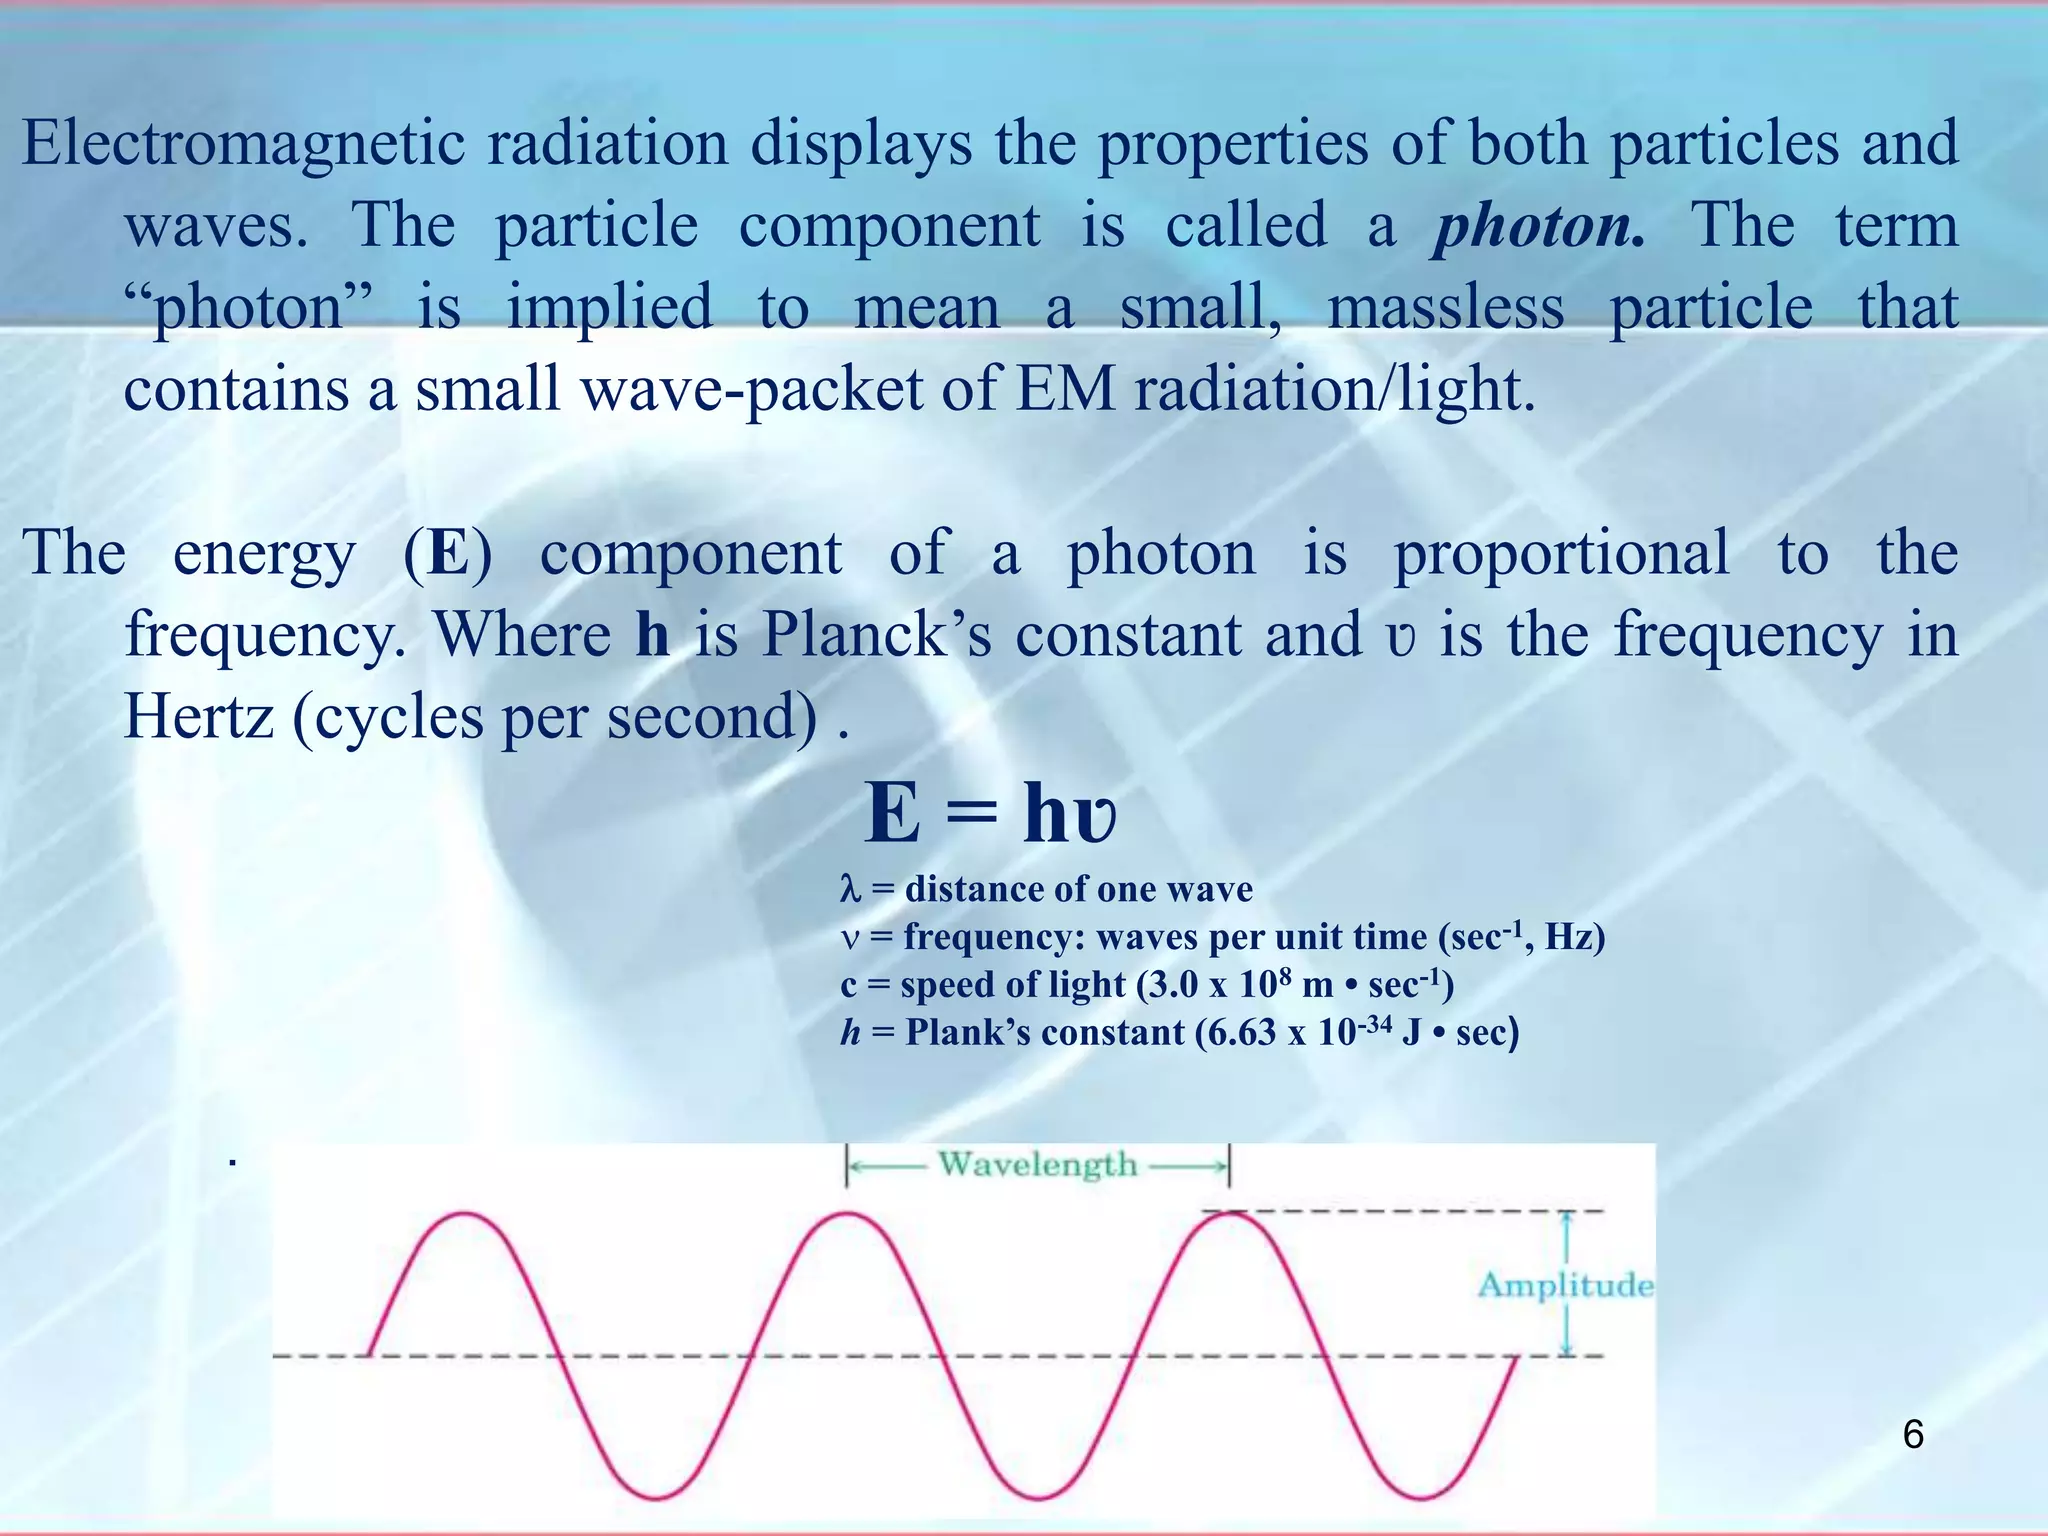
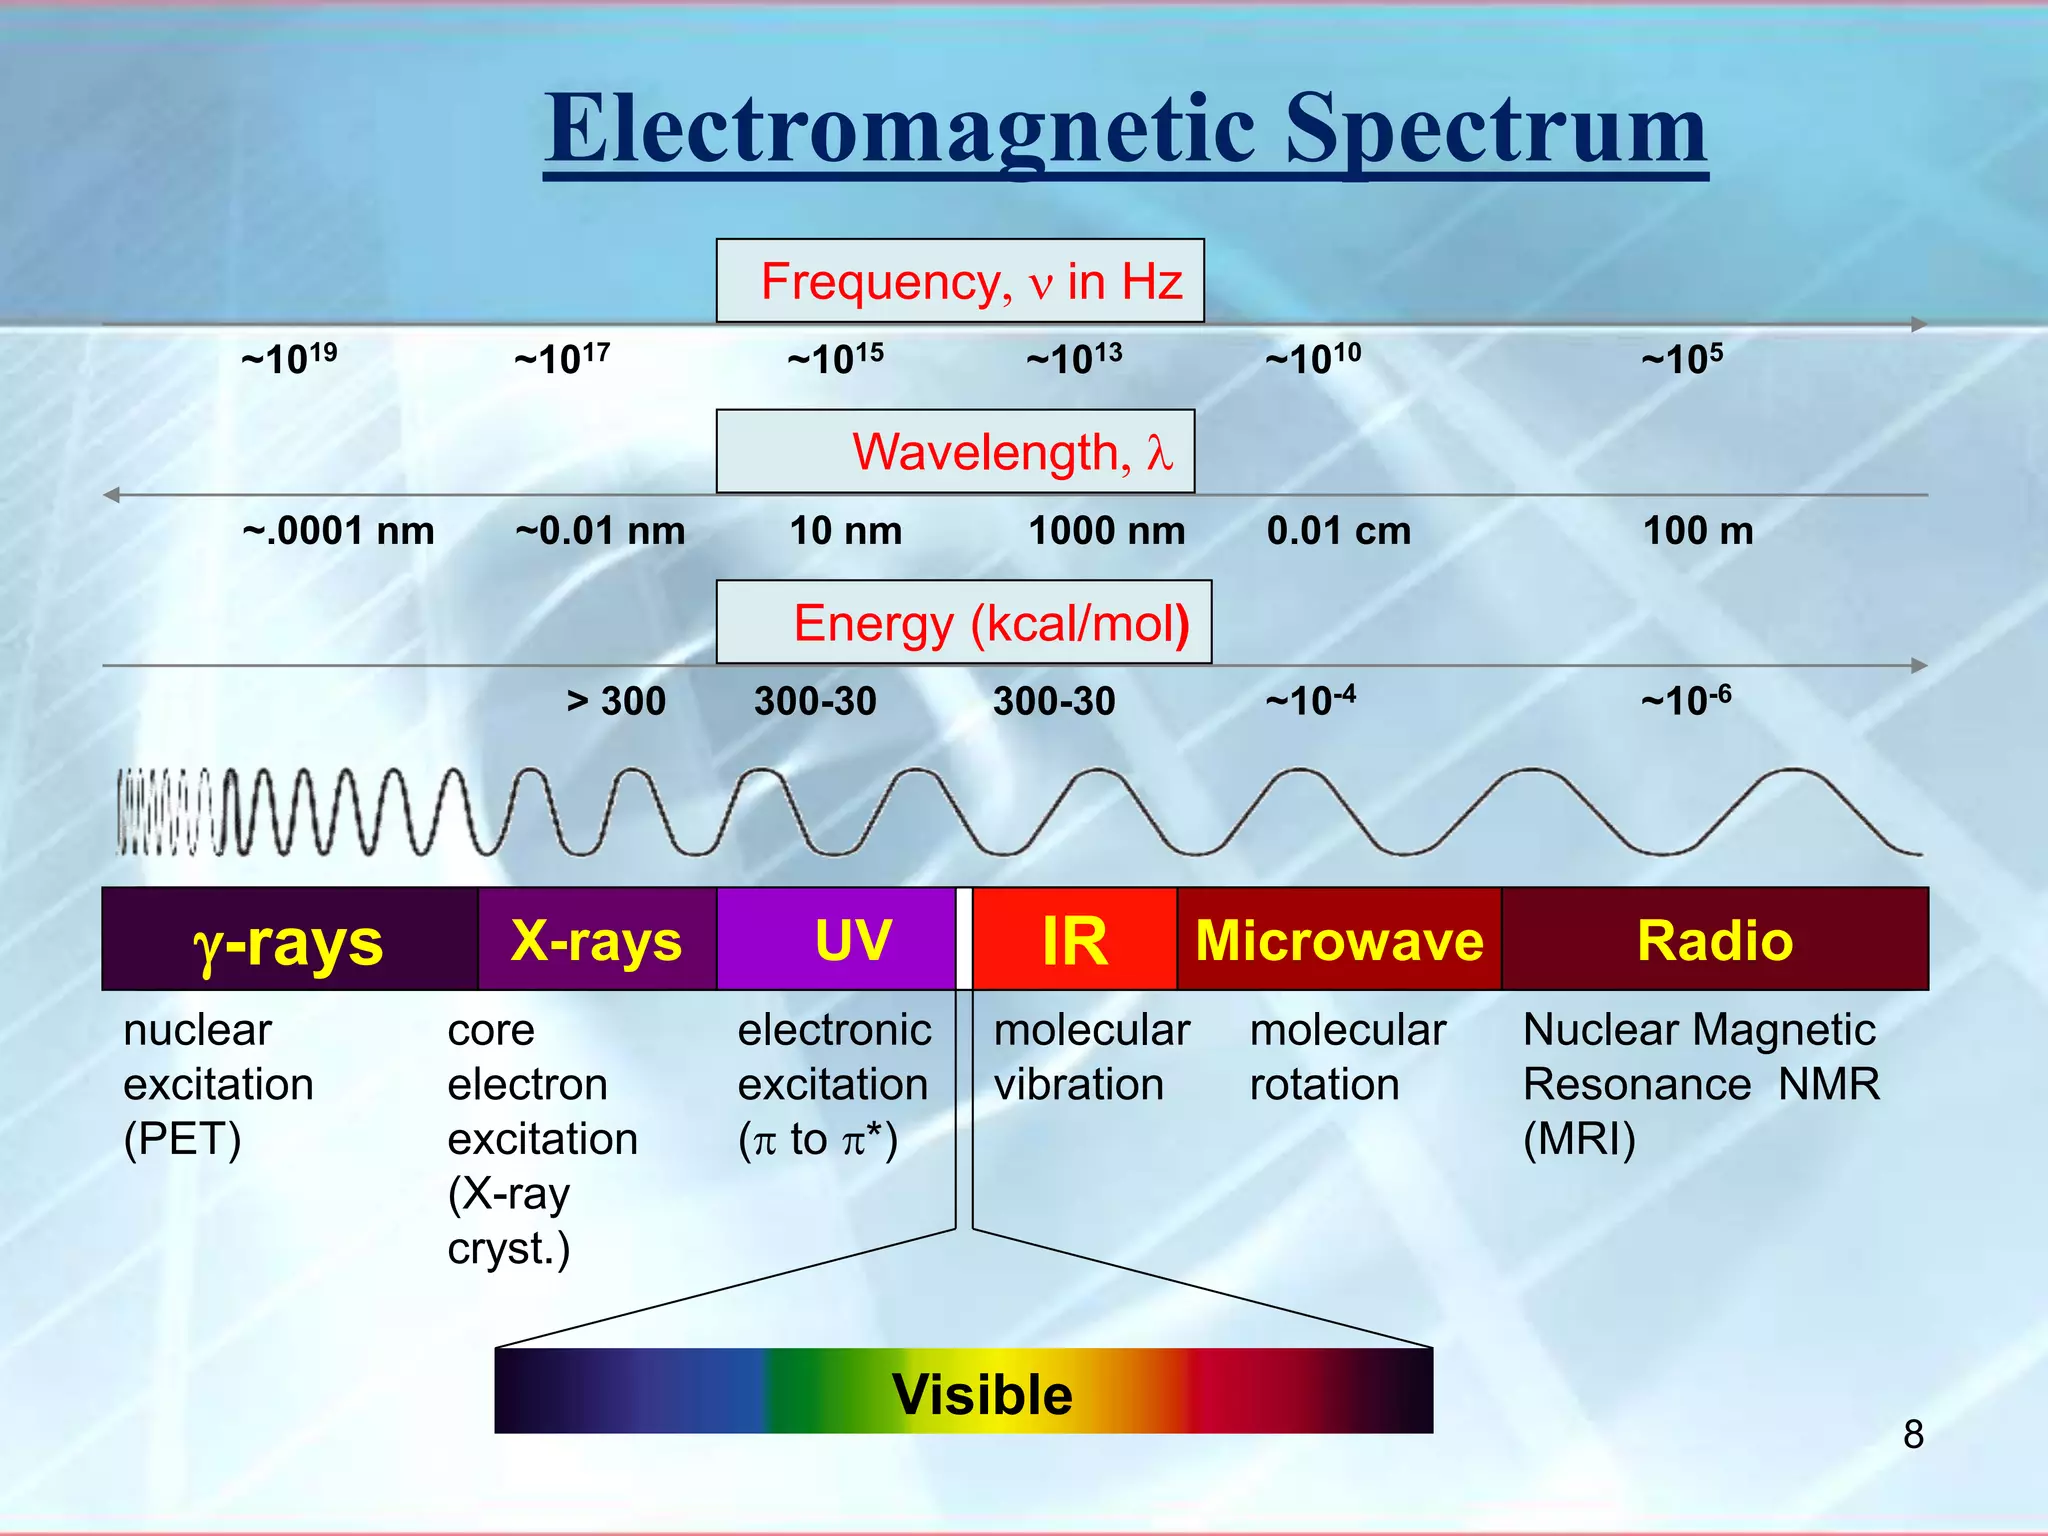
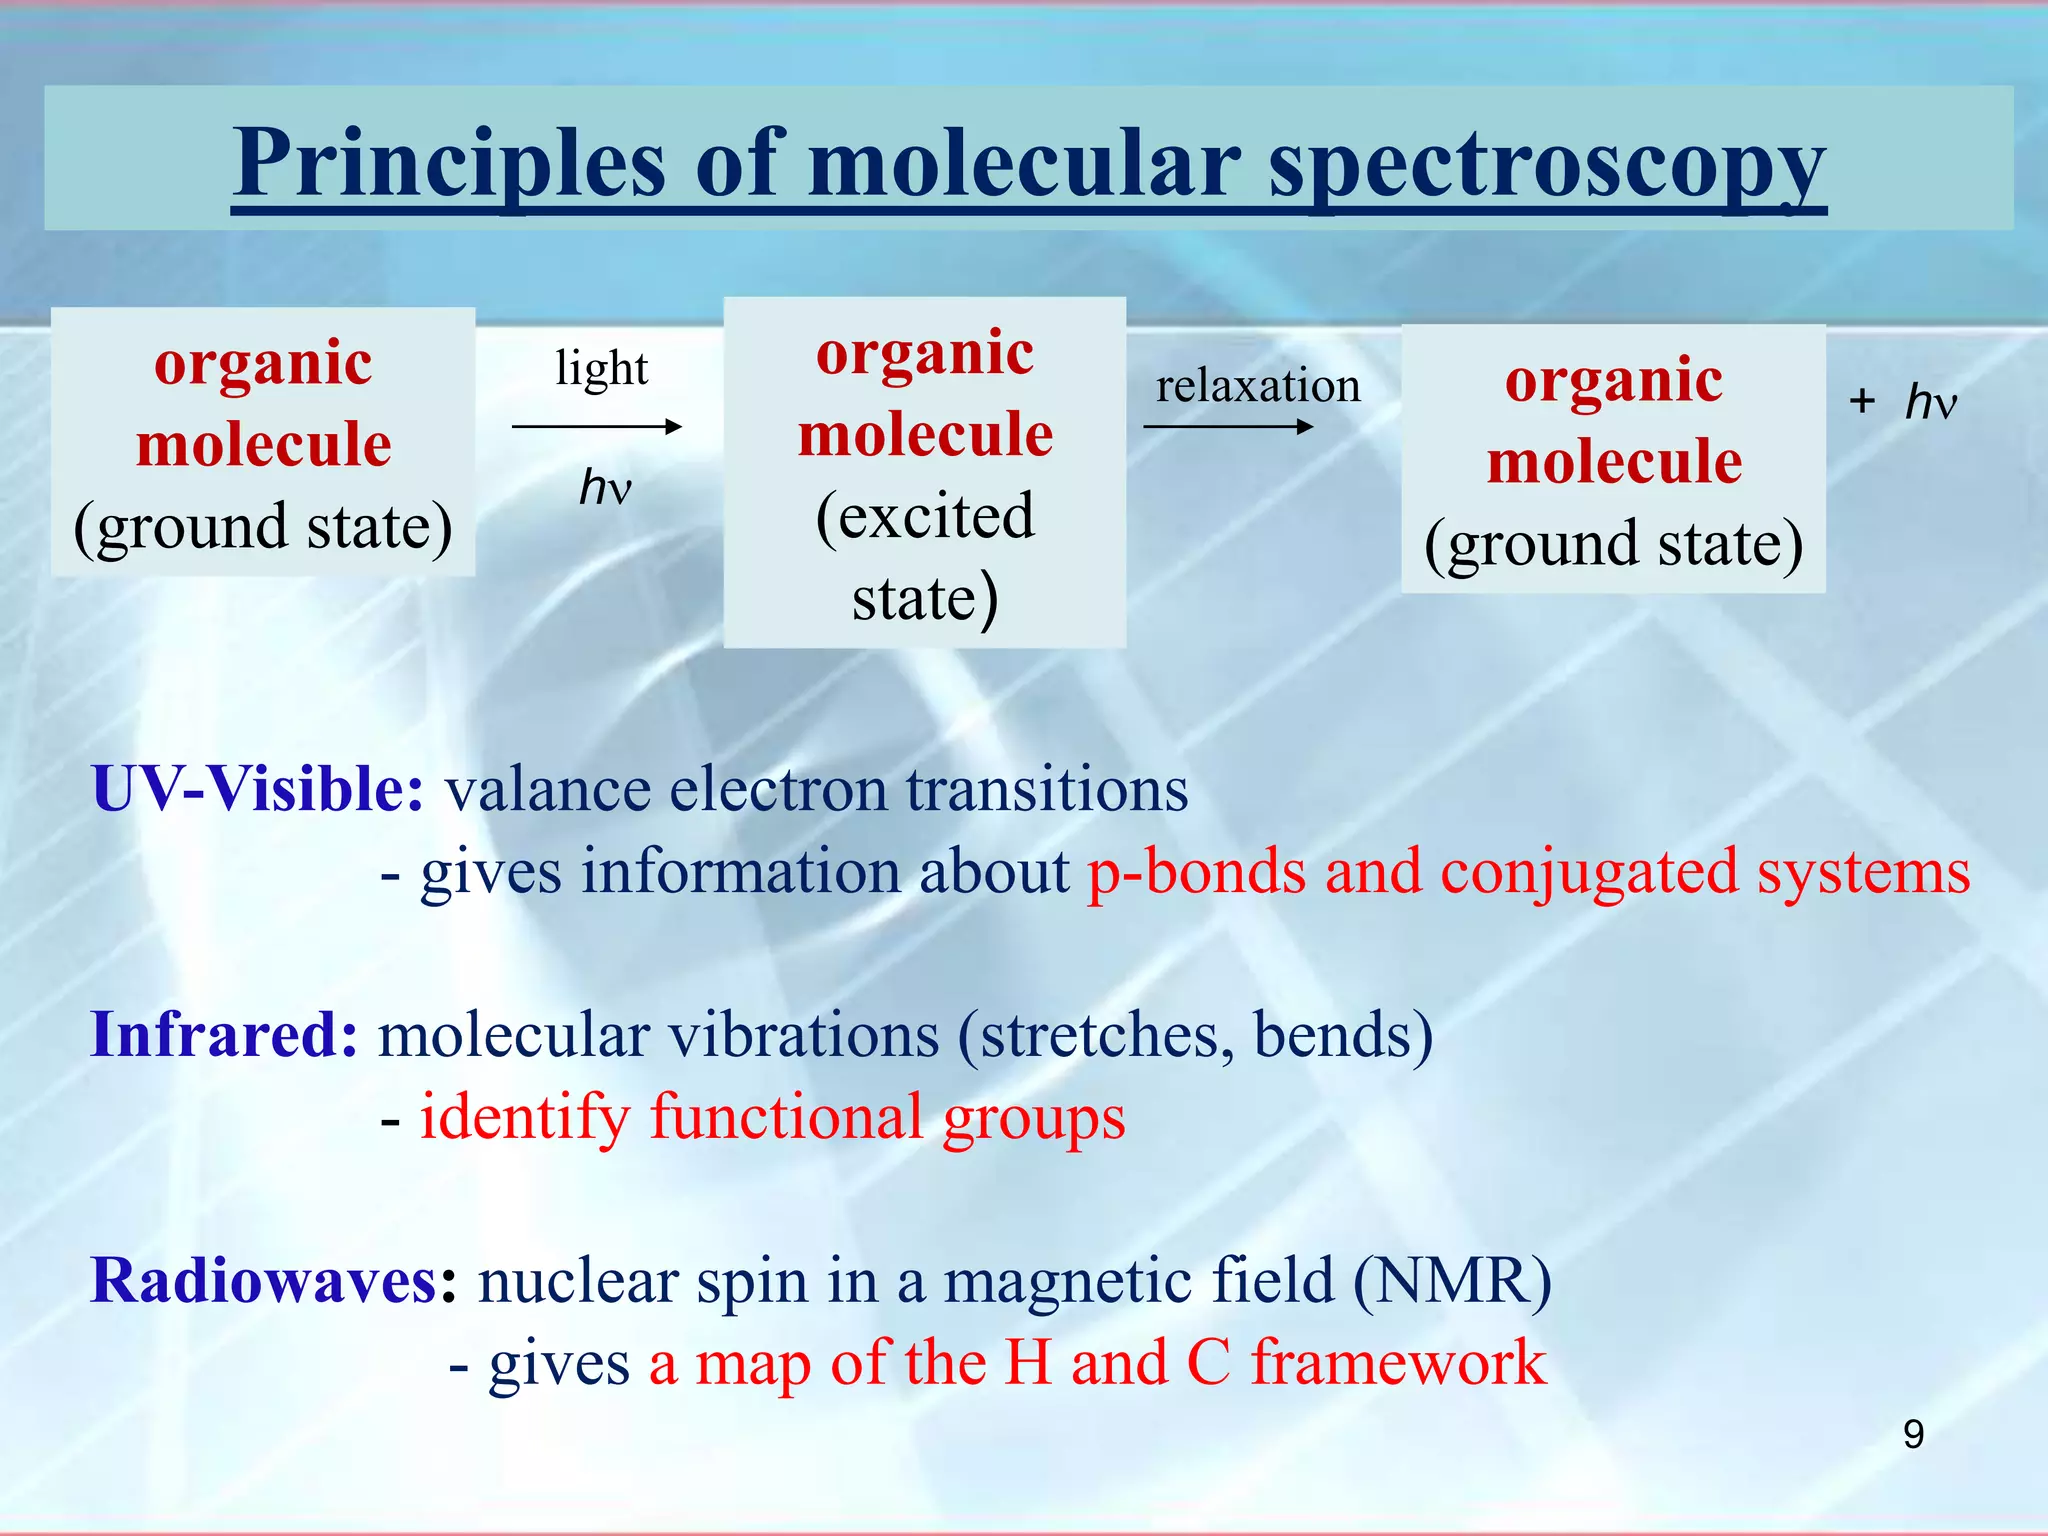
- Broad band ~ 2100 cm-1
- NH band ~ 1500 cm-1
- Carboxylate ion stretch ~ 1600 cm-1
154](https://image.slidesharecdn.com/msinfraredspectroscopy-200420081826/75/Ms-infrared-spectroscopy-154-2048.jpg)