Downloaded 248 times


![ANSWER #2.Product 1
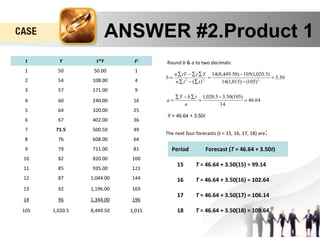
Product 1
Plotting the data for Product 1 reveals a linear pattern with the
exception of demand in week 7. Demand in week 7 is unusually
high and does not fit the linear trend pattern of the remaining
data. Thus, the demand for the 7th week is considered an
outlier. There are different ways of dealing with outliers. A
simple and intuitive way is to replace the demand for the week
in question with the average demand from the previous week
and the next week in the time-series. Therefore in this case, the
demand of 90 in week 7 will be replaced with 71.5 = [(67 + 76)/2].](https://image.slidesharecdn.com/mlcase-141027035107-conversion-gate02/85/M-l-case-7-320.jpg)

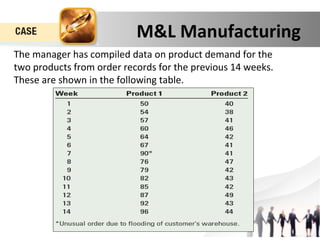
- M&L Manufacturing produces printer and copier components for a major manufacturer as well as for replacement parts distribution. They produce about 20 different items. - Due to competitive pressures and falling profits, the manager wants to introduce formal forecasting to improve production planning and inventory management for two products. - Historical demand data for the past 14 weeks is provided for the two products. Forecasts for the next 4 weeks will be generated using linear regression for Product 1 and an intuitive average-based approach for Product 2.


![Chapter8[1]](https://cdn.slidesharecdn.com/ss_thumbnails/chapter81-140613050936-phpapp02-thumbnail.jpg?width=640&height=640&fit=bounds)
![Production & Operation Management Chapter8[1]](https://cdn.slidesharecdn.com/ss_thumbnails/chapter81-140613051436-phpapp02-thumbnail.jpg?width=640&height=640&fit=bounds)