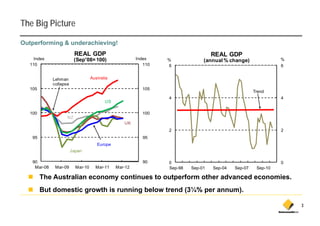
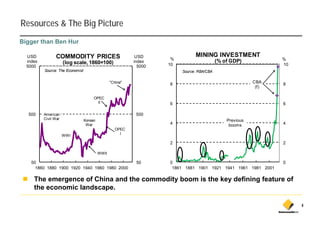
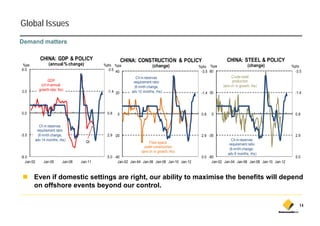
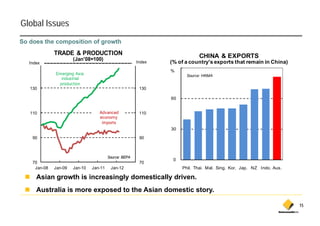
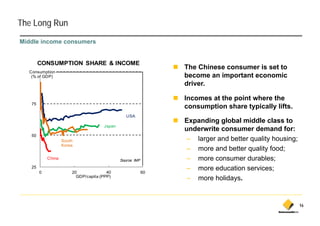
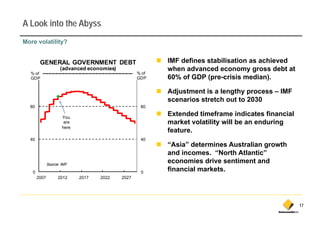
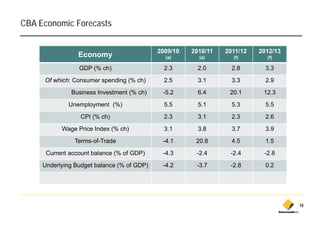
CEO Conference


A Macro Look at Resources
Resources & Energy Symposium


Michael Blythe
Chief Economist
(612) 9118 1101
michael.blythe@cba.com.au

May 2012
Important Information

 This advice has been prepared without considering your objectives, financial situation or needs, and
 before acting on the advice, you should consider its appropriateness to your circumstances.

 Commonwealth Bank of Australia (“CBA”) as a provider of investment, borrowing and other financial
 services undertakes financial transactions with many corporate entities in Australia. This may include any
 corporate issuer referred to in this report.
    p                                   p

 For US and US investors: If you would like to speak to someone regarding the subject securities
 described in this report, please contact Commonwealth Australia Securities LLC (the “US Broker-Dealer”),
 a b k d l registered under th U S S
   broker-dealer      i t d d the U.S. Securities Exchange Act of 1934 (th “E h
                                                 iti E h        A t f       (the “Exchange A t”) and a
                                                                                           Act”) d
 member of the Financial Industry Regulatory Authority (“FINRA”) at 1 (212) 336-7737. This report was
 prepared, approved and published by Global Markets Research, a division of Commonwealth Bank of
 Australia ABN 48 123 123 124 AFSL 234945("the Bank") and distributed in the U.S. by the US Broker-
 Dealer. The Bank is not registered as a broker-dealer under the Exchange Act and is not a member of
 FINRA or any U.S. self-regulatory organization. Commonwealth Australia Securities LLC (“US Broker-
 Dealer”) is a wholly owned, but non-guaranteed, subsidiary of the Bank, organized under the laws of the
 S
 State of Delaware, USA, with limited liability.
                    , US ,                    y

 Please see further disclaimers at the back of this document. Please also view our website at
 www.research.commbank.com.au for a more detailed disclaimer.


                                                                                                              2
The Big Picture

Outperforming & underachieving!
                          REAL GDP                                                  REAL GDP
     Index                ( p
                          (Sep'08= 100)
                                      )                  Index    %             (annual % change)               %
   110                                                      110   6                                             6


              Lehman                Australia
              collapse
   105                                                     105
                                                                                                      Trend
                                                                  4                                             4
                                           US

   100                                                     100
                     NZ
                                                   UK
                                                                  2                                             2
    95                                                      95
                                       Europe
                         Japan

    90                                                      90    0                                             0
     Mar-08    Mar-09      Mar-10     Mar-11    Mar-12            Sep-98   Sep-01   Sep-04   Sep-07    Sep-10

         The Australian economy continues to outperform other advanced economies.
         But domestic growth is running below trend (3¼% per annum).
                                                             annum)

                                                                                                                    3
Resources & The Big Picture
Bigger than Ben Hur

  USD           COMMODITY PRICES                             USD                MINING INVESTMENT
                                                                      %                                           %
  index               (log scale, 1860=100)
                           scale                            index                           (% of GDP)
  5000                                                        5000   10                                           10
          Source: The Economist                                           Source: RBA/CBA

                                                  "China"            8                                     CBA    8
                                                                                                            (f)

                                       OPEC
                                         II                          6                                            6

  500     American
          A     i                                            500
          Civil War               Korean                                                        Previous
                                   War                               4                           booms            4
                                                     OPEC
                      WWI                              I

                                                                     2                                            2

                                           WWII

    50                                                       50      0                                            0
      1860 1880 1900 1920 1940 1960 1980 2000                         1861 1881 1901 1921 1941 1961 1981 2001

     The emergence of China and the commodity boom is the key defining feature of
                         p
     the economic landscape.

                                                                                                                       4
Resources & The Economy

The good – income
                                                                 The commodity story is an income
        COMMODITY INCOME BOOST*                                  story.
   %                      (% of GDP)                        %


   4                                                        4    The numbers:
                                                                 –   the income injection fro higher
                                                                     commodity prices has been worth
   2                                                        2        1-2%
                                                                     1 2% of GDP pa over the past
                                                                     eight years;
                                                                 –   incomes are $7,100 per person
   0                                                        0        per annum higher than otherwise;
                                                  2011/12
                                                    to           –   a ship load of iron ore “bought”
        *Source: CBA calculations                 2012/13
                                                                     2,200
                                                                     2 200 flat screen TV’s in 2005 –
                                                                                        TV s
   -2                                                       -2
    1994/95   1998/99    2002/03    2006/07   2010/11
                                                                     now buys 22,000!.
                                                                 Source: RBA Governor Glenn Stevens Nov’10


                                                                                                             5
Resources & The Economy
The bad – a “patchwork” economy


             ECONOMIC ACTIVITY
                                                              Consensus has trend GDP growth
 Index               (2010/11 = 100)                  Index   over next few years and resources
 145                                                    145
         Source: RBA , CBA                                    accounting for ½-⅔ of that growth.
                                                              Implications:
                              Mining                          –   mining-related economy to expand at
 130                          GDP                      130
                                                                  ≈9-16%pa over next two years;
                                                              –   non-mining economy to grow at just
                                                                  1½-2%pa if overall economy to be
 115                                    Non-mining     115        kept within the “speed limits”.
                                                                    p               p
                                          GDP

                                  GDP


 100                                                   100
         2010/11             2011/12        2012/13


                                                                                                        6
Resources & The Economy
The ugly – a high AUD
                 AUD EXPECTATIONS                                 ESTABLISH FOREIGN OPERATIONS?
               (average for the next 10 years)                                    (% of respondents)
   95
    US
   cents                            Source: CBA AUD Barometer        Total


   90                                                           Financials
                         Average of
                        past ten years
                                                                     Other
   85

                                                                Consumer

   80
                                                                Industrials


   75                                                            Materials
                                                                 M t i l


                                                                Resources
   70                                                                                       *Source: CBA AUD Barometer
             Importer         Exporter         Both imp. &
                                                 export                       0        15     %      30              45


           Most businesses now believe the Aussie will be permanently higher

           High
           Hi h AUD i h i an i
                    is having impact on capex and labour hiring plans.
                                   t            dl b     hi i    l
                                                                                                                          7
Maximise The Benefits
Minimising domestic constraints - exports

           CAPEX & PROJECT STATUS                                            COAL EXPORT CAPACITY
   % of                                                 Index   Mtpa                                                Mtpa
   24
   GDP                                                    400
                               Under
                           consideration*                                            Committed
                                                                450                   capacity                       450
                         (adv 2-years, rhs)
   20                                                    300


              Business                                          350                                                  350
               capex
   16                                                    200
                (lhs)                                                    Capacity

                                                                                                   Exports

   12                                                    100    250                                                  250


                            *Source: ACCESS Economics                   Source: RBA/BREE
    8                                                    0      150                                                  150
    Mar-02    Mar-05      Mar-08      Mar-11                          2005    2007   2009   2011   2013      2015

        The peak impact of the mining construction boom is still some way off.
        A new growth d i
                  th driver will be needed eventually – resource exports need to rise.
                             ill b     d d     t ll                   t     dt i
                                                                                                                           8
Maximise The Benefits
Minimising domestic constraints - costs

                                                          Heavy construction focus raises cost
                                                               y
   $/wk      CONSTRUCTION WAGES                $/wk
                                                          risks in an environment of skill
  1300                                             1300
                        QIV - 2011
                                                          shortages and pressures on
                                                          materials.
  1200                                             1200


  1100                                             1100   A theme in recent RBA commentary
                                                          is the need to contain nominal labour
  1000                                             1000
                                                          cost growth and boost productivity
                                                          growth.
   900                                             900
                                 Real wages

   800                                             800
         6      7            8           9    10
                    Share of labour market


                                                                                                  9
Maximise The Benefits
Getting policy right – Pt I

                                                     The non-mining economy and the
           HOUSEHOLD SPENDING
   %                 (% of GDP)                 %
                                                     household component of it are bearing
   66                                           66   the brunt of structural adjustment.

                                                     Policy
                                                     P li makers have a role to play:
                                                            k    h        l t    l

   63                                           63   –   lower interest rates will help;
                                                     –   targeting low-middle i
                                                         t    ti l      iddl incomes and small
                                                                                         d  ll
                                    6%
                                  of GDP
                                                         business for support will help;
   60                                           60   –   need to get tax p
                                                                  g      policy right – scrapping
                                                                               y g          pp g
                                                         company tax cut and 50% discount on
                                                         interest earnings is disappointing;

   57                                           57
                                                     –   changing superannuation rules (again)
    Sep-59 Sep-68 Sep-77 Sep-86 Sep-95 Sep-04            is disappointing;


                                                                                                    10
Maximise The Benefits

Getting policy right – Pt II
           RANKING OF COUNTRIES FOR MINING INVESTMENT BY KEY DECISION CRITERIA: 2011
                (highest ranking for each category is 10 so maximum score is 70)       Source: Behre Dolbear Mining Survey


   RANK    COUNTRY      ECONOMIC      POLITICAL     SOCIAL    PERMITTING      CORRUPTION           CURRENCY            TAX       TOTAL
                         SYSTEM        SYSTEM       ISSUES      DELAYS                             STABILITY          REGIME     POINTS


     1
                Table on9
           Australia
           A t li                          8           8            8              10                    9                   5     57
     2          location 9drivers
            Canada                         9           4            4              10                    9                   7     52
     3       Chile           9             9           7            6              8                     8                   4     51
     4      Brazil           7             8           5            5              5                     9                   6     45
     5      Mexico           8             8           2            7              6                     6                   7     44
     6       USA             8             9           3            1              10                    7                   3     41
     7     Colombia          6             7           6            6              5                     5                   4     39
   8 Tie   Botswana          6             5           5            5              5                     5                   6     37
   8 Tie     Peru            6             6           4            4              5                     7                   5     37
     ↕
    25      Russia           1             1           3            3              1                     2                   5     16

     Global investment decisions depend on more than tax regimes.
     Even if Australia dropped to “1” for tax regime would still rank No. 2 globally
                                   1          regime,                 No globally.

                                                                                                                                          11
Maximise The Benefits
Selling the story – the unhappy consumer

                                                           Households are unhappy.
          PERSONAL CIRCUMSTANCES
    %              (net % of respondents)            %
   40                                                40    General feeling that the “benefits” of
                                                           the resources boom are not being
                                                           shared around while the “costs” are:
                                                            h    d       d hil th “      t ”
   20                                                20
                Better in six                              –   no tax cuts - carbon tax and flood
                months time
                                                               levy instead;
                                                                  y         ;
                                       Better
    0
                                      than six
                                                     0     –   high Aussie dollar hurting some
                                      months                   key sectors;
                                        ago

   -20                                               -20   –   household budgets under pressure
                                                               (utilities, health etc);
         Source: CBA Viewpoint                             –   retirement savings struggling;
   -40                                               -40
      Apr 09   Jan 10     Oct 10   Jul 11   Apr 12
                                                           –   job security fears.


                                                                                                    12
Maximise The Benefits
Selling the story – sharing the spoils
     SHARING THE COMMODITY BOOM                                      SALARIES: WHERE SPENT
                 (
                 (cents per $ of revenue)
                        p               )                               (% of total earned in region)
                                                              %
       Leakage offshore                                       100

            Payment to
             domestic
           shareholders                                        75

    Payment of royalties
         & taxes                                                                                      Stays in
                                                                                                          y
                                             50-60c of         50                                     region
                                            every $ of
      Buying domestic                         income                                                  Leaves
     services & imports                     remains in                                                region
   into resources sector                     Australia         25

       Paying domestic
            labour
                                                                0
                           0    15          30           45         Northern WA    Central Qld
   Source: RBA                                                                                   Source: CBA Viewpoint

   RBA calculations are that 50-60¢ of each $ of resources revenue remains in Aust.
   The benefits of the boom do spread through the broader economy.
                                                          economy

                                                                                                                         13
Global Issues
Demand matters

               CHINA: GDP & POLICY                          CHINA: CONSTRUCTION & POLICY                          CHINA: STEEL & POLICY
%pa                 (annual % change)           %pts %pa                     (change)                                           (change)
                                                                                                   %pts %pa                                           %pts
6.0                                               -3.5 40                                           -3.5 60                                             -3.5
                                                                   Ch in reserves                                    Crude steel
                     GDP                                         requirement ratio                                    production
                (ch in annual                                     (6 mnth change
                                                                           change,                              (ann ch in g
                                                                                                                (          growth, lhs)
                                                                                                                                 , )
3.0           growth rate, lhs)                   -1.4 20       adv 12 months, rhs)                 -1.4 30                                             -1.4


0.0
00                                               0.8
                                                 08     0                                           0.8
                                                                                                    08    0                                             0.8
                                                                                                                                                        08


               Ch in reserves
             requirement ratio
-3.0          (6 mnth change,                    2.9 -20                                            2.9 -30                                             2.9
            adv 14 months, rhs)
             d          th h )           QI                                                                          Ch iin reserves
                                                                           Floor space                              requirement ratio
                                                                        under construction
                                                                                                                    (6 mnth change,
                                                                      (ann ch in growth, lhs)
                                                                                                                   adv 8 months, rhs)
-6.0                                             5.0 -40                                            5.0 -60                                             5.0
   Jan-02        Jan-05       Jan-08   Jan-11          Jan-02 Jan-04 Jan-06 Jan-08 Jan-10 Jan-12          Jan-02 Jan-04 Jan-06 Jan-08 Jan-10 Jan-12


        Even if domestic settings are right, our ability to maximise the benefits will depend
        on offshore events beyond our control.

                                                                                                                                                          14
Global Issues
So does the composition of growth
              TRADE & PRODUCTION                                            CHINA & EXPORTS
                       (
                       (Jan'08=100)
                                  )
   Index
   I150
     d                                                  Index
                                                          150   (% of a country's exports that remain in China)
                                                                        country s
                                                                90
                                                                %
              Emerging Asia                                            Source: HKMA
                industrial
               production
   130                                                   130

                                                                60


   110                             Advanced              110
                                   economy
                                    imports
                                                                30

    90                                                   90


                                         Source: BEPA
                                                                 0
    70                                                   70
     Jan-08   Jan-09   Jan-10   Jan-11    Jan-12                     Phil. Thai. Mal. Sing. Kor. Jap. NZ Indo. Aus.

      Asian growth is increasingly domestically driven.
      Australia is more exposed to the Asian domestic story
                                                      story.

                                                                                                                      15
The Long Run
Middle income consumers


        CONSUMPTION SHARE & INCOME
                                                                 The Chinese consumer is set to
  Consumption
  100
   (% of GDP)                                                    become an important economic
                                                                 driver.

                                                                 Incomes at the point where the
   75
                                                                 consumption share typically lifts.
                                                 USA
                                                                 Expanding global middle class to
                                      Japan
                                                                 underwrite consumer demand for:
   50
                    South                                         – larger and better quality housing;
                    Korea
                                                                  – more and better quality food;
            China                             Source: IMF         – more consumer durables;
   25
        0               20              40                  60
                                                                  – more education services;
                          GDP/capita (PPP)
                                                                  – more holidays.


                                                                                                         16
A Look into the Abyss
More volatility?


        GENERAL GOVERNMENT DEBT                            IMF defines stabilisation as achieved
 Title               (advanced economies)                  when advanced economy gross debt at
 120 of
  %                                                % 120
                                                     of
  GDP                                              GDP     60% of GDP (pre-crisis median).

                                                           Adjustment is a lengthy process – IMF
                                                           scenarios stretch out to 2030
  80                                                80

                      You
                                                           Extended timeframe indicates financial
                       are                                 market volatility will be an enduring
                      here
                                                           feature.
  40                                                40
                                                           “Asia” determines Australian growth
                                                           and incomes. “North Atlantic”
              Source: IMF
                                                           economies drive sentiment and
   0                                                0
                                                           financial markets.
       2007         2012     2017   2022    2027


                                                                                                    17
CBA Economic Forecasts

                                            2009/10   2010/11   2011/12   2012/13
                 Economy                      (a)       (a)       (f)       (f)

                 GDP (% ch)                   2.3       2.0       2.8       3.3
     Of which: Consumer spending (% ch)       2.5       3.1       3.3       2.9
              Business Investment (% ch)     -5.2       6.4      20.1      12.3
             Unemployment (%)                 5.5       5.1       5.3       5.5
                 CPI (% ch)                   2.3       3.1       2.3       2.6
           Wage Price Index (% ch)            3.1       3.8       3.7       3.9
               Terms-of-Trade
               T      fT d                   -4.1
                                              41       20.8
                                                       20 8       4.5
                                                                  4         1.5
                                                                            1
      Current account balance (% of GDP)     -4.3      -2.4      -2.4      -2.8
     Underlying Budget balance (% of GDP)    -4.2
                                              42       -3.7
                                                        37       -2.8
                                                                  28        0.2
                                                                            02


                                                                                    18
CBA Market Forecasts

                       Markets         Jun’12   Sep’12   Dec’12   Mar’13
           Australia   Official cash    3¾       3½       3½       3½
                        90-day bills    3.8      3.6      3.6      3.6
                       3-year bonds     2.7      2.7      2.8      2.9
                       10-year bonds    3.5      3.6      3.8      3.9


                       3-year swap      3.4      3.4      3.4      3.5
                       10-year swap     4.3      4.4      4.6      4.6


             USA        Fed funds       0-¼      0-¼      0-¼      0-¼
                       2-year bonds     0.2      0.3      0.4      0.4
                       10-year b d
                       10      bonds    2.0
                                        20       2.2
                                                 22       2.5
                                                          2        2.7
                                                                   2


           Spreads     AUS-US 10 yr     150      140      130      120
                       AUS 3-10 yr       80       90      100      100


              FX           AUD          0.98     1.01     1.03     1.04
                           TWI          73.9
                                        73 9     75.8
                                                 75 8     76.8
                                                          76 8     77.1
                                                                   77 1


                                                                           19
Important Disclosures & Disclaimer
Please view our website at www.research.commbank.com.au. The Commonwealth Bank of Australia ABN 48 123 123 124 AFSL 234945 ("the Bank") and its subsidiaries,
including Commonwealth Securities Limited ABN 60 067 254 399 AFSL 238814 ("CommSec"), Commonwealth Australia Securities LLC, CBA Europe Ltd and Global Markets
Research, are domestic or foreign entities or business areas of the Commonwealth Bank Group of Companies (CBGOC). CBGOC and their directors, employees and
representatives are referred to in this Appendix as “the Group”. This report is published solely for informational purposes and is not to be construed as a solicitation or an offer to
buy any securities or financial instruments. This report has been prepared without taking account of the objectives, financial situation and capacity to bear loss, knowledge,
experience or needs of any specific person who may receive this report No member of the Group does or is required to assess the appropriateness or suitability of the report for
                                                                      report.                           does,                to,
recipients who therefore do not benefit from any regulatory protections in this regard. All recipients should, before acting on the information in this report, consider the
appropriateness and suitability of the information, having regard to their own objectives, financial situation and needs, and, if necessary seek the appropriate professional, foreign
exchange or financial advice regarding the content of this report. We believe that the information in this report is correct and any opinions, conclusions or recommendations are
reasonably held or made, based on the information available at the time of its compilation, but no representation or warranty, either expressed or implied, is made or provided as
to accuracy, reliability or completeness of any statement made in this report. Any opinions, conclusions or recommendations set forth in this report are subject to change without
notice and may differ or be contrary to the opinions conclusions or recommendations expressed elsewhere by the Group We are under no obligation to and do not update or
                                               opinions,                                                                  Group.                                to,       not,
keep current the information contained in this report. The Group does not accept any liability for any loss or damage arising out of the use of all or any part of this report. Any
valuations, projections and forecasts contained in this report are based on a number of assumptions and estimates and are subject to contingencies and uncertainties. Different
assumptions and estimates could result in materially different results. The Group does not represent or warrant that any of these valuations, projections or forecasts, or any of the
underlying assumptions or estimates, will be met. Past performance is not a reliable indicator of future performance. The Group has provided, provides, or seeks to provide,
investment banking, capital markets and/or other services, including financial services, to the companies described in the report and their associates. This report is not directed to,
or intended for distribution to or use by, any person or entity who is a citizen or resident of or located in any locality, state, country or other jurisdiction where such distribution,
                                         y, y p                 y                                                  y      y,     ,       y          j                                   ,
publication, availability or use would be contrary to law or regulation or which would subject any entity within the Group to any registration or licensing requirement within such
jurisdiction. All material presented in this report, unless specifically indicated otherwise, is under copyright to the Group. None of the material, nor its content, nor any copy of it,
may be altered in any way, transmitted to, copied or distributed to any other party, without the prior written permission of the appropriate entity within the Group. In the case of
certain products, the Bank or one of its related bodies corporate is or may be the only market maker. The Group, its agents, associates and clients have or have had long or short
positions in the securities or other financial instruments referred to herein, and may at any time make purchases and/or sales in such interests or securities as principal or agent,
including selling to or buying from clients on a principal basis and may engage in transactions in a manner inconsistent with this report.
US Investors:
If you would like to speak to someone regarding the subject securities described in this report, please contact Commonwealth Australia Securities LLC (the “US Broker-Dealer”), a
broker-dealer registered under the U.S. Securities Exchange Act of 1934 (the “Exchange Act”) and a member of the Financial Industry Regulatory Authority (“FINRA”) at 1 (212)
336-7737. This report was prepared, approved and published by Global Markets Research, a division of Commonwealth Bank of Australia ABN 48 123 123 124 AFSL 234945
("the Bank") and distributed in the U.S. by the US Broker-Dealer. The Bank is not registered as a broker-dealer under the Exchange Act and is not a member of FINRA or any U.S.
self regulatory organization.
self-regulatory organization Commonwealth Australia Securities LLC (“US Broker-Dealer”) is a wholly owned but non-guaranteed subsidiary of the Bank organized under the
                                                                           ( US Broker Dealer )             owned,       non guaranteed,                      Bank,
laws of the State of Delaware, USA, with limited liability. The US Broker-Dealer is not authorized to engage in the underwriting of securities and does not make markets or
otherwise engage in any trading in the securities of the subject companies described in our research reports. The US Broker-Dealer is the distributor of this research report in the
United States under Rule 15a-6 of the Exchange Act and accepts responsibility for its content. Global Markets Research and the US Broker-Dealer are affiliates under common
control. Computation of 1% beneficial ownership is based upon the methodology used to compute ownership under Section 13(d) of the Exchange Act. The securities discussed in
this research report may not be eligible for sale in all States or countries, and such securities may not be suitable for all types of investors. Offers and sales of securities discussed
in this research report, and the distribution of this report, may be made only in States and countries where such securities are exempt from registration or qualification or have
                    p ,                                  p ,     y               y                                                            p          g            q
been so registered or qualified for offer and sale, and in accordance with applicable broker-dealer and agent/salesman registration or licensing requirements. The preparer of this
research report is employed by Global Markets Research and is not registered or qualified as a research analyst, representative, or associated person under the rules of FINRA,
the New York Stock Exchange, Inc., any other U.S. self-regulatory organization, or the laws, rules or regulations of any State.
                                                                                                                                                                                             20
European Investors:
This report is published, approved and distributed in the UK by the Bank and by CBA Europe Ltd (“CBAE”). The Bank and CBAE are both registered in England (No. BR250 and
05687023 respectively) and authorised and regulated in the UK by the Financial Services Authority (“FSA”). This report does not purport to be a complete statement or summary.
For the purpose of the FSA rules, this report and related services are not intended for retail customers and are not available to them. The products and services referred to in this
report may put your capital at risk. Investments, persons, matters and services referred to in this report may not be regulated by the FSA. CBAE can clarify where FSA
regulations apply.
Singapore Investors:
This report is distributed in Singapore by Commonwealth Bank of Australia, Singapore Branch (company number F03137W) and is made available only for persons who are
Accredited Investors as defined in the Singapore Securities and Futures Act and the Financial Advisers Act. It has not been prepared for, and must not be distributed to or
replicated i any f
   li t d in      form, t anyone who i not an A
                        to          h is t    Accredited I
                                                   dit d Investor.
                                                              t
Hong Kong Investors:
This report was prepared, approved and published by the Bank, and distributed in Hong Kong by the Bank's Hong Kong Branch. The Hong Kong Branch is a registered institution
with the Hong Kong Monetary Authority to carry out the Type 1 (Dealing in securities) and Type 4 (Advising on securities) regulated activities under the Securities and Futures
Ordinance. Investors should understand the risks in investments and that prices do go up as well as down, and in some cases may even become worthless. Research report on
collective investment schemes which have not been authorized by the Securities and Futures Commission is not directed to, or intended for distribution in Hong Kong.
                                                                y                                                        ,                                   g     g
All investors:
Analyst Certification and Disclaimer: Each research analyst, primarily responsible for the content of this research report, in whole or in part, certifies that with respect to each
security or issuer that the analyst covered in this report: (1) all of the views expressed accurately reflect his or her personal views about those securities or issuers; and (2) no
part of his or her compensation was, is, or will be, directly or indirectly, related to the specific recommendations or views expressed by that research analyst in the report. The
analyst(s) responsible for the preparation of this report may interact with trading desk personnel, sales personnel and other constituencies for the purpose of gathering,
synthesizing, and i t
    th i i       d interpreting market i f
                            ti       k t information. Di t
                                                ti    Directors or employees of th G
                                                                         l        f the Group may serve or may h have served as officers or di t
                                                                                                                             d     ffi      directors of th subject company of thi
                                                                                                                                                       f the bj t               f this
report. The compensation of analysts who prepared this report is determined exclusively by research management and senior management (not including investment banking).
No inducement has been or will be received by the Group from the subject of this report or its associates to undertake the research or make the recommendations. The research
staff responsible for this report receive a salary and a bonus that is dependent on a number of factors including their performance and the overall financial performance of the
Group, including its profits derived from investment banking, sales and trading revenue.
Unless agreed separately, we do not charge any fees for any information provided in this presentation. You may be charged fees in relation to the financial products or other
services the B k provides, these are set out i the relevant Fi
    i     h Bank       id   h                  in h    l      Financial S i
                                                                    i l Services G id (FSG) and relevant P d
                                                                                 Guide         d l       Product Di l
                                                                                                                 Disclosure SStatements (PDS) O employees receive a salary
                                                                                                                                          (PDS). Our      l         i        l
and do not receive any commissions or fees. However, they may be eligible for a bonus payment from us based on a number of factors relating to their overall performance
during the year. These factors include the level of revenue they generate, meeting client service standards and reaching individual sales portfolio targets. Our employees may
also receive benefits such as tickets to sporting and cultural events, corporate promotional merchandise and other similar benefits. If you have a complaint, the Bank’s dispute
resolution process can be accessed on 132221.


                                                                                                                                                                                         21

Michael Blythe

  • 1.
    CEO Conference A MacroLook at Resources Resources & Energy Symposium Michael Blythe Chief Economist (612) 9118 1101 michael.blythe@cba.com.au May 2012
  • 2.
    Important Information Thisadvice has been prepared without considering your objectives, financial situation or needs, and before acting on the advice, you should consider its appropriateness to your circumstances. Commonwealth Bank of Australia (“CBA”) as a provider of investment, borrowing and other financial services undertakes financial transactions with many corporate entities in Australia. This may include any corporate issuer referred to in this report. p p For US and US investors: If you would like to speak to someone regarding the subject securities described in this report, please contact Commonwealth Australia Securities LLC (the “US Broker-Dealer”), a b k d l registered under th U S S broker-dealer i t d d the U.S. Securities Exchange Act of 1934 (th “E h iti E h A t f (the “Exchange A t”) and a Act”) d member of the Financial Industry Regulatory Authority (“FINRA”) at 1 (212) 336-7737. This report was prepared, approved and published by Global Markets Research, a division of Commonwealth Bank of Australia ABN 48 123 123 124 AFSL 234945("the Bank") and distributed in the U.S. by the US Broker- Dealer. The Bank is not registered as a broker-dealer under the Exchange Act and is not a member of FINRA or any U.S. self-regulatory organization. Commonwealth Australia Securities LLC (“US Broker- Dealer”) is a wholly owned, but non-guaranteed, subsidiary of the Bank, organized under the laws of the S State of Delaware, USA, with limited liability. , US , y Please see further disclaimers at the back of this document. Please also view our website at www.research.commbank.com.au for a more detailed disclaimer. 2
  • 3.
    The Big Picture Outperforming& underachieving! REAL GDP REAL GDP Index ( p (Sep'08= 100) ) Index % (annual % change) % 110 110 6 6 Lehman Australia collapse 105 105 Trend 4 4 US 100 100 NZ UK 2 2 95 95 Europe Japan 90 90 0 0 Mar-08 Mar-09 Mar-10 Mar-11 Mar-12 Sep-98 Sep-01 Sep-04 Sep-07 Sep-10 The Australian economy continues to outperform other advanced economies. But domestic growth is running below trend (3¼% per annum). annum) 3
  • 4.
    Resources & TheBig Picture Bigger than Ben Hur USD COMMODITY PRICES USD MINING INVESTMENT % % index (log scale, 1860=100) scale index (% of GDP) 5000 5000 10 10 Source: The Economist Source: RBA/CBA "China" 8 CBA 8 (f) OPEC II 6 6 500 American A i 500 Civil War Korean Previous War 4 booms 4 OPEC WWI I 2 2 WWII 50 50 0 0 1860 1880 1900 1920 1940 1960 1980 2000 1861 1881 1901 1921 1941 1961 1981 2001 The emergence of China and the commodity boom is the key defining feature of p the economic landscape. 4
  • 5.
    Resources & TheEconomy The good – income The commodity story is an income COMMODITY INCOME BOOST* story. % (% of GDP) % 4 4 The numbers: – the income injection fro higher commodity prices has been worth 2 2 1-2% 1 2% of GDP pa over the past eight years; – incomes are $7,100 per person 0 0 per annum higher than otherwise; 2011/12 to – a ship load of iron ore “bought” *Source: CBA calculations 2012/13 2,200 2 200 flat screen TV’s in 2005 – TV s -2 -2 1994/95 1998/99 2002/03 2006/07 2010/11 now buys 22,000!. Source: RBA Governor Glenn Stevens Nov’10 5
  • 6.
    Resources & TheEconomy The bad – a “patchwork” economy ECONOMIC ACTIVITY Consensus has trend GDP growth Index (2010/11 = 100) Index over next few years and resources 145 145 Source: RBA , CBA accounting for ½-⅔ of that growth. Implications: Mining – mining-related economy to expand at 130 GDP 130 ≈9-16%pa over next two years; – non-mining economy to grow at just 1½-2%pa if overall economy to be 115 Non-mining 115 kept within the “speed limits”. p p GDP GDP 100 100 2010/11 2011/12 2012/13 6
  • 7.
    Resources & TheEconomy The ugly – a high AUD AUD EXPECTATIONS ESTABLISH FOREIGN OPERATIONS? (average for the next 10 years) (% of respondents) 95 US cents Source: CBA AUD Barometer Total 90 Financials Average of past ten years Other 85 Consumer 80 Industrials 75 Materials M t i l Resources 70 *Source: CBA AUD Barometer Importer Exporter Both imp. & export 0 15 % 30 45 Most businesses now believe the Aussie will be permanently higher High Hi h AUD i h i an i is having impact on capex and labour hiring plans. t dl b hi i l 7
  • 8.
    Maximise The Benefits Minimisingdomestic constraints - exports CAPEX & PROJECT STATUS COAL EXPORT CAPACITY % of Index Mtpa Mtpa 24 GDP 400 Under consideration* Committed 450 capacity 450 (adv 2-years, rhs) 20 300 Business 350 350 capex 16 200 (lhs) Capacity Exports 12 100 250 250 *Source: ACCESS Economics Source: RBA/BREE 8 0 150 150 Mar-02 Mar-05 Mar-08 Mar-11 2005 2007 2009 2011 2013 2015 The peak impact of the mining construction boom is still some way off. A new growth d i th driver will be needed eventually – resource exports need to rise. ill b d d t ll t dt i 8
  • 9.
    Maximise The Benefits Minimisingdomestic constraints - costs Heavy construction focus raises cost y $/wk CONSTRUCTION WAGES $/wk risks in an environment of skill 1300 1300 QIV - 2011 shortages and pressures on materials. 1200 1200 1100 1100 A theme in recent RBA commentary is the need to contain nominal labour 1000 1000 cost growth and boost productivity growth. 900 900 Real wages 800 800 6 7 8 9 10 Share of labour market 9
  • 10.
    Maximise The Benefits Gettingpolicy right – Pt I The non-mining economy and the HOUSEHOLD SPENDING % (% of GDP) % household component of it are bearing 66 66 the brunt of structural adjustment. Policy P li makers have a role to play: k h l t l 63 63 – lower interest rates will help; – targeting low-middle i t ti l iddl incomes and small d ll 6% of GDP business for support will help; 60 60 – need to get tax p g policy right – scrapping y g pp g company tax cut and 50% discount on interest earnings is disappointing; 57 57 – changing superannuation rules (again) Sep-59 Sep-68 Sep-77 Sep-86 Sep-95 Sep-04 is disappointing; 10
  • 11.
    Maximise The Benefits Gettingpolicy right – Pt II RANKING OF COUNTRIES FOR MINING INVESTMENT BY KEY DECISION CRITERIA: 2011 (highest ranking for each category is 10 so maximum score is 70) Source: Behre Dolbear Mining Survey RANK COUNTRY ECONOMIC POLITICAL SOCIAL PERMITTING CORRUPTION CURRENCY TAX TOTAL SYSTEM SYSTEM ISSUES DELAYS STABILITY REGIME POINTS 1 Table on9 Australia A t li 8 8 8 10 9 5 57 2 location 9drivers Canada 9 4 4 10 9 7 52 3 Chile 9 9 7 6 8 8 4 51 4 Brazil 7 8 5 5 5 9 6 45 5 Mexico 8 8 2 7 6 6 7 44 6 USA 8 9 3 1 10 7 3 41 7 Colombia 6 7 6 6 5 5 4 39 8 Tie Botswana 6 5 5 5 5 5 6 37 8 Tie Peru 6 6 4 4 5 7 5 37 ↕ 25 Russia 1 1 3 3 1 2 5 16 Global investment decisions depend on more than tax regimes. Even if Australia dropped to “1” for tax regime would still rank No. 2 globally 1 regime, No globally. 11
  • 12.
    Maximise The Benefits Sellingthe story – the unhappy consumer Households are unhappy. PERSONAL CIRCUMSTANCES % (net % of respondents) % 40 40 General feeling that the “benefits” of the resources boom are not being shared around while the “costs” are: h d d hil th “ t ” 20 20 Better in six – no tax cuts - carbon tax and flood months time levy instead; y ; Better 0 than six 0 – high Aussie dollar hurting some months key sectors; ago -20 -20 – household budgets under pressure (utilities, health etc); Source: CBA Viewpoint – retirement savings struggling; -40 -40 Apr 09 Jan 10 Oct 10 Jul 11 Apr 12 – job security fears. 12
  • 13.
    Maximise The Benefits Sellingthe story – sharing the spoils SHARING THE COMMODITY BOOM SALARIES: WHERE SPENT ( (cents per $ of revenue) p ) (% of total earned in region) % Leakage offshore 100 Payment to domestic shareholders 75 Payment of royalties & taxes Stays in y 50-60c of 50 region every $ of Buying domestic income Leaves services & imports remains in region into resources sector Australia 25 Paying domestic labour 0 0 15 30 45 Northern WA Central Qld Source: RBA Source: CBA Viewpoint RBA calculations are that 50-60¢ of each $ of resources revenue remains in Aust. The benefits of the boom do spread through the broader economy. economy 13
  • 14.
    Global Issues Demand matters CHINA: GDP & POLICY CHINA: CONSTRUCTION & POLICY CHINA: STEEL & POLICY %pa (annual % change) %pts %pa (change) (change) %pts %pa %pts 6.0 -3.5 40 -3.5 60 -3.5 Ch in reserves Crude steel GDP requirement ratio production (ch in annual (6 mnth change change, (ann ch in g ( growth, lhs) , ) 3.0 growth rate, lhs) -1.4 20 adv 12 months, rhs) -1.4 30 -1.4 0.0 00 0.8 08 0 0.8 08 0 0.8 08 Ch in reserves requirement ratio -3.0 (6 mnth change, 2.9 -20 2.9 -30 2.9 adv 14 months, rhs) d th h ) QI Ch iin reserves Floor space requirement ratio under construction (6 mnth change, (ann ch in growth, lhs) adv 8 months, rhs) -6.0 5.0 -40 5.0 -60 5.0 Jan-02 Jan-05 Jan-08 Jan-11 Jan-02 Jan-04 Jan-06 Jan-08 Jan-10 Jan-12 Jan-02 Jan-04 Jan-06 Jan-08 Jan-10 Jan-12 Even if domestic settings are right, our ability to maximise the benefits will depend on offshore events beyond our control. 14
  • 15.
    Global Issues So doesthe composition of growth TRADE & PRODUCTION CHINA & EXPORTS ( (Jan'08=100) ) Index I150 d Index 150 (% of a country's exports that remain in China) country s 90 % Emerging Asia Source: HKMA industrial production 130 130 60 110 Advanced 110 economy imports 30 90 90 Source: BEPA 0 70 70 Jan-08 Jan-09 Jan-10 Jan-11 Jan-12 Phil. Thai. Mal. Sing. Kor. Jap. NZ Indo. Aus. Asian growth is increasingly domestically driven. Australia is more exposed to the Asian domestic story story. 15
  • 16.
    The Long Run Middleincome consumers CONSUMPTION SHARE & INCOME The Chinese consumer is set to Consumption 100 (% of GDP) become an important economic driver. Incomes at the point where the 75 consumption share typically lifts. USA Expanding global middle class to Japan underwrite consumer demand for: 50 South – larger and better quality housing; Korea – more and better quality food; China Source: IMF – more consumer durables; 25 0 20 40 60 – more education services; GDP/capita (PPP) – more holidays. 16
  • 17.
    A Look intothe Abyss More volatility? GENERAL GOVERNMENT DEBT IMF defines stabilisation as achieved Title (advanced economies) when advanced economy gross debt at 120 of % % 120 of GDP GDP 60% of GDP (pre-crisis median). Adjustment is a lengthy process – IMF scenarios stretch out to 2030 80 80 You Extended timeframe indicates financial are market volatility will be an enduring here feature. 40 40 “Asia” determines Australian growth and incomes. “North Atlantic” Source: IMF economies drive sentiment and 0 0 financial markets. 2007 2012 2017 2022 2027 17
  • 18.
    CBA Economic Forecasts 2009/10 2010/11 2011/12 2012/13 Economy (a) (a) (f) (f) GDP (% ch) 2.3 2.0 2.8 3.3 Of which: Consumer spending (% ch) 2.5 3.1 3.3 2.9 Business Investment (% ch) -5.2 6.4 20.1 12.3 Unemployment (%) 5.5 5.1 5.3 5.5 CPI (% ch) 2.3 3.1 2.3 2.6 Wage Price Index (% ch) 3.1 3.8 3.7 3.9 Terms-of-Trade T fT d -4.1 41 20.8 20 8 4.5 4 1.5 1 Current account balance (% of GDP) -4.3 -2.4 -2.4 -2.8 Underlying Budget balance (% of GDP) -4.2 42 -3.7 37 -2.8 28 0.2 02 18
  • 19.
    CBA Market Forecasts Markets Jun’12 Sep’12 Dec’12 Mar’13 Australia Official cash 3¾ 3½ 3½ 3½ 90-day bills 3.8 3.6 3.6 3.6 3-year bonds 2.7 2.7 2.8 2.9 10-year bonds 3.5 3.6 3.8 3.9 3-year swap 3.4 3.4 3.4 3.5 10-year swap 4.3 4.4 4.6 4.6 USA Fed funds 0-¼ 0-¼ 0-¼ 0-¼ 2-year bonds 0.2 0.3 0.4 0.4 10-year b d 10 bonds 2.0 20 2.2 22 2.5 2 2.7 2 Spreads AUS-US 10 yr 150 140 130 120 AUS 3-10 yr 80 90 100 100 FX AUD 0.98 1.01 1.03 1.04 TWI 73.9 73 9 75.8 75 8 76.8 76 8 77.1 77 1 19
  • 20.
    Important Disclosures &Disclaimer Please view our website at www.research.commbank.com.au. The Commonwealth Bank of Australia ABN 48 123 123 124 AFSL 234945 ("the Bank") and its subsidiaries, including Commonwealth Securities Limited ABN 60 067 254 399 AFSL 238814 ("CommSec"), Commonwealth Australia Securities LLC, CBA Europe Ltd and Global Markets Research, are domestic or foreign entities or business areas of the Commonwealth Bank Group of Companies (CBGOC). CBGOC and their directors, employees and representatives are referred to in this Appendix as “the Group”. This report is published solely for informational purposes and is not to be construed as a solicitation or an offer to buy any securities or financial instruments. This report has been prepared without taking account of the objectives, financial situation and capacity to bear loss, knowledge, experience or needs of any specific person who may receive this report No member of the Group does or is required to assess the appropriateness or suitability of the report for report. does, to, recipients who therefore do not benefit from any regulatory protections in this regard. All recipients should, before acting on the information in this report, consider the appropriateness and suitability of the information, having regard to their own objectives, financial situation and needs, and, if necessary seek the appropriate professional, foreign exchange or financial advice regarding the content of this report. We believe that the information in this report is correct and any opinions, conclusions or recommendations are reasonably held or made, based on the information available at the time of its compilation, but no representation or warranty, either expressed or implied, is made or provided as to accuracy, reliability or completeness of any statement made in this report. Any opinions, conclusions or recommendations set forth in this report are subject to change without notice and may differ or be contrary to the opinions conclusions or recommendations expressed elsewhere by the Group We are under no obligation to and do not update or opinions, Group. to, not, keep current the information contained in this report. The Group does not accept any liability for any loss or damage arising out of the use of all or any part of this report. Any valuations, projections and forecasts contained in this report are based on a number of assumptions and estimates and are subject to contingencies and uncertainties. Different assumptions and estimates could result in materially different results. The Group does not represent or warrant that any of these valuations, projections or forecasts, or any of the underlying assumptions or estimates, will be met. Past performance is not a reliable indicator of future performance. The Group has provided, provides, or seeks to provide, investment banking, capital markets and/or other services, including financial services, to the companies described in the report and their associates. This report is not directed to, or intended for distribution to or use by, any person or entity who is a citizen or resident of or located in any locality, state, country or other jurisdiction where such distribution, y, y p y y y, , y j , publication, availability or use would be contrary to law or regulation or which would subject any entity within the Group to any registration or licensing requirement within such jurisdiction. All material presented in this report, unless specifically indicated otherwise, is under copyright to the Group. None of the material, nor its content, nor any copy of it, may be altered in any way, transmitted to, copied or distributed to any other party, without the prior written permission of the appropriate entity within the Group. In the case of certain products, the Bank or one of its related bodies corporate is or may be the only market maker. The Group, its agents, associates and clients have or have had long or short positions in the securities or other financial instruments referred to herein, and may at any time make purchases and/or sales in such interests or securities as principal or agent, including selling to or buying from clients on a principal basis and may engage in transactions in a manner inconsistent with this report. US Investors: If you would like to speak to someone regarding the subject securities described in this report, please contact Commonwealth Australia Securities LLC (the “US Broker-Dealer”), a broker-dealer registered under the U.S. Securities Exchange Act of 1934 (the “Exchange Act”) and a member of the Financial Industry Regulatory Authority (“FINRA”) at 1 (212) 336-7737. This report was prepared, approved and published by Global Markets Research, a division of Commonwealth Bank of Australia ABN 48 123 123 124 AFSL 234945 ("the Bank") and distributed in the U.S. by the US Broker-Dealer. The Bank is not registered as a broker-dealer under the Exchange Act and is not a member of FINRA or any U.S. self regulatory organization. self-regulatory organization Commonwealth Australia Securities LLC (“US Broker-Dealer”) is a wholly owned but non-guaranteed subsidiary of the Bank organized under the ( US Broker Dealer ) owned, non guaranteed, Bank, laws of the State of Delaware, USA, with limited liability. The US Broker-Dealer is not authorized to engage in the underwriting of securities and does not make markets or otherwise engage in any trading in the securities of the subject companies described in our research reports. The US Broker-Dealer is the distributor of this research report in the United States under Rule 15a-6 of the Exchange Act and accepts responsibility for its content. Global Markets Research and the US Broker-Dealer are affiliates under common control. Computation of 1% beneficial ownership is based upon the methodology used to compute ownership under Section 13(d) of the Exchange Act. The securities discussed in this research report may not be eligible for sale in all States or countries, and such securities may not be suitable for all types of investors. Offers and sales of securities discussed in this research report, and the distribution of this report, may be made only in States and countries where such securities are exempt from registration or qualification or have p , p , y y p g q been so registered or qualified for offer and sale, and in accordance with applicable broker-dealer and agent/salesman registration or licensing requirements. The preparer of this research report is employed by Global Markets Research and is not registered or qualified as a research analyst, representative, or associated person under the rules of FINRA, the New York Stock Exchange, Inc., any other U.S. self-regulatory organization, or the laws, rules or regulations of any State. 20
  • 21.
    European Investors: This reportis published, approved and distributed in the UK by the Bank and by CBA Europe Ltd (“CBAE”). The Bank and CBAE are both registered in England (No. BR250 and 05687023 respectively) and authorised and regulated in the UK by the Financial Services Authority (“FSA”). This report does not purport to be a complete statement or summary. For the purpose of the FSA rules, this report and related services are not intended for retail customers and are not available to them. The products and services referred to in this report may put your capital at risk. Investments, persons, matters and services referred to in this report may not be regulated by the FSA. CBAE can clarify where FSA regulations apply. Singapore Investors: This report is distributed in Singapore by Commonwealth Bank of Australia, Singapore Branch (company number F03137W) and is made available only for persons who are Accredited Investors as defined in the Singapore Securities and Futures Act and the Financial Advisers Act. It has not been prepared for, and must not be distributed to or replicated i any f li t d in form, t anyone who i not an A to h is t Accredited I dit d Investor. t Hong Kong Investors: This report was prepared, approved and published by the Bank, and distributed in Hong Kong by the Bank's Hong Kong Branch. The Hong Kong Branch is a registered institution with the Hong Kong Monetary Authority to carry out the Type 1 (Dealing in securities) and Type 4 (Advising on securities) regulated activities under the Securities and Futures Ordinance. Investors should understand the risks in investments and that prices do go up as well as down, and in some cases may even become worthless. Research report on collective investment schemes which have not been authorized by the Securities and Futures Commission is not directed to, or intended for distribution in Hong Kong. y , g g All investors: Analyst Certification and Disclaimer: Each research analyst, primarily responsible for the content of this research report, in whole or in part, certifies that with respect to each security or issuer that the analyst covered in this report: (1) all of the views expressed accurately reflect his or her personal views about those securities or issuers; and (2) no part of his or her compensation was, is, or will be, directly or indirectly, related to the specific recommendations or views expressed by that research analyst in the report. The analyst(s) responsible for the preparation of this report may interact with trading desk personnel, sales personnel and other constituencies for the purpose of gathering, synthesizing, and i t th i i d interpreting market i f ti k t information. Di t ti Directors or employees of th G l f the Group may serve or may h have served as officers or di t d ffi directors of th subject company of thi f the bj t f this report. The compensation of analysts who prepared this report is determined exclusively by research management and senior management (not including investment banking). No inducement has been or will be received by the Group from the subject of this report or its associates to undertake the research or make the recommendations. The research staff responsible for this report receive a salary and a bonus that is dependent on a number of factors including their performance and the overall financial performance of the Group, including its profits derived from investment banking, sales and trading revenue. Unless agreed separately, we do not charge any fees for any information provided in this presentation. You may be charged fees in relation to the financial products or other services the B k provides, these are set out i the relevant Fi i h Bank id h in h l Financial S i i l Services G id (FSG) and relevant P d Guide d l Product Di l Disclosure SStatements (PDS) O employees receive a salary (PDS). Our l i l and do not receive any commissions or fees. However, they may be eligible for a bonus payment from us based on a number of factors relating to their overall performance during the year. These factors include the level of revenue they generate, meeting client service standards and reaching individual sales portfolio targets. Our employees may also receive benefits such as tickets to sporting and cultural events, corporate promotional merchandise and other similar benefits. If you have a complaint, the Bank’s dispute resolution process can be accessed on 132221. 21