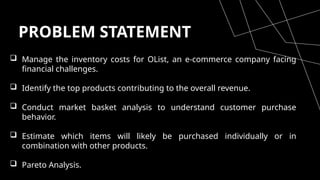
This presentation, titled "Maximizing Inventory Efficiency through Advanced Analytics," focuses on optimizing inventory management for OList, an e-commerce company facing financial challenges.
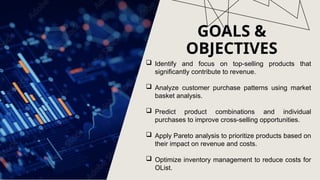
It outlines the problem statement, goals, and objectives related to identifying top-selling products, understanding customer purchase behavior through market basket analysis, and applying Pareto analysis to prioritize products based on their impact on revenue and costs.
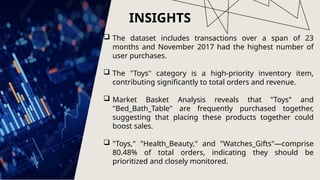
The presentation provides detailed insights into:
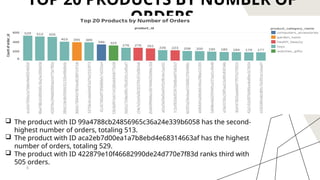
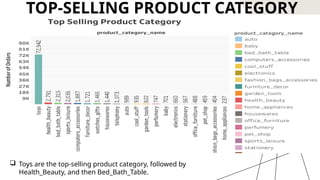
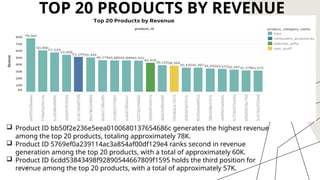
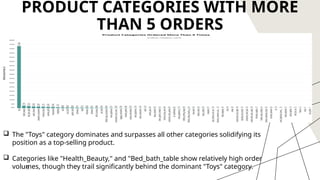
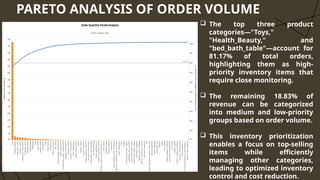
Top Products and Categories: Identifying the highest-ordered and highest-revenue-generating products and categories, with "Toys" consistently highlighted as a top performer.
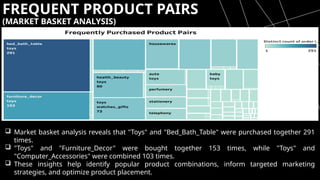
Market Basket Analysis: Revealing frequently purchased product pairs, such as "Toys" and "Bed_Bath_Table," to inform cross-selling strategies.
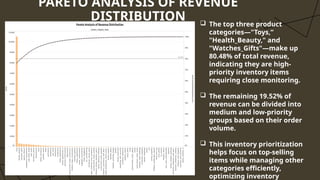
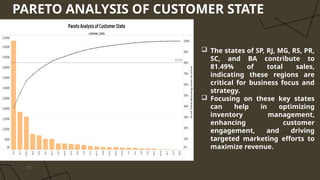
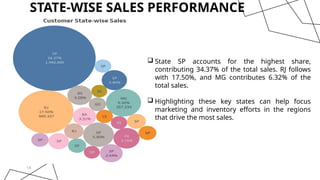
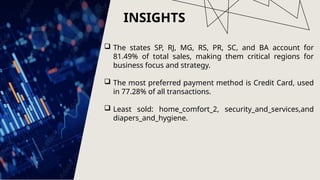
Pareto Analysis: Demonstrating how a small percentage of product categories and customer states contribute to a large percentage of total revenue and orders, emphasizing the importance of focusing on high-priority items and regions.
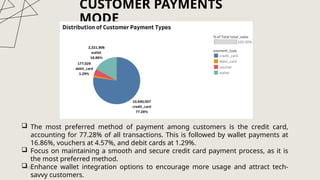
Customer Payment Modes: Analyzing the distribution of payment types, noting the strong preference for credit card transactions.
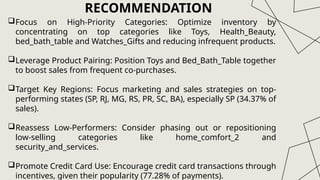
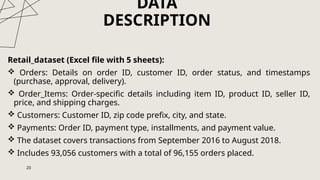
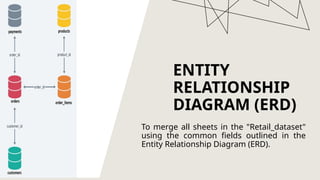
The presentation concludes with actionable recommendations to optimize inventory by focusing on high-priority categories, leveraging product pairing, targeting key regions, reassessing low-performing products, and promoting credit card use. It also includes a data description of the "Retail_dataset" used for the analysis, which covers transactions from September 2016 to August 2018, and an Entity Relationship Diagram (ERD) illustrating the data structure.


![Market_Basket_Analysis_Presentation_(1)[1].pptx Data Analysis Using Retail Ma...](https://cdn.slidesharecdn.com/ss_thumbnails/marketbasketanalysispresentation11-250717170614-8bed77cc-thumbnail.jpg?width=640&height=640&fit=bounds)


![[Provided Data - Brazil] Dương Hà Nguyễn Hoàng](https://cdn.slidesharecdn.com/ss_thumbnails/data-story-telling-ha-nguyen-hoang-duong-brasil-dataset-211019041642-thumbnail.jpg?width=640&height=640&fit=bounds)


