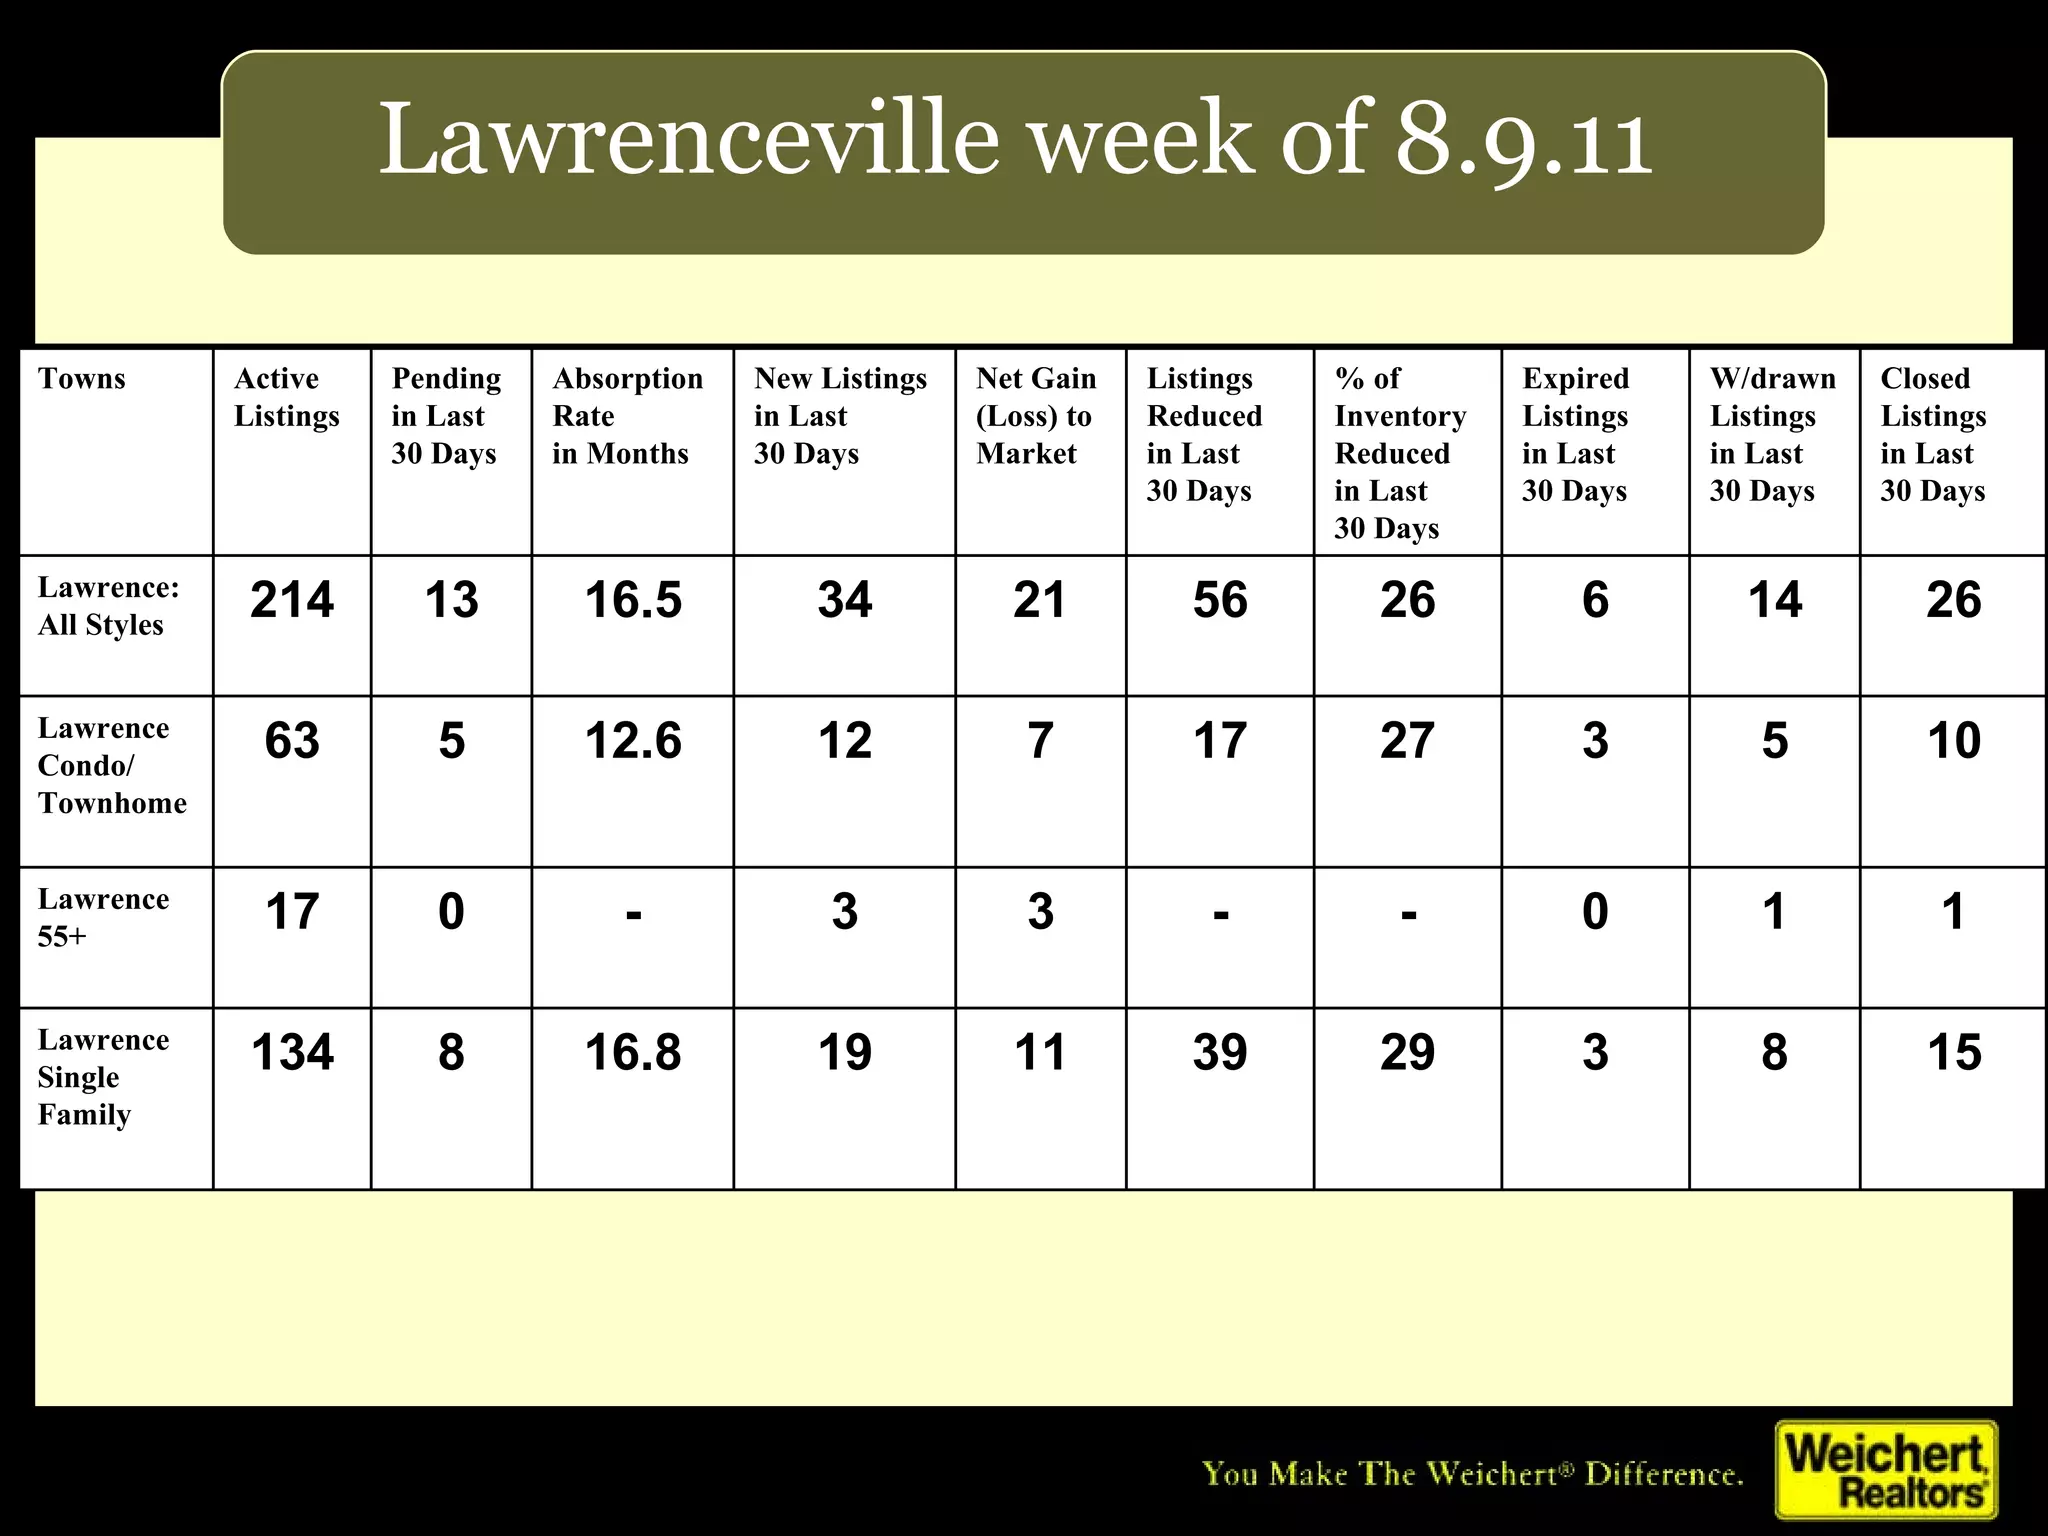
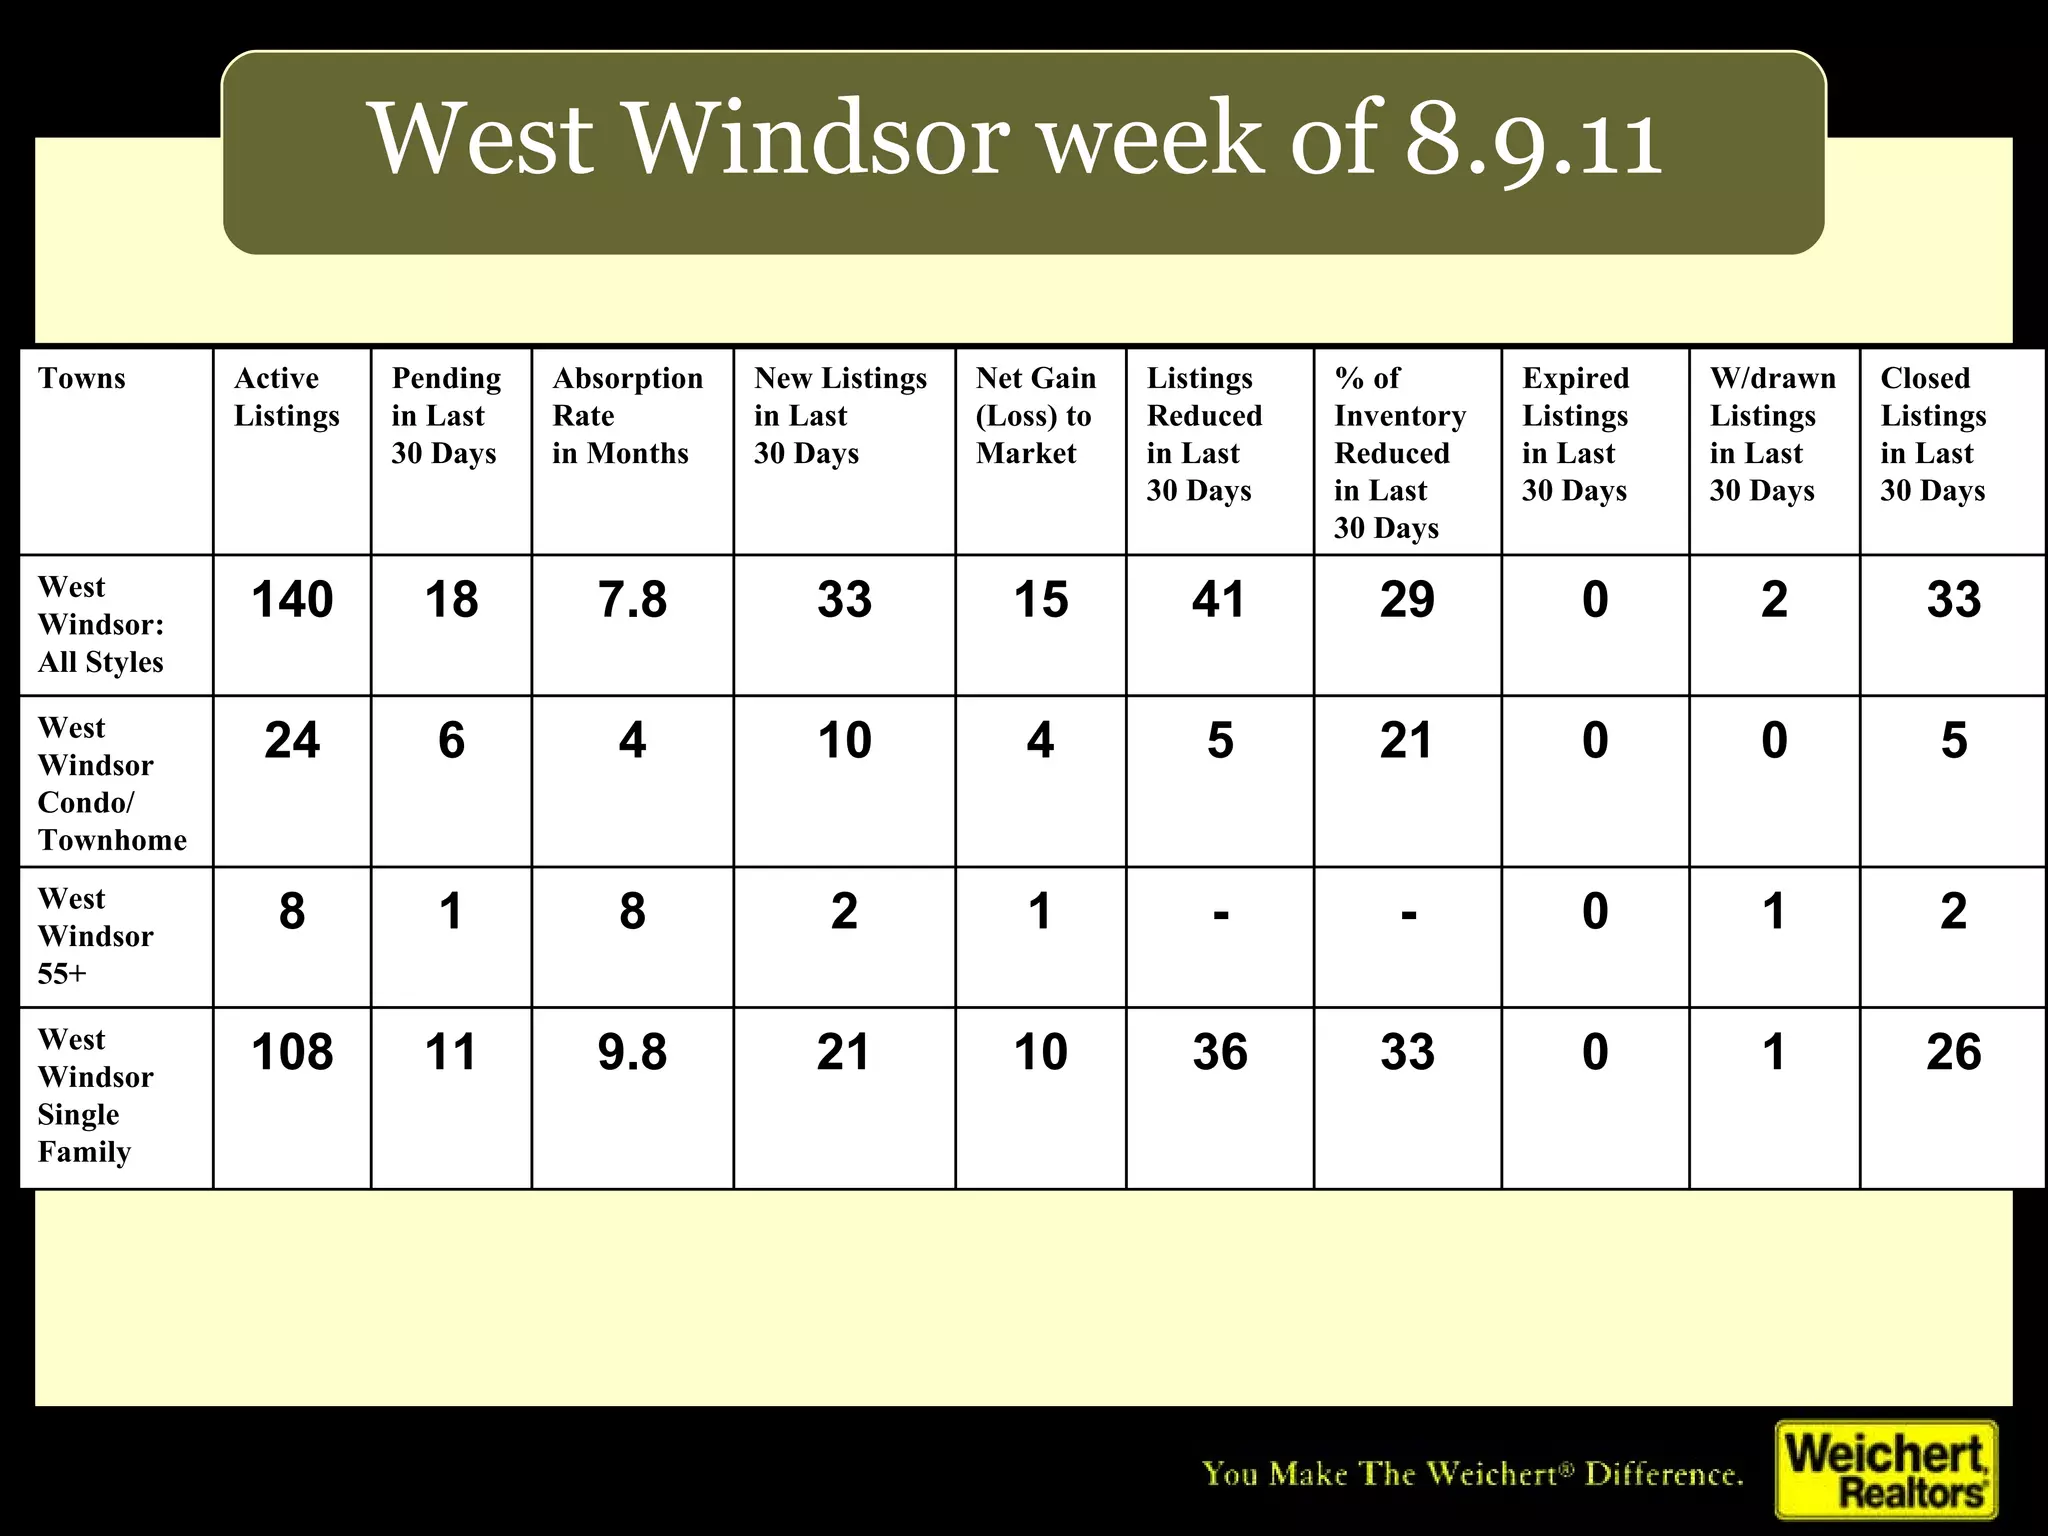
Lawrenceville week of 8.9.11 15 8 3 29 39 11 19 16.8 8 134 Lawrence  Single Family 1 1 0 - - 3 3 - 0 17 Lawrence 55+ 10 5 3 27 17 7 12 12.6 5 63 Lawrence Condo/ Townhome 26 14 6 26 56 21 34 16.5 13 214 Lawrence:  All Styles Closed Listings in Last 30 Days W/drawn Listings in Last 30 Days Expired Listings in Last 30 Days % of Inventory Reduced in Last 30 Days Listings Reduced  in Last 30 Days Net Gain (Loss) to Market New Listings in Last  30 Days Absorption Rate in Months Pending in Last 30 Days Active Listings Towns
West Windsor week of 8.9.11 Towns Active Listings Pending in Last 30 Days Absorption Rate in Months New Listings in Last  30 Days Net Gain (Loss) to Market Listings Reduced  in Last 30 Days % of Inventory Reduced in Last 30 Days Expired Listings in Last 30 Days W/drawn Listings in Last 30 Days Closed Listings in Last 30 Days West Windsor:  All Styles 140 18 7.8 33 15 41 29 0 2 33 West Windsor Condo/ Townhome 24 6 4 10 4 5 21 0 0 5 West Windsor 55+ 8 1 8 2 1 - - 0 1 2 West Windsor  Single Family 108 11 9.8 21 10 36 33 0 1 26

Market Update 8 9 11

  • 1.
    Lawrenceville week of8.9.11 15 8 3 29 39 11 19 16.8 8 134 Lawrence Single Family 1 1 0 - - 3 3 - 0 17 Lawrence 55+ 10 5 3 27 17 7 12 12.6 5 63 Lawrence Condo/ Townhome 26 14 6 26 56 21 34 16.5 13 214 Lawrence: All Styles Closed Listings in Last 30 Days W/drawn Listings in Last 30 Days Expired Listings in Last 30 Days % of Inventory Reduced in Last 30 Days Listings Reduced in Last 30 Days Net Gain (Loss) to Market New Listings in Last 30 Days Absorption Rate in Months Pending in Last 30 Days Active Listings Towns
  • 2.
    West Windsor weekof 8.9.11 Towns Active Listings Pending in Last 30 Days Absorption Rate in Months New Listings in Last 30 Days Net Gain (Loss) to Market Listings Reduced in Last 30 Days % of Inventory Reduced in Last 30 Days Expired Listings in Last 30 Days W/drawn Listings in Last 30 Days Closed Listings in Last 30 Days West Windsor: All Styles 140 18 7.8 33 15 41 29 0 2 33 West Windsor Condo/ Townhome 24 6 4 10 4 5 21 0 0 5 West Windsor 55+ 8 1 8 2 1 - - 0 1 2 West Windsor Single Family 108 11 9.8 21 10 36 33 0 1 26

Editor's Notes

  • #2 Populate this table to show the local absorption rate in the various price ranges that are appropriate for your market area. Please add or delete rows as necessary to adequately reflect local conditions.
  • #3 Populate this table to show the local absorption rate in the various price ranges that are appropriate for your market area. Please add or delete rows as necessary to adequately reflect local conditions.