Downloaded 17 times


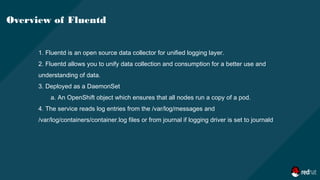
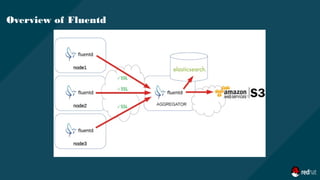

![Overview of Fluentd
Fluentd.conf
@includeconfigs.d/dynamic/input-syslog-*.conf
@includeconfigs.d/openshift/input-post-*.conf
<label @INGRESS>
@includeconfigs.d/openshift/filter-pre-*.conf
@includeconfigs.d/openshift/filter-post-*.conf
</label>
<label @OUTPUT>
## matches
@includeconfigs.d/openshift/output-pre-*.conf
@includeconfigs.d/openshift/output-operations.conf
@includeconfigs.d/openshift/output-applications.conf
</label>
secure-forward.conf: |
# cat /etc/fluent/configs.d/openshift/input-pre-systemd.conf
<source>
@typesystemd
@label @INGRESS
path "#{ENV['JOURNAL_SOURCE'] || '/run/log/journal'}"
pos_file"#{ENV['JOURNAL_POS_FILE'] ||
'/var/log/journal.pos'}"
filters"#{ENV['JOURNAL_FILTERS_JSON'] || '[]'}"
tag journal
read_from_head
"#{ENV['JOURNAL_READ_FROM_HEAD'] || 'false'}"
</source>](https://image.slidesharecdn.com/logging4-190305043124/85/Logging-presentation-12-320.jpg)


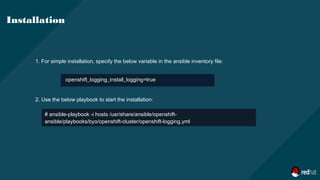

![openshift_logging_es_allow_external=True *1
openshift_logging_es_hostname=elasticsearch.apps.lab.example.com *2
openshift_logging_image_version=latest *3
openshift_hosted_logging_deployer_version=latest *4
openshift_hosted_logging_storage_kind=nfs *5
openshift_hosted_logging_storage_access_modes=['ReadWriteOnce'] *6
Ansible Variables
1. Set to trueto exposeElasticsearch asaroute.
2. Theexternal facing host nameto usefor therouteand theTLSserver certificate.
3. Theimageversion for thelogging imagesto use.
4. Theimageversion for thedeployer imagesto use.
5. Thestorageback end to use.
6. Thevolumeaccessmode.](https://image.slidesharecdn.com/logging4-190305043124/85/Logging-presentation-22-320.jpg)


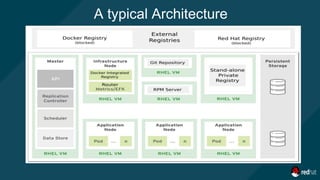
The document outlines a comprehensive logging solution for OpenShift using the EFK (Elasticsearch, Fluentd, Kibana) stack, detailing the architecture, advantages of using EFK, and overviews of its components. It explains the functionalities of Fluentd as a log collector, Elasticsearch as a search engine, and Kibana as the visualization interface, along with configuration specifics and installation instructions via Ansible. Additionally, it addresses common challenges in log management and provides practical setup guidance for deploying the logging solution.


![[발표자료] 오픈소스 기반 클라우드 네이티브 애플리케이션 구축 방안 (feat. Kubernetes)](https://cdn.slidesharecdn.com/ss_thumbnails/kubernetes-241219083038-3bd08c9d-thumbnail.jpg?width=640&height=640&fit=bounds)