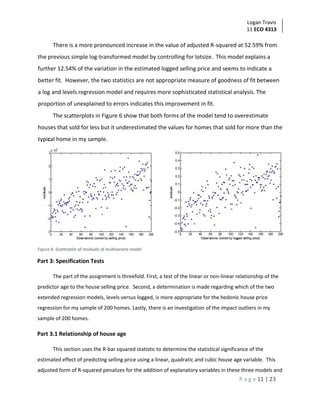
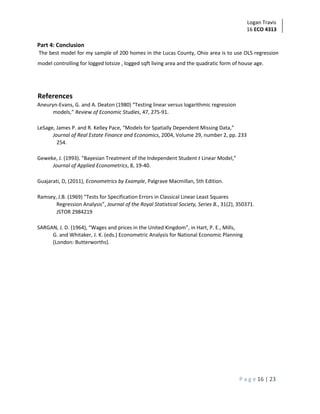
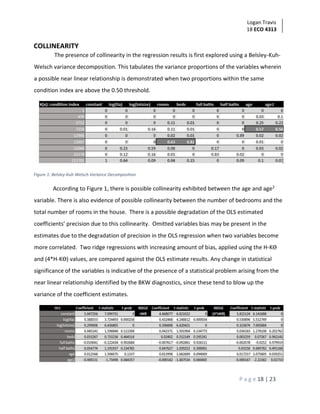
SlideShare a Scribd company logo
1 of 23
Download to read offline
Logan Travis
1 ECO 4313
P a g e 1 | 23
Section 1: Analysis for Lucas County, Ohio
Logan Travis
Economics 4313 Spatial Econometrics
Texas State University - San Marcos
lgtravis15@gmail.com
INTRODUCTION
PART 1 of this assignment involved fitting a least-squares regression model to the relationship
between 200 observed home selling prices from Lucas County, Ohio, using a constant term and
the square foot living area of the home as explanatory variables. The selling price is then logged
to determine the effect of the elasticity of the living area on the selling price of the homes in the
200 home sample.
PART 2 of this assignment involved fitting a least-squares regression model to the relationship
between 200 observed homes selling prices from Lucas County, Ohio, using a constant term, and
8 other characteristics of the home as explanatory variables. Some of the continuous variables
are logged to determine the effect of the elasticity of these variables on the selling price of the
homes in the 200 home sample.
PART 3 of this assignment involved a diagnostic test to determine whether to use the log
transformed or linear level relationship for the hedonic house price regression. Another
regression involved testing whether the age predictor should be included in the model in a linear
or non-linear relationship to selling price. Finally, a test is performed to explore the question of
outliers in our data.
Logan Travis
2 ECO 4313
P a g e 2 | 23
The source of sample data information is a publicly available data set provided by
LeSage as part of the Spatial Econometrics Toolbox, described in LeSage and Pace (2004),
containing over 25,000 home sales for the years 1993 to 1998. The data employed here was
labeled student24.data containing a sample of 200 nearby homes that sold along with a number
of characteristics of the homes (house age, square foot living area, square foot lot size, number of
rooms, number of full baths, number of half baths, and number of bedrooms). The simple model
used here takes the form
Where y1, y2, . . . yn are (n = 200 observed) selling prices, and x1, x2, . . . are
(known/observed) values of the square foot living area for each of the 200 homes, and ε1,
ε2, . . . are unknown/ unobserved disturbances/errors for our sample of 200 homes
The relationship can also be written as
Note: 𝛽 describes how changes in the square foot living area (x) are related to changes in
selling price (y). 𝛼 indicates the selling price of a vacant lot or a house with zero square
foot living area.
Part 1.1 Summary statistics
Summary statistics for the sample of 200 homes are shown in Figure 4: Table 1 below. These
include the mean, median and standard deviation as well as minimum and maximum values for
Logan Travis
3 ECO 4313
P a g e 3 | 23
the selling price as well as all available characteristics. The table also shows summary statistics for
the total sample of 25,357 homes. Histograms and boxplots are used to describe the distribution
of characteristics in the sample of 200 homes in regards to age, sqft living area and selling price.
Figure 1 shows a histogram of age which the left skewedness of distribution of the ages of
homes. The amount of skew is evident by the distance between the median line to the right of
the mean line. The mean is being pulled downward by the outliers below the first quartile. The
boxplot shows the range and interquartile breakdown of 50% of the ages of the 200 home
sample. The first quartile begins at approximately 38 years of age, below which there are four
outliers in my sample that are less than 30 years of age.
Figure 1: Age Distribution
Figure 2 shows a histogram which indicates the right skew of the distribution of sqft living
area within the sample. The median is to
Logan Travis
4 ECO 4313
P a g e 4 | 23
the left of the mean, which indicates that there are outliers pulling the mean upward. The living
area distribution is skewed to the right because of the presence of these outliers as indicated by
the boxplot.
Figure 2: Sqft TLA Distribution
Figure 2 shows a histogram which indicates a right skew in the distribution of selling price
in the sample of 200 homes wherein the median resides to the left of the most frequent selling
price range but is not significantly different from the mean. The boxplot of the sample shows the
interquartile range of the majority of selling prices for the sample between with the first quartile
beginning at $43,900 and the third quartile ending around $68,000. There are no outliers
present.
Figure 3:
Selling Price Distribution
Logan Travis
5 ECO 4313
P a g e 5 | 23
Tabular summary statistics are for the sample of 200 homes are shown in Figure 4: Table 1
below. These include the mean, median and standard deviation as well as minimum and
maximum values for the selling price as well as all available characteristics. The table also shows
summary statistics for the total sample of 25,357 homes. These include the mean, median and
standard deviation as well as minimum and maximum values for the selling price as well as all
available characteristics.
Figure 4: Table 1
The median for age is older than the mean suggesting an asymmetry skewed to the left.
The comparable mean and median for the selling price indicates a symmetric distribution of
values in the sample. This means that there is similar distribution of the selling price of homes
both above and below the “typical” home
The mean of sqft living area is above the median “typical” house in the sample indicates a
right skewedness to the sample that may be caused by extreme values above the median value of
the homes in my sample.
The number of rooms and bedrooms in the “typical” house in my sample is higher than
the mean which suggests left skew. This indicates that there are more homes in my sample with
as many or more rooms than the “typical” home in my sample.
Logan Travis
6 ECO 4313
P a g e 6 | 23
Both the number of full baths and half baths have a mean and median that are equal
suggesting a symmetric distribution.
The “typical” house in my sample is 22 years older, smaller in lotsize and sqft living area
and sold for less than the “typical” house in the full sample. The range of selling prices is also
much smaller with my sample than that in the full population. The distribution of homes in my
sample is more symmetric than the full sample as indicated by the closeness in value of the mean
and median in my sample as compared with the larger differences in the full sample. The
standard deviation of the selling prices in my sample is much lower than the full population
suggesting much less variation in the selling prices than the entire population The full population
sample has a mean $13,518 above the median suggesting an asymmetric distribution of prices
skew to the right. The mean is being influenced by the large maximum value of $875,000.
Part 1.2 Univariate Regression
Results from the univariate regression are presented in Table 2. The slope, as represented by 𝛽, is
33.72 which indicates an increase in one square foot increases price by $33.72 for a home in my
sample. The t-statistics indicates that estimate is 11.5 standard deviations away from zero which
suggests that sqft living area is a statistically significant predictor of variation in the estimation of
selling price of a home in my sample at the 99% confidence level.
Table 2: Ordinary Least Squares Estimate (levels model)
The value of an empty lot, as indicated by the coefficient of the constant term, is
$17,176.22. The p-value and t-statistic for the value of an empty lot shows statistical significance
at the 99% level in this model. R2 shows that this model explains approximately 40% of the
Logan Travis
7 ECO 4313
P a g e 7 | 23
variation in the selling price in the sample of 200 homes as explained by the sqft living area of the
house. This could be indicative of omitted variable bias since this naive model is not controlling
for any other predictors of the selling price.
The results for a second regression are presented in Table 3. This regression shows an
estimation where the Y and X variables were transformed to their log form. This parameter
estimate of 𝛽 represents percentage response to percentage changes in sqft living area or the
elasticity of selling price to sqft living area. The positive slope of the fitted line indicates an
increase of living area by one percent would lead to price increase of 0.79% on average over the
200 homes. The t-statistic for this slope estimate is over 11 standard deviations away from zero
and has p-value that shows that this estimate of elasticity is significant at the 99% confidence
level. R2 indicates that 40% of variation in the observed logged selling price is explained by the
change in logged sqft living area in the homes in my sample.
Table 3: OLS Estimates (log-transformed model)
The figures below were included, one from each regression showing a scatter plot of the
actual versus fitted values for the 200 homes (logged or unlogged) selling prices, with the
horizontal axis showing (logged or unlogged) square foot living area. The scatterplot for Figure 5
exhibits an error for one home that is much larger than the rest of the homes. The majority of
homes sold between $35,000 and $75000. There houses are clustered in the bottom left
quadrant of the graph demonstrating that the homes selling price was low and their size was
small but they are dispersed widely above and below the prediction line for the model. This is a
reiteration of the R2 value which indicates that the univariate regression is a naive model that is a
poor estimator for selling price of any particular house in my sample. The levels simple linear
model in Figure 6 had a tendency to overestimate the selling price for home between 500 and
Logan Travis
8 ECO 4313
P a g e 8 | 23
1000 sqft living area. The log-transformed simple linear model is a better model since it indicates
a similar tendency to overestimate as to underestimate selling price using sqft living area.
Compared to the non-logged model, the log-transformed model is a better predictor for
selling price and the relatively large house in Figure 1. However, the large dispersion below the
fitted line suggests that it is a poor predictor for homes that sold relatively cheaply compared to
other homes in the sample. The same 7 homes in Figure 1 are still errors in Figure 6.
Figure 6: Scatter plot of actual selling prices versus fitted valuessqft living
area
Figure 5: Log-transformed regression actual prices versus fitted values
Logan Travis
9 ECO 4313
P a g e 9 | 23
Part 2: Multivariate Regression
This second part of the assignment involves extending the regression model to include 7 other
possible explanatory variables in the attempt to predict selling prices. As before, this model will
use both the level and log-transformed continuous variables. The log transformed variables are
sqft living area, selling prices and lotsize. The other five variables are categorical and are not log-
transformed. Table 4 and Table 5 present the coefficient estimates for levels regression and log-
transformed regression, respectively.
The estimate for square foot living area points to a $16.87 increase in selling price
associated with one square foot increase in living area which is statistically significant at the 99%
level. Also statistically significant at the same level is the estimate of the effect of the increase of
one square foot in lotsize on the selling price of a house in my sample; it will increase the selling
price by an estimated $1.34. The estimate for an empty lot is $15,067.41 which is 2 standard
deviations away from zero and is statistically different than zero at to the 95% level. All other
estimates of the effect for other predictors in this extended model are not statistically different
from zero.
Our level model is therefore;
Table 4: Multivariate OLS Estimates for levels regression
Logan Travis
10 ECO 4313
P a g e 10 | 23
This states that the prediction for selling price increases $16.87 for each sqft living area increase
controlling for lotsize the house is built upon.
The rbar-squared is used to compare the simple levels model to the extended since it penalizes
for the addition of predictors in the denominator. This shows that the extended model explains a
further 8% of the variation in the actual selling prices in my sample as indicated by a rbaradjusted
value of 48.19% versus the 40.23% for the simple model. There is a noticeable reduction in errors
using this extended levels linear model.
Table 5: Multivariate Regression of log-transformed model
This log transformed regression allows for the inclusion of logged continuous variables as
predictors of the change in logged selling price of homes in my sample. The variables that are
transformed into logs are lotsize, sqft living area and selling price. These statistically significant
coefficients are interpreted as elasticity or the effect of the marginal percentage change on the
percentage change in selling price.
The log-transformed model can be represented thusly,
𝐸(𝑦̂|𝑙𝑜𝑔𝑥 𝑠𝑞𝑓𝑡 𝑇𝐿𝐴 𝑙𝑜𝑔𝑥𝑙𝑜𝑡𝑠𝑖𝑧𝑒) = 5.39+. 378𝑙𝑜𝑔𝑥 𝑠𝑞𝑓𝑡 𝑇𝐿𝐴 +. 044𝑙𝑜𝑔𝑥𝑙𝑜𝑡𝑠𝑖𝑧𝑒
This can be interpreted as a 10% increase in the sqft living area will have an estimated
3.78% increase in selling price of a home in my sample while controlling for the effect of the
lotsize. This lotsize effect is estimated to increase selling price 3.09% when lotsize is increased
by 10%. The value of an empty lot is $219.20 is statistically significant at the 99% confidence
interval but is not economically significant since it is numerically close to zero.
Logan Travis
11 ECO 4313
P a g e 11 | 23
There is a more pronounced increase in the value of adjusted R-squared at 52.59% from
the previous simple log-transformed model by controlling for lotsize. This model explains a
further 12.54% of the variation in the estimated logged selling price and seems to indicate a
better fit. However, the two statistics are not appropriate measure of goodness of fit between
a log and levels regression model and requires more sophisticated statistical analysis. The
proportion of unexplained to errors indicates this improvement in fit.
The scatterplots in Figure 6 show that both forms of the model tend to overestimate
houses that sold for less but it underestimated the values for homes that sold for more than the
typical home in my sample.
Figure 6: Scatterplot of residuals of multivariate model
Part 3: Specification Tests
The part of the assignment is threefold. First, a test of the linear or non-linear relationship of the
predictor age to the house selling price. Second, a determination is made regarding which of the two
extended regression models, levels versus logged, is more appropriate for the hedonic house price
regression for my sample of 200 homes. Lastly, there is an investigation of the impact outliers in my
sample of 200 homes.
Part 3.1 Relationship of house age
This section uses the R-bar squared statistic to determine the statistical significance of the
estimated effect of predicting selling price using a linear, quadratic and cubic house age variable. This
adjusted form of R-squared penalizes for the addition of explanatory variables in these three models and
Logan Travis
12 ECO 4313
P a g e 12 | 23
is therefore more appropriate than r-squared. It is theorized by R. Kelley Pace in, Journal of Real Estate
Finance and Economics, that the predictor age might not follow a linear relationship but is more
polynomial in its effect upon selling price. This is interpreted as an increase in home age depressing the
value of a home until its becomes an economically-significant age that is old enough as to add value to
the home’s selling price due to its perception as an antique or being historic. Figure 7 indicates that the
best model for my sample is using the predictor of the quadratic house age. This indicates that house
age decreases house selling price at an increasing rate.
Figure 7
Part 3.2 Test for log versus levels specification
This part of the assignment is a measure of goodness of fit for the two forms of the model. The
null hypothesis being tested here is that both forms of the models are equal in the ability to predict the
selling price for my sample of 200 homes. It is the rejection of this hypothesis that will allow the
appropriate specification to be determined. This procedure originated with Sargen, 1964.
This section uses MATLAB to run a regression using a regression of a model that is transformed
using the geometric mean as opposed to levels or log-transformed. As already noted, we cannot
compare the fit of the two models using R2 because the log transformation to y changes the variation in
y to variation in ln(y). However, we can follow the 4-step procedure from Gujarati page 41. This
procedure is for the case where all y and all x−variables are logged (which is not exactly our case). There
are other approaches set forth in the literature that might be more appropriate here, but these are
more complicated (e.g., see Aneuryn-Evans and Deaton, 1980). Another common practice is to take the
antilog (exponential) of the logged predicted values and compute an R−squared statistic for the (anti)
log-transformed model that would be comparable to the untransformed model R−squared.
We will rely on the results from the previous section that indicated the appropriate model
specification should include age + age-squared or quadratic explanatory variables.
This 4-step procedure from Gujarati p. 41 is calculated with the following MATLAB
code:
Logan Travis
13 ECO 4313
P a g e 13 | 23
This code retrieves the (vector of) residuals from the ‘result1’ and ‘result2’ structure variables
returned by the ols(log(ytilde),lnx) and ols(ytilde,xmatrix) function calls, then calculates the residual sum
of squares using the inner product vector multiplication. Finally, a formal chi-squared distributed
statistic is calculated. The numerator and denominator for this statistic depend on whether RSS1 or RSS2
is larger, which is why we use the MATLAB min() function to determine this.
The results of this test indicate that the log-transformed model produces a better fit. However,
lambda indicates that the improved fit is significant at the 95% level since it is less than the 5% critical
value which fails to provide enough evidence to reject the null hypothesis. Nevertheless, a log
transformed model will be used as the most appropriate model. A robust regression will be performed
using this log-transformed model as the most appropriate model for predicting selling prices of homes in
my sample and estimates from the robust regression will be compared to a log transformed ordinary
least squares regression having the same variables.
Logan Travis
14 ECO 4313
P a g e 14 | 23
Figure 8: Evidence for supporting rejection of null hypothesis and appropriate use of log-transformed model
Part 3.3 Robust Regression
As a test for outliers, we carried out robust regressions using Bayesian MCMC estimates proposed by
Geweke (1993).
This regression will be using the most appropriate model as determined by the two previous
sections of this part of the assignment. Specifically, it is the log-transformed linear model as controlled
for lotsize and age-squared. Table 7 shows the results of the robust regression.
Table 7: Robust regression results
The adjusted r-squared shows that this robust model explains 52.38% of the variation in the
predictions of selling price. There are 9 variables in this model with the addition of the quadratic age
predictor.
Table 8: Robust Regression estimates
The results of Table 8 indicate that the quadratic house age predictor’s effect is not statistically
significant from zero. The elasticity of lotsize and sqft living area are significant at the 99% level. The
Logan Travis
15 ECO 4313
P a g e 15 | 23
predicted effects lotsize and sqft living area elasticity indicates that an increase in their sizes by 10% will
increase the elasticity of house price by 3.0% and 3.97%, respectively. The number of rooms is included
in this robust model at the 95% confidence interval. It’s estimated effect upon predicted selling price is
to increase the selling price by a non-significant economic amount.
A comparison between the differences in the coefficient estimates of the robust and OLS
regression models is used as a test for outliers. If there are significant differences between these
estimates, then the implication is that outliers are impacting the results of the OLS regression model.
Table 9: OLS Regression Estimates
Table 9 indicates that there is less than a percentage point difference in the coefficient estimate
of logged sqft living area. All other variables do not indicate the presence of outliers impacting the
regression results.
Figure 7: vi plot of ordered residuals
Figure 7 is a plot of the residuals using a Geweke test that shows the weights of the residuals.
Even though there seems to be aberrations around observations 60 and 160, their vi estimate values are
not high enough to indicate an impactful effect of outliers.
Logan Travis
16 ECO 4313
P a g e 16 | 23
Part 4: Conclusion
The best model for my sample of 200 homes in the Lucas County, Ohio area is to use OLS regression
model controlling for logged lotsize , logged sqft living area and the quadratic form of house age.
References
Aneuryn-Evans, G. and A. Deaton (1980) “Testing linear versus logarithmic regression
models,” Review of Economic Studies, 47, 275-91.
LeSage, James P. and R. Kelley Pace, “Models for Spatially Dependent Missing Data,”
Journal of Real Estate Finance and Economics, 2004, Volume 29, number 2, pp. 233
254.
Geweke, J. (1993). “Bayesian Treatment of the Independent Student t Linear Model,”
Journal of Applied Econometrics, 8, 19-40.
Guajarati, D, (2011), Econometrics by Example, Palgrave Macmillan, 5th Edition.
Ramsey, J.B. (1969) “Tests for Specification Errors in Classical Linear Least Squares
Regression Analysis”, Journal of the Royal Statistical Society, Series B., 31(2), 350371.
JSTOR 2984219
SARGAN, J. D. (1964), “Wages and prices in the United Kingdom”, in Hart, P. E., Mills,
G. and Whitaker, J. K. (eds.) Econometric Analysis for National Economic Planning
(London: Butterworths).
Logan Travis
17 ECO 4313
P a g e 17 | 23
INTRODUCTION
A hedonic price ordinary least squares regression was performed in SECTION 1 of this
assignment on 200 non-random house observations from a common geographic region. This
hedonic price ordinary least squares regression compared the appropriateness of a levels versus a
log-transformed model and also investigated the nature of the relationship between a house’s
age and selling price. It concluded by comparing the hese OLS regression models against a robust
model and tested for the influence of outliers on the regression results. The conclusion was that
the most appropriate model was the log-transformed OLS model as explained by the percentage
change in sqft living area and the percentage change in lotsize and that age exhibited a significant
quadratic relationship with the selling price. It also determined that outliers were not influencing
the regression results.
PART 2 of the assignment is aimed at testing the Gauss-Markov assumptions associated
with the ordinary least squares (OLS) regressions performed in PART 1. First, the collinearity of
the variables in the regression is examined by applying a singular value decomposition to the
variance-covariance matrix of the estimates. Collinearity is also determined by investigating the
amount of upward bias present in the coefficients of two Ridge regressions using an H-K ϴ and
4*H-Kϴ values that introduce increasing levels of bias into the model. Secondly, the assumption
of homoscedasticity is examined by comparing the OLS estimates statistical significance against a
semi-parametric White regression and a Newey-West regression. Thirdly, the influence of spatial
dependence upon the regression estimates is inspected given that the selection of the
observations in the dataset used for this hedonic price regression was not random but dependent
upon their spatial adjacency to one another. This is determined by comparing the OLS results
against those of robust and non-robust Bayesian spatial error models. Lastly, the influence of
outliers is again reconciled with the conclusion of PART 2 of the assignment in order to arrive at
the most appropriate model for the hedonic price regression of the dataset after considering the
Gauss-Markov assumptions.
Logan Travis
18 ECO 4313
P a g e 18 | 23
COLLINEARITY
The presence of collinearity in the regression results is first explored using a Belsley-Kuh-
Welsch variance decomposition. This tabulates the variance proportions of the variables wherein
a possible near linear relationship is demonstrated when two proportions within the same
condition index are above the 0.50 threshold.
Figure 1: Belsley-Kuh-Welsch Variance Decomposition
According to Figure 1, there is possible collinearity exhibited between the age and age2
variable. There is also evidence of possible collinearity between the number of bedrooms and the
total number of rooms in the house. There is a possible degradation of the OLS estimated
coefficients’ precision due to this collinearity. Omitted variables bias may be present in the
estimates due to the degradation of precision in the OLS regression when two variables become
more correlated. Two ridge regressions with increasing amount of bias, applied using the H-Kϴ
and (4*H-Kϴ) values, are compared against the OLS estimate results. Any change in statistical
significance of the variables is indicative of the presence of a statistical problem arising from the
near linear relationship identified by the BKW diagnostics, since these tend to blow up the
variance of the coefficient estimates.
Logan Travis
19 ECO 4313
P a g e 19 | 23
Figure 2: OLS and Ridge Regression Results
Figure 2 reveals that the 𝛽, or coefficient estimates, show upward bias in the sqft living
area and lotsize between the three regressions. The significance for the variables remains
unchanged throughout the three regression results.
Values of Regression Coefficients as a Function of
Figure 3 shows a plot of estimates for the variables on the vertical axis, with increasing
amounts of bias as theta increases on the horizontal axis versus the unbiased 𝛽 𝑂𝐿𝑆 at the origin on
the horizontal axis. Any sloping lines demonstrate variables exhibiting upwards bias, and the
vertical line is the H-Kϴ value with a moderate level of bias introduced. This is the case for sqft
living area and lotsize which further illustrates the conclusions in Figure 2.
The conclusion of this part of the assignment is that there is no problem with collinearity
regardless of the implication of a near linear relationship from the BKW diagnostics.
HETEROSCEDASTICITY
The Gauss-Markov assumption of homogeneity, or homogeneous variance of the disturbances is
investigated by comparing the significance of the OLS regression results against
White and Newey-West regression. The Newey-West regression results show Heteroscedastic
Autocorrelation Consistent Estimates that allow for both heteroscedasticity and serial correlation.
If the dataset observations are in order of size, then spatial correlation may mimic serial and
provide a false positive. The presence of heteroscedasticity is demonstrated in this test by a
change in the significance level of a variable from one regression to another.
Logan Travis
20 ECO 4313
P a g e 20 | 23
Figure 4: Regression Results for Heteroscedasticity
Figure 4 shows the change in significance at the 90% level, from the previous insignificant
level in the the OLS regression, of the number of rooms in a house in both White and Newey-
West. The linear age of a house also increases its significance to the 90% level from the previous
insignificance in the OLS regression in both White and Newey-West regressions. The quadratic
age of a house increases its significance from 90% in the OLS regression to 95% in the White
regression. However, the Newey-West regression shows no change in the significance level from
the OLS regression. This indicates that there might be some slight heteroscedasticity in the OLS
model with regards to the linear and quadratic form of house age and the number of rooms in a
house.
SPATIAL DEPENDENCE
The presence of spatial dependence is probable due to the selection method of the
observations in the dataset being the result of spatially adjacent houses. Spatial dependence is
therefore studied because it is logical that the selling price of a house is influenced by the
disturbances of the houses neighboring it. This logic is scrutinized by comparing the OLS
regression results against non-robust and robust Bayesian spatial error models. A lambda ( )
that is statistically significant indicates that this logic holds true for the houses in the dataset.
Heteroscedasticity in the presence of spatial correlation is also investigated using the change in
the significance levels of the variables and the change in 𝛽 point to outliers from the three
regression models.
Logan Travis
21 ECO 4313
P a g e 21 | 23
Figure 5: OLS and Bayesian SEM Models
First, the value for lambda in both Bayesian models in Figure 5 denotes the asymptotic t-
statistic which is significant to the 99% level. This indicates the presence of spatial correlation in
the houses in the dataset. The number of rooms in a house increases its significance from the
90% to the 95% level from the non-robust Bayesian to the robust Bayesian model, which is
indicative of heteroscedasticity in the presence of spatial correlation. The coefficient estimates
remain the same between the two Bayesian models. However, the quadratic age variable loses
its 90% significance level from OLS to the Bayesian models and the log sqft living area variable
drops from 99% to 95% significance level. These results are indicative of the heteroscedasticity
in the presence of spatial correlation in the OLS regression estimates.
OUTLIERS
The first assignment concluded that outliers were not influencing the fit of the OLS
regression model that was found to be most appropriate. It is again necessary to determine if
outliers are influencing the results of this assignment as well. If outliers are found to have a
statistically significant effect on the models in this assignment then the most appropriate model
are the estimates provided by the Robust Spatial Error Model. Outliers are determined to have
an effect on the regression results if the estimated coefficients change between the
aforementioned robust model and the OLS regression.
In Figure 6, the number of rooms becomes significant to the 95% level and linear age
becomes significant to the 90% level in the robust model. There is variation in the coefficient
estimates as modelled by the spatial error models displayed in Figure 5. Thus it is concluded that
there could be a problem with outliers in the observations.
Logan Travis
22 ECO 4313
P a g e 22 | 23
Figure 7 plots the residuals along a horizontal axis of houses sizes that ordered from
smallest to largest. Heteroscedasticity is indicated in this plot by a funnel shape in the
distribution of these points in two-dimensional space. This is also useful for viewing the outliers
in the dataset. Figure 7 shows a wide distribution of residuals with no discernible pattern
indicative of heteroscedasticity. A couple of outliers may be present around residual 5 and 110
but for the plot illustrates an even distribution of the residuals that does not indicate the
presence of many outliers.
Figure 6: Ordered House Size and Residual Values
Figure 7: OLS Vi plot for outliers and hetero
Logan Travis
23 ECO 4313
P a g e 23 | 23
Figure 8: Robust Gibbs Vi Plot
Figure 8 and 9 show no funnel shape and therefore no heteroscedasticity but many large
spikes which could be indicative of outliers. However, the volatility of the plot indicates that these
spikes are relatively common enough to not indicate a significant influence of outliers on the fit of
the OLS regression model. While Figure 6 seems to indicate an outlier problem, it seems that it
may be that it is slight heteroscedasticity in the presence of spatial correlation in the OLS
regression results.
CONCLUSION
My previous conclusion was for an OLS regression using the log-transformed versions of
sqft living area and lotsize. However, an examination of the homogeneity of variance, spatial
correlation and collinearity of the variables in the regressed concluded that the number of rooms
may be a statistically significant predictor in selling price of a house but had a degraded t-statistic
due to violation of all of these Gauss-Markov assumptions for ordinary least squares estimates.
The quadratic from the age of the house may also be a statistically significant predictor but its
estimated coefficient is not economically different from zero. The proper model to use is the
Robust Spatial Error Model due to the presence of spatial correlation, and outliers in the
observations.

More Related Content

Viewers also liked

Binary Search Tree
Binary Search TreeBinary Search Tree
Binary Search TreeShivam Singh
 
метод проектів (н.)
метод проектів (н.)метод проектів (н.)
метод проектів (н.)Volody120396
 
InduSoft System security webinar 2012
InduSoft System security webinar 2012InduSoft System security webinar 2012
InduSoft System security webinar 2012AVEVA
 
Cristian s.m t ecn icas (pepe)
Cristian s.m t ecn icas (pepe)Cristian s.m t ecn icas (pepe)
Cristian s.m t ecn icas (pepe)Cristian
 
o-net คณิตศาสตร์
o-net คณิตศาสตร์o-net คณิตศาสตร์
o-net คณิตศาสตร์rujeepat
 
веревочный курс
веревочный курсверевочный курс
веревочный курсBusinessUga
 
Presentació SIENA Postgrau ASC IDEC-UPF gener 2012
Presentació SIENA Postgrau ASC IDEC-UPF gener 2012Presentació SIENA Postgrau ASC IDEC-UPF gener 2012
Presentació SIENA Postgrau ASC IDEC-UPF gener 2012Asociación SIENA
 
Reti wsn e applicazione in fase di incendi
Reti wsn e applicazione in fase di incendiReti wsn e applicazione in fase di incendi
Reti wsn e applicazione in fase di incendiLuigi La Torre
 
4.4 final ppp slide show
4.4 final ppp slide show4.4 final ppp slide show
4.4 final ppp slide showRachella01
 
Legance e Lombardi Molinari Segni nel project della centrale a biomasse di Ma...
Legance e Lombardi Molinari Segni nel project della centrale a biomasse di Ma...Legance e Lombardi Molinari Segni nel project della centrale a biomasse di Ma...
Legance e Lombardi Molinari Segni nel project della centrale a biomasse di Ma...Davide Pelloso
 
Presentacion taller preeliminar123
Presentacion taller preeliminar123Presentacion taller preeliminar123
Presentacion taller preeliminar123Danny Caceres
 
Strategic planning for government affairs
Strategic planning for government affairsStrategic planning for government affairs
Strategic planning for government affairsChip Ahlswede
 

Viewers also liked (20)

Theo ny
Theo nyTheo ny
Theo ny
 
Binary Search Tree
Binary Search TreeBinary Search Tree
Binary Search Tree
 
метод проектів (н.)
метод проектів (н.)метод проектів (н.)
метод проектів (н.)
 
InduSoft System security webinar 2012
InduSoft System security webinar 2012InduSoft System security webinar 2012
InduSoft System security webinar 2012
 
Cristian s.m t ecn icas (pepe)
Cristian s.m t ecn icas (pepe)Cristian s.m t ecn icas (pepe)
Cristian s.m t ecn icas (pepe)
 
o-net คณิตศาสตร์
o-net คณิตศาสตร์o-net คณิตศาสตร์
o-net คณิตศาสตร์
 
Rio antigo
Rio antigoRio antigo
Rio antigo
 
Tarun
TarunTarun
Tarun
 
веревочный курс
веревочный курсверевочный курс
веревочный курс
 
Do it Best Corp. Techapalooza 2013 Presentation
Do it Best Corp. Techapalooza 2013 PresentationDo it Best Corp. Techapalooza 2013 Presentation
Do it Best Corp. Techapalooza 2013 Presentation
 
Presentació SIENA Postgrau ASC IDEC-UPF gener 2012
Presentació SIENA Postgrau ASC IDEC-UPF gener 2012Presentació SIENA Postgrau ASC IDEC-UPF gener 2012
Presentació SIENA Postgrau ASC IDEC-UPF gener 2012
 
Reti wsn e applicazione in fase di incendi
Reti wsn e applicazione in fase di incendiReti wsn e applicazione in fase di incendi
Reti wsn e applicazione in fase di incendi
 
4.4 final ppp slide show
4.4 final ppp slide show4.4 final ppp slide show
4.4 final ppp slide show
 
Legance e Lombardi Molinari Segni nel project della centrale a biomasse di Ma...
Legance e Lombardi Molinari Segni nel project della centrale a biomasse di Ma...Legance e Lombardi Molinari Segni nel project della centrale a biomasse di Ma...
Legance e Lombardi Molinari Segni nel project della centrale a biomasse di Ma...
 
Presentacion taller preeliminar123
Presentacion taller preeliminar123Presentacion taller preeliminar123
Presentacion taller preeliminar123
 
Strategic planning for government affairs
Strategic planning for government affairsStrategic planning for government affairs
Strategic planning for government affairs
 
Maestria
MaestriaMaestria
Maestria
 
Linked List
Linked ListLinked List
Linked List
 
Budaya organisasi
Budaya organisasiBudaya organisasi
Budaya organisasi
 
1912 Evanston Home
1912 Evanston Home1912 Evanston Home
1912 Evanston Home
 

Similar to Analysis of Factors Affecting Home Prices in Lucas County, Ohio

Student 26 Revised Assign.1
Student 26 Revised Assign.1 Student 26 Revised Assign.1
Student 26 Revised Assign.1 Aaron Helton
 
England's North-South Divide on Home Ownership
England's North-South Divide on Home OwnershipEngland's North-South Divide on Home Ownership
England's North-South Divide on Home OwnershipCobain Schofield
 
ddiaz_regression_project_stat104
ddiaz_regression_project_stat104ddiaz_regression_project_stat104
ddiaz_regression_project_stat104Ryan Diaz
 
Multiple Linear Regression Applications in Real Estate Pricing
Multiple Linear Regression Applications in Real Estate PricingMultiple Linear Regression Applications in Real Estate Pricing
Multiple Linear Regression Applications in Real Estate Pricinginventionjournals
 
Multiple Linear Regression Applications in Real Estate Pricing
Multiple Linear Regression Applications in Real Estate PricingMultiple Linear Regression Applications in Real Estate Pricing
Multiple Linear Regression Applications in Real Estate Pricinginventionjournals
 
Mth 101 milestone 3 worksheetin this milestone, you will us
Mth 101 milestone 3 worksheetin this milestone, you will usMth 101 milestone 3 worksheetin this milestone, you will us
Mth 101 milestone 3 worksheetin this milestone, you will usJUST36
 
An Empirical Analysis Of Residential Property Flipping
An Empirical Analysis Of Residential Property FlippingAn Empirical Analysis Of Residential Property Flipping
An Empirical Analysis Of Residential Property FlippingDaniel Wachtel
 

Similar to Analysis of Factors Affecting Home Prices in Lucas County, Ohio (9)

Student 26 Revised Assign.1
Student 26 Revised Assign.1 Student 26 Revised Assign.1
Student 26 Revised Assign.1
 
England's North-South Divide on Home Ownership
England's North-South Divide on Home OwnershipEngland's North-South Divide on Home Ownership
England's North-South Divide on Home Ownership
 
ddiaz_regression_project_stat104
ddiaz_regression_project_stat104ddiaz_regression_project_stat104
ddiaz_regression_project_stat104
 
Assignment
AssignmentAssignment
Assignment
 
Housing Paper
Housing PaperHousing Paper
Housing Paper
 
Multiple Linear Regression Applications in Real Estate Pricing
Multiple Linear Regression Applications in Real Estate PricingMultiple Linear Regression Applications in Real Estate Pricing
Multiple Linear Regression Applications in Real Estate Pricing
 
Multiple Linear Regression Applications in Real Estate Pricing
Multiple Linear Regression Applications in Real Estate PricingMultiple Linear Regression Applications in Real Estate Pricing
Multiple Linear Regression Applications in Real Estate Pricing
 
Mth 101 milestone 3 worksheetin this milestone, you will us
Mth 101 milestone 3 worksheetin this milestone, you will usMth 101 milestone 3 worksheetin this milestone, you will us
Mth 101 milestone 3 worksheetin this milestone, you will us
 
An Empirical Analysis Of Residential Property Flipping
An Empirical Analysis Of Residential Property FlippingAn Empirical Analysis Of Residential Property Flipping
An Empirical Analysis Of Residential Property Flipping
 

Analysis of Factors Affecting Home Prices in Lucas County, Ohio

  • 1. Logan Travis 1 ECO 4313 P a g e 1 | 23 Section 1: Analysis for Lucas County, Ohio Logan Travis Economics 4313 Spatial Econometrics Texas State University - San Marcos lgtravis15@gmail.com INTRODUCTION PART 1 of this assignment involved fitting a least-squares regression model to the relationship between 200 observed home selling prices from Lucas County, Ohio, using a constant term and the square foot living area of the home as explanatory variables. The selling price is then logged to determine the effect of the elasticity of the living area on the selling price of the homes in the 200 home sample. PART 2 of this assignment involved fitting a least-squares regression model to the relationship between 200 observed homes selling prices from Lucas County, Ohio, using a constant term, and 8 other characteristics of the home as explanatory variables. Some of the continuous variables are logged to determine the effect of the elasticity of these variables on the selling price of the homes in the 200 home sample. PART 3 of this assignment involved a diagnostic test to determine whether to use the log transformed or linear level relationship for the hedonic house price regression. Another regression involved testing whether the age predictor should be included in the model in a linear or non-linear relationship to selling price. Finally, a test is performed to explore the question of outliers in our data.
  • 2. Logan Travis 2 ECO 4313 P a g e 2 | 23 The source of sample data information is a publicly available data set provided by LeSage as part of the Spatial Econometrics Toolbox, described in LeSage and Pace (2004), containing over 25,000 home sales for the years 1993 to 1998. The data employed here was labeled student24.data containing a sample of 200 nearby homes that sold along with a number of characteristics of the homes (house age, square foot living area, square foot lot size, number of rooms, number of full baths, number of half baths, and number of bedrooms). The simple model used here takes the form Where y1, y2, . . . yn are (n = 200 observed) selling prices, and x1, x2, . . . are (known/observed) values of the square foot living area for each of the 200 homes, and ε1, ε2, . . . are unknown/ unobserved disturbances/errors for our sample of 200 homes The relationship can also be written as Note: 𝛽 describes how changes in the square foot living area (x) are related to changes in selling price (y). 𝛼 indicates the selling price of a vacant lot or a house with zero square foot living area. Part 1.1 Summary statistics Summary statistics for the sample of 200 homes are shown in Figure 4: Table 1 below. These include the mean, median and standard deviation as well as minimum and maximum values for
  • 3. Logan Travis 3 ECO 4313 P a g e 3 | 23 the selling price as well as all available characteristics. The table also shows summary statistics for the total sample of 25,357 homes. Histograms and boxplots are used to describe the distribution of characteristics in the sample of 200 homes in regards to age, sqft living area and selling price. Figure 1 shows a histogram of age which the left skewedness of distribution of the ages of homes. The amount of skew is evident by the distance between the median line to the right of the mean line. The mean is being pulled downward by the outliers below the first quartile. The boxplot shows the range and interquartile breakdown of 50% of the ages of the 200 home sample. The first quartile begins at approximately 38 years of age, below which there are four outliers in my sample that are less than 30 years of age. Figure 1: Age Distribution Figure 2 shows a histogram which indicates the right skew of the distribution of sqft living area within the sample. The median is to
  • 4. Logan Travis 4 ECO 4313 P a g e 4 | 23 the left of the mean, which indicates that there are outliers pulling the mean upward. The living area distribution is skewed to the right because of the presence of these outliers as indicated by the boxplot. Figure 2: Sqft TLA Distribution Figure 2 shows a histogram which indicates a right skew in the distribution of selling price in the sample of 200 homes wherein the median resides to the left of the most frequent selling price range but is not significantly different from the mean. The boxplot of the sample shows the interquartile range of the majority of selling prices for the sample between with the first quartile beginning at $43,900 and the third quartile ending around $68,000. There are no outliers present. Figure 3: Selling Price Distribution
  • 5. Logan Travis 5 ECO 4313 P a g e 5 | 23 Tabular summary statistics are for the sample of 200 homes are shown in Figure 4: Table 1 below. These include the mean, median and standard deviation as well as minimum and maximum values for the selling price as well as all available characteristics. The table also shows summary statistics for the total sample of 25,357 homes. These include the mean, median and standard deviation as well as minimum and maximum values for the selling price as well as all available characteristics. Figure 4: Table 1 The median for age is older than the mean suggesting an asymmetry skewed to the left. The comparable mean and median for the selling price indicates a symmetric distribution of values in the sample. This means that there is similar distribution of the selling price of homes both above and below the “typical” home The mean of sqft living area is above the median “typical” house in the sample indicates a right skewedness to the sample that may be caused by extreme values above the median value of the homes in my sample. The number of rooms and bedrooms in the “typical” house in my sample is higher than the mean which suggests left skew. This indicates that there are more homes in my sample with as many or more rooms than the “typical” home in my sample.
  • 6. Logan Travis 6 ECO 4313 P a g e 6 | 23 Both the number of full baths and half baths have a mean and median that are equal suggesting a symmetric distribution. The “typical” house in my sample is 22 years older, smaller in lotsize and sqft living area and sold for less than the “typical” house in the full sample. The range of selling prices is also much smaller with my sample than that in the full population. The distribution of homes in my sample is more symmetric than the full sample as indicated by the closeness in value of the mean and median in my sample as compared with the larger differences in the full sample. The standard deviation of the selling prices in my sample is much lower than the full population suggesting much less variation in the selling prices than the entire population The full population sample has a mean $13,518 above the median suggesting an asymmetric distribution of prices skew to the right. The mean is being influenced by the large maximum value of $875,000. Part 1.2 Univariate Regression Results from the univariate regression are presented in Table 2. The slope, as represented by 𝛽, is 33.72 which indicates an increase in one square foot increases price by $33.72 for a home in my sample. The t-statistics indicates that estimate is 11.5 standard deviations away from zero which suggests that sqft living area is a statistically significant predictor of variation in the estimation of selling price of a home in my sample at the 99% confidence level. Table 2: Ordinary Least Squares Estimate (levels model) The value of an empty lot, as indicated by the coefficient of the constant term, is $17,176.22. The p-value and t-statistic for the value of an empty lot shows statistical significance at the 99% level in this model. R2 shows that this model explains approximately 40% of the
  • 7. Logan Travis 7 ECO 4313 P a g e 7 | 23 variation in the selling price in the sample of 200 homes as explained by the sqft living area of the house. This could be indicative of omitted variable bias since this naive model is not controlling for any other predictors of the selling price. The results for a second regression are presented in Table 3. This regression shows an estimation where the Y and X variables were transformed to their log form. This parameter estimate of 𝛽 represents percentage response to percentage changes in sqft living area or the elasticity of selling price to sqft living area. The positive slope of the fitted line indicates an increase of living area by one percent would lead to price increase of 0.79% on average over the 200 homes. The t-statistic for this slope estimate is over 11 standard deviations away from zero and has p-value that shows that this estimate of elasticity is significant at the 99% confidence level. R2 indicates that 40% of variation in the observed logged selling price is explained by the change in logged sqft living area in the homes in my sample. Table 3: OLS Estimates (log-transformed model) The figures below were included, one from each regression showing a scatter plot of the actual versus fitted values for the 200 homes (logged or unlogged) selling prices, with the horizontal axis showing (logged or unlogged) square foot living area. The scatterplot for Figure 5 exhibits an error for one home that is much larger than the rest of the homes. The majority of homes sold between $35,000 and $75000. There houses are clustered in the bottom left quadrant of the graph demonstrating that the homes selling price was low and their size was small but they are dispersed widely above and below the prediction line for the model. This is a reiteration of the R2 value which indicates that the univariate regression is a naive model that is a poor estimator for selling price of any particular house in my sample. The levels simple linear model in Figure 6 had a tendency to overestimate the selling price for home between 500 and
  • 8. Logan Travis 8 ECO 4313 P a g e 8 | 23 1000 sqft living area. The log-transformed simple linear model is a better model since it indicates a similar tendency to overestimate as to underestimate selling price using sqft living area. Compared to the non-logged model, the log-transformed model is a better predictor for selling price and the relatively large house in Figure 1. However, the large dispersion below the fitted line suggests that it is a poor predictor for homes that sold relatively cheaply compared to other homes in the sample. The same 7 homes in Figure 1 are still errors in Figure 6. Figure 6: Scatter plot of actual selling prices versus fitted valuessqft living area Figure 5: Log-transformed regression actual prices versus fitted values
  • 9. Logan Travis 9 ECO 4313 P a g e 9 | 23 Part 2: Multivariate Regression This second part of the assignment involves extending the regression model to include 7 other possible explanatory variables in the attempt to predict selling prices. As before, this model will use both the level and log-transformed continuous variables. The log transformed variables are sqft living area, selling prices and lotsize. The other five variables are categorical and are not log- transformed. Table 4 and Table 5 present the coefficient estimates for levels regression and log- transformed regression, respectively. The estimate for square foot living area points to a $16.87 increase in selling price associated with one square foot increase in living area which is statistically significant at the 99% level. Also statistically significant at the same level is the estimate of the effect of the increase of one square foot in lotsize on the selling price of a house in my sample; it will increase the selling price by an estimated $1.34. The estimate for an empty lot is $15,067.41 which is 2 standard deviations away from zero and is statistically different than zero at to the 95% level. All other estimates of the effect for other predictors in this extended model are not statistically different from zero. Our level model is therefore; Table 4: Multivariate OLS Estimates for levels regression
  • 10. Logan Travis 10 ECO 4313 P a g e 10 | 23 This states that the prediction for selling price increases $16.87 for each sqft living area increase controlling for lotsize the house is built upon. The rbar-squared is used to compare the simple levels model to the extended since it penalizes for the addition of predictors in the denominator. This shows that the extended model explains a further 8% of the variation in the actual selling prices in my sample as indicated by a rbaradjusted value of 48.19% versus the 40.23% for the simple model. There is a noticeable reduction in errors using this extended levels linear model. Table 5: Multivariate Regression of log-transformed model This log transformed regression allows for the inclusion of logged continuous variables as predictors of the change in logged selling price of homes in my sample. The variables that are transformed into logs are lotsize, sqft living area and selling price. These statistically significant coefficients are interpreted as elasticity or the effect of the marginal percentage change on the percentage change in selling price. The log-transformed model can be represented thusly, 𝐸(𝑦̂|𝑙𝑜𝑔𝑥 𝑠𝑞𝑓𝑡 𝑇𝐿𝐴 𝑙𝑜𝑔𝑥𝑙𝑜𝑡𝑠𝑖𝑧𝑒) = 5.39+. 378𝑙𝑜𝑔𝑥 𝑠𝑞𝑓𝑡 𝑇𝐿𝐴 +. 044𝑙𝑜𝑔𝑥𝑙𝑜𝑡𝑠𝑖𝑧𝑒 This can be interpreted as a 10% increase in the sqft living area will have an estimated 3.78% increase in selling price of a home in my sample while controlling for the effect of the lotsize. This lotsize effect is estimated to increase selling price 3.09% when lotsize is increased by 10%. The value of an empty lot is $219.20 is statistically significant at the 99% confidence interval but is not economically significant since it is numerically close to zero.
  • 11. Logan Travis 11 ECO 4313 P a g e 11 | 23 There is a more pronounced increase in the value of adjusted R-squared at 52.59% from the previous simple log-transformed model by controlling for lotsize. This model explains a further 12.54% of the variation in the estimated logged selling price and seems to indicate a better fit. However, the two statistics are not appropriate measure of goodness of fit between a log and levels regression model and requires more sophisticated statistical analysis. The proportion of unexplained to errors indicates this improvement in fit. The scatterplots in Figure 6 show that both forms of the model tend to overestimate houses that sold for less but it underestimated the values for homes that sold for more than the typical home in my sample. Figure 6: Scatterplot of residuals of multivariate model Part 3: Specification Tests The part of the assignment is threefold. First, a test of the linear or non-linear relationship of the predictor age to the house selling price. Second, a determination is made regarding which of the two extended regression models, levels versus logged, is more appropriate for the hedonic house price regression for my sample of 200 homes. Lastly, there is an investigation of the impact outliers in my sample of 200 homes. Part 3.1 Relationship of house age This section uses the R-bar squared statistic to determine the statistical significance of the estimated effect of predicting selling price using a linear, quadratic and cubic house age variable. This adjusted form of R-squared penalizes for the addition of explanatory variables in these three models and
  • 12. Logan Travis 12 ECO 4313 P a g e 12 | 23 is therefore more appropriate than r-squared. It is theorized by R. Kelley Pace in, Journal of Real Estate Finance and Economics, that the predictor age might not follow a linear relationship but is more polynomial in its effect upon selling price. This is interpreted as an increase in home age depressing the value of a home until its becomes an economically-significant age that is old enough as to add value to the home’s selling price due to its perception as an antique or being historic. Figure 7 indicates that the best model for my sample is using the predictor of the quadratic house age. This indicates that house age decreases house selling price at an increasing rate. Figure 7 Part 3.2 Test for log versus levels specification This part of the assignment is a measure of goodness of fit for the two forms of the model. The null hypothesis being tested here is that both forms of the models are equal in the ability to predict the selling price for my sample of 200 homes. It is the rejection of this hypothesis that will allow the appropriate specification to be determined. This procedure originated with Sargen, 1964. This section uses MATLAB to run a regression using a regression of a model that is transformed using the geometric mean as opposed to levels or log-transformed. As already noted, we cannot compare the fit of the two models using R2 because the log transformation to y changes the variation in y to variation in ln(y). However, we can follow the 4-step procedure from Gujarati page 41. This procedure is for the case where all y and all x−variables are logged (which is not exactly our case). There are other approaches set forth in the literature that might be more appropriate here, but these are more complicated (e.g., see Aneuryn-Evans and Deaton, 1980). Another common practice is to take the antilog (exponential) of the logged predicted values and compute an R−squared statistic for the (anti) log-transformed model that would be comparable to the untransformed model R−squared. We will rely on the results from the previous section that indicated the appropriate model specification should include age + age-squared or quadratic explanatory variables. This 4-step procedure from Gujarati p. 41 is calculated with the following MATLAB code:
  • 13. Logan Travis 13 ECO 4313 P a g e 13 | 23 This code retrieves the (vector of) residuals from the ‘result1’ and ‘result2’ structure variables returned by the ols(log(ytilde),lnx) and ols(ytilde,xmatrix) function calls, then calculates the residual sum of squares using the inner product vector multiplication. Finally, a formal chi-squared distributed statistic is calculated. The numerator and denominator for this statistic depend on whether RSS1 or RSS2 is larger, which is why we use the MATLAB min() function to determine this. The results of this test indicate that the log-transformed model produces a better fit. However, lambda indicates that the improved fit is significant at the 95% level since it is less than the 5% critical value which fails to provide enough evidence to reject the null hypothesis. Nevertheless, a log transformed model will be used as the most appropriate model. A robust regression will be performed using this log-transformed model as the most appropriate model for predicting selling prices of homes in my sample and estimates from the robust regression will be compared to a log transformed ordinary least squares regression having the same variables.
  • 14. Logan Travis 14 ECO 4313 P a g e 14 | 23 Figure 8: Evidence for supporting rejection of null hypothesis and appropriate use of log-transformed model Part 3.3 Robust Regression As a test for outliers, we carried out robust regressions using Bayesian MCMC estimates proposed by Geweke (1993). This regression will be using the most appropriate model as determined by the two previous sections of this part of the assignment. Specifically, it is the log-transformed linear model as controlled for lotsize and age-squared. Table 7 shows the results of the robust regression. Table 7: Robust regression results The adjusted r-squared shows that this robust model explains 52.38% of the variation in the predictions of selling price. There are 9 variables in this model with the addition of the quadratic age predictor. Table 8: Robust Regression estimates The results of Table 8 indicate that the quadratic house age predictor’s effect is not statistically significant from zero. The elasticity of lotsize and sqft living area are significant at the 99% level. The
  • 15. Logan Travis 15 ECO 4313 P a g e 15 | 23 predicted effects lotsize and sqft living area elasticity indicates that an increase in their sizes by 10% will increase the elasticity of house price by 3.0% and 3.97%, respectively. The number of rooms is included in this robust model at the 95% confidence interval. It’s estimated effect upon predicted selling price is to increase the selling price by a non-significant economic amount. A comparison between the differences in the coefficient estimates of the robust and OLS regression models is used as a test for outliers. If there are significant differences between these estimates, then the implication is that outliers are impacting the results of the OLS regression model. Table 9: OLS Regression Estimates Table 9 indicates that there is less than a percentage point difference in the coefficient estimate of logged sqft living area. All other variables do not indicate the presence of outliers impacting the regression results. Figure 7: vi plot of ordered residuals Figure 7 is a plot of the residuals using a Geweke test that shows the weights of the residuals. Even though there seems to be aberrations around observations 60 and 160, their vi estimate values are not high enough to indicate an impactful effect of outliers.
  • 16. Logan Travis 16 ECO 4313 P a g e 16 | 23 Part 4: Conclusion The best model for my sample of 200 homes in the Lucas County, Ohio area is to use OLS regression model controlling for logged lotsize , logged sqft living area and the quadratic form of house age. References Aneuryn-Evans, G. and A. Deaton (1980) “Testing linear versus logarithmic regression models,” Review of Economic Studies, 47, 275-91. LeSage, James P. and R. Kelley Pace, “Models for Spatially Dependent Missing Data,” Journal of Real Estate Finance and Economics, 2004, Volume 29, number 2, pp. 233 254. Geweke, J. (1993). “Bayesian Treatment of the Independent Student t Linear Model,” Journal of Applied Econometrics, 8, 19-40. Guajarati, D, (2011), Econometrics by Example, Palgrave Macmillan, 5th Edition. Ramsey, J.B. (1969) “Tests for Specification Errors in Classical Linear Least Squares Regression Analysis”, Journal of the Royal Statistical Society, Series B., 31(2), 350371. JSTOR 2984219 SARGAN, J. D. (1964), “Wages and prices in the United Kingdom”, in Hart, P. E., Mills, G. and Whitaker, J. K. (eds.) Econometric Analysis for National Economic Planning (London: Butterworths).
  • 17. Logan Travis 17 ECO 4313 P a g e 17 | 23 INTRODUCTION A hedonic price ordinary least squares regression was performed in SECTION 1 of this assignment on 200 non-random house observations from a common geographic region. This hedonic price ordinary least squares regression compared the appropriateness of a levels versus a log-transformed model and also investigated the nature of the relationship between a house’s age and selling price. It concluded by comparing the hese OLS regression models against a robust model and tested for the influence of outliers on the regression results. The conclusion was that the most appropriate model was the log-transformed OLS model as explained by the percentage change in sqft living area and the percentage change in lotsize and that age exhibited a significant quadratic relationship with the selling price. It also determined that outliers were not influencing the regression results. PART 2 of the assignment is aimed at testing the Gauss-Markov assumptions associated with the ordinary least squares (OLS) regressions performed in PART 1. First, the collinearity of the variables in the regression is examined by applying a singular value decomposition to the variance-covariance matrix of the estimates. Collinearity is also determined by investigating the amount of upward bias present in the coefficients of two Ridge regressions using an H-K ϴ and 4*H-Kϴ values that introduce increasing levels of bias into the model. Secondly, the assumption of homoscedasticity is examined by comparing the OLS estimates statistical significance against a semi-parametric White regression and a Newey-West regression. Thirdly, the influence of spatial dependence upon the regression estimates is inspected given that the selection of the observations in the dataset used for this hedonic price regression was not random but dependent upon their spatial adjacency to one another. This is determined by comparing the OLS results against those of robust and non-robust Bayesian spatial error models. Lastly, the influence of outliers is again reconciled with the conclusion of PART 2 of the assignment in order to arrive at the most appropriate model for the hedonic price regression of the dataset after considering the Gauss-Markov assumptions.
  • 18. Logan Travis 18 ECO 4313 P a g e 18 | 23 COLLINEARITY The presence of collinearity in the regression results is first explored using a Belsley-Kuh- Welsch variance decomposition. This tabulates the variance proportions of the variables wherein a possible near linear relationship is demonstrated when two proportions within the same condition index are above the 0.50 threshold. Figure 1: Belsley-Kuh-Welsch Variance Decomposition According to Figure 1, there is possible collinearity exhibited between the age and age2 variable. There is also evidence of possible collinearity between the number of bedrooms and the total number of rooms in the house. There is a possible degradation of the OLS estimated coefficients’ precision due to this collinearity. Omitted variables bias may be present in the estimates due to the degradation of precision in the OLS regression when two variables become more correlated. Two ridge regressions with increasing amount of bias, applied using the H-Kϴ and (4*H-Kϴ) values, are compared against the OLS estimate results. Any change in statistical significance of the variables is indicative of the presence of a statistical problem arising from the near linear relationship identified by the BKW diagnostics, since these tend to blow up the variance of the coefficient estimates.
  • 19. Logan Travis 19 ECO 4313 P a g e 19 | 23 Figure 2: OLS and Ridge Regression Results Figure 2 reveals that the 𝛽, or coefficient estimates, show upward bias in the sqft living area and lotsize between the three regressions. The significance for the variables remains unchanged throughout the three regression results. Values of Regression Coefficients as a Function of Figure 3 shows a plot of estimates for the variables on the vertical axis, with increasing amounts of bias as theta increases on the horizontal axis versus the unbiased 𝛽 𝑂𝐿𝑆 at the origin on the horizontal axis. Any sloping lines demonstrate variables exhibiting upwards bias, and the vertical line is the H-Kϴ value with a moderate level of bias introduced. This is the case for sqft living area and lotsize which further illustrates the conclusions in Figure 2. The conclusion of this part of the assignment is that there is no problem with collinearity regardless of the implication of a near linear relationship from the BKW diagnostics. HETEROSCEDASTICITY The Gauss-Markov assumption of homogeneity, or homogeneous variance of the disturbances is investigated by comparing the significance of the OLS regression results against White and Newey-West regression. The Newey-West regression results show Heteroscedastic Autocorrelation Consistent Estimates that allow for both heteroscedasticity and serial correlation. If the dataset observations are in order of size, then spatial correlation may mimic serial and provide a false positive. The presence of heteroscedasticity is demonstrated in this test by a change in the significance level of a variable from one regression to another.
  • 20. Logan Travis 20 ECO 4313 P a g e 20 | 23 Figure 4: Regression Results for Heteroscedasticity Figure 4 shows the change in significance at the 90% level, from the previous insignificant level in the the OLS regression, of the number of rooms in a house in both White and Newey- West. The linear age of a house also increases its significance to the 90% level from the previous insignificance in the OLS regression in both White and Newey-West regressions. The quadratic age of a house increases its significance from 90% in the OLS regression to 95% in the White regression. However, the Newey-West regression shows no change in the significance level from the OLS regression. This indicates that there might be some slight heteroscedasticity in the OLS model with regards to the linear and quadratic form of house age and the number of rooms in a house. SPATIAL DEPENDENCE The presence of spatial dependence is probable due to the selection method of the observations in the dataset being the result of spatially adjacent houses. Spatial dependence is therefore studied because it is logical that the selling price of a house is influenced by the disturbances of the houses neighboring it. This logic is scrutinized by comparing the OLS regression results against non-robust and robust Bayesian spatial error models. A lambda ( ) that is statistically significant indicates that this logic holds true for the houses in the dataset. Heteroscedasticity in the presence of spatial correlation is also investigated using the change in the significance levels of the variables and the change in 𝛽 point to outliers from the three regression models.
  • 21. Logan Travis 21 ECO 4313 P a g e 21 | 23 Figure 5: OLS and Bayesian SEM Models First, the value for lambda in both Bayesian models in Figure 5 denotes the asymptotic t- statistic which is significant to the 99% level. This indicates the presence of spatial correlation in the houses in the dataset. The number of rooms in a house increases its significance from the 90% to the 95% level from the non-robust Bayesian to the robust Bayesian model, which is indicative of heteroscedasticity in the presence of spatial correlation. The coefficient estimates remain the same between the two Bayesian models. However, the quadratic age variable loses its 90% significance level from OLS to the Bayesian models and the log sqft living area variable drops from 99% to 95% significance level. These results are indicative of the heteroscedasticity in the presence of spatial correlation in the OLS regression estimates. OUTLIERS The first assignment concluded that outliers were not influencing the fit of the OLS regression model that was found to be most appropriate. It is again necessary to determine if outliers are influencing the results of this assignment as well. If outliers are found to have a statistically significant effect on the models in this assignment then the most appropriate model are the estimates provided by the Robust Spatial Error Model. Outliers are determined to have an effect on the regression results if the estimated coefficients change between the aforementioned robust model and the OLS regression. In Figure 6, the number of rooms becomes significant to the 95% level and linear age becomes significant to the 90% level in the robust model. There is variation in the coefficient estimates as modelled by the spatial error models displayed in Figure 5. Thus it is concluded that there could be a problem with outliers in the observations.
  • 22. Logan Travis 22 ECO 4313 P a g e 22 | 23 Figure 7 plots the residuals along a horizontal axis of houses sizes that ordered from smallest to largest. Heteroscedasticity is indicated in this plot by a funnel shape in the distribution of these points in two-dimensional space. This is also useful for viewing the outliers in the dataset. Figure 7 shows a wide distribution of residuals with no discernible pattern indicative of heteroscedasticity. A couple of outliers may be present around residual 5 and 110 but for the plot illustrates an even distribution of the residuals that does not indicate the presence of many outliers. Figure 6: Ordered House Size and Residual Values Figure 7: OLS Vi plot for outliers and hetero
  • 23. Logan Travis 23 ECO 4313 P a g e 23 | 23 Figure 8: Robust Gibbs Vi Plot Figure 8 and 9 show no funnel shape and therefore no heteroscedasticity but many large spikes which could be indicative of outliers. However, the volatility of the plot indicates that these spikes are relatively common enough to not indicate a significant influence of outliers on the fit of the OLS regression model. While Figure 6 seems to indicate an outlier problem, it seems that it may be that it is slight heteroscedasticity in the presence of spatial correlation in the OLS regression results. CONCLUSION My previous conclusion was for an OLS regression using the log-transformed versions of sqft living area and lotsize. However, an examination of the homogeneity of variance, spatial correlation and collinearity of the variables in the regressed concluded that the number of rooms may be a statistically significant predictor in selling price of a house but had a degraded t-statistic due to violation of all of these Gauss-Markov assumptions for ordinary least squares estimates. The quadratic from the age of the house may also be a statistically significant predictor but its estimated coefficient is not economically different from zero. The proper model to use is the Robust Spatial Error Model due to the presence of spatial correlation, and outliers in the observations.