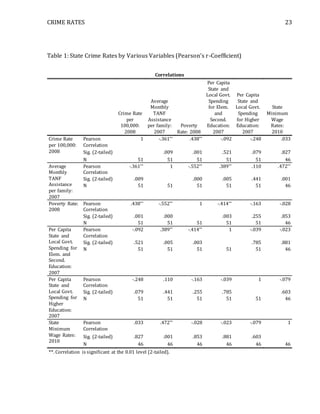
SlideShare a Scribd company logo
1 of 27
Running head: CRIME RATES 1
Is Crime Rate Dependent on Money and Education?
Alejandro Colon
Western New England University
CJ/SO 301
Written in May 2015
Abstract
CRIME RATES 2
This paper will discuss crime rates and how they are effected by different variables. The
variables that will be tested against crime rates are poverty, minimum wage, educational
funding, higher educational funding, and TANF assistance. All of the variables used in
this research project at scaled at the state level. In order to find the results, Pearson
correlation was used to determine if there was a significance between crime rates and the
4 independent variables. The results prove that only 2 of the 5 relationships were
significant while the other 3 were not. The research shows crime rates can be deterred if
the focus is in the correct areas.
Crime: Is it Explained by Lack of Money or Lack of Education?
CRIME RATES 3
Crimes are actions that happen every day and they’re impossible to stop
completely. This problem seems to be centralized around the Karl Marx’s Conflict
Theory. According to Crossman (2015), Marx saw society that was broken into groups
that compete against each other for social and economic resources. He believes the power
is in the possession of those with the greatest political, economical, and social resources.
The focus with regards to violent crime is the economic aspect of the theory. Violent
crime can also be based on the Anomie Theory. This theory was first developed in 1893
by Emile Durkhein this is potentially a reason why crimes are committed. The theory
deals with not knowing how to respond when something catastrophic happens to us.
Losing your job is a prime example of this. Rock (2012) believes Anomie Theory is tied
to the belief that since the disciplines and authority of society are so flawed that they
offer few restraints or moral direction. According to sociologists, these two theories both
play a part into the reasons why violent crime is committed.
Although violent crimes are on the decline in America, it is still a major problem
and needs to be addressed. According to the Federal Bureau of Investigation, the Uniform
Crime Report shows an increase in violent crime from 1.33M in 2009 to 1.60M in 2013.
Understanding why these crimes are committed is extremely hard to do on a person-by-
person level. It is easier and more practical to understand it on a broader scale. Funding
schools and people in need have shown improvement in the violent crime statistics.
According to the table that Motivans (2015) presents, the higher the education level you
have, the less likely you are to commit a crime. Over 40% of crimes between October 1,
2010 and September 30, 2011 were committed by people who didn’t have a high school
diploma, while only 23% were committed by people who did have a diploma. When
CRIME RATES 4
people have little or no money, they are more vulnerable to committing crimes. Marx’s
Conflict Theory defends this because he believes the people with a better economic status
are the ones in control with their actions.
Educational Funding
Winter (2005) claims that more education does reduce the crime rate, as one extra
year of high school has a significant impact on the probability of being arrested. Winter
(2005) believes it is because people with more education are more likely to get a job, or
higher paying jobs. This will steer a person away from committing a crime that involves
money. People who stay in school for the duration of high school and even further, either
enjoy the experience or understand the importance of education. Thiele, Shorette, and
Bolzendahl (2012) claim that despite the increase in students, state support for higher
education has declined in recent years. Doyle and Delaney (2009) claim that when the
economy is bad, legislators target higher education for larger budget cuts than other state
services. The reason for this is because colleges and universities can collect revenue from
tuition and also, college students are not considered the states’ neediest population
(Doyle and Delaney, 2009). Thiele et al. (2012) believe state legislators are the most
influential actors concerning policy change because they must consider the costs and
benefits likely to derive from distributing scarce resources to public higher education.
Although legislators do not consider college students to be the neediest population, they
are the population that commits the least amount of crimes. Motivans (2015) shows us
that people who experienced some college accounted for less than 12% of crimes
committed between October 1, 2010 and September 30, 2011, and less than 5% for
people who graduated college. Arum (2002) argues that your economic value relies more
CRIME RATES 5
on cognitive skills you learn at school rather than at home. Arum (2002) acknowledges
that some researchers believe school does not help at all if you’re poorly socialized. The
counter to this is that schools and institution can serve as a turning point in their life
(Arum, 2002). If an individual has a rough life at home, school can be a place where they
can get away from it. This can cause the student to see life in a more positive perspective
rather than what they are used to seeing at home. Arum agrees that funding schools will
create a more likely chance students will actually go because they’ll enjoy it more. The
funds can go to certain programs or events that will make school more enjoyable for the
students.
Unemployment
Unemployment can cause criminal rates to rise. Winter (2005) claims that
between the year 1992 and 1997 in the United States, the rate of auto theft fell by 15
percent, the rate of robbery fell by 30 percent, and the rate of larceny fell bet. While at
the same time, the unemployment rate fell by 2.5 percent. Unemployment can cause an
increase of population who are homeless. According to Covin (2012), over the last few
decades, there has been a large increase in the arrests of homeless people. This turns into
a cycle because people who come out of prison tend to have low incomes, which can
cause them to be homeless again when they are released (Covin, 2002). This refers to the
concept of deterrence. Stafford and Goodrum (2001) explain that people are deterred
from committing a crime because they perceive some risk of suffering a punishment as a
response to the crime. If a person does not have a home or a job, chances are they are not
scared to get punished because they don’t have anything to lose.
Family Assistance
CRIME RATES 6
Assistance to families in need across the nation has been declining. This is not
because less people need assistance, but because less assistance is given. According to
Fording, Schram and Soss (2013), between 1994 and 2005, the percentage of families
eligible for TANF actually receiving TANF decreased from 84 percent to 40 percent
(Fording et al., 2013). According to the Federal Bureau of Investigation (2013), in 1995,
the number of violent crimes committed was 796,250 and the number of property crimes
was 2.1M. In 2005, those numbers increased to 1.3M for violent crimes and 10.2M for
property crimes. The number of families living in extreme poverty increased from 1.46M
in 1996 to 2.4M in 2011. Muennig, Caleyachetty, Rosen, and Korotzer (2015) mention
TANF may results in people becoming dependent on it, therefore may serve as an
incentive to stay out of work. While this may be a valid argument, Fording et al. (2013)
explain that TANF are creating more sanctions for those who do not comply. These
sanctions include more requirements, narrower exemption criteria, an expanded list of
behaviors that can possibly results in sanctions, and a stronger penalty for noncompliance
(Fording, et al., 2013).
Minimum Wage
Minimum wage has been a major topic in America for the past couple of years.
The reason for this is because there are many ripple effects. Rogers (2014) agrees with
increasing the price of minimum wage because it will enhance low-wage workers’ self-
respect. Harlan (2015) included in his article, it’ll only hurt small businesses and
therefore result in more unemployed workers. More unemployed workers means more
poverty and homeless people. Rogers (2014) counters this argument and focuses on the
particular aspect more than the general aspect. He provides an example that involves a
CRIME RATES 7
janitor whose pay was increased by almost $2. He states that even though he and his
coworkers still do not make a lot of money, at least now with the living wage, they can
hold their heads up high (Rogers, 2014). The question is, what does increasing minimum
wage have to do with crime? Once again it refers back to the deterrence theory. If Rogers
(2014) is correct in his argument, then people will have more to lose because they are
getting paid money and therefore feel more valued in society. If Harlan (2015) is correct,
than more people will end up losing jobs because the owners will not be able to pay their
workers and still afford to run the business. This will result in more poverty which refers
to what Covin (2002) said about homeless people being targets for crime.
The studies presented discuss just a few variables that may have an effect on
crime in the United States. These studies involved people who lack education and/or
money so they are forced to engage in criminal behavior. Although people who have
money and/or education still commit crimes, there seems to be a decrease in crime rates
as there is an increase in money and educational level. Funding these types of problems
will help resolve it and therefore decrease crime rates.
This paper will research variables that cause people to commit crimes in the
United States. One factor will include poverty that involves the absence of a job, TANF
for those who need assistance, and minimum wage laws. In addition to these, educational
levels, in relation to crime, will also be evaluated. The goal is to examine whether
funding the appropriate groups will result in a lower crime rate. This paper will use these
variables to show that more money and/or education results in a lower crime rate.
Hypothesis
CRIME RATES 8
Null Hypothesis- Funding education will not have an effect on crime rates
Alt. Hypothesis- Funding education will decrease the amount on crime rates.
Null Hypothesis- Funding families will not have an effect on crime rates
Alt. Hypothesis- Funding families in need will decrease crime rates
Null Hypothesis- Increasing minimum wage will not have an effect on crime rates
Alt. Hypothesis- Increasing minimum wage will decrease crime rates
Null Hypothesis- Lower unemployment rates will not have an effect on crime
rates
Alt. Hypothesis- Lower unemployment rates will decrease crime rates.
Methods
The Problem
Variables like educational funding, unemployment, family assistance, and
minimum wage rates are important to research when looking at what causes crime rates
to go up or down. Research in the past shows that a lack of any or all of these variables in
a community will increase the crime rate in that area. When focusing on variables like
this, it is important to take all of them into consideration when you examine the results of
the crime rates. Many researchers have studied educational funding, unemployment,
family assistance, and minimum wage and related them to crime rates individually. This
type of research will gather all of the individual variables and put them into one research
CRIME RATES 9
topic. The research will either agree or disagree with previous researchers and their
findings.
Data Source and Sample
Since there is not any funding to the research, the results will be based off of
secondary analysis. This is actually more convenient since the results must be collected
within a semester. Because the data has already been collected there’s no time or money
wasted trying to collect the data. The data that will be used will be from the States Data
Files of 2010 (STATES10). This data was provided at the beginning of the semester in
the textbook, Analysis with SPSS: A First Course in Applied Statistics (Sweet & Grace-
Martin 2012). In this data set, each case represents one of the fifty states. There are fifty-
one respondents for each state.
Hypotheses
The research deals with whether crime is directly related to funding of education
and jobs. There are many possible hypotheses that this research project will address. The
hypotheses this research will test are:
H◦¹) States funding for education will not have an effect on crime rates.
Ha
1) States funding for education will have lower crime rates.
H◦
2) States funding for TANF will not have an effect on crime rates.
Ha
2) States funding for TANF will have lower crime rates.
H◦
3) States poverty rate will not have an effect on crime rates.
Ha
3) States poverty rate will have lower crime rates.
H◦
4) States minimum wages will not have an effect on crime rates.
Ha
4 ) States minimum wages will have lower crime rates.
CRIME RATES 10
Variables:
Dependent Variables: There is only one dependent variable in this study. The
variable CRS31: Crime Rate per 100,000: 2008 will be tested against several independent
variables to see if there is a relationship.
Independent Variables: There are several independent variables that will be tested
against CRS31. All of the independent variable that will be listed is a scale measure.
PVS546: Average Monthly TANF Assistance per Family: 2007, PVS519: Poverty Rate:
2008, EDS140: Per Capita State and Local Govt. Spending for Elem. and Second.
Education: 2007, EDS144: Per Capita State and Local Govt. Spending for Higher
Education: 2007, and EMS170: State Minimum Wage Rates: 2010.
Procedures
The general method used for this research will be Pearson correlation. This was
picked as method to use because it gives us the direct correlation that each variable has
with crime rates. Pearson correlation will present us will the correlation, significance (2-
tailed) and the amount of subjects that were involved in the study. In this case, we are
talking about states.
The first step to determine the hypotheses is to use Pearson correlation to test the
association and significance level between poverty rates and crimes rates. By doing this,
the Pearson table will show us whether or not these variables are statistically significant
at a state level. Also, it will tell us if the correlation is positive or negative.
The second step to determine the hypotheses is to use Pearson correlation to test
the association and significance level between minimum wage and crimes rates. By doing
CRIME RATES 11
this, the Pearson table will show us whether or not these variables are statistically
significant at a state level. Also, it will tell us if the correlation is positive or negative.
The third step to determine the hypotheses is to use Pearson correlation to test the
association and significance level between educational funding and crimes rates. By
doing this, the Pearson table will show us whether or not these variables are statistically
significant at a state level. Also, it will tell us if the correlation is positive or negative.
The fourth step to determine the hypotheses is to use Pearson correlation to test
the association and significance level between higher educational funding and crimes
rates. By doing this, the Pearson table will show us whether or not these variables are
statistically significant at a state level. Also, it will tell us if the correlation is positive or
negative.
The fifth step to determine the hypotheses is to use Pearson correlation to test the
association and significance level between funding for TANF and crimes rates. By doing
this, the Pearson table will show us whether or not these variables are statistically
significant at a state level. Also, it will tell us if the correlation is positive or negative.
Findings
Crime Rate
The dependent variable for this study is Crime Rate. Data was collected from
46 states with 5 states missing. On a state level, the mean Crime Rate per 100,000 is
3461.537. The median is 3440.2 and the standard deviation is 897.9646. The state
with the highest crime rate is District of Columbia with 6542.3. The state with the
lowest crime rate is South Dakota with 1847.
TANF Assistance
CRIME RATES 12
One of the variables that were tested with crime rates was Average Monthly
TANF Assistance per family. Data was collected from 46 states with 5 states missing.
On a state level, the mean monthly TANF assistance per family was $337.889. The
median was $323.545 and the standard deviation was 106.3606. The state with the
lower family assistance was Georgia with $151.3. The state with the highest family
assistance was Alaska with $601.3. The Pearson Correlation shows there’s a
moderate negative correlation of -.361**. This means that crime rates are higher as
TANF assistance goes down. This proves that the hypothesis for these two variables
was correct. The significance level between crime and family assistance is .009
which shows that this relationship is unlikely due to chance. Figure 1 shows that
there is a negative linear relationship.
Poverty
One of the variables that were tested with crime rates was Poverty Rates.
Data was collected from 46 states with 5 states missing. On a state level, the mean
poverty rate was 12.352%. The median was 12.03% and the standard deviation was
2.7189. The state with the lowest poverty rate was New Hampshire with 7.6%. The
state with the highest poverty rate was Mississippi with 17.9%. The Pearson
Correlation shows there’s a moderate positive correlation at .438**. This means at a
state level, as the poverty rate goes us, so does the crime rate. This proves that the
hypothesis for these two variables was correct. The significance level between
poverty and crime is .001 which shows that this relationship is unlikely due to
chance. Figure 2 shows there is a positive linear relationship.
CRIME RATES 13
Education Funding
One of the variables that were tested with crime rates was Per Capita State
and Local Government Spending for Elementary and Secondary Education. Data was
collected from 46 states with 5 states missing. On a state level, the mean education
funding was $1,767.87. The median was $1,686.5 and the standard deviation was
365.4382. The state with the lowest educational funding was Idaho at $1,273. The
state with the highest educational funding was Alaska at $2,788. The Pearson
Correlation shows there’s a low negative correlation between educational funding
and crime at -.092. This means at a state level, funding elementary and secondary
school doesn’t deter crime. The hypothesis of these two variables was the more we
invest in schools, the less likely an individual is to commit a crime. This is not
necessarily correct on the state level. The significance level between the two
variables is .521 showing that there is a good chance that we can rely on this data.
Figure 3 shows there is no linear relationship.
Higher Educational Funding
One of the variables that were tested with crime rates was Per Capita State
and Local Government Spending for Higher Education. Data was collected from 46
states with 5 states missing. On a state level, the mean education funding was
$730.152. The median was $730.00 and the standard deviation was 187.3138. The
state with the lowest higher educational funding was District of Columbia at
CRIME RATES 14
$210.00. The state with the highest higher educational funding was Vermont at
$1,146.00. The Pearson Correlation shows there’s a low negative correlation
between higher educational funding and crime at -.248. This means at a state level,
funding higher education doesn’t deter crime. The hypothesis of these variable was
the more we invest in higher educational school, the less likely an individual is to
commit a crime. This isn’t necessarily correct on the state level. The significance
between the two variables is .079 showing there’s a possibility that this relationship
was due to chance. Figure 4 shows there’s no linear relationship.
Minimum Wage
One of the variables that were tested with crime rates was State Minimum
Wage Rates. Data was collected from 46 states with 5 states missing. On a state level,
the mean for minimum wage rates was $7.312. The median was $7.250 and the
standard deviation was .6450. The state with the lowest minimum wage was
Georgia at $5.20. The state with the highest minimum wage was Washington with
$8.60. The Pearson Correlation shows there’s a low positive correlation between
minim wage and crime at .033. This means at a state level, the minimum wage
doesn’t have an effect on crime. The hypothesis of these variables was the more
money people are making, the less likely they are to commit a crime. This isn’t
necessarily correct on the state level. The significance level between the two
variables is .827 showings there’s a good possibility we can’t rely on this data.
Figure 5 shows there’s no linear relationship.
CRIME RATES 15
Discussion
Educational Funding
Research that was conducted before the actual numbers were presented
show that the longer people stay in school, the less likely they are to commit a crime.
Motivans (2015) with the U.S Department of Justice shows this in his research.
Although this may be a fact, it doesn’t seem that funding schools on the elementary,
secondary, or collegiate level helps deter crime. Previous research shows that on an
individual level, people who go to school longer tend to make more money. Winter
(2005) shows in his research that with each year a person stays in school, their
likeliness to commit a crime goes down significantly. The reason for this is because
if the person makes money, there is no need to commit crimes that involve making
more money. This cuts down several possible crimes a person can commit. The
STATES data show that this information is wrong. The STATES data shows what
each state gives to elementary, secondary, and collegiate schools. The correlation
between funding elementary/secondary schools and crime is not significant. This
means that on the state level, the amount of money that a state spends on schools
does not have an effect on crime. It is fair to think that the more money a state
spends on schools, the more likely students will continue to stay in school. With that
said, the schools that spend the most money on schools should have less crime. The
data retrieved from the STATES database doesn’t support this. It goes to show that
educational funding shouldn’t be a primary focus when talking about possible
variables that increase crime rates. For the future, research on the topic of
happiness while at school could be beneficial. This would be able to see if
CRIME RATES 16
educational funding is making the students like school more. It’ll also see if the
money is being used in the right departments.
Poverty
People who are labeled as the lower class are more likely to commit crimes.
Previous research and the STATES data both support this fact. Winter (2005) agrees
with this statement because his research shows that between the year 1992 and
1997, several types of crimes in the United States decreased. During those same
years, the unemployment went up. Unemployment can cause people to fall under
that poverty line which leads them to a dangerous life. People who are desperate are
capable of anything. The STATES database shows that there’s a significant
correlation between poverty and crime. Although the state with the highest poverty
rate (Mississippi) does not have the highest crime rate, the trend is still there.
Stafford and Goodrum (2001) have a different perspective as to why people do not
commit crimes. They think it is because of the risk factor. If a person has more to
lose, it is more likely that they would not risk committing a crime and losing what
they have. A person who is unemployed and desperate doesn’t really have anything
to lose. In the future, if a state wants to deter crime, they should create more jobs
that allow people with high school diploma’s or lower to obtain. This is because
people who have little education are less likely to find a job. If more simple jobs
were made that almost anyone could qualify for, more people will have jobs despite
their educational attainment.
Family Assistance
CRIME RATES 17
States that don’t give families the financial assistance they need tend to have
more crime. Fording and Schram (2013) showed that during an eleven year time
period, assistance to families in need had gone down dramatically. While at the
same time, the property crime and violent crime rate had increased dramatically.
The STATES database supports Fording and Schram’s (2013) findings. The STATES
show that the correlation between family assistance and crime rates is significant.
There is a severe outlier state in Washington D.C. Their average monthly TANF
assistance per family is in the middle of the pack but their crime rates are
significantly higher than every other state. Further research on that state would be
recommended to see why that is. A possible study could be the cost of an apartment
in that state and how much the assistance covers that price. If a person is unable to
pay their bills with the assistance, then they might resort to crime.
Minimum Wage
The STATES data shows that minimum wage and crime rates do not have a
significant correlation. Roger (2014) would disagree with this because he believes
increasing minimum wages will also increase workers’ self-respect. Harlan (2015)
supports the findings because he said it’ll only hurt the small businesses. They
would have to pay their workers more which would involve more layoffs or going
out of business altogether. Washington D.C is one of the severe outliers in the
findings. Their minimum wage rates are one of the highest in the country, but so are
their crime rates. Most of the states are within ten cents of each other but all vary in
crime rates. For example, South Dakota and Florida have nearly the same minimum
wage rates. The difference between them is South Dakota has a crime rate of fewer
CRIME RATES 18
than 2,000 per 100,000 and Florida has a crime rate of almost 5,000 per 100,000.
This shows that minimum wage is not a significant factor when it comes to crime
rates. Finding what each states takes out of a person’s check in taxes is a good
variable to study in the future. This could have a large effect because if a person is
getting more money taken out of their paycheck, then the minimum wages are not
as close as they seem.
Conclusion
After conducting research and collecting the results, it’s safe to say that crime
rates are affected by certain variables. After testing educational funding, TANF funding,
poverty and minimum wages against crimes rates at the state level, it turns out that
poverty rates and TANF funding are the only two variables that have a significant
relationship to crime rates. This means that when discussing how to deter crime rates in
specific states, educational funding and minimum wages should not be in the
conversation. Changes that can be made to TANF funding is to increase the amount of
families that obtain these financial benefits. There are many families in America that
need assistance but are not getting it from the state. A solution to improve poverty rates
could include creating more jobs for people who don’t have much education. The job
market is a tough place for people who have degrees. It is even tough for people who do
not even have a high school diploma to find a job that will pay their bills. In order to
reduce crime rate, there has to be some more research involved. More variables need to
be tested with crime rates to see which ones have a significant relationship. This is
important to the state you may live in because crime rates continue to rise.
CRIME RATES 19
Reference List
CRIME RATES 20
Arum, R., (2002). School and communities: Ecological and institutional dimensions.
Annual Review of Sociology, 26, 395-418
Bentele, K.G., & Nicoli, L.T., (2012). Ending access as we know it: State welfare benefit
coverage in the TANF era. Social Service Review, 2, 223-268
Covin, L., (2012) Homeless, poverty, and incarceration: The criminalization of despair.
Journal of Forensic Psychology Practice , 5, 439-456
Crossman, A., (2015) About Education. Conflict theory. Retrieved February 23, 2015,
from www.sociology.about.com
Doyle, W.R., & Delaney, J.A., (2009). Higher education funding: The new normal.
Change, 4, 60-62.
Federal bureau of investigation. (2013). Crime in the United States 2013. Retrieved
February 10, 2015, from www.fbi.gov (gov)
Fording, R.C., & Schram, S.F., & Soss, J., (2013). Do welfare sanctions help or hurt the
poor? Estimating the casual effect of sanctioning on client earnings. Social Service
Review, 4,641-676.
Motivans, M. (2015). U.S department of justice: Federal justice statistics, 2011-
statistical tables. JBS Statistician.
CRIME RATES 21
Muennig, P., Caleyachetty, R., Rosen, Z., Horotzer, A. (2015). More money, fewer lives:
The cost of effectiveness of welfare reform in the United States. Research and Practice,
105, 324-328.
Perkins, C. (2003). Bureau of justice statistics special report: Weapon use and violent
crime. JBS Statistician.
Rock, P. (2012). Crime and control. In M. Maguire, R. Morgan, and R. Reiner (ed.), The
Oxford handbook of criminology (pp.44-45). Oxford, UK: Oxford University Press.
Roger, B., (2014) Justice at work: Minimum wage laws and social equality. Texas Law
Review, 6, 1543-1598.
Stafford, M.C., Goodrum, S. (2001). Concept of deterrence. In Patricia A. Adler, Peter
Adler, and Jay Corzine (Eds.), Encyclopedia of Criminology and Deviant Behavior, 77.
Michigan: Taylor & Francis.
Harlan, C., (2015) The Washington Post. The 25-cent raise: What life is like after a
minimum wage increase. Retrieved February 23, 2015, from www.washingtonpost.com
CRIME RATES 22
Thiele, M., & Shorette, K., & Bolzendahi. (2012) Returns to education: Exploring the
link between legislators’ public school degrees and state spending on higher education.
Sociological Inquiry, 2, 305-328 (scholarly)
Winter, H. (2008). The economics of crime. Oxon: Routledge.
CRIME RATES 23
Table 1: State Crime Rates by Various Variables (Pearson’s r-Coefficient)
Correlations
Crime Rate
per
100,000:
2008
Average
Monthly
TANF
Assistance
per family:
2007
Poverty
Rate: 2008
Per Capita
State and
Local Govt.
Spending
for Elem.
and
Second.
Education:
2007
Per Capita
State and
Local Govt.
Spending
for Higher
Education:
2007
State
Minimum
Wage
Rates:
2010
Crime Rate
per 100,000:
2008
Pearson
Correlation
1 -.361** .438** -.092 -.248 .033
Sig. (2-tailed) .009 .001 .521 .079 .827
N 51 51 51 51 51 46
Average
Monthly
TANF
Assistance
per family:
2007
Pearson
Correlation
-.361** 1 -.552** .389** .110 .472**
Sig. (2-tailed) .009 .000 .005 .441 .001
N 51 51 51 51 51 46
Poverty Rate:
2008
Pearson
Correlation
.438** -.552** 1 -.414** -.163 -.028
Sig. (2-tailed) .001 .000 .003 .255 .853
N 51 51 51 51 51 46
Per Capita
State and
Local Govt.
Spending for
Elem. and
Second.
Education:
2007
Pearson
Correlation
-.092 .389** -.414** 1 -.039 -.023
Sig. (2-tailed) .521 .005 .003 .785 .881
N 51 51 51 51 51 46
Per Capita
State and
Local Govt.
Spending for
Higher
Education:
2007
Pearson
Correlation
-.248 .110 -.163 -.039 1 -.079
Sig. (2-tailed) .079 .441 .255 .785 .603
N 51 51 51 51 51 46
State
Minimum
Wage Rates:
2010
Pearson
Correlation
.033 .472** -.028 -.023 -.079 1
Sig. (2-tailed) .827 .001 .853 .881 .603
N 46 46 46 46 46 46
**. Correlation is significant at the 0.01 level (2-tailed).
CRIME RATES 24
Figure 2: Scatter Plot of Crime Rates by Poverty
CRIME RATES 25
Figure 3: Scatter Plot of Crime Rate by Educational Funding
CRIME RATES 26
Figure 4: Scatter Plot of Crime Rate by Higher Educational Funding
CRIME RATES 27
Figure 5: Scatter Plot of Crime Rate by Minimum Wages

More Related Content

What's hot

Deviant behavior police brutality
Deviant behavior police brutalityDeviant behavior police brutality
Deviant behavior police brutalitygithure eliud
 
Is sexual violence related to Internet exposure?
Is sexual violence related to Internet exposure?Is sexual violence related to Internet exposure?
Is sexual violence related to Internet exposure?i2tic
 
Civility in America 2018 - Fast Facts Civility in America
Civility in America 2018 - Fast Facts Civility in AmericaCivility in America 2018 - Fast Facts Civility in America
Civility in America 2018 - Fast Facts Civility in AmericaWeber Shandwick
 
Blazing the Trail for Corruption
Blazing the Trail for CorruptionBlazing the Trail for Corruption
Blazing the Trail for CorruptionGerald Furnkranz
 
Analysis of the Factors Affecting Violent Crime Rates in the US
Analysis of the Factors Affecting Violent Crime Rates in the USAnalysis of the Factors Affecting Violent Crime Rates in the US
Analysis of the Factors Affecting Violent Crime Rates in the USDr. Amarjeet Singh
 
Age Discrimination - Des Moines Register.PDF
Age Discrimination - Des Moines Register.PDFAge Discrimination - Des Moines Register.PDF
Age Discrimination - Des Moines Register.PDFDaniel Khan
 
Bicker, Jab And More Deadlock: Washington’s Bipartisan Solution For Income In...
Bicker, Jab And More Deadlock: Washington’s Bipartisan Solution For Income In...Bicker, Jab And More Deadlock: Washington’s Bipartisan Solution For Income In...
Bicker, Jab And More Deadlock: Washington’s Bipartisan Solution For Income In...peacefulstem061
 
Business Magazine Style Report
Business Magazine Style ReportBusiness Magazine Style Report
Business Magazine Style ReportKaushik Rajan
 
Domestic violence essay sample
Domestic violence essay sampleDomestic violence essay sample
Domestic violence essay sampleMarie Fincher
 
Ain't Easy Being Green - Publisehd by San Diego CityBeat
Ain't Easy Being Green - Publisehd by San Diego CityBeatAin't Easy Being Green - Publisehd by San Diego CityBeat
Ain't Easy Being Green - Publisehd by San Diego CityBeatDana Sargent
 
STRYVE Juvenile Delinquency Program
STRYVE Juvenile Delinquency ProgramSTRYVE Juvenile Delinquency Program
STRYVE Juvenile Delinquency ProgramColton Robinson
 
Social Security & The Future of the Democratic Party
Social Security & The Future of the Democratic PartySocial Security & The Future of the Democratic Party
Social Security & The Future of the Democratic Partyourfuture
 

What's hot (20)

Deviant behavior police brutality
Deviant behavior police brutalityDeviant behavior police brutality
Deviant behavior police brutality
 
HRCU 648 Equal Payment Paper, Feldmanj
HRCU 648 Equal Payment Paper, FeldmanjHRCU 648 Equal Payment Paper, Feldmanj
HRCU 648 Equal Payment Paper, Feldmanj
 
Martijnetal2020 ccfp meta-analysisaivaev
Martijnetal2020 ccfp meta-analysisaivaevMartijnetal2020 ccfp meta-analysisaivaev
Martijnetal2020 ccfp meta-analysisaivaev
 
Is sexual violence related to Internet exposure?
Is sexual violence related to Internet exposure?Is sexual violence related to Internet exposure?
Is sexual violence related to Internet exposure?
 
Civility in America 2018 - Fast Facts Civility in America
Civility in America 2018 - Fast Facts Civility in AmericaCivility in America 2018 - Fast Facts Civility in America
Civility in America 2018 - Fast Facts Civility in America
 
Blazing the Trail for Corruption
Blazing the Trail for CorruptionBlazing the Trail for Corruption
Blazing the Trail for Corruption
 
Analysis of the Factors Affecting Violent Crime Rates in the US
Analysis of the Factors Affecting Violent Crime Rates in the USAnalysis of the Factors Affecting Violent Crime Rates in the US
Analysis of the Factors Affecting Violent Crime Rates in the US
 
Sexual harassment and gender inequality in the labor market
Sexual harassment and gender inequality in the labor marketSexual harassment and gender inequality in the labor market
Sexual harassment and gender inequality in the labor market
 
Age Discrimination - Des Moines Register.PDF
Age Discrimination - Des Moines Register.PDFAge Discrimination - Des Moines Register.PDF
Age Discrimination - Des Moines Register.PDF
 
Ellis 2015
Ellis 2015Ellis 2015
Ellis 2015
 
Bicker, Jab And More Deadlock: Washington’s Bipartisan Solution For Income In...
Bicker, Jab And More Deadlock: Washington’s Bipartisan Solution For Income In...Bicker, Jab And More Deadlock: Washington’s Bipartisan Solution For Income In...
Bicker, Jab And More Deadlock: Washington’s Bipartisan Solution For Income In...
 
Business Magazine Style Report
Business Magazine Style ReportBusiness Magazine Style Report
Business Magazine Style Report
 
Housing First: So what?
Housing First: So what?Housing First: So what?
Housing First: So what?
 
Domestic violence essay sample
Domestic violence essay sampleDomestic violence essay sample
Domestic violence essay sample
 
SLAPPs Occurrence
SLAPPs OccurrenceSLAPPs Occurrence
SLAPPs Occurrence
 
Violent Crime in America
Violent Crime in AmericaViolent Crime in America
Violent Crime in America
 
Ain't Easy Being Green - Publisehd by San Diego CityBeat
Ain't Easy Being Green - Publisehd by San Diego CityBeatAin't Easy Being Green - Publisehd by San Diego CityBeat
Ain't Easy Being Green - Publisehd by San Diego CityBeat
 
The Rich Get Richer
The Rich Get RicherThe Rich Get Richer
The Rich Get Richer
 
STRYVE Juvenile Delinquency Program
STRYVE Juvenile Delinquency ProgramSTRYVE Juvenile Delinquency Program
STRYVE Juvenile Delinquency Program
 
Social Security & The Future of the Democratic Party
Social Security & The Future of the Democratic PartySocial Security & The Future of the Democratic Party
Social Security & The Future of the Democratic Party
 

Similar to Literature Review by AColon

The Effects of Education on Crime.docx.PDF
The Effects of Education on Crime.docx.PDFThe Effects of Education on Crime.docx.PDF
The Effects of Education on Crime.docx.PDFJessica Riley
 
Luciana QuispeSOC 101Outline Part 2Hypothesis Less .docx
Luciana QuispeSOC 101Outline Part 2Hypothesis Less .docxLuciana QuispeSOC 101Outline Part 2Hypothesis Less .docx
Luciana QuispeSOC 101Outline Part 2Hypothesis Less .docxSHIVA101531
 
Marvin Peters - 4996 Final
Marvin Peters - 4996 FinalMarvin Peters - 4996 Final
Marvin Peters - 4996 FinalMarvin E. Peters
 
Running head assignmentassignment
Running head assignmentassignment                              Running head assignmentassignment
Running head assignmentassignment aryan532920
 
Writing project 2
Writing project 2Writing project 2
Writing project 2mes25384
 
TheHighSchoolDropout_LitReview
TheHighSchoolDropout_LitReviewTheHighSchoolDropout_LitReview
TheHighSchoolDropout_LitReviewJessica Riley
 
Speaking out against prejudice and discriminationBy Dave Finkeln.docx
Speaking out against prejudice and discriminationBy Dave Finkeln.docxSpeaking out against prejudice and discriminationBy Dave Finkeln.docx
Speaking out against prejudice and discriminationBy Dave Finkeln.docxwhitneyleman54422
 
Welfare Politics Final Paper_Brixey
Welfare Politics Final Paper_BrixeyWelfare Politics Final Paper_Brixey
Welfare Politics Final Paper_BrixeyEmily Brixey
 
paper #1 danaThe covid-19 global pandemic and the connection.docx
paper #1 danaThe covid-19 global pandemic and the connection.docxpaper #1 danaThe covid-19 global pandemic and the connection.docx
paper #1 danaThe covid-19 global pandemic and the connection.docxaman341480
 
! 1Unraveling Juvenile Delinquency in Ventura County, Calif.docx
!  1Unraveling Juvenile Delinquency in Ventura County, Calif.docx!  1Unraveling Juvenile Delinquency in Ventura County, Calif.docx
! 1Unraveling Juvenile Delinquency in Ventura County, Calif.docxmayank272369
 
Top of FormBy Karen A. RobertoCenter for Gerontology and Instit.docx
Top of FormBy Karen A. RobertoCenter for Gerontology and Instit.docxTop of FormBy Karen A. RobertoCenter for Gerontology and Instit.docx
Top of FormBy Karen A. RobertoCenter for Gerontology and Instit.docxjuliennehar
 
Poverty and it's relationship to child maltreatment Volume103
Poverty and it's relationship to child maltreatment Volume103Poverty and it's relationship to child maltreatment Volume103
Poverty and it's relationship to child maltreatment Volume103Tigrai Harris
 
Running head IDENTIFYING THE POLICY PROBLEM1IDENTIFYING THE .docx
Running head IDENTIFYING THE POLICY PROBLEM1IDENTIFYING THE .docxRunning head IDENTIFYING THE POLICY PROBLEM1IDENTIFYING THE .docx
Running head IDENTIFYING THE POLICY PROBLEM1IDENTIFYING THE .docxwlynn1
 
Running head IDENTIFYING THE POLICY PROBLEM1IDENTIFYING THE .docx
Running head IDENTIFYING THE POLICY PROBLEM1IDENTIFYING THE .docxRunning head IDENTIFYING THE POLICY PROBLEM1IDENTIFYING THE .docx
Running head IDENTIFYING THE POLICY PROBLEM1IDENTIFYING THE .docxjeanettehully
 

Similar to Literature Review by AColon (15)

The Effects of Education on Crime.docx.PDF
The Effects of Education on Crime.docx.PDFThe Effects of Education on Crime.docx.PDF
The Effects of Education on Crime.docx.PDF
 
Luciana QuispeSOC 101Outline Part 2Hypothesis Less .docx
Luciana QuispeSOC 101Outline Part 2Hypothesis Less .docxLuciana QuispeSOC 101Outline Part 2Hypothesis Less .docx
Luciana QuispeSOC 101Outline Part 2Hypothesis Less .docx
 
Marvin Peters - 4996 Final
Marvin Peters - 4996 FinalMarvin Peters - 4996 Final
Marvin Peters - 4996 Final
 
Running head assignmentassignment
Running head assignmentassignment                              Running head assignmentassignment
Running head assignmentassignment
 
Writing project 2
Writing project 2Writing project 2
Writing project 2
 
TheHighSchoolDropout_LitReview
TheHighSchoolDropout_LitReviewTheHighSchoolDropout_LitReview
TheHighSchoolDropout_LitReview
 
Speaking out against prejudice and discriminationBy Dave Finkeln.docx
Speaking out against prejudice and discriminationBy Dave Finkeln.docxSpeaking out against prejudice and discriminationBy Dave Finkeln.docx
Speaking out against prejudice and discriminationBy Dave Finkeln.docx
 
child abuse
child abusechild abuse
child abuse
 
Welfare Politics Final Paper_Brixey
Welfare Politics Final Paper_BrixeyWelfare Politics Final Paper_Brixey
Welfare Politics Final Paper_Brixey
 
paper #1 danaThe covid-19 global pandemic and the connection.docx
paper #1 danaThe covid-19 global pandemic and the connection.docxpaper #1 danaThe covid-19 global pandemic and the connection.docx
paper #1 danaThe covid-19 global pandemic and the connection.docx
 
! 1Unraveling Juvenile Delinquency in Ventura County, Calif.docx
!  1Unraveling Juvenile Delinquency in Ventura County, Calif.docx!  1Unraveling Juvenile Delinquency in Ventura County, Calif.docx
! 1Unraveling Juvenile Delinquency in Ventura County, Calif.docx
 
Top of FormBy Karen A. RobertoCenter for Gerontology and Instit.docx
Top of FormBy Karen A. RobertoCenter for Gerontology and Instit.docxTop of FormBy Karen A. RobertoCenter for Gerontology and Instit.docx
Top of FormBy Karen A. RobertoCenter for Gerontology and Instit.docx
 
Poverty and it's relationship to child maltreatment Volume103
Poverty and it's relationship to child maltreatment Volume103Poverty and it's relationship to child maltreatment Volume103
Poverty and it's relationship to child maltreatment Volume103
 
Running head IDENTIFYING THE POLICY PROBLEM1IDENTIFYING THE .docx
Running head IDENTIFYING THE POLICY PROBLEM1IDENTIFYING THE .docxRunning head IDENTIFYING THE POLICY PROBLEM1IDENTIFYING THE .docx
Running head IDENTIFYING THE POLICY PROBLEM1IDENTIFYING THE .docx
 
Running head IDENTIFYING THE POLICY PROBLEM1IDENTIFYING THE .docx
Running head IDENTIFYING THE POLICY PROBLEM1IDENTIFYING THE .docxRunning head IDENTIFYING THE POLICY PROBLEM1IDENTIFYING THE .docx
Running head IDENTIFYING THE POLICY PROBLEM1IDENTIFYING THE .docx
 

Literature Review by AColon

  • 1. Running head: CRIME RATES 1 Is Crime Rate Dependent on Money and Education? Alejandro Colon Western New England University CJ/SO 301 Written in May 2015 Abstract
  • 2. CRIME RATES 2 This paper will discuss crime rates and how they are effected by different variables. The variables that will be tested against crime rates are poverty, minimum wage, educational funding, higher educational funding, and TANF assistance. All of the variables used in this research project at scaled at the state level. In order to find the results, Pearson correlation was used to determine if there was a significance between crime rates and the 4 independent variables. The results prove that only 2 of the 5 relationships were significant while the other 3 were not. The research shows crime rates can be deterred if the focus is in the correct areas. Crime: Is it Explained by Lack of Money or Lack of Education?
  • 3. CRIME RATES 3 Crimes are actions that happen every day and they’re impossible to stop completely. This problem seems to be centralized around the Karl Marx’s Conflict Theory. According to Crossman (2015), Marx saw society that was broken into groups that compete against each other for social and economic resources. He believes the power is in the possession of those with the greatest political, economical, and social resources. The focus with regards to violent crime is the economic aspect of the theory. Violent crime can also be based on the Anomie Theory. This theory was first developed in 1893 by Emile Durkhein this is potentially a reason why crimes are committed. The theory deals with not knowing how to respond when something catastrophic happens to us. Losing your job is a prime example of this. Rock (2012) believes Anomie Theory is tied to the belief that since the disciplines and authority of society are so flawed that they offer few restraints or moral direction. According to sociologists, these two theories both play a part into the reasons why violent crime is committed. Although violent crimes are on the decline in America, it is still a major problem and needs to be addressed. According to the Federal Bureau of Investigation, the Uniform Crime Report shows an increase in violent crime from 1.33M in 2009 to 1.60M in 2013. Understanding why these crimes are committed is extremely hard to do on a person-by- person level. It is easier and more practical to understand it on a broader scale. Funding schools and people in need have shown improvement in the violent crime statistics. According to the table that Motivans (2015) presents, the higher the education level you have, the less likely you are to commit a crime. Over 40% of crimes between October 1, 2010 and September 30, 2011 were committed by people who didn’t have a high school diploma, while only 23% were committed by people who did have a diploma. When
  • 4. CRIME RATES 4 people have little or no money, they are more vulnerable to committing crimes. Marx’s Conflict Theory defends this because he believes the people with a better economic status are the ones in control with their actions. Educational Funding Winter (2005) claims that more education does reduce the crime rate, as one extra year of high school has a significant impact on the probability of being arrested. Winter (2005) believes it is because people with more education are more likely to get a job, or higher paying jobs. This will steer a person away from committing a crime that involves money. People who stay in school for the duration of high school and even further, either enjoy the experience or understand the importance of education. Thiele, Shorette, and Bolzendahl (2012) claim that despite the increase in students, state support for higher education has declined in recent years. Doyle and Delaney (2009) claim that when the economy is bad, legislators target higher education for larger budget cuts than other state services. The reason for this is because colleges and universities can collect revenue from tuition and also, college students are not considered the states’ neediest population (Doyle and Delaney, 2009). Thiele et al. (2012) believe state legislators are the most influential actors concerning policy change because they must consider the costs and benefits likely to derive from distributing scarce resources to public higher education. Although legislators do not consider college students to be the neediest population, they are the population that commits the least amount of crimes. Motivans (2015) shows us that people who experienced some college accounted for less than 12% of crimes committed between October 1, 2010 and September 30, 2011, and less than 5% for people who graduated college. Arum (2002) argues that your economic value relies more
  • 5. CRIME RATES 5 on cognitive skills you learn at school rather than at home. Arum (2002) acknowledges that some researchers believe school does not help at all if you’re poorly socialized. The counter to this is that schools and institution can serve as a turning point in their life (Arum, 2002). If an individual has a rough life at home, school can be a place where they can get away from it. This can cause the student to see life in a more positive perspective rather than what they are used to seeing at home. Arum agrees that funding schools will create a more likely chance students will actually go because they’ll enjoy it more. The funds can go to certain programs or events that will make school more enjoyable for the students. Unemployment Unemployment can cause criminal rates to rise. Winter (2005) claims that between the year 1992 and 1997 in the United States, the rate of auto theft fell by 15 percent, the rate of robbery fell by 30 percent, and the rate of larceny fell bet. While at the same time, the unemployment rate fell by 2.5 percent. Unemployment can cause an increase of population who are homeless. According to Covin (2012), over the last few decades, there has been a large increase in the arrests of homeless people. This turns into a cycle because people who come out of prison tend to have low incomes, which can cause them to be homeless again when they are released (Covin, 2002). This refers to the concept of deterrence. Stafford and Goodrum (2001) explain that people are deterred from committing a crime because they perceive some risk of suffering a punishment as a response to the crime. If a person does not have a home or a job, chances are they are not scared to get punished because they don’t have anything to lose. Family Assistance
  • 6. CRIME RATES 6 Assistance to families in need across the nation has been declining. This is not because less people need assistance, but because less assistance is given. According to Fording, Schram and Soss (2013), between 1994 and 2005, the percentage of families eligible for TANF actually receiving TANF decreased from 84 percent to 40 percent (Fording et al., 2013). According to the Federal Bureau of Investigation (2013), in 1995, the number of violent crimes committed was 796,250 and the number of property crimes was 2.1M. In 2005, those numbers increased to 1.3M for violent crimes and 10.2M for property crimes. The number of families living in extreme poverty increased from 1.46M in 1996 to 2.4M in 2011. Muennig, Caleyachetty, Rosen, and Korotzer (2015) mention TANF may results in people becoming dependent on it, therefore may serve as an incentive to stay out of work. While this may be a valid argument, Fording et al. (2013) explain that TANF are creating more sanctions for those who do not comply. These sanctions include more requirements, narrower exemption criteria, an expanded list of behaviors that can possibly results in sanctions, and a stronger penalty for noncompliance (Fording, et al., 2013). Minimum Wage Minimum wage has been a major topic in America for the past couple of years. The reason for this is because there are many ripple effects. Rogers (2014) agrees with increasing the price of minimum wage because it will enhance low-wage workers’ self- respect. Harlan (2015) included in his article, it’ll only hurt small businesses and therefore result in more unemployed workers. More unemployed workers means more poverty and homeless people. Rogers (2014) counters this argument and focuses on the particular aspect more than the general aspect. He provides an example that involves a
  • 7. CRIME RATES 7 janitor whose pay was increased by almost $2. He states that even though he and his coworkers still do not make a lot of money, at least now with the living wage, they can hold their heads up high (Rogers, 2014). The question is, what does increasing minimum wage have to do with crime? Once again it refers back to the deterrence theory. If Rogers (2014) is correct in his argument, then people will have more to lose because they are getting paid money and therefore feel more valued in society. If Harlan (2015) is correct, than more people will end up losing jobs because the owners will not be able to pay their workers and still afford to run the business. This will result in more poverty which refers to what Covin (2002) said about homeless people being targets for crime. The studies presented discuss just a few variables that may have an effect on crime in the United States. These studies involved people who lack education and/or money so they are forced to engage in criminal behavior. Although people who have money and/or education still commit crimes, there seems to be a decrease in crime rates as there is an increase in money and educational level. Funding these types of problems will help resolve it and therefore decrease crime rates. This paper will research variables that cause people to commit crimes in the United States. One factor will include poverty that involves the absence of a job, TANF for those who need assistance, and minimum wage laws. In addition to these, educational levels, in relation to crime, will also be evaluated. The goal is to examine whether funding the appropriate groups will result in a lower crime rate. This paper will use these variables to show that more money and/or education results in a lower crime rate. Hypothesis
  • 8. CRIME RATES 8 Null Hypothesis- Funding education will not have an effect on crime rates Alt. Hypothesis- Funding education will decrease the amount on crime rates. Null Hypothesis- Funding families will not have an effect on crime rates Alt. Hypothesis- Funding families in need will decrease crime rates Null Hypothesis- Increasing minimum wage will not have an effect on crime rates Alt. Hypothesis- Increasing minimum wage will decrease crime rates Null Hypothesis- Lower unemployment rates will not have an effect on crime rates Alt. Hypothesis- Lower unemployment rates will decrease crime rates. Methods The Problem Variables like educational funding, unemployment, family assistance, and minimum wage rates are important to research when looking at what causes crime rates to go up or down. Research in the past shows that a lack of any or all of these variables in a community will increase the crime rate in that area. When focusing on variables like this, it is important to take all of them into consideration when you examine the results of the crime rates. Many researchers have studied educational funding, unemployment, family assistance, and minimum wage and related them to crime rates individually. This type of research will gather all of the individual variables and put them into one research
  • 9. CRIME RATES 9 topic. The research will either agree or disagree with previous researchers and their findings. Data Source and Sample Since there is not any funding to the research, the results will be based off of secondary analysis. This is actually more convenient since the results must be collected within a semester. Because the data has already been collected there’s no time or money wasted trying to collect the data. The data that will be used will be from the States Data Files of 2010 (STATES10). This data was provided at the beginning of the semester in the textbook, Analysis with SPSS: A First Course in Applied Statistics (Sweet & Grace- Martin 2012). In this data set, each case represents one of the fifty states. There are fifty- one respondents for each state. Hypotheses The research deals with whether crime is directly related to funding of education and jobs. There are many possible hypotheses that this research project will address. The hypotheses this research will test are: H◦¹) States funding for education will not have an effect on crime rates. Ha 1) States funding for education will have lower crime rates. H◦ 2) States funding for TANF will not have an effect on crime rates. Ha 2) States funding for TANF will have lower crime rates. H◦ 3) States poverty rate will not have an effect on crime rates. Ha 3) States poverty rate will have lower crime rates. H◦ 4) States minimum wages will not have an effect on crime rates. Ha 4 ) States minimum wages will have lower crime rates.
  • 10. CRIME RATES 10 Variables: Dependent Variables: There is only one dependent variable in this study. The variable CRS31: Crime Rate per 100,000: 2008 will be tested against several independent variables to see if there is a relationship. Independent Variables: There are several independent variables that will be tested against CRS31. All of the independent variable that will be listed is a scale measure. PVS546: Average Monthly TANF Assistance per Family: 2007, PVS519: Poverty Rate: 2008, EDS140: Per Capita State and Local Govt. Spending for Elem. and Second. Education: 2007, EDS144: Per Capita State and Local Govt. Spending for Higher Education: 2007, and EMS170: State Minimum Wage Rates: 2010. Procedures The general method used for this research will be Pearson correlation. This was picked as method to use because it gives us the direct correlation that each variable has with crime rates. Pearson correlation will present us will the correlation, significance (2- tailed) and the amount of subjects that were involved in the study. In this case, we are talking about states. The first step to determine the hypotheses is to use Pearson correlation to test the association and significance level between poverty rates and crimes rates. By doing this, the Pearson table will show us whether or not these variables are statistically significant at a state level. Also, it will tell us if the correlation is positive or negative. The second step to determine the hypotheses is to use Pearson correlation to test the association and significance level between minimum wage and crimes rates. By doing
  • 11. CRIME RATES 11 this, the Pearson table will show us whether or not these variables are statistically significant at a state level. Also, it will tell us if the correlation is positive or negative. The third step to determine the hypotheses is to use Pearson correlation to test the association and significance level between educational funding and crimes rates. By doing this, the Pearson table will show us whether or not these variables are statistically significant at a state level. Also, it will tell us if the correlation is positive or negative. The fourth step to determine the hypotheses is to use Pearson correlation to test the association and significance level between higher educational funding and crimes rates. By doing this, the Pearson table will show us whether or not these variables are statistically significant at a state level. Also, it will tell us if the correlation is positive or negative. The fifth step to determine the hypotheses is to use Pearson correlation to test the association and significance level between funding for TANF and crimes rates. By doing this, the Pearson table will show us whether or not these variables are statistically significant at a state level. Also, it will tell us if the correlation is positive or negative. Findings Crime Rate The dependent variable for this study is Crime Rate. Data was collected from 46 states with 5 states missing. On a state level, the mean Crime Rate per 100,000 is 3461.537. The median is 3440.2 and the standard deviation is 897.9646. The state with the highest crime rate is District of Columbia with 6542.3. The state with the lowest crime rate is South Dakota with 1847. TANF Assistance
  • 12. CRIME RATES 12 One of the variables that were tested with crime rates was Average Monthly TANF Assistance per family. Data was collected from 46 states with 5 states missing. On a state level, the mean monthly TANF assistance per family was $337.889. The median was $323.545 and the standard deviation was 106.3606. The state with the lower family assistance was Georgia with $151.3. The state with the highest family assistance was Alaska with $601.3. The Pearson Correlation shows there’s a moderate negative correlation of -.361**. This means that crime rates are higher as TANF assistance goes down. This proves that the hypothesis for these two variables was correct. The significance level between crime and family assistance is .009 which shows that this relationship is unlikely due to chance. Figure 1 shows that there is a negative linear relationship. Poverty One of the variables that were tested with crime rates was Poverty Rates. Data was collected from 46 states with 5 states missing. On a state level, the mean poverty rate was 12.352%. The median was 12.03% and the standard deviation was 2.7189. The state with the lowest poverty rate was New Hampshire with 7.6%. The state with the highest poverty rate was Mississippi with 17.9%. The Pearson Correlation shows there’s a moderate positive correlation at .438**. This means at a state level, as the poverty rate goes us, so does the crime rate. This proves that the hypothesis for these two variables was correct. The significance level between poverty and crime is .001 which shows that this relationship is unlikely due to chance. Figure 2 shows there is a positive linear relationship.
  • 13. CRIME RATES 13 Education Funding One of the variables that were tested with crime rates was Per Capita State and Local Government Spending for Elementary and Secondary Education. Data was collected from 46 states with 5 states missing. On a state level, the mean education funding was $1,767.87. The median was $1,686.5 and the standard deviation was 365.4382. The state with the lowest educational funding was Idaho at $1,273. The state with the highest educational funding was Alaska at $2,788. The Pearson Correlation shows there’s a low negative correlation between educational funding and crime at -.092. This means at a state level, funding elementary and secondary school doesn’t deter crime. The hypothesis of these two variables was the more we invest in schools, the less likely an individual is to commit a crime. This is not necessarily correct on the state level. The significance level between the two variables is .521 showing that there is a good chance that we can rely on this data. Figure 3 shows there is no linear relationship. Higher Educational Funding One of the variables that were tested with crime rates was Per Capita State and Local Government Spending for Higher Education. Data was collected from 46 states with 5 states missing. On a state level, the mean education funding was $730.152. The median was $730.00 and the standard deviation was 187.3138. The state with the lowest higher educational funding was District of Columbia at
  • 14. CRIME RATES 14 $210.00. The state with the highest higher educational funding was Vermont at $1,146.00. The Pearson Correlation shows there’s a low negative correlation between higher educational funding and crime at -.248. This means at a state level, funding higher education doesn’t deter crime. The hypothesis of these variable was the more we invest in higher educational school, the less likely an individual is to commit a crime. This isn’t necessarily correct on the state level. The significance between the two variables is .079 showing there’s a possibility that this relationship was due to chance. Figure 4 shows there’s no linear relationship. Minimum Wage One of the variables that were tested with crime rates was State Minimum Wage Rates. Data was collected from 46 states with 5 states missing. On a state level, the mean for minimum wage rates was $7.312. The median was $7.250 and the standard deviation was .6450. The state with the lowest minimum wage was Georgia at $5.20. The state with the highest minimum wage was Washington with $8.60. The Pearson Correlation shows there’s a low positive correlation between minim wage and crime at .033. This means at a state level, the minimum wage doesn’t have an effect on crime. The hypothesis of these variables was the more money people are making, the less likely they are to commit a crime. This isn’t necessarily correct on the state level. The significance level between the two variables is .827 showings there’s a good possibility we can’t rely on this data. Figure 5 shows there’s no linear relationship.
  • 15. CRIME RATES 15 Discussion Educational Funding Research that was conducted before the actual numbers were presented show that the longer people stay in school, the less likely they are to commit a crime. Motivans (2015) with the U.S Department of Justice shows this in his research. Although this may be a fact, it doesn’t seem that funding schools on the elementary, secondary, or collegiate level helps deter crime. Previous research shows that on an individual level, people who go to school longer tend to make more money. Winter (2005) shows in his research that with each year a person stays in school, their likeliness to commit a crime goes down significantly. The reason for this is because if the person makes money, there is no need to commit crimes that involve making more money. This cuts down several possible crimes a person can commit. The STATES data show that this information is wrong. The STATES data shows what each state gives to elementary, secondary, and collegiate schools. The correlation between funding elementary/secondary schools and crime is not significant. This means that on the state level, the amount of money that a state spends on schools does not have an effect on crime. It is fair to think that the more money a state spends on schools, the more likely students will continue to stay in school. With that said, the schools that spend the most money on schools should have less crime. The data retrieved from the STATES database doesn’t support this. It goes to show that educational funding shouldn’t be a primary focus when talking about possible variables that increase crime rates. For the future, research on the topic of happiness while at school could be beneficial. This would be able to see if
  • 16. CRIME RATES 16 educational funding is making the students like school more. It’ll also see if the money is being used in the right departments. Poverty People who are labeled as the lower class are more likely to commit crimes. Previous research and the STATES data both support this fact. Winter (2005) agrees with this statement because his research shows that between the year 1992 and 1997, several types of crimes in the United States decreased. During those same years, the unemployment went up. Unemployment can cause people to fall under that poverty line which leads them to a dangerous life. People who are desperate are capable of anything. The STATES database shows that there’s a significant correlation between poverty and crime. Although the state with the highest poverty rate (Mississippi) does not have the highest crime rate, the trend is still there. Stafford and Goodrum (2001) have a different perspective as to why people do not commit crimes. They think it is because of the risk factor. If a person has more to lose, it is more likely that they would not risk committing a crime and losing what they have. A person who is unemployed and desperate doesn’t really have anything to lose. In the future, if a state wants to deter crime, they should create more jobs that allow people with high school diploma’s or lower to obtain. This is because people who have little education are less likely to find a job. If more simple jobs were made that almost anyone could qualify for, more people will have jobs despite their educational attainment. Family Assistance
  • 17. CRIME RATES 17 States that don’t give families the financial assistance they need tend to have more crime. Fording and Schram (2013) showed that during an eleven year time period, assistance to families in need had gone down dramatically. While at the same time, the property crime and violent crime rate had increased dramatically. The STATES database supports Fording and Schram’s (2013) findings. The STATES show that the correlation between family assistance and crime rates is significant. There is a severe outlier state in Washington D.C. Their average monthly TANF assistance per family is in the middle of the pack but their crime rates are significantly higher than every other state. Further research on that state would be recommended to see why that is. A possible study could be the cost of an apartment in that state and how much the assistance covers that price. If a person is unable to pay their bills with the assistance, then they might resort to crime. Minimum Wage The STATES data shows that minimum wage and crime rates do not have a significant correlation. Roger (2014) would disagree with this because he believes increasing minimum wages will also increase workers’ self-respect. Harlan (2015) supports the findings because he said it’ll only hurt the small businesses. They would have to pay their workers more which would involve more layoffs or going out of business altogether. Washington D.C is one of the severe outliers in the findings. Their minimum wage rates are one of the highest in the country, but so are their crime rates. Most of the states are within ten cents of each other but all vary in crime rates. For example, South Dakota and Florida have nearly the same minimum wage rates. The difference between them is South Dakota has a crime rate of fewer
  • 18. CRIME RATES 18 than 2,000 per 100,000 and Florida has a crime rate of almost 5,000 per 100,000. This shows that minimum wage is not a significant factor when it comes to crime rates. Finding what each states takes out of a person’s check in taxes is a good variable to study in the future. This could have a large effect because if a person is getting more money taken out of their paycheck, then the minimum wages are not as close as they seem. Conclusion After conducting research and collecting the results, it’s safe to say that crime rates are affected by certain variables. After testing educational funding, TANF funding, poverty and minimum wages against crimes rates at the state level, it turns out that poverty rates and TANF funding are the only two variables that have a significant relationship to crime rates. This means that when discussing how to deter crime rates in specific states, educational funding and minimum wages should not be in the conversation. Changes that can be made to TANF funding is to increase the amount of families that obtain these financial benefits. There are many families in America that need assistance but are not getting it from the state. A solution to improve poverty rates could include creating more jobs for people who don’t have much education. The job market is a tough place for people who have degrees. It is even tough for people who do not even have a high school diploma to find a job that will pay their bills. In order to reduce crime rate, there has to be some more research involved. More variables need to be tested with crime rates to see which ones have a significant relationship. This is important to the state you may live in because crime rates continue to rise.
  • 20. CRIME RATES 20 Arum, R., (2002). School and communities: Ecological and institutional dimensions. Annual Review of Sociology, 26, 395-418 Bentele, K.G., & Nicoli, L.T., (2012). Ending access as we know it: State welfare benefit coverage in the TANF era. Social Service Review, 2, 223-268 Covin, L., (2012) Homeless, poverty, and incarceration: The criminalization of despair. Journal of Forensic Psychology Practice , 5, 439-456 Crossman, A., (2015) About Education. Conflict theory. Retrieved February 23, 2015, from www.sociology.about.com Doyle, W.R., & Delaney, J.A., (2009). Higher education funding: The new normal. Change, 4, 60-62. Federal bureau of investigation. (2013). Crime in the United States 2013. Retrieved February 10, 2015, from www.fbi.gov (gov) Fording, R.C., & Schram, S.F., & Soss, J., (2013). Do welfare sanctions help or hurt the poor? Estimating the casual effect of sanctioning on client earnings. Social Service Review, 4,641-676. Motivans, M. (2015). U.S department of justice: Federal justice statistics, 2011- statistical tables. JBS Statistician.
  • 21. CRIME RATES 21 Muennig, P., Caleyachetty, R., Rosen, Z., Horotzer, A. (2015). More money, fewer lives: The cost of effectiveness of welfare reform in the United States. Research and Practice, 105, 324-328. Perkins, C. (2003). Bureau of justice statistics special report: Weapon use and violent crime. JBS Statistician. Rock, P. (2012). Crime and control. In M. Maguire, R. Morgan, and R. Reiner (ed.), The Oxford handbook of criminology (pp.44-45). Oxford, UK: Oxford University Press. Roger, B., (2014) Justice at work: Minimum wage laws and social equality. Texas Law Review, 6, 1543-1598. Stafford, M.C., Goodrum, S. (2001). Concept of deterrence. In Patricia A. Adler, Peter Adler, and Jay Corzine (Eds.), Encyclopedia of Criminology and Deviant Behavior, 77. Michigan: Taylor & Francis. Harlan, C., (2015) The Washington Post. The 25-cent raise: What life is like after a minimum wage increase. Retrieved February 23, 2015, from www.washingtonpost.com
  • 22. CRIME RATES 22 Thiele, M., & Shorette, K., & Bolzendahi. (2012) Returns to education: Exploring the link between legislators’ public school degrees and state spending on higher education. Sociological Inquiry, 2, 305-328 (scholarly) Winter, H. (2008). The economics of crime. Oxon: Routledge.
  • 23. CRIME RATES 23 Table 1: State Crime Rates by Various Variables (Pearson’s r-Coefficient) Correlations Crime Rate per 100,000: 2008 Average Monthly TANF Assistance per family: 2007 Poverty Rate: 2008 Per Capita State and Local Govt. Spending for Elem. and Second. Education: 2007 Per Capita State and Local Govt. Spending for Higher Education: 2007 State Minimum Wage Rates: 2010 Crime Rate per 100,000: 2008 Pearson Correlation 1 -.361** .438** -.092 -.248 .033 Sig. (2-tailed) .009 .001 .521 .079 .827 N 51 51 51 51 51 46 Average Monthly TANF Assistance per family: 2007 Pearson Correlation -.361** 1 -.552** .389** .110 .472** Sig. (2-tailed) .009 .000 .005 .441 .001 N 51 51 51 51 51 46 Poverty Rate: 2008 Pearson Correlation .438** -.552** 1 -.414** -.163 -.028 Sig. (2-tailed) .001 .000 .003 .255 .853 N 51 51 51 51 51 46 Per Capita State and Local Govt. Spending for Elem. and Second. Education: 2007 Pearson Correlation -.092 .389** -.414** 1 -.039 -.023 Sig. (2-tailed) .521 .005 .003 .785 .881 N 51 51 51 51 51 46 Per Capita State and Local Govt. Spending for Higher Education: 2007 Pearson Correlation -.248 .110 -.163 -.039 1 -.079 Sig. (2-tailed) .079 .441 .255 .785 .603 N 51 51 51 51 51 46 State Minimum Wage Rates: 2010 Pearson Correlation .033 .472** -.028 -.023 -.079 1 Sig. (2-tailed) .827 .001 .853 .881 .603 N 46 46 46 46 46 46 **. Correlation is significant at the 0.01 level (2-tailed).
  • 24. CRIME RATES 24 Figure 2: Scatter Plot of Crime Rates by Poverty
  • 25. CRIME RATES 25 Figure 3: Scatter Plot of Crime Rate by Educational Funding
  • 26. CRIME RATES 26 Figure 4: Scatter Plot of Crime Rate by Higher Educational Funding
  • 27. CRIME RATES 27 Figure 5: Scatter Plot of Crime Rate by Minimum Wages