首 届 中国 e B P F 研 讨 会
www.ebpftravel.com
框架开发经验分享
杨润青@华为
Linux Tracing System浅析
&
2.
首 届 中国 e B P F 研 讨 会
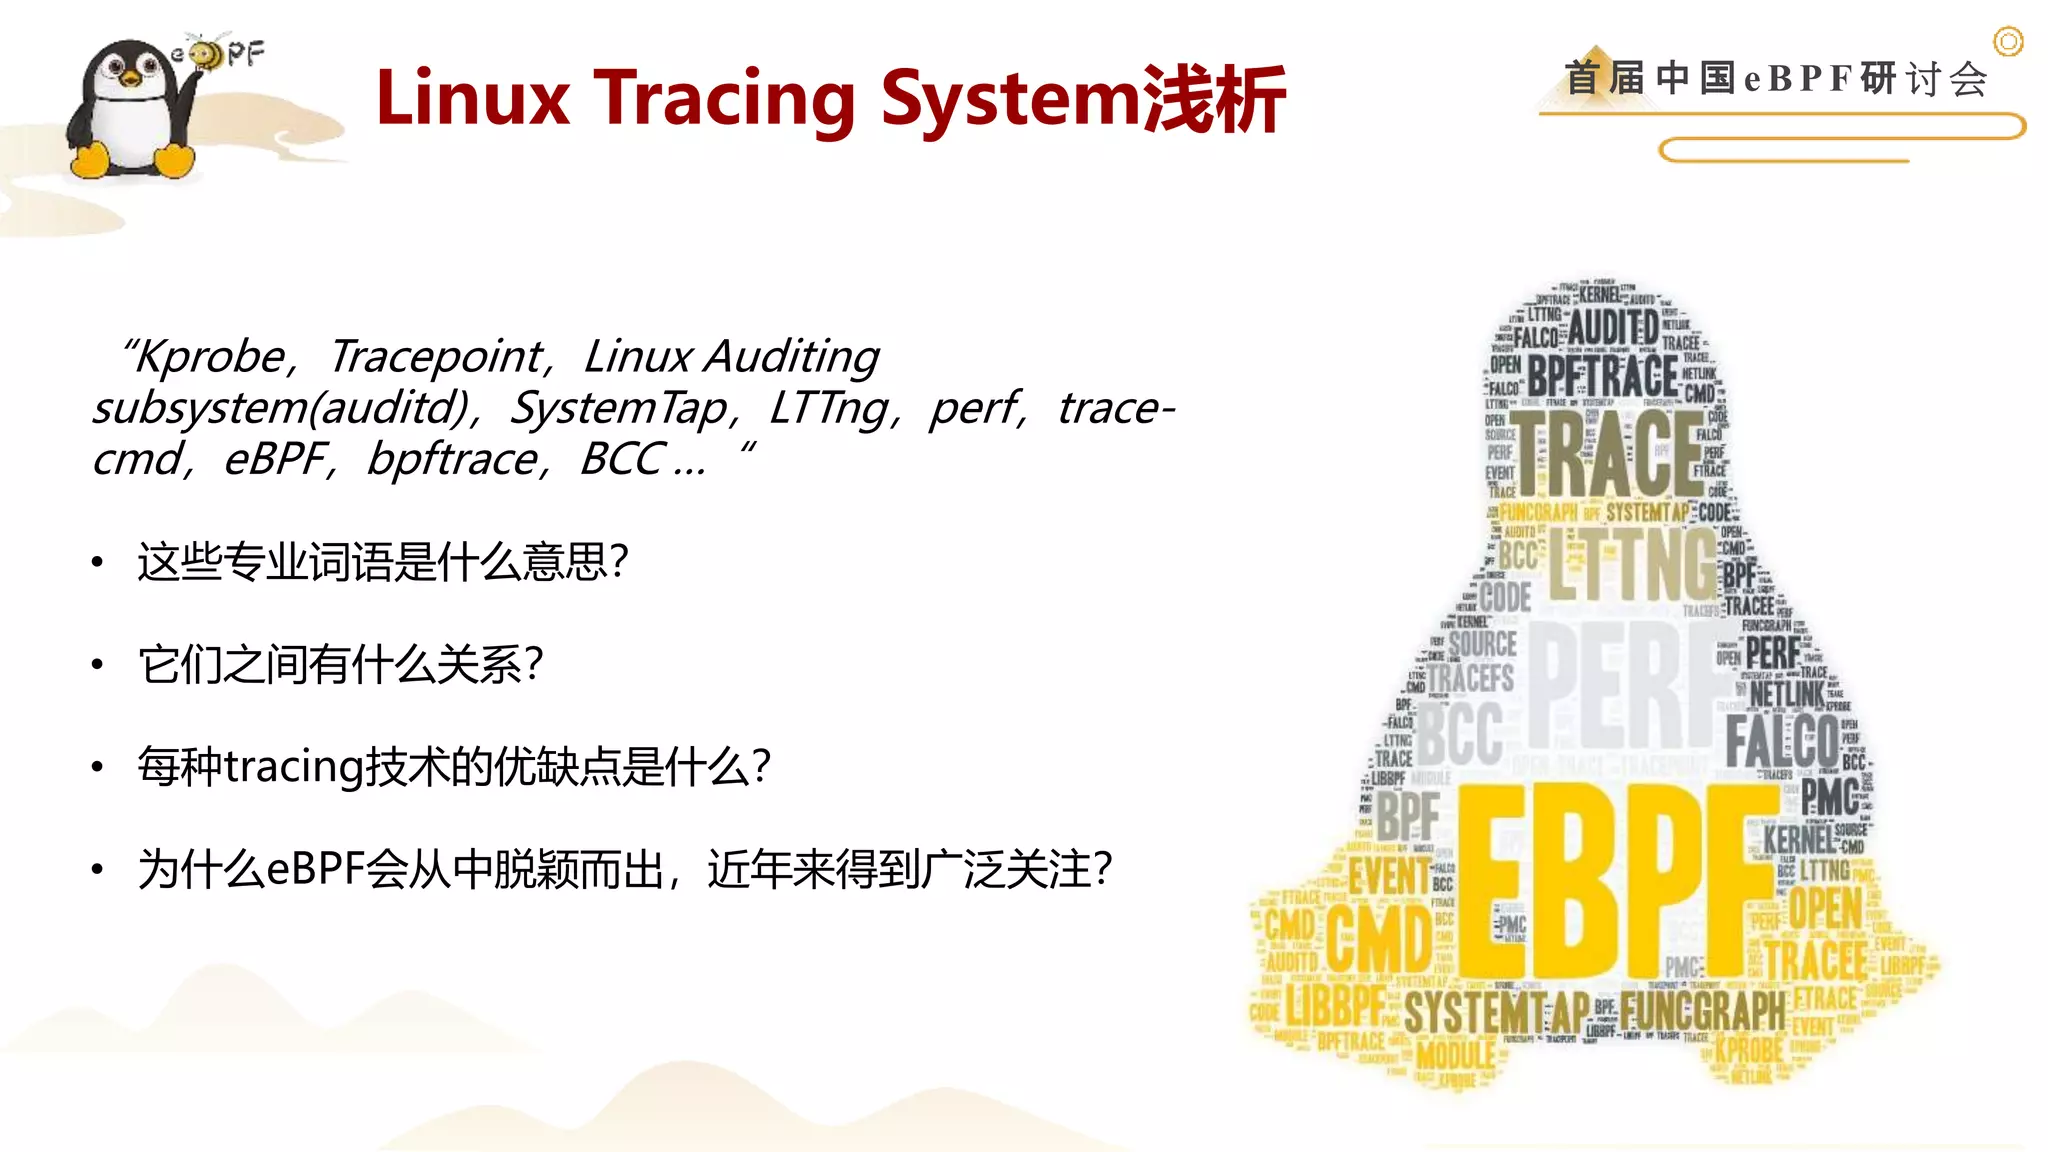
Linux Tracing System浅析
“Kprobe,Tracepoint,Linux Auditing
subsystem(auditd),SystemTap,LTTng,perf,trace-
cmd,eBPF,bpftrace,BCC …“
• 这些专业词语是什么意思?
• 它们之间有什么关系?
• 每种tracing技术的优缺点是什么?
• 为什么eBPF会从中脱颖而出,近年来得到广泛关注?
3.
首 届 中国 e B P F 研 讨 会
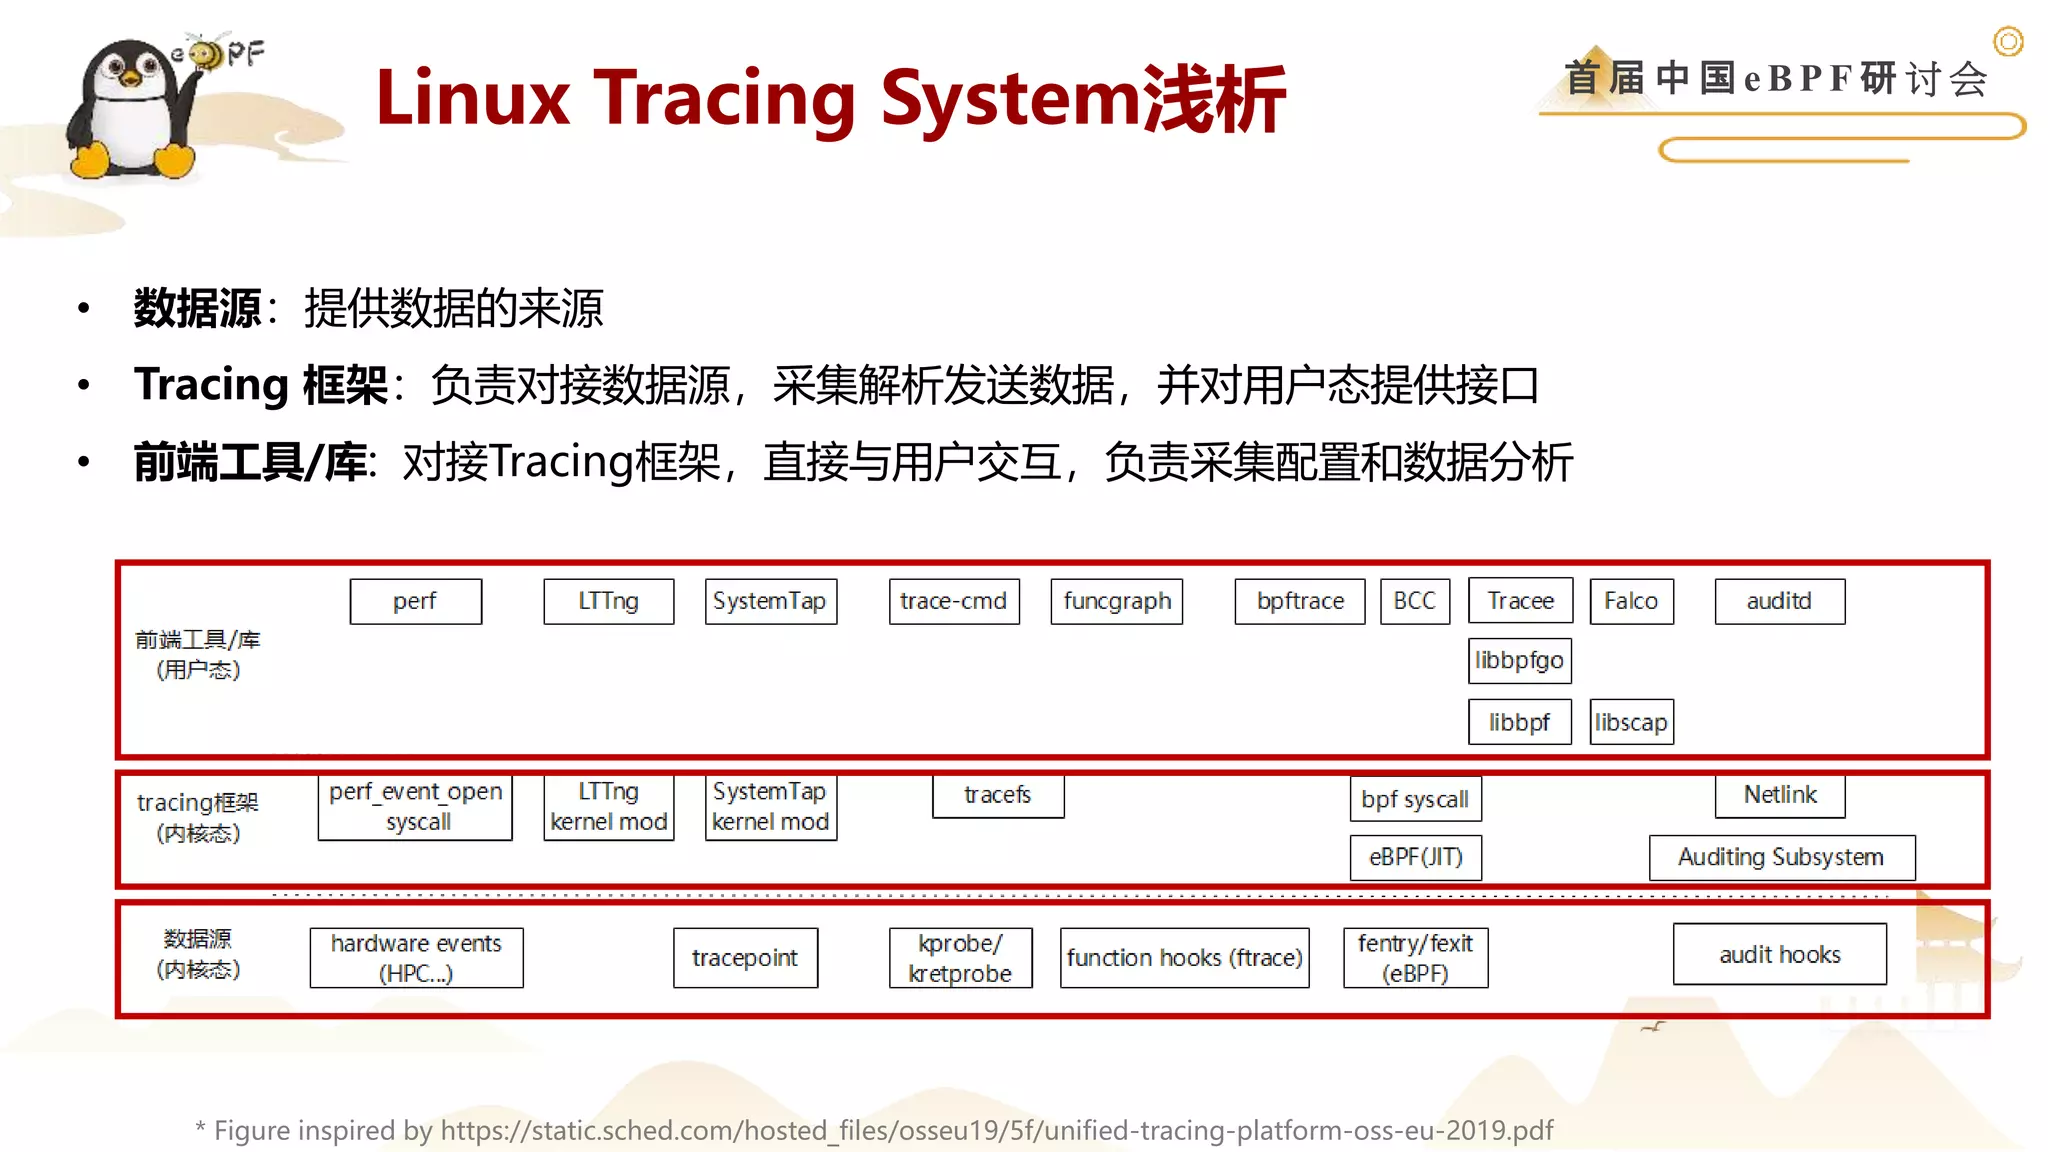
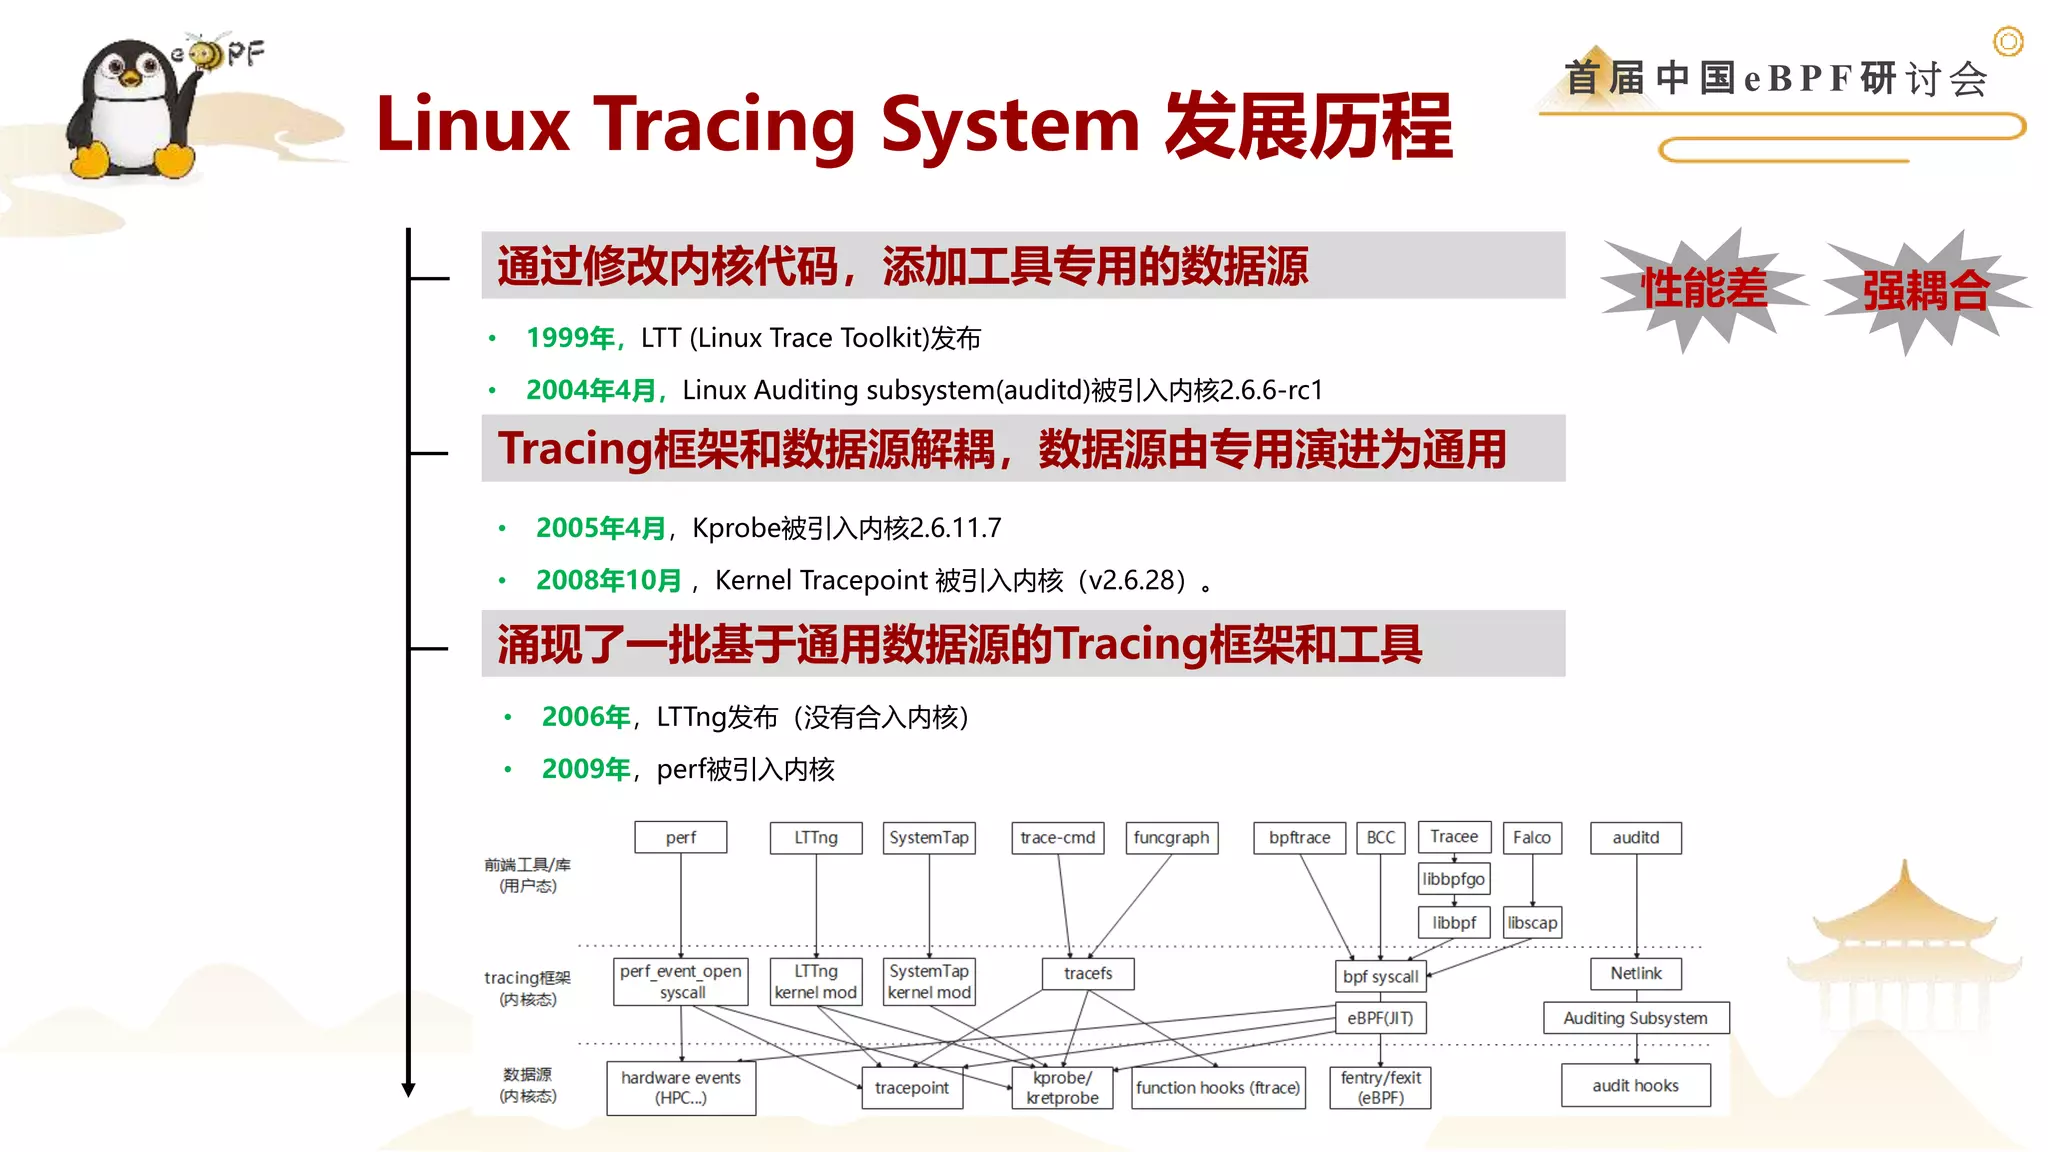
* Figure inspired by https://static.sched.com/hosted_files/osseu19/5f/unified-tracing-platform-oss-eu-2019.pdf
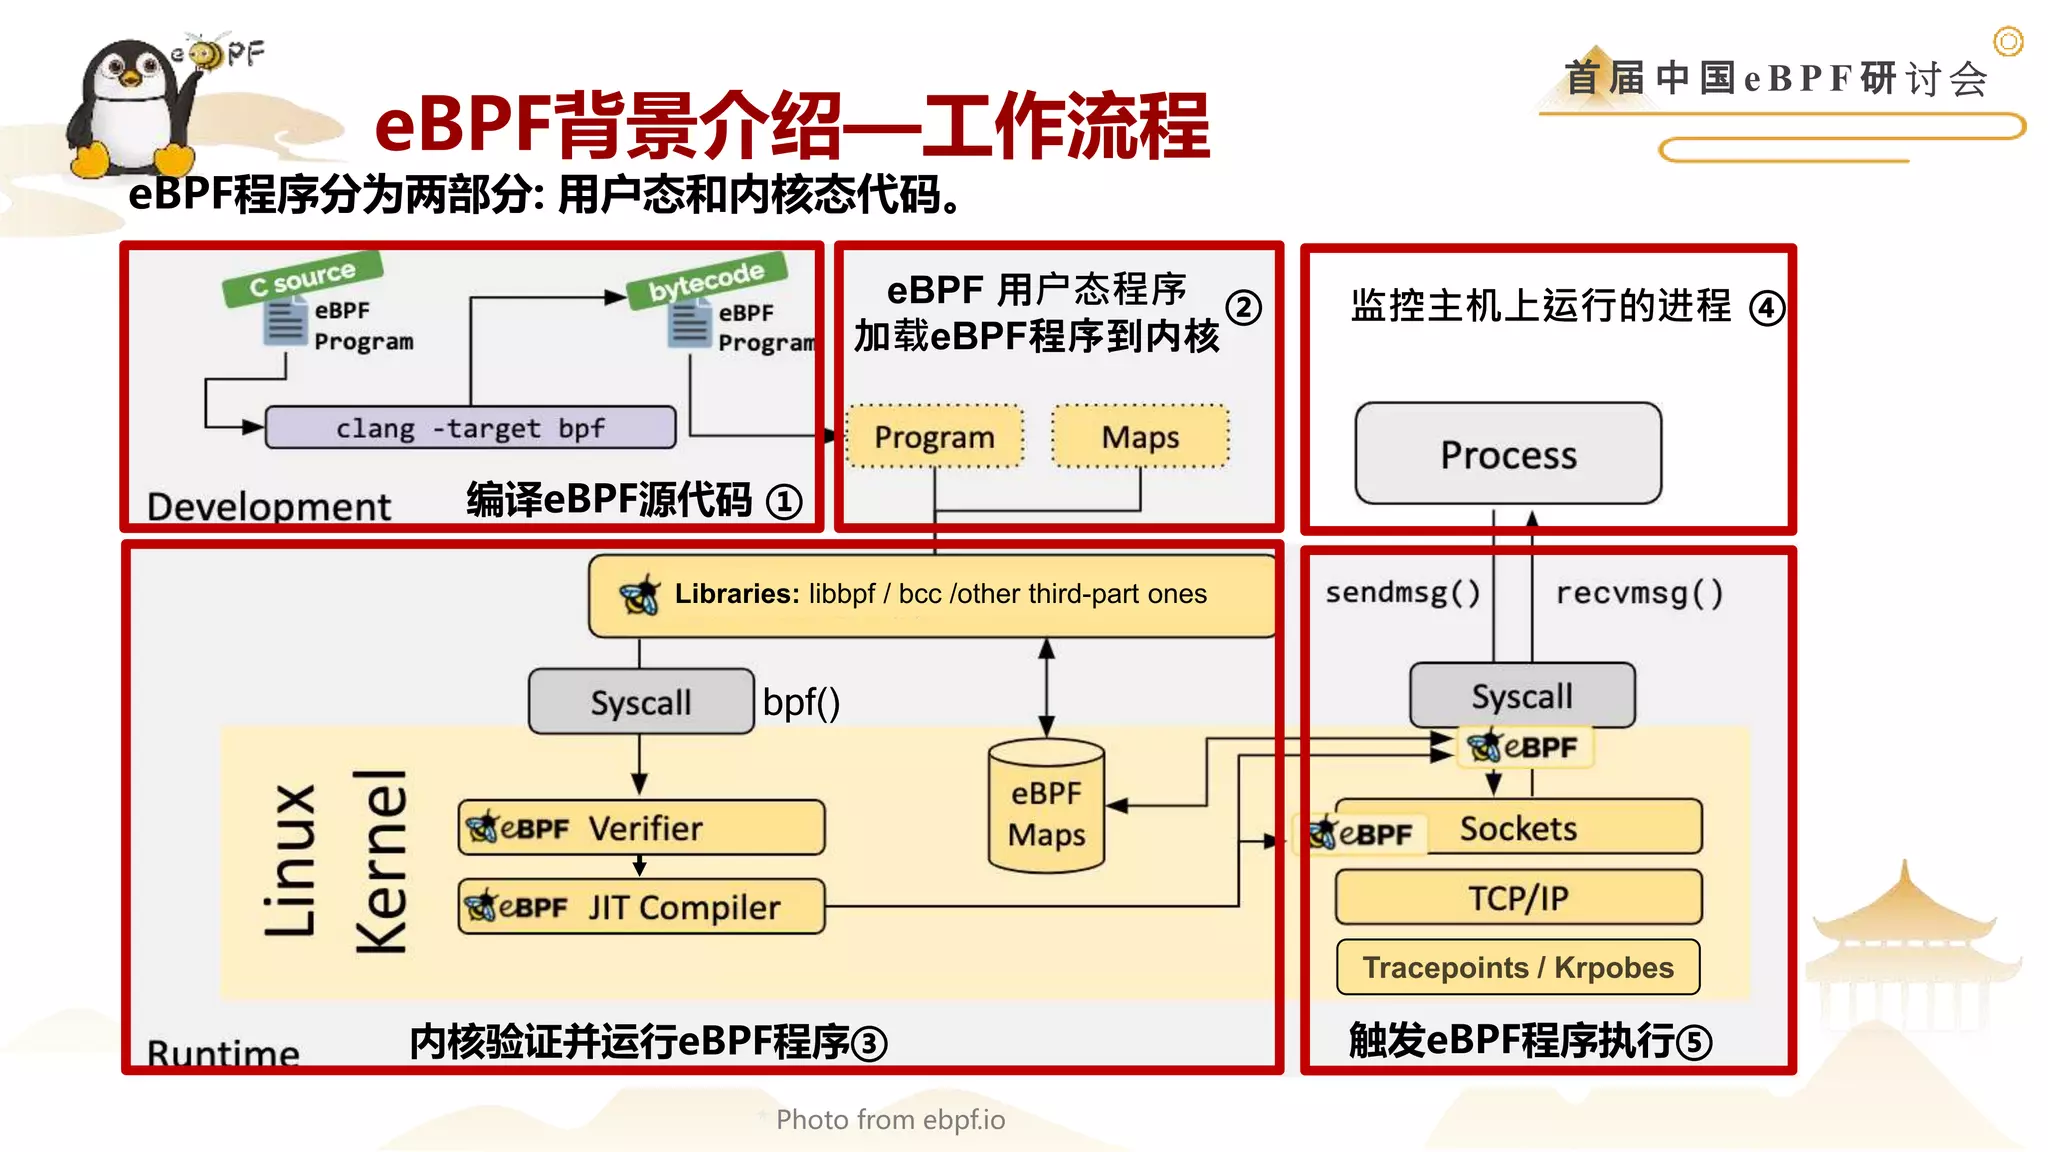
• 数据源:提供数据的来源
• Tracing 框架:负责对接数据源,采集解析发送数据,并对用户态提供接口
• 前端工具/库: 对接Tracing框架,直接与用户交互,负责采集配置和数据分析
Linux Tracing System浅析
4.
首 届 中国 e B P F 研 讨 会
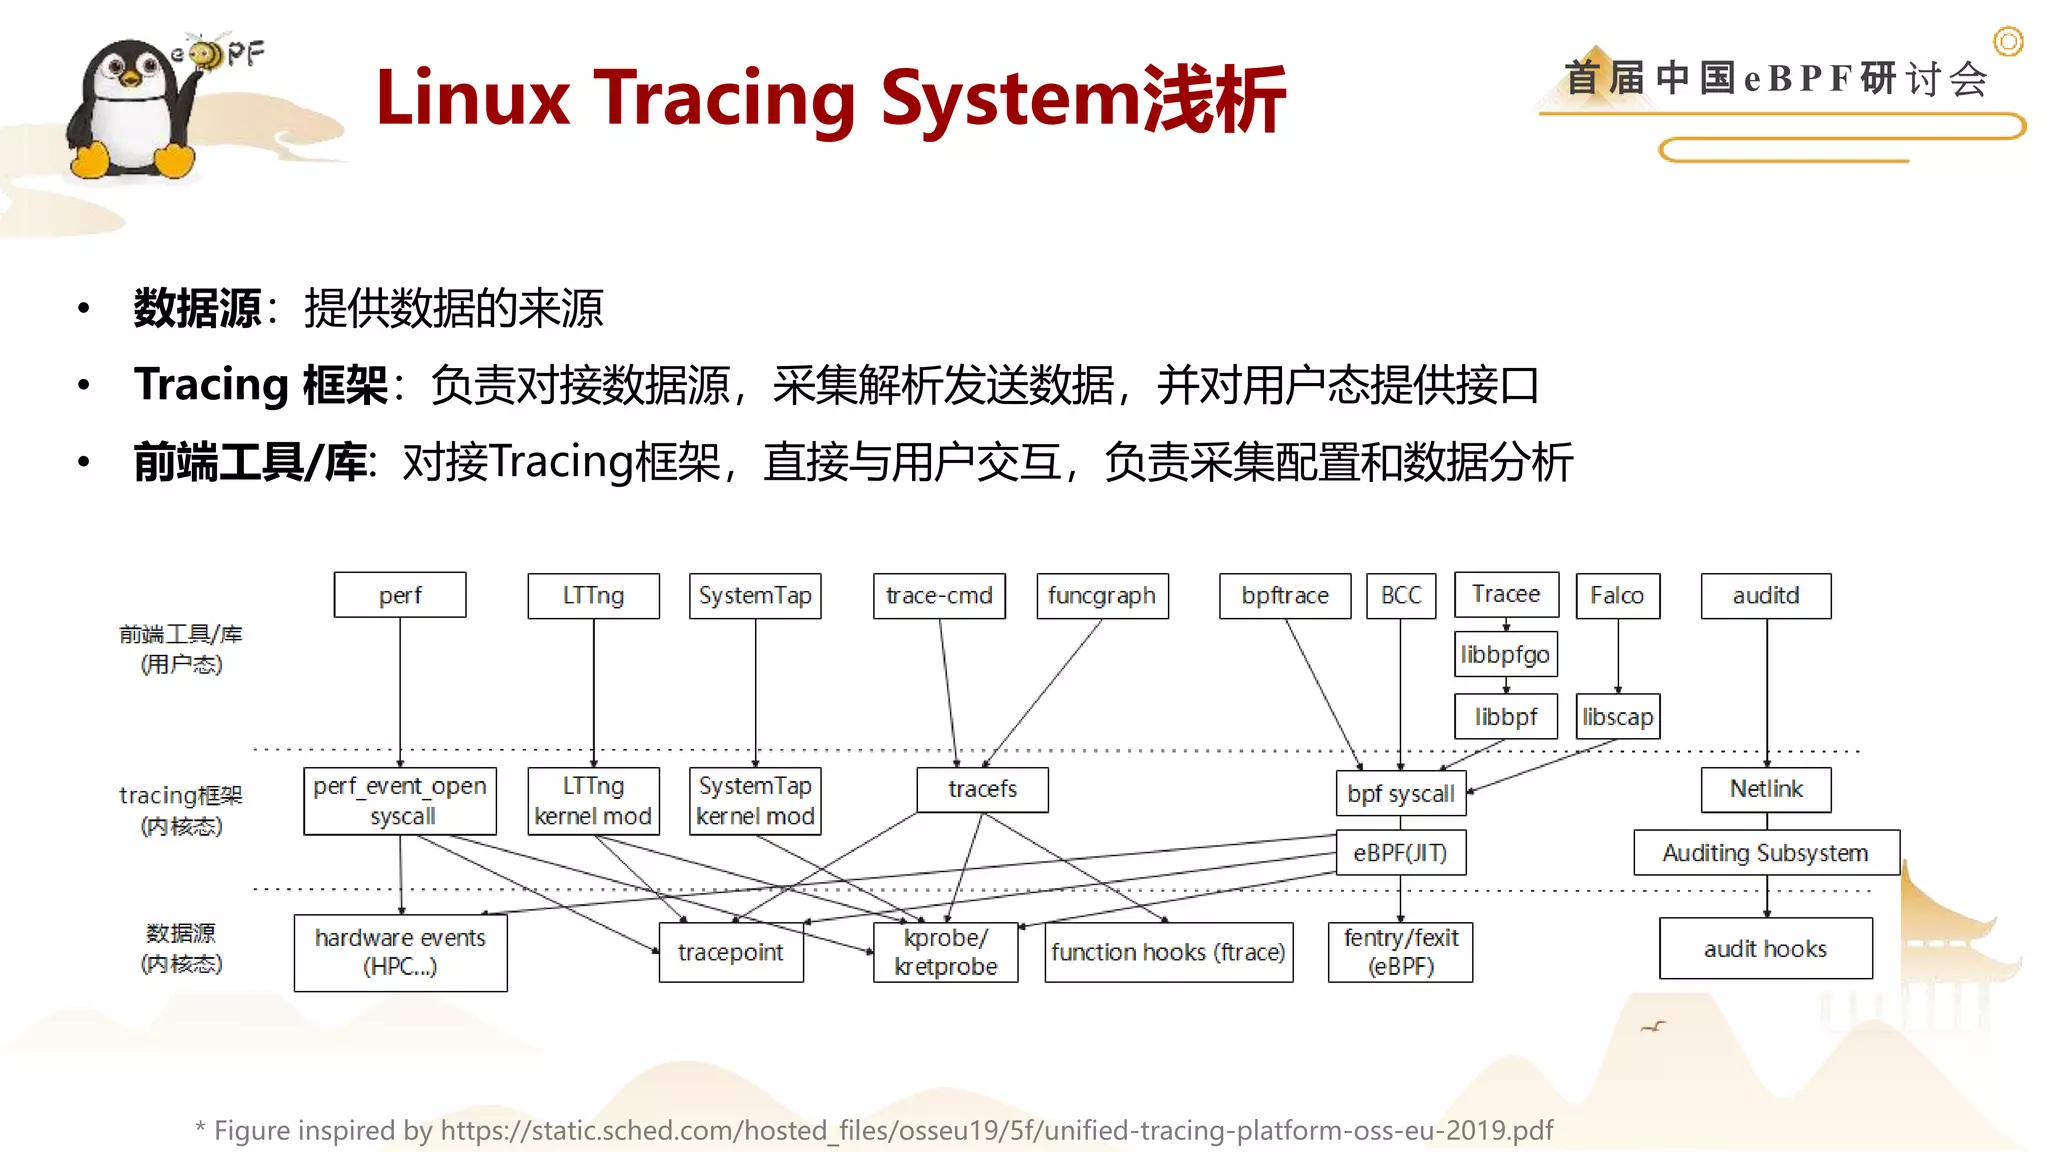
* Figure inspired by https://static.sched.com/hosted_files/osseu19/5f/unified-tracing-platform-oss-eu-2019.pdf
Linux Tracing System浅析
# trace-cmd record -e sched_process_exec
# trace-cmd report
ps-184478 [000] 154243.947402: sched_process_exec: filename=/usr/bin/ps pid=184478 old_pid=184478
grep-184479 [002] 154243.947596: sched_process_exec: filename=/usr/bin/egrep pid=184479 old_pid=184479
grep-184480 [003] 154243.947681: sched_process_exec: filename=/usr/bin/grep pid=184480 old_pid=184480
awk-184481 [006] 154243.947783: sched_process_exec: filename=/usr/bin/awk pid=184481 old_pid=184481
grep-184479 [005] 154243.948385: sched_process_exec: filename=/usr/bin/grep pid=184479 old_pid=184479
cat-184482 [003] 154244.970658: sched_process_exec: filename=/usr/bin/cat pid=184482 old_pid=184482
使用前端工具trace-cmd,通过tracefs 框架,对接数据源tracepoint,实现进程exec行为的数据采集和分析工作
5.
首 届 中国 e B P F 研 讨 会
* Figure inspired by https://static.sched.com/hosted_files/osseu19/5f/unified-tracing-platform-oss-eu-2019.pdf
• 数据源:提供数据的来源
• Tracing 框架:负责对接数据源,采集解析发送数据,并对用户态提供接口
• 前端工具/库: 对接Tracing框架,直接与用户交互,负责采集配置和数据分析
Linux Tracing System浅析
6.
首 届 中国 e B P F 研 讨 会
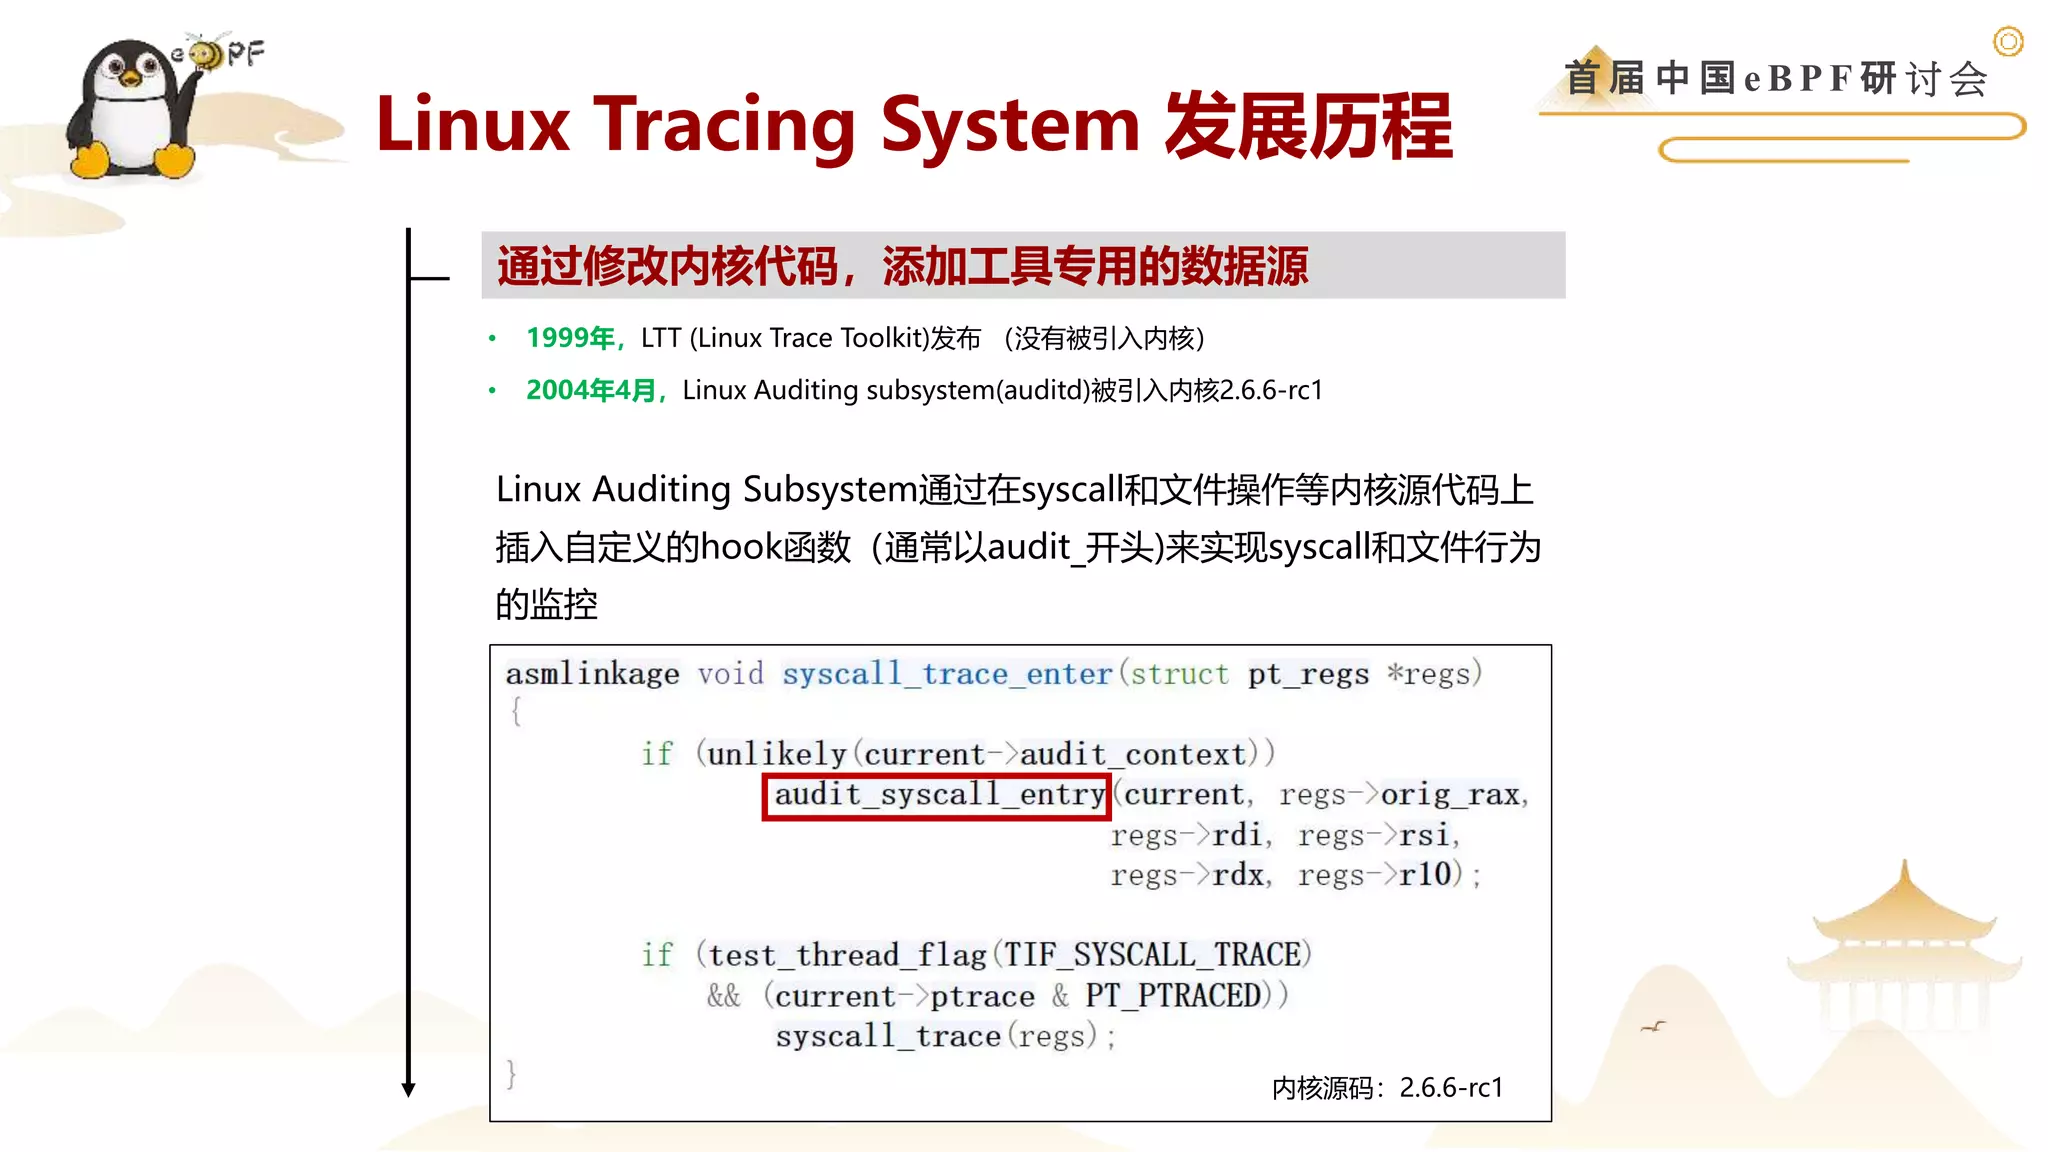
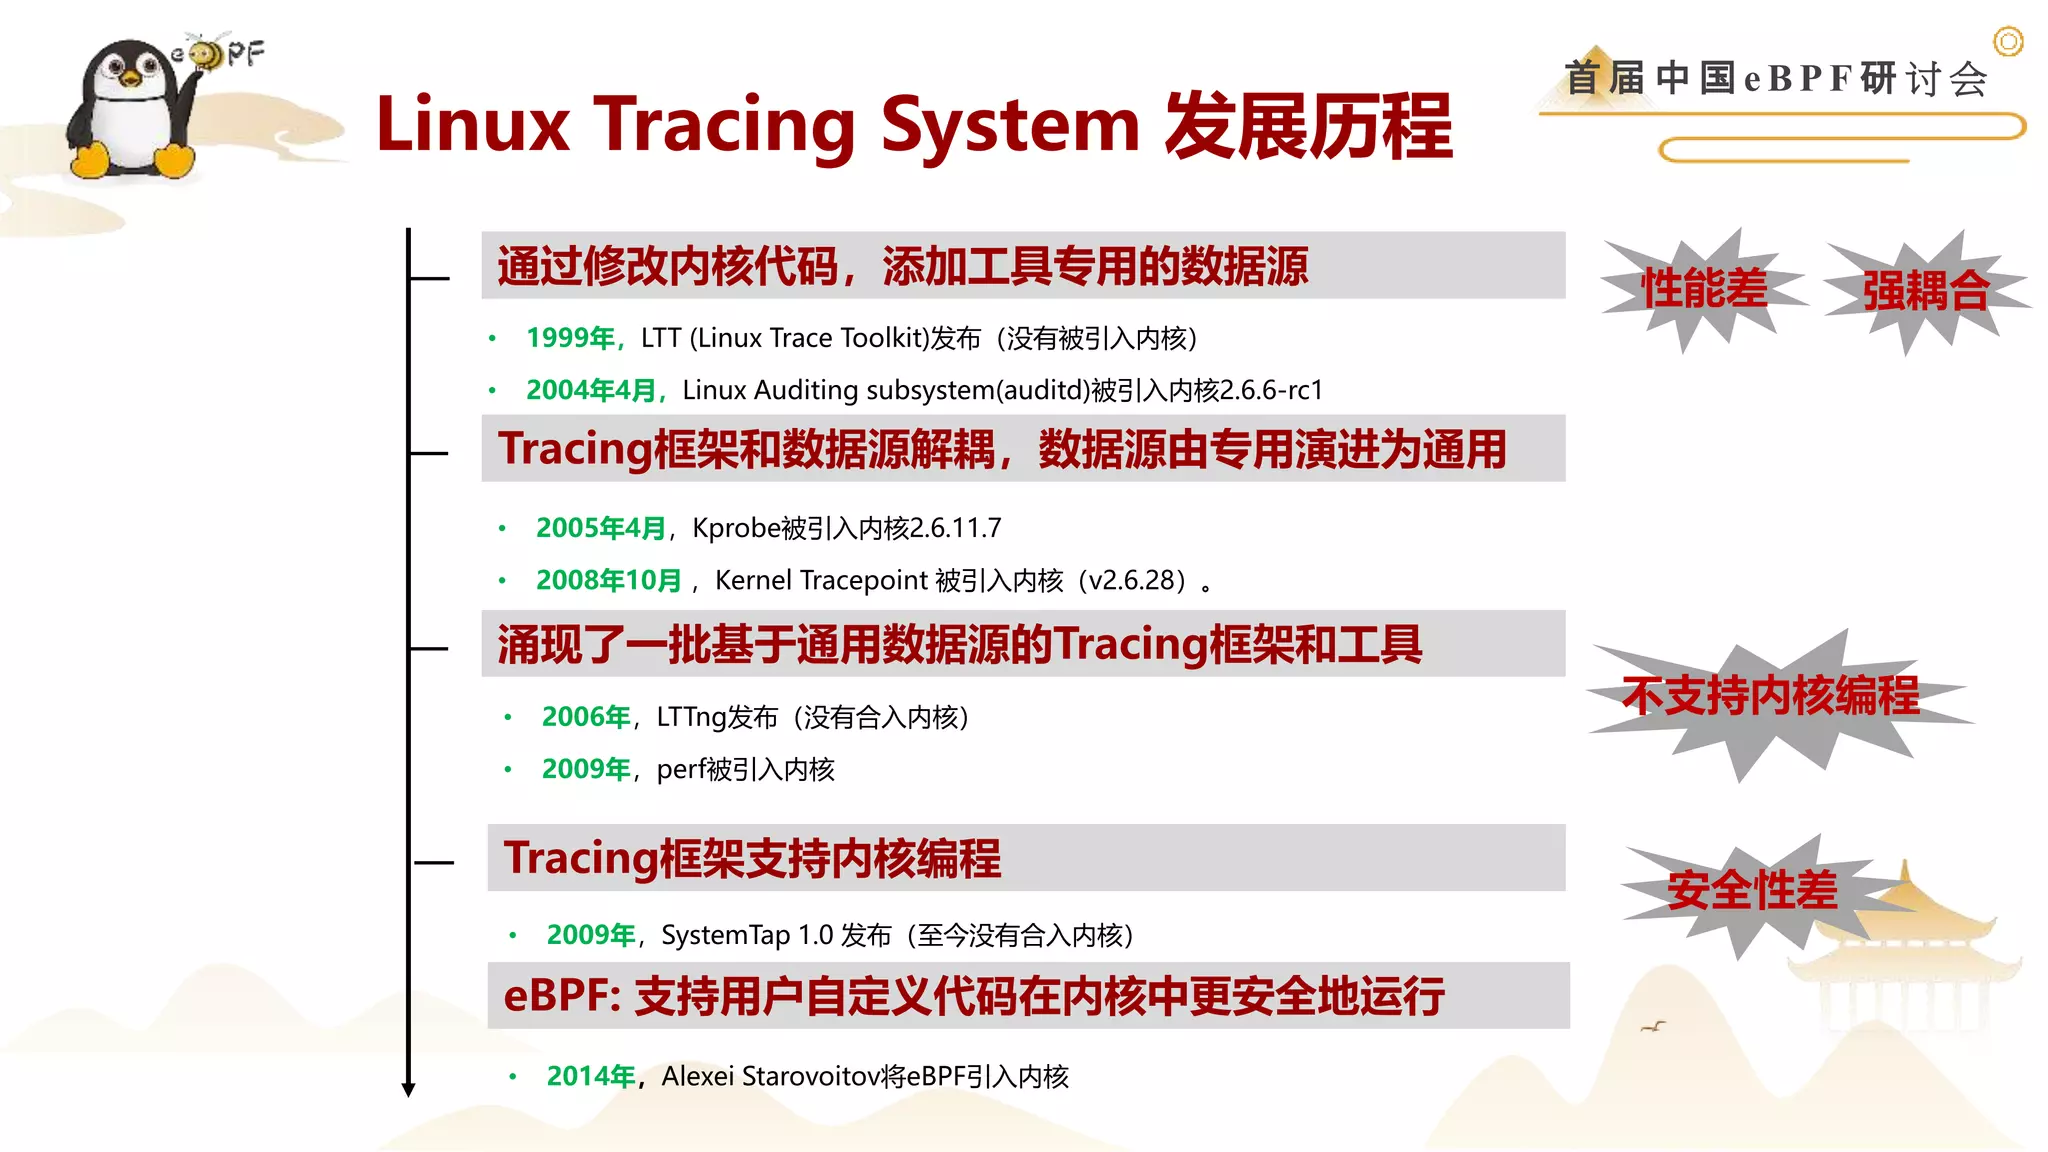
Linux Tracing System 发展历程
• 1999年,LTT (Linux Trace Toolkit)发布 (没有被引入内核)
• 2004年4月,Linux Auditing subsystem(auditd)被引入内核2.6.6-rc1
通过修改内核代码,添加工具专用的数据源
Linux Auditing Subsystem通过在syscall和文件操作等内核源代码上
插入自定义的hook函数(通常以audit_开头)来实现syscall和文件行为
的监控
内核源码:2.6.6-rc1
7.
首 届 中国 e B P F 研 讨 会
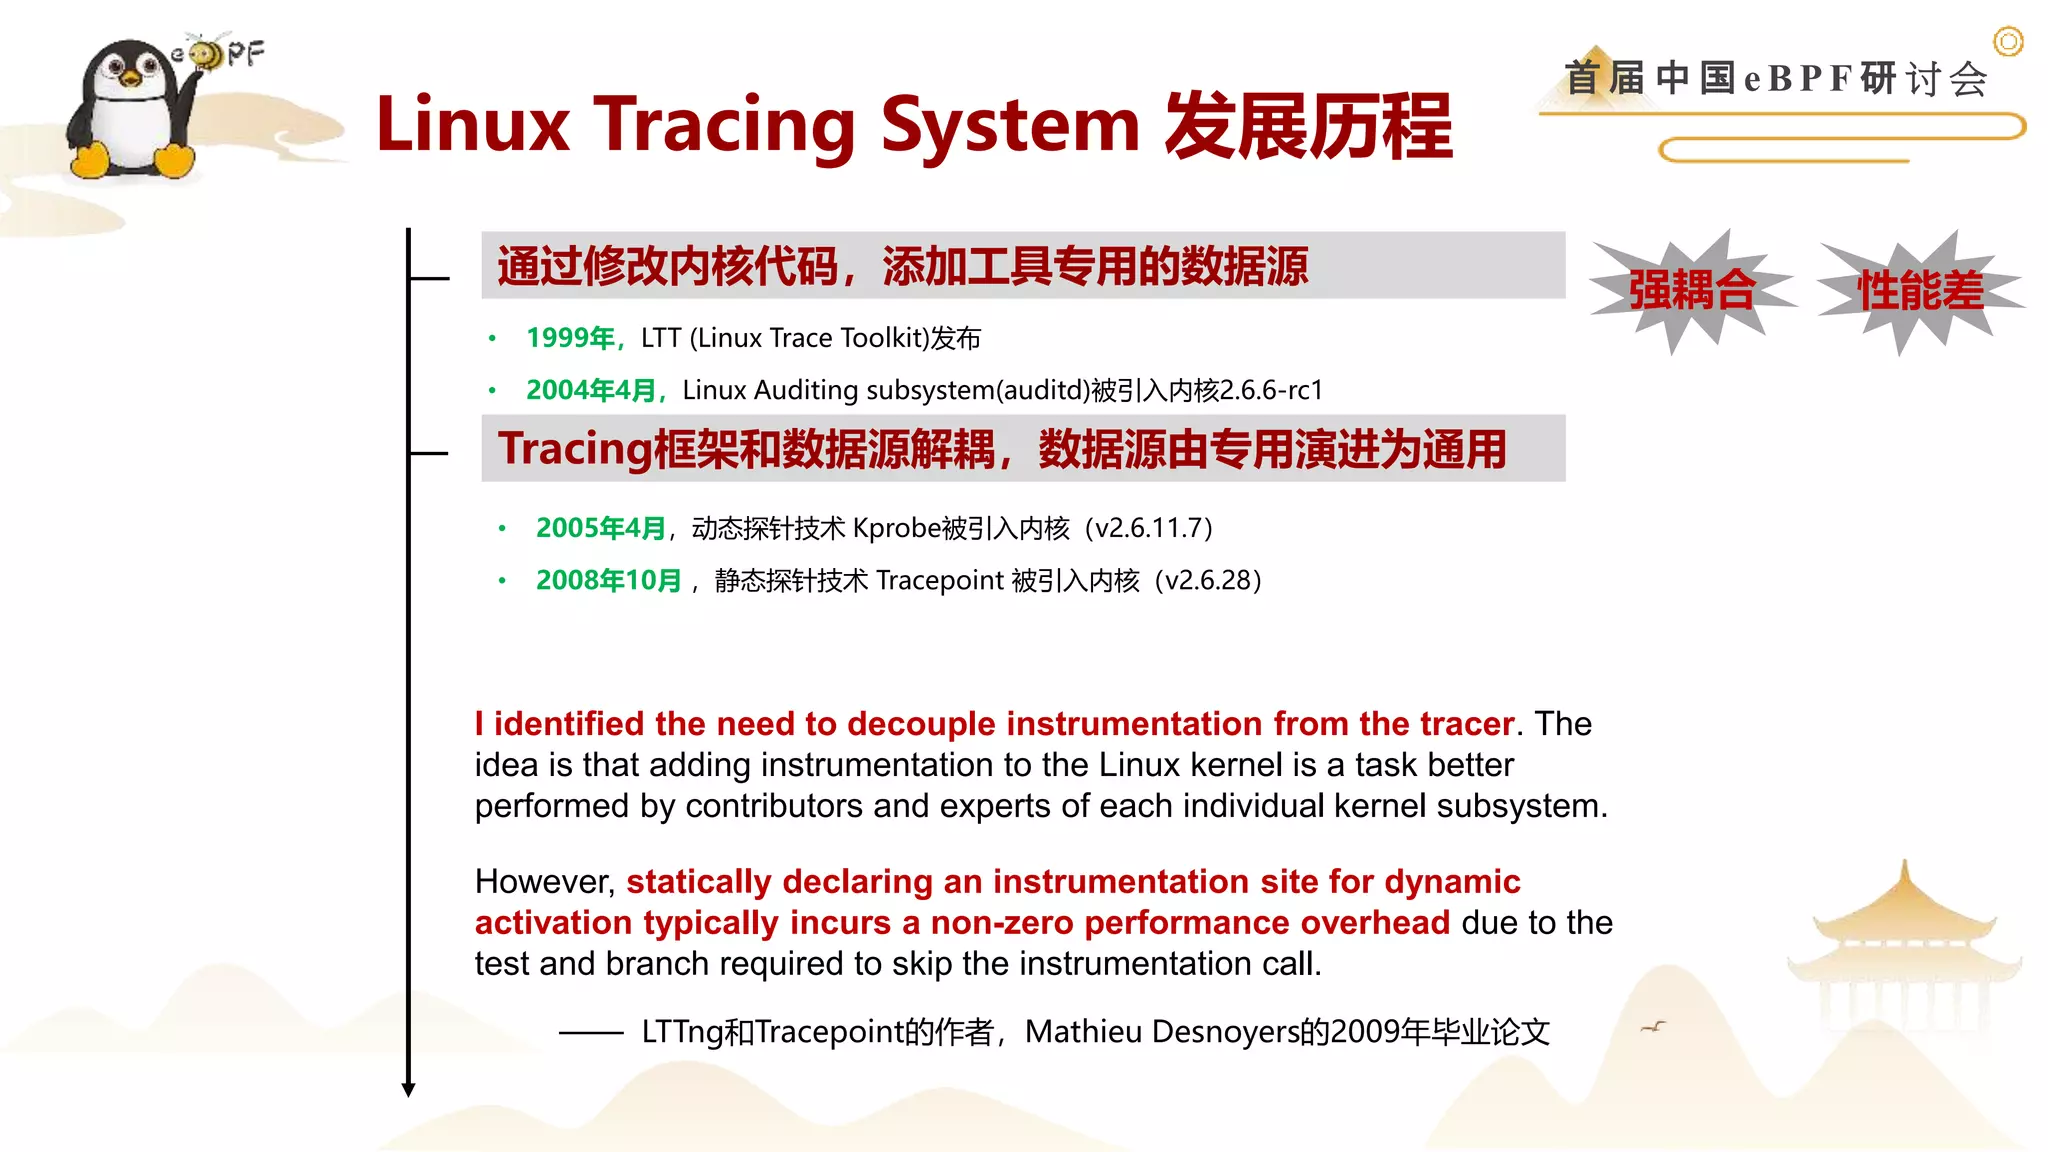
Linux Tracing System 发展历程
• 1999年,LTT (Linux Trace Toolkit)发布
• 2004年4月,Linux Auditing subsystem(auditd)被引入内核2.6.6-rc1
通过修改内核代码,添加工具专用的数据源
Tracing框架和数据源解耦,数据源由专用演进为通用
• 2005年4月,动态探针技术 Kprobe被引入内核(v2.6.11.7)
• 2008年10月 ,静态探针技术 Tracepoint 被引入内核(v2.6.28)
However, statically declaring an instrumentation site for dynamic
activation typically incurs a non-zero performance overhead due to the
test and branch required to skip the instrumentation call.
性能差
强耦合
I identified the need to decouple instrumentation from the tracer. The
idea is that adding instrumentation to the Linux kernel is a task better
performed by contributors and experts of each individual kernel subsystem.
—— LTTng和Tracepoint的作者,Mathieu Desnoyers的2009年毕业论文
![首 届 中 国 e B P F 研 讨 会
* Figure inspired by https://static.sched.com/hosted_files/osseu19/5f/unified-tracing-platform-oss-eu-2019.pdf
Linux Tracing System浅析
# trace-cmd record -e sched_process_exec
# trace-cmd report
ps-184478 [000] 154243.947402: sched_process_exec: filename=/usr/bin/ps pid=184478 old_pid=184478
grep-184479 [002] 154243.947596: sched_process_exec: filename=/usr/bin/egrep pid=184479 old_pid=184479
grep-184480 [003] 154243.947681: sched_process_exec: filename=/usr/bin/grep pid=184480 old_pid=184480
awk-184481 [006] 154243.947783: sched_process_exec: filename=/usr/bin/awk pid=184481 old_pid=184481
grep-184479 [005] 154243.948385: sched_process_exec: filename=/usr/bin/grep pid=184479 old_pid=184479
cat-184482 [003] 154244.970658: sched_process_exec: filename=/usr/bin/cat pid=184482 old_pid=184482
使用前端工具trace-cmd,通过tracefs 框架,对接数据源tracepoint,实现进程exec行为的数据采集和分析工作](https://image.slidesharecdn.com/3-230904064137-0fc774ef/75/Linux-Tracing-System-eBPF-4-2048.jpg)
![首 届 中 国 e B P F 研 讨 会
• 可以Hook几乎所有的内核函数
• 不稳定(函数的变更可能导致程序失效)
• 性能相对Tracepoint更差
Tracepoint VS Kprobe
TRACE_EVENT(sched_process_exec,
TP_PROTO(struct task_struct *p, pid_t old_pid,
struct linux_binprm *bprm),
...
);
static int exec_binprm(struct linux_binprm *bprm)
{
/* ... */
trace_sched_process_exec(current, old_pid, bprm);
return 0;
}
2012年新的Tracepoint sched_process_exec被引入内核 [1]
• 稳定(内核子系统开发者会负责维护该函数的稳定性)
• 性能好
• 需要修改内核代码来添加新的Tracepoint点。
• 内核支持的Tracepoint数量有限
[1] https://github.com/torvalds/linux/commit/4ff16c25e2cc48cbe6956e356c38a25ac063a64d
指令2
Kprobe 工作原理示意图
指令1 跳转指令
内核函数
自定义代码](https://image.slidesharecdn.com/3-230904064137-0fc774ef/75/Linux-Tracing-System-eBPF-8-2048.jpg)
![首 届 中 国 e B P F 研 讨 会
SEC("kprobe/do_unlinkat")
int BPF_KPROBE(do_unlinkat, int dfd, struct filename *name)
{
// 获取一个数组指针array(数组MAX_SIZE为16个字节)
u32 key = 0;
char *array = bpf_map_lookup_elem(&array_map, &key);
if (array == NULL)
return 0;
// 获取当前运行程序的CPU编号(当前机器的CPU有16个核)
unsigned int pos = bpf_get_smp_processor_id();
// 根据下标修改数组的值
array[pos] = 1;
return 0;
}
• eBPF会被LLVM编译为eBPF字节码
• eBPF字节码需要通过eBPF verifier的(静态)验证后,才能真正运行
• 边界检查是eBPF verify的重点工作,防止eBPF程序内存越界访问
eBPF验证器——边界检查案例](https://image.slidesharecdn.com/3-230904064137-0fc774ef/75/Linux-Tracing-System-eBPF-14-2048.jpg)
![首 届 中 国 e B P F 研 讨 会
0000000000000000 <do_unlinkat>:
; int BPF_KPROBE(do_unlinkat, int dfd, struct filename *name)
0: r1 = 0
; u32 key = 0;
1: *(u32 *)(r10 - 4) = r1
2: r2 = r10
3: r2 += -4
; char *array = bpf_map_lookup_elem(&array_map, &key);
4: r1 = 0 ll
6: call 1
7: r6 = r0
; if (array == NULL)
8: if r6 == 0 goto +6 <LBB0_2>
; unsigned int pos = bpf_get_smp_processor_id();
9: call 8
; array[pos] = 1;
10: r0 <<= 32
11: r0 >>= 32
12: r6 += r0
13: r1 = 1
; array[pos] = 1;
14: *(u8 *)(r6 + 0) = r1
14行无法通过验证
因为R6寄存器(变量pos)没有
进行边界检查
eBPF验证器——边界检查案例](https://image.slidesharecdn.com/3-230904064137-0fc774ef/75/Linux-Tracing-System-eBPF-15-2048.jpg)
![首 届 中 国 e B P F 研 讨 会
0000000000000000 <do_unlinkat>:
; int BPF_KPROBE(do_unlinkat, int dfd, struct filename *name)
0: r1 = 0
; u32 key = 0;
1: *(u32 *)(r10 - 4) = r1
2: r2 = r10
3: r2 += -4
; char *array = bpf_map_lookup_elem(&array_map, &key);
4: r1 = 0 ll
6: call 1
7: r6 = r0
; if (array == NULL)
8: if r6 == 0 goto +7 <LBB0_3>
; unsigned int pos = bpf_get_smp_processor_id();
9: call 8
10: r0 <<= 32
11: r0 >>= 32
; if (pos < MAX_SIZE)
12: if r0 > 15 goto +3 <LBB0_3>
; array[pos] = 1;
13: r6 += r0
14: r1 = 1
; array[pos] = 1;
15: *(u8 *)(r6 + 0) = r1
通过验证,可以运行
解决方案:添加边界检查代码
eBPF验证器——边界检查案例](https://image.slidesharecdn.com/3-230904064137-0fc774ef/75/Linux-Tracing-System-eBPF-16-2048.jpg)
![首 届 中 国 e B P F 研 讨 会
SEC("kprobe/do_unlinkat")
int BPF_KPROBE(do_unlinkat, int dfd, struct filename *name)
{
// 获取一个数组指针array(数组MAX_SIZE为16个字节)
u32 key = 0;
char *array = bpf_map_lookup_elem(&array_map, &key);
if (array == NULL)
return 0;
// 获取当前运行程序的CPU编号(当前机器的CPU有16个核)
unsigned int pos = bpf_get_smp_processor_id();
// 修改数值
if (pos < MAX_SIZE){
array[pos] = 1;
pos += 1;
}
// debug代码,输出一些上下文信息
bpf_printk("debug %d %d %dn", bpf_get_current_pid_tgid() >> 32,
bpf_get_current_pid_tgid(), array[1]);
// 修改数值
if (pos < MAX_SIZE)
array[pos] = 1;
return 0;
}
通过验证,可以运行
代码测试环境均为:
1. LLVM 11
2. Ubuntu 5.8.0内核版本
3. libbpf commit @9c44c8a
一个print引发的惨案](https://image.slidesharecdn.com/3-230904064137-0fc774ef/75/Linux-Tracing-System-eBPF-17-2048.jpg)
![首 届 中 国 e B P F 研 讨 会
SEC("kprobe/do_unlinkat")
int BPF_KPROBE(do_unlinkat, int dfd, struct filename *name)
{
// 获取一个数组指针array(数组MAX_SIZE为16个字节)
u32 key = 0;
char *array = bpf_map_lookup_elem(&array_map, &key);
if (array == NULL)
return 0;
// 获取当前运行程序的CPU编号(当前机器的CPU有16个核)
unsigned int pos = bpf_get_smp_processor_id();
// 修改数值
if (pos < MAX_SIZE){
array[pos] = 1;
pos += 1;
}
// debug代码,输出一些上下文信息
bpf_printk("debug %d %d %dn", bpf_get_current_pid_tgid() >> 32,
bpf_get_current_pid_tgid(), array[1]);
// 修改数值
if (pos < MAX_SIZE)
array[pos] = 1;
return 0;
}
无法通过验证
因为R0寄存器(变量pos)没有
进行边界检查
仅仅删除源码中的print代码,导致无法通过验证
一个print引发的惨案](https://image.slidesharecdn.com/3-230904064137-0fc774ef/75/Linux-Tracing-System-eBPF-18-2048.jpg)
![首 届 中 国 e B P F 研 讨 会
Page 19
; if (pos < MAX_SIZE){
13: if r1 > 15 goto +9 <LBB0_4>
; array[pos] = 1;
14: r3 = r6
15: r3 += r1
16: r2 = 1
17: *(u8 *)(r3 + 0) = r2
编译器存在自身的代码优化机制,逻辑相似的代码可能会生成完全不同的eBPF字节码
; if (pos < MAX_SIZE) {
18: if r1 == 15 goto +4 <LBB0_4>
; array[pos] = 1;
19: r0 <<= 32
20: r0 >>= 32
; pos += 1;
21: r0 += r6
; array[pos] = 1;
22: *(u8 *)(r0 + 1) = r2
根本原因:编译优化导致eBPF verifier无法获得完整的上下文信息
if (pos < MAX_SIZE){
array[pos] = 1;
pos += 1;
}
if (pos < MAX_SIZE)
array[pos] = 1;
对r1进行了边界检查,并
用r1来访问了数组array
对r1进行了边界检查,
但却用r0+1来访问了数组
array
通过验证,可以运行
无法通过验证,
寄存器r0没有边界检查
源代码
eBPF字节码
eBPF验证机制与编译器优化机制的不一致问题 (1)](https://image.slidesharecdn.com/3-230904064137-0fc774ef/75/Linux-Tracing-System-eBPF-19-2048.jpg)
![首 届 中 国 e B P F 研 讨 会
SEC("kprobe/do_unlinkat")
int BPF_KPROBE(do_unlinkat, int dfd, struct filename *name)
{
// 获取一个数组指针array(数组MAX_SIZE为16个字节)
u32 key = 0;
char *array = bpf_map_lookup_elem(&array_map, &key);
if (array == NULL)
return 0;
// 获取当前运行程序的CPU编号(当前机器的CPU有16个核)
unsigned long pos = bpf_get_smp_processor_id();
// 修改数值
if (pos < MAX_SIZE){
array[pos] = 1;
}
return 0;
}
通过验证,可以运行
eBPF验证机制与编译器优化机制的不一致问题 (2)](https://image.slidesharecdn.com/3-230904064137-0fc774ef/75/Linux-Tracing-System-eBPF-20-2048.jpg)
![首 届 中 国 e B P F 研 讨 会
SEC("kprobe/do_unlinkat")
int BPF_KPROBE(do_unlinkat, int dfd, struct filename *name)
{
// 获取一个数组指针array(数组MAX_SIZE为16个字节)
u32 key = 0;
char *array = bpf_map_lookup_elem(&array_map, &key);
if (array == NULL)
return 0;
// 获取当前运行程序的CPU编号(当前机器的CPU有16个核)
unsigned long pos = bpf_get_smp_processor_id();
// 修改数值
if (pos < MAX_SIZE){
for (unsigned long i = 0; i < MAX_SIZE; i++)
bpf_printk("debug %d %d %dn", bpf_get_current_pid_tgid()
>> 32, bpf_get_current_pid_tgid(), array[i]);
array[pos] = 1;
}
return 0;
}
仅仅在源码中添加了print代码,导致无法通过验证
无法通过验证
因为R1寄存器(变量pos)没有
进行边界检查
eBPF验证机制与编译器优化机制的不一致问题 (2)](https://image.slidesharecdn.com/3-230904064137-0fc774ef/75/Linux-Tracing-System-eBPF-21-2048.jpg)
![首 届 中 国 e B P F 研 讨 会
; if (pos < MAX_SIZE){
12: if r0 > 15 goto +3 <LBB0_3>
; array[pos] = 1;
13: r6 += r0
14: r1 = 1
; array[pos] = 1;
15: *(u8 *)(r6 + 0) = r1
; if (pos < MAX_SIZE){
12: if r0 > 15 goto +24 <LBB0_5>
13: *(u64 *)(r10 - 16) = r0
...
; array[pos] = 1;
33: r1 = *(u64 *)(r10 - 16)
34: r7 += r1
35: r1 = 1
36: *(u8 *)(r7 + 0) = r1
根本原因:寄存器溢出/重加载后,状态丢失
if (pos < MAX_SIZE)
array[pos] = 1;
if (pos < MAX_SIZE){
for (…)
bpf_printk(…);
array[pos] = 1;
}
通过验证,可以运行
无法通过验证,
寄存器r1没有边界检查
源代码
eBPF字节码
eBPF验证机制与编译器优化机制的不一致问题 (2)](https://image.slidesharecdn.com/3-230904064137-0fc774ef/75/Linux-Tracing-System-eBPF-22-2048.jpg)
![首 届 中 国 e B P F 研 讨 会
eBPF验证机制与编译器优化机制的不一致问题 的缓解思路
1. 在源码中加入 &= 操作符,引导编译器生成理想的eBPF字节码
• array[pos &= MAX_SIZE - 1] = 1;
2. 如果上述方法失效,无法引导编译器,那么针对出错的部分源代码人工编写eBPF字节码,替代编译器
生成的字节码
#define STR(s) #s
#define XSTR(s) STR(s)
#define asm_variable_bound_check(variable)
({
asm volatile (
"%[tmp] &= " XSTR(MAX_SIZE - 1) " n"
:[tmp]"+&r"(variable)
);
})
asm_check(pos);
array[pos] = 1;](https://image.slidesharecdn.com/3-230904064137-0fc774ef/75/Linux-Tracing-System-eBPF-23-2048.jpg)