Linux Optimization Strategy PlanShivPrincipal Data Architect-InsigniaPhone: +919900093046Email: mailtoshivaiyer@gmail.com
The 4 step approach to identify and solve a performance issueStep 1 – Understand (and reproduce) the problemStep 2 – Monitor and collect dataStep 3 – Eliminate and narrow down issuesStep 4 – One change at a time
Linux Optimization Strategy Plan CPU Memory I/O Network
CPUcontext switchrun queuecpu utilizationload average.
Context Switch When CPU switches from one process (or thread) to another, it is called as context switch. When a process switch happens, kernel stores the current state of the CPU (of a process or thread) in the memory. Kernel also retrieves the previously stored state (of a process or thread) from the memory and puts it in the CPU. Context switching is very essential for multitasking of the CPU. However, a higher level of context switching can cause performance issues.
Run QueueRun queue indicates the total number of active processes in the current queue for CPU. When CPU is ready to execute a process, it picks it up from the run queue based on the priority of the process. Please note that processes that are in sleep state, or i/o wait state are not in the run queue. So, a higher number of processes in the run queue can cause performance issues.
CPU Utilization This indicates how much of the CPU is currently getting used. This is fairly straight forward, and you can view the CPU utilization from the top command. 100% CPU utilization means the system is fully loaded. So, a higher %age of CPU utilization will cause performance issues.
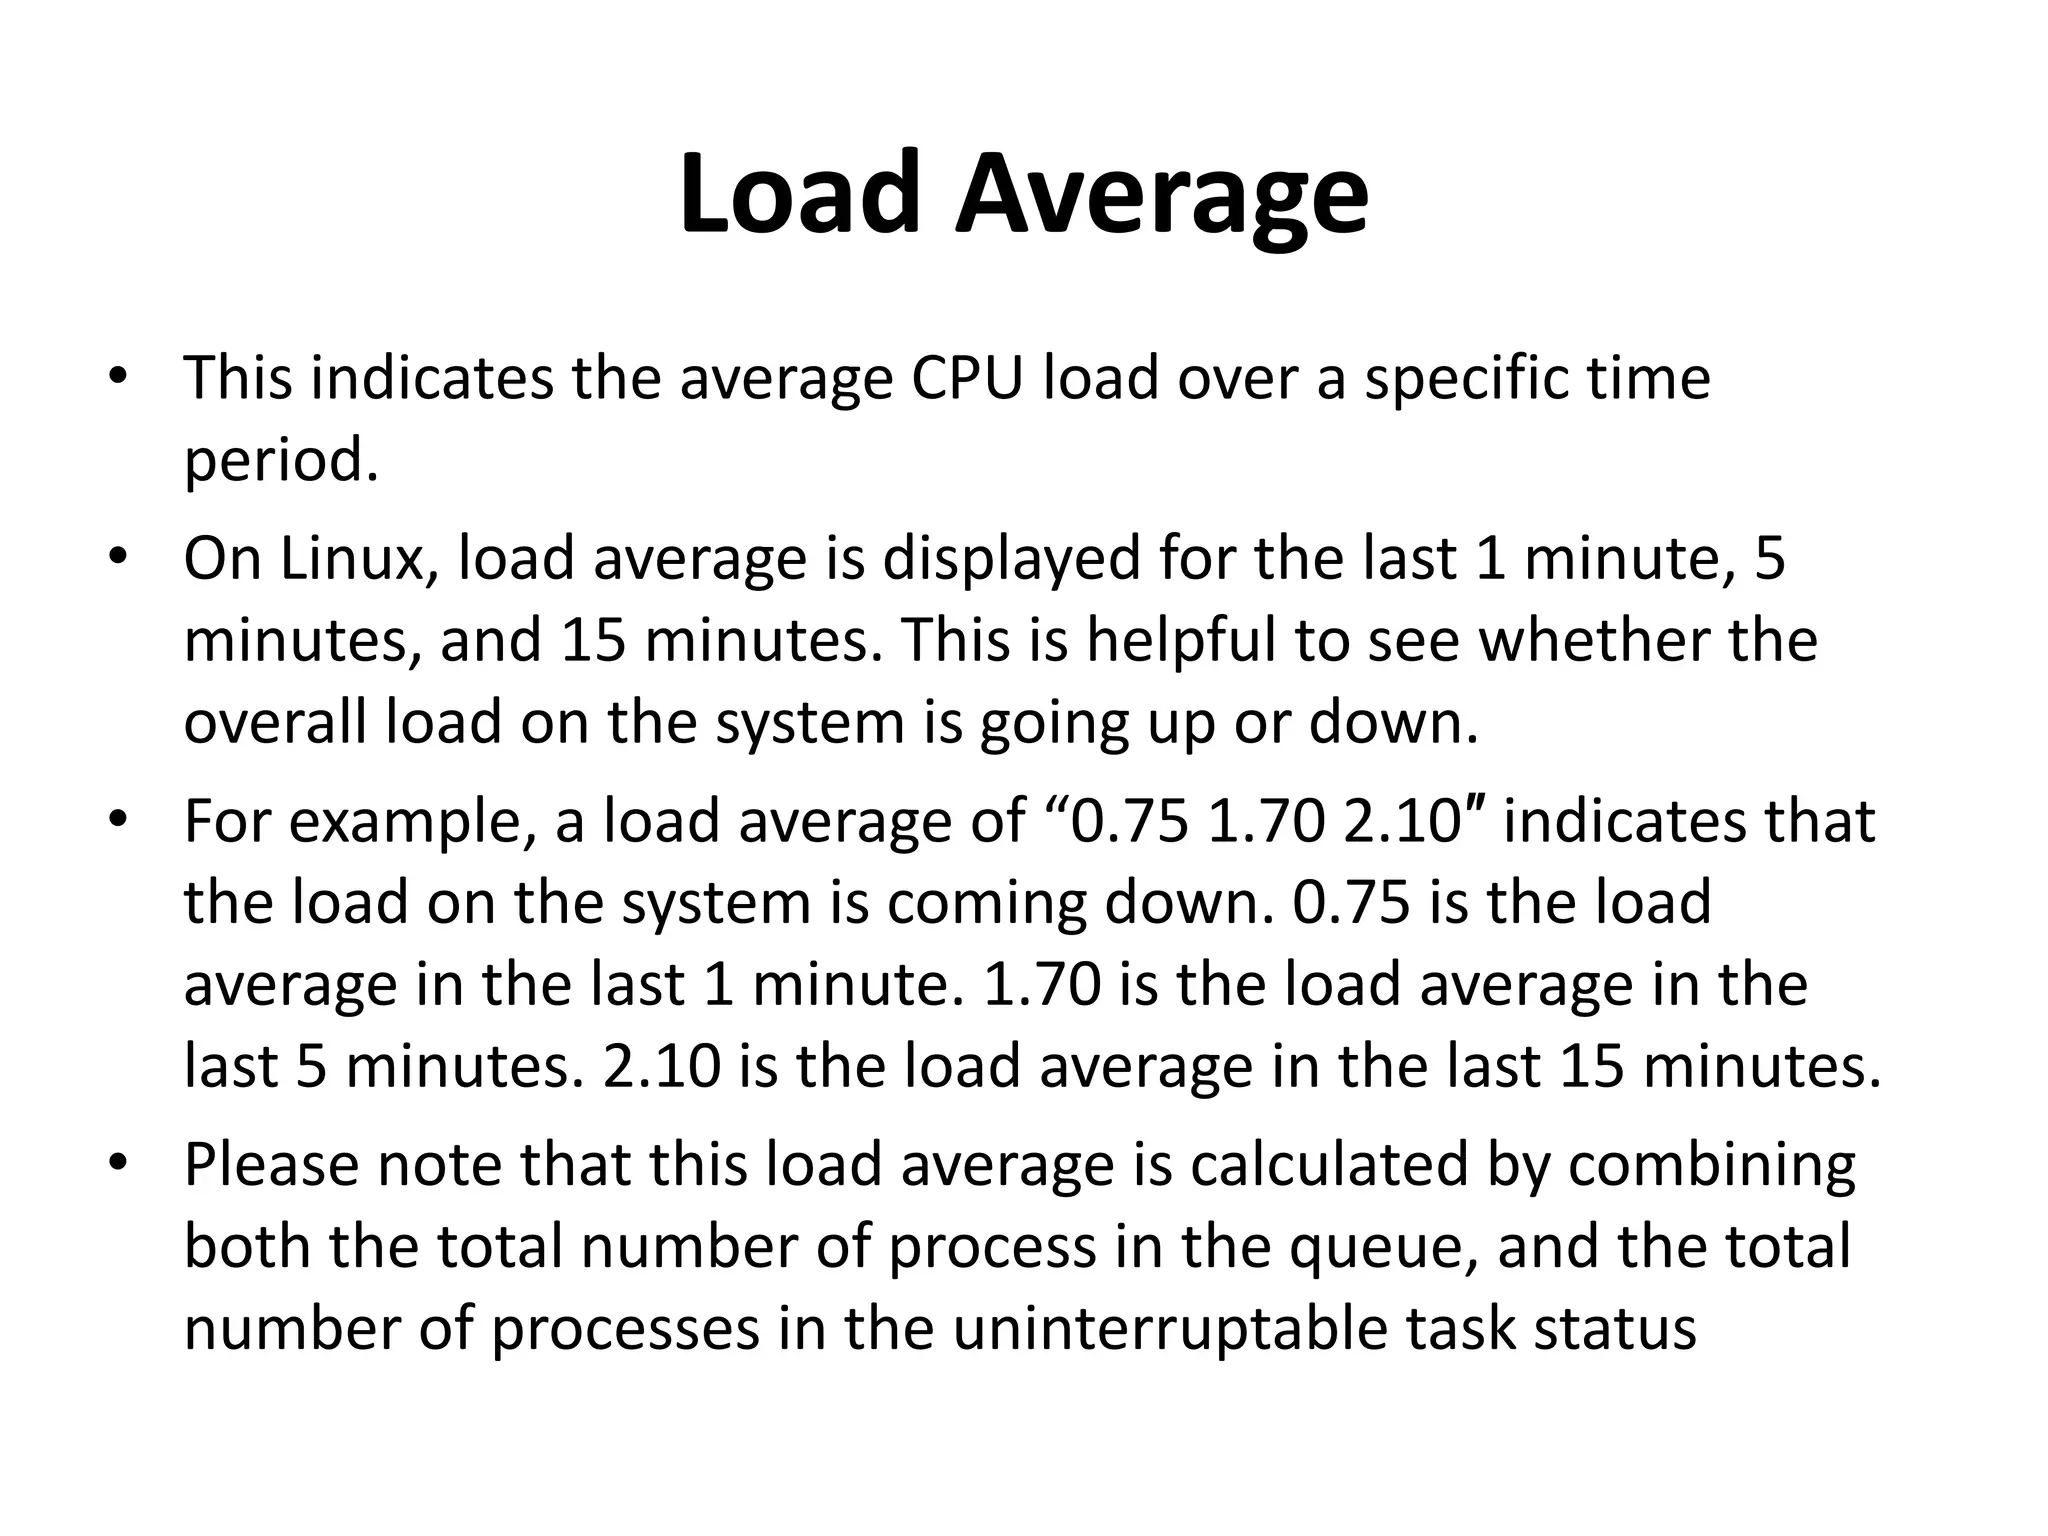
Load Average This indicates the average CPU load over a specific time period. On Linux, load average is displayed for the last 1 minute, 5 minutes, and 15 minutes. This is helpful to see whether the overall load on the system is going up or down. For example, a load average of “0.75 1.70 2.10″ indicates that the load on the system is coming down. 0.75 is the load average in the last 1 minute. 1.70 is the load average in the last 5 minutes. 2.10 is the load average in the last 15 minutes. Please note that this load average is calculated by combining both the total number of process in the queue, and the total number of processes in the uninterruptable task status
Network Monitor total number of packets (and bytes) received/sent through the interface, number of packets dropped, etc.,
I/OI/O wait is the amount of time CPU is waiting for I/O. If you see consistent high i/o wait on you system, it indicates a problem in the disk subsystem. You should also monitor reads/second, and writes/second. This is measured in blocks. i.e number of blocks read/write per second. These are also referred as bi and bo (block in and block out). tps indicates total transactions per seconds, which is sum of rtps (read transactions per second) and wtps (write transactions per seconds).
Memory As you know, RAM is your physical memory. If you have 4GB RAM installed on your system, you have 4GB of physical memory. Virtual memory = Swap space available on the disk + Physical memory. The virtual memory contains both user space and kernel space. Using either 32-bit or 64-bit system makes a big difference in determining how much memory a process can utilize. On a 32-bit system a process can only access a maximum of 4GB virtual memory. On a 64-bit system there is no such limitation. The unused RAM will be used as file system cache by the kernel. The Linux system will swap when it needs more memory. i.e when it needs more memory than the physical memory. When it swaps, it writes the least used memory pages from the physical memory to the swap space on the disk. Lot of swapping can cause performance issues, as the disk is much slower than the physical memory, and it takes time to swap the memory pages from RAM to disk.
Questions?

Linux optimization strategy plan by shiv

  • 1.
    Linux Optimization StrategyPlanShivPrincipal Data Architect-InsigniaPhone: +919900093046Email: mailtoshivaiyer@gmail.com
  • 2.
    The 4 stepapproach to identify and solve a performance issueStep 1 – Understand (and reproduce) the problemStep 2 – Monitor and collect dataStep 3 – Eliminate and narrow down issuesStep 4 – One change at a time
  • 3.
    Linux Optimization StrategyPlan CPU Memory I/O Network
  • 4.
    CPUcontext switchrun queuecpuutilizationload average.
  • 5.
    Context Switch WhenCPU switches from one process (or thread) to another, it is called as context switch. When a process switch happens, kernel stores the current state of the CPU (of a process or thread) in the memory. Kernel also retrieves the previously stored state (of a process or thread) from the memory and puts it in the CPU. Context switching is very essential for multitasking of the CPU. However, a higher level of context switching can cause performance issues.
  • 6.
    Run QueueRun queueindicates the total number of active processes in the current queue for CPU. When CPU is ready to execute a process, it picks it up from the run queue based on the priority of the process. Please note that processes that are in sleep state, or i/o wait state are not in the run queue. So, a higher number of processes in the run queue can cause performance issues.
  • 7.
    CPU Utilization Thisindicates how much of the CPU is currently getting used. This is fairly straight forward, and you can view the CPU utilization from the top command. 100% CPU utilization means the system is fully loaded. So, a higher %age of CPU utilization will cause performance issues.
  • 8.
    Load Average Thisindicates the average CPU load over a specific time period. On Linux, load average is displayed for the last 1 minute, 5 minutes, and 15 minutes. This is helpful to see whether the overall load on the system is going up or down. For example, a load average of “0.75 1.70 2.10″ indicates that the load on the system is coming down. 0.75 is the load average in the last 1 minute. 1.70 is the load average in the last 5 minutes. 2.10 is the load average in the last 15 minutes. Please note that this load average is calculated by combining both the total number of process in the queue, and the total number of processes in the uninterruptable task status
  • 9.
    Network Monitor totalnumber of packets (and bytes) received/sent through the interface, number of packets dropped, etc.,
  • 10.
    I/OI/O wait isthe amount of time CPU is waiting for I/O. If you see consistent high i/o wait on you system, it indicates a problem in the disk subsystem. You should also monitor reads/second, and writes/second. This is measured in blocks. i.e number of blocks read/write per second. These are also referred as bi and bo (block in and block out). tps indicates total transactions per seconds, which is sum of rtps (read transactions per second) and wtps (write transactions per seconds).
  • 11.
    Memory As youknow, RAM is your physical memory. If you have 4GB RAM installed on your system, you have 4GB of physical memory. Virtual memory = Swap space available on the disk + Physical memory. The virtual memory contains both user space and kernel space. Using either 32-bit or 64-bit system makes a big difference in determining how much memory a process can utilize. On a 32-bit system a process can only access a maximum of 4GB virtual memory. On a 64-bit system there is no such limitation. The unused RAM will be used as file system cache by the kernel. The Linux system will swap when it needs more memory. i.e when it needs more memory than the physical memory. When it swaps, it writes the least used memory pages from the physical memory to the swap space on the disk. Lot of swapping can cause performance issues, as the disk is much slower than the physical memory, and it takes time to swap the memory pages from RAM to disk.
  • 12.