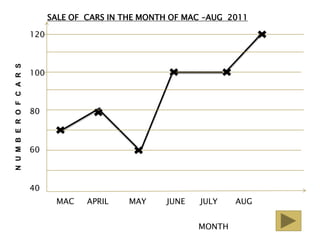
This line graph shows the number of cars sold each month from March to August 2011. The number of cars sold was highest in March at 120, and then declined each month until July, which had the lowest number of cars sold at 40. The number of cars sold increased slightly to 60 in August.