ROHIT GARG Page1 of 6
Quick Notes on Tableau
Tableau is a Business Intelligence tool used to analyze data visually. Using Tableau, users
can create shareable and interactive dashboards that show trends and variations in the form
of graphs and charts. It can connect to files, big data, and relational sources to obtain data
and process them, all at great ease.
Topics covered in this article:
What makes Tableau great? Functions
Design Flow Level of Detail Expressions
Data Types Sorting
Data Terms Filtering
Data Sources Context Filter
Custom View Groups
Extract Data Sets
Field Operations Crosstab
Data Blending Charts
Operators Dashboard
1. What makes Tableau great?
No prior technical knowledge is needed.
Connection to all kinds of data sources including MS Excel, web data, and
warehouses is possible.
It can produce interactive and visual presentations within seconds rather than months
and years.
The data visualization helps in business growth and profits.
It provides good business insights.
It is simple and easy to study and operate because of the simple drag and drop interface.
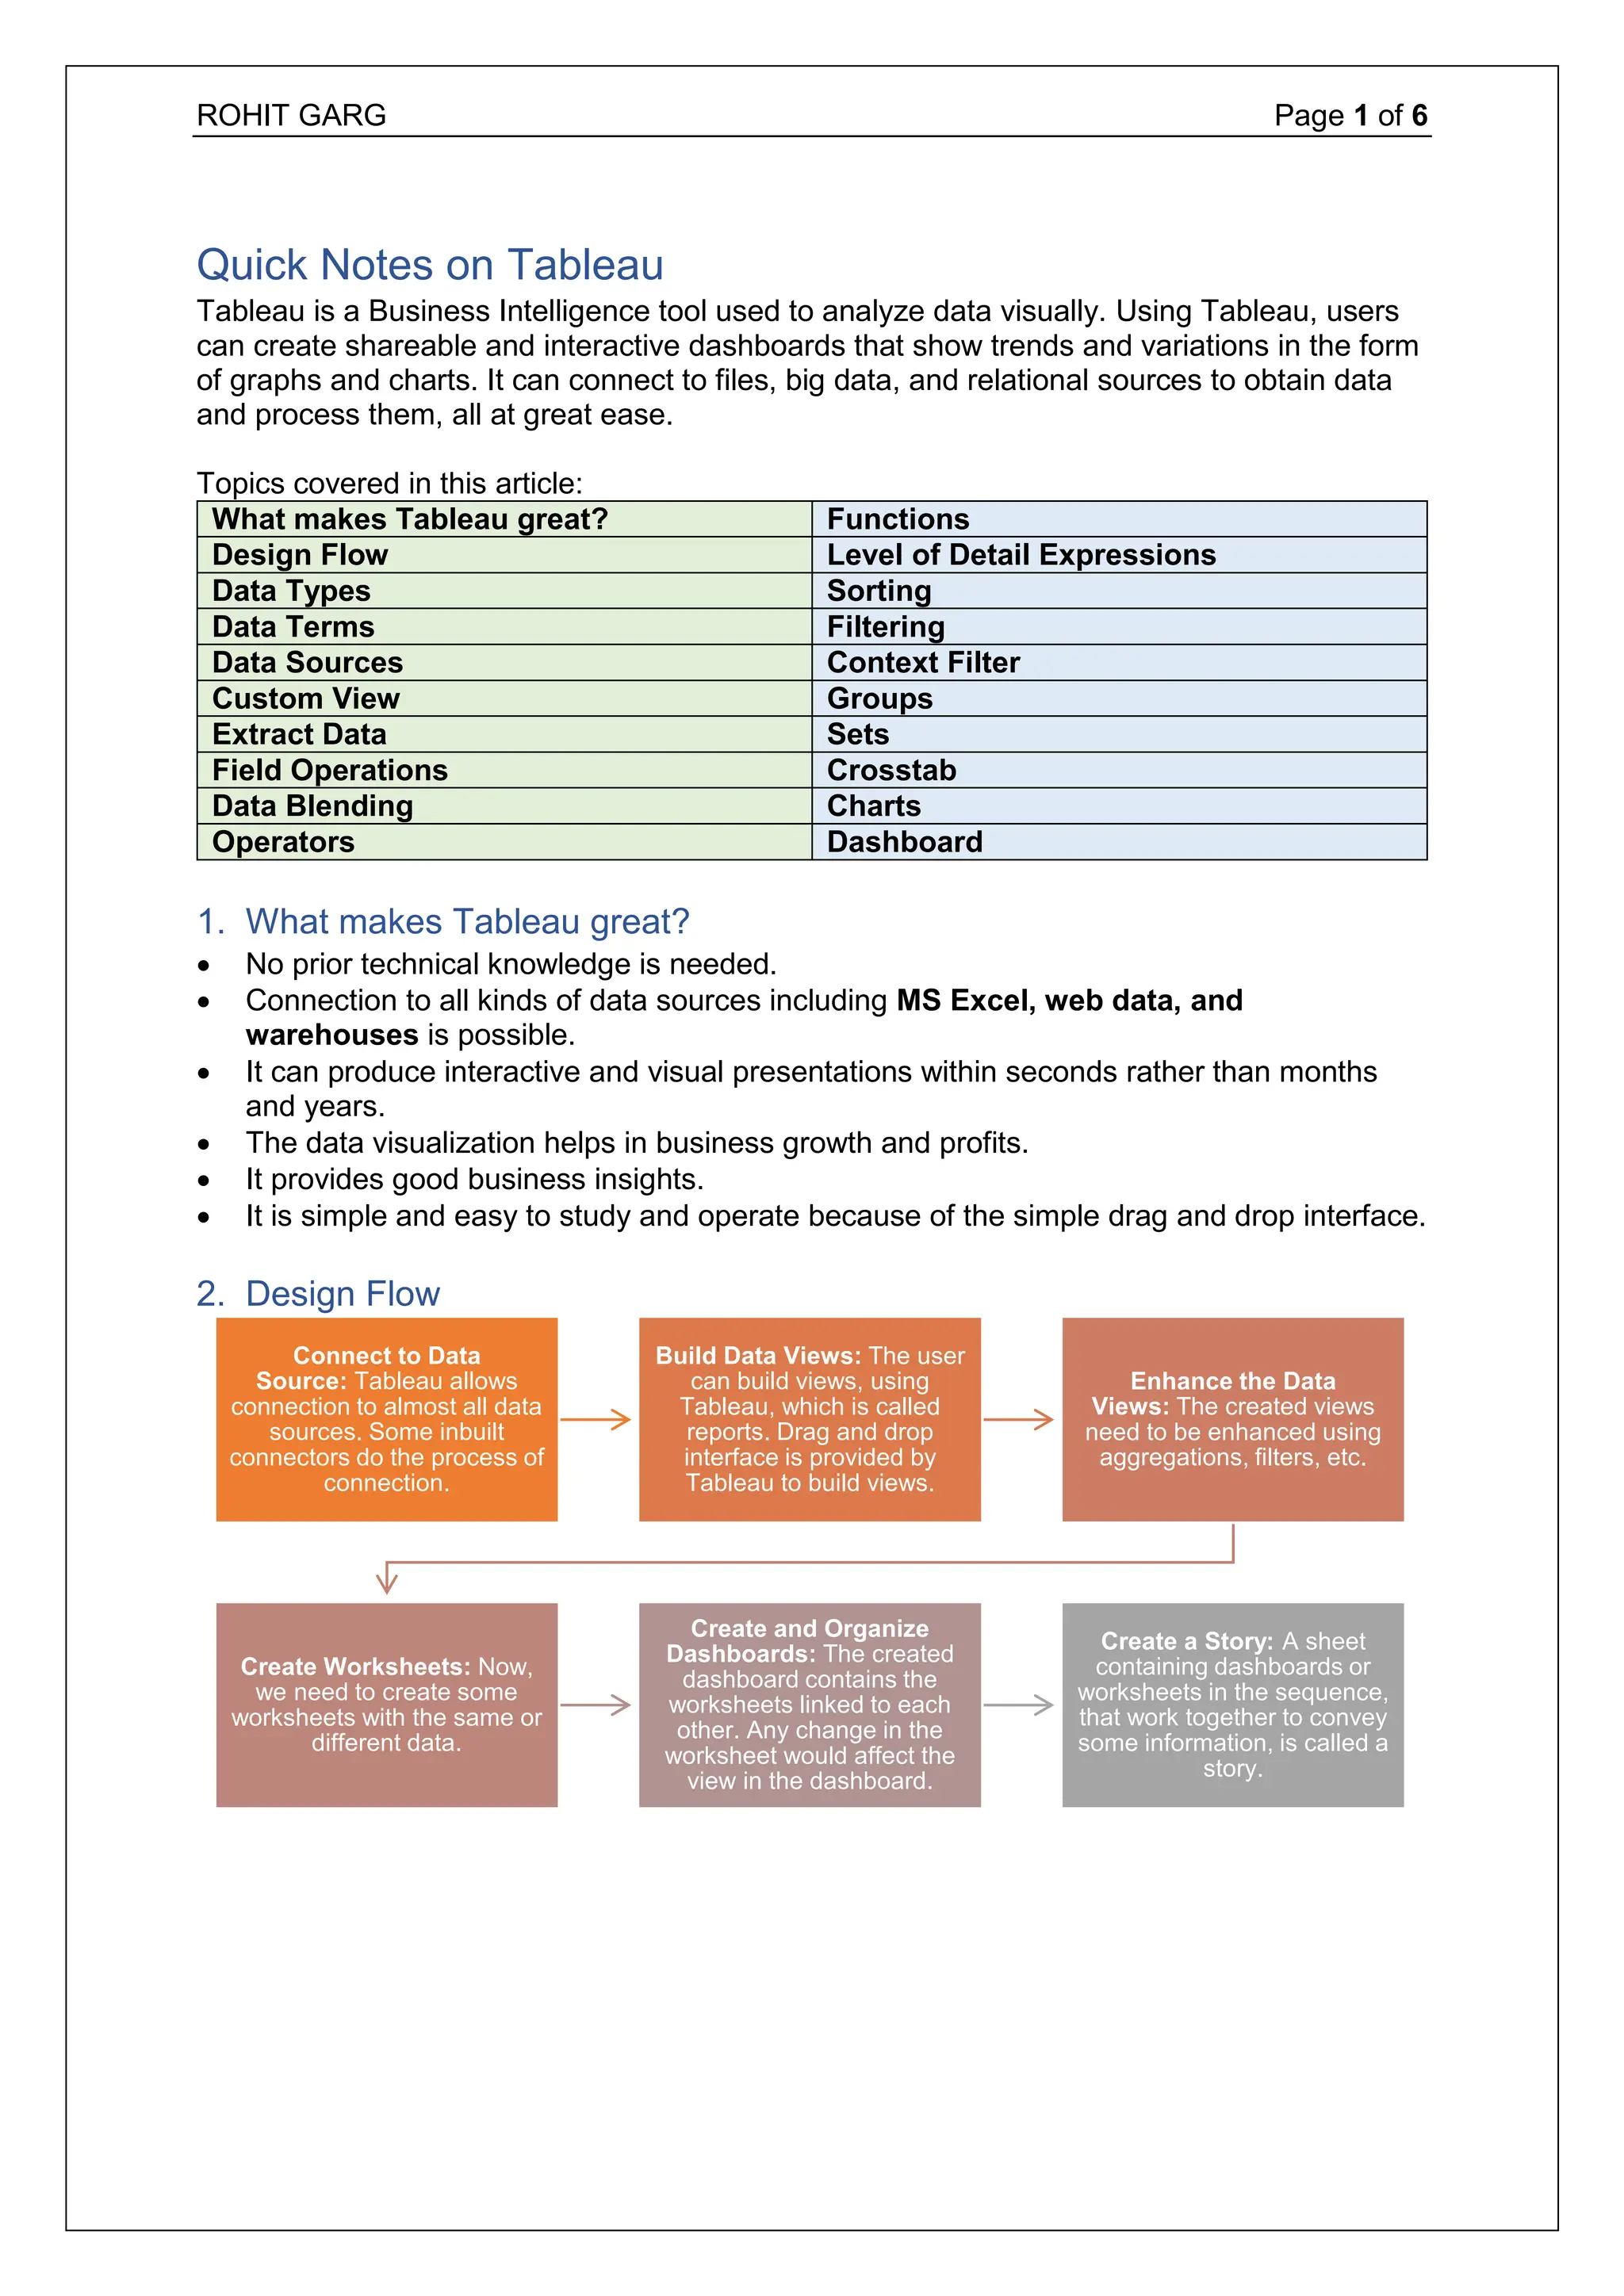
2. Design Flow
Connect to Data
Source: Tableau allows
connection to almost all data
sources. Some inbuilt
connectors do the process of
connection.
Build Data Views: The user
can build views, using
Tableau, which is called
reports. Drag and drop
interface is provided by
Tableau to build views.
Enhance the Data
Views: The created views
need to be enhanced using
aggregations, filters, etc.
Create Worksheets: Now,
we need to create some
worksheets with the same or
different data.
Create and Organize
Dashboards: The created
dashboard contains the
worksheets linked to each
other. Any change in the
worksheet would affect the
view in the dashboard.
Create a Story: A sheet
containing dashboards or
worksheets in the sequence,
that work together to convey
some information, is called a
story.
2.
ROHIT GARG Page2 of 6
3. Data Types
Data type Description
STRING A sequence of characters within single quotes. Single quotes are
added by typing it twice.
NUMBER Integers or floating point numbers
BOOLEAN Logical Values - True or False
DATE &
DATETIME
Almost all date formats supported. "#" should be put for taking the
string as a date.
4. Data Terms
Terms Meaning
Alias An alternate name to a dimension member or a field.
Bin A user-defined grouping of measures within the data source.
Calculated Field A new field created by a formula to modify an existing field.
Crosstab A text table view.
5. Data Sources
Tableau supports almost all the popular data sources. Some of them include:
File Systems: CSV, Excel, etc.
Rational Databases: Oracle, SQL Server, DB2, etc.
Cloud Systems: Windows Azure, Google BigQuery, etc.
Other sources that use ODBC.
6. Custom View
The custom data view is used to extend the normal data view with some additional features.
Some of the commonly used custom views include:
Drill Down View: We may need to know the result of previous or next level of
aggregation in case of fields that are a part of a hierarchy. Right-click a table header and
click Drill Down from the context menu to drill up and down.
Swapping Dimensions: We can create a new view from an existing view. Swapping the
position of the dimensions will do the task. You can perform this task by clicking on the
vertical line present at the end of the category column and dragging it to the segment
column.
7. Extract Data
A subset of data can be created using data extraction. The data extract feature of Tableau is
used to access data offline.
Create an extract: An extract can be created by clicking on the Extract Data option
from Data menu.
Apply extract filters: Filters can be created to extract a subset of data from the data
source. For doing this, click on the Select from list option from the filter option and tick
mark the checkbox for which you need the data.
Add New Data to an Extract: To add more data to an already created extract,
click Data >> Extract >> Extract Data from File and then browse the file and
click OK button.
Extract History: Extract history can be seen by clicking on Extract
History from Datamenu.
3.
ROHIT GARG Page3 of 6
8. Field Operations
Many features are provided by Tableau to manipulate the fields present in the data plane.
Some of the important field operations are discussed below:
Add Fields to Worksheet: To add fields to worksheet click on the right mouse button
and then click on the Add to Sheet option.
Combine two Fields: You can create a combined field by clicking the right mouse
button and further choosing the Create Combined Field option from the Create menu.
The name of the created field will be the combination of the combined fields.
Search Fields: The search option is provided by Tableau to search names of the fields.
Reordering Fields: The position of fields can be changed by dragging them up or down.
9. Data Blending
Data blending feature is useful when we want to analyze related data from multiple data
sources in a single view. It is a compelling feature in Tableau. Steps involved in Data
Blending:
Preparing data for blending: Click Data >> New Data Source and then choose the data
source.
Adding Secondary Data Source: For adding a secondary data source, follow the same
steps Data >> New Data Source and then choose the data source.
Data Blending: Now, it is possible to integrate the data from the above sources.
10. Operators
Any symbol that tells the compiler to perform some mathematical or logical operations is
an operator.
Tableau supports different operators for creating formulas and calculated fields.
Different operators that are supported by Tableau include:
o General Operators (+, -)
o Arithmetic Operators (* ,/, %, ^)
o Comparison Operators (==, =, !=, <>, >, <)
o Logical Operators (AND, OR, NOT)
11. Functions
In Tableau, the calculations are applied to the fields being analyzed using the calculation
editor. Tableau has many inbuilt functions that help in creating expressions. Some of them
are discussed below:
Number Functions: They are used for numerical operations. They take only numerical
values as input. Examples of number functions include:
CEILING (number): Rounds the number to the nearest integer greater than or equal
to that value
POWER (number, power): Finds the power of the number
ROUND (number, [decimals]): Rounds the number to the nearest integer
Functions
String Functions: They are used for string manipulations.
LEN (string): Finds and returns the length of the string.
LTRIM (string): Returns the string with the leading spaces removed.
REPLACE (string, substring, replacement): Searches the substring in the string and
replaces it with the replacement string.
UPPER (string): Returns the string with all the characters in uppercase.
4.
ROHIT GARG Page4 of 6
Logical Functions: This evaluates the expression and gives a boolean output.
IFNULL (expression1, expression2): If the result is not null, it returns expression 1
else returns expression 2.
ISDATE (string): Returns true if the argument string can be converted to date else
return false.
MIN(expression): Returns minimum of expression across all records.
Date Functions: Tableau has a number of date functions.
DATEADD (date_part, increment, date): Returns the increment added to the date.
The date_part specifies the type of increment.
DATENAME (date_part, date, [start_of_week]): The date_part of date is returned as
a string. The start_of_week is an optional parameter.
DAY (date): Returns the integer value of the date.
NOW ( ): It returns the current date and time.
Aggregate Functions
AVG (expression): Given an expression, the average of all the numerical values in
the expression ignoring the null values is returned.
COUNT (expression): Given an expression, the number of items in the group other
than null values is returned.
MEDIAN (expression): Returns the median of all the numerical values across all the
records.
STDEV (expression): For a given expression, it returns the standard deviation of all
the values.
12. Level of Detail Expressions
Level of Detail expressions (also known as LOD expressions) allow you to compute values
at the data source level and the visualization level. However, LOD expressions give you
even more control over the level of granularity you want to compute. They can be performed
at a more granular level (INCLUDE), a less granular level (EXCLUDE), or an entirely
independent level (FIXED). Types of LOD Expressions:
FIXED LOD Expressions: It calculates values using specified dimensions without
having any reference to other expressions in the view.
INCLUDE LOD Expressions: In addition to the expressions in the view, it calculates
values using specified dimensions.
EXCLUDE LOD Expressions: It subtracts the dimensions from the view level.
13. Sorting
Sorting is an important feature of data analysis. Tableau allows sorting data in the fields,
called as dimensions. There are two types of sorting in Tableau:
Computed Sorting: In this sorting, select the field to be sorted and then apply sort using
the Sort dialog box.
Manual Sorting: Here, you need to manually position the fields by dragging them one
after the other.
14. Filtering
Filtering is the process of removing a value or a range of values from the result set.
Tableau supports both simple filters as well as context-based or advanced calculation filters.
There are three types of filters in Tableau. They are:
Filter Dimensions: Filter applied to dimensional fields
Filter Measures: Filter applied in measure fields
Filter Dates: Filter applied on date fields
5.
ROHIT GARG Page5 of 6
15. Context Filter
There are cases where we want a process the records returned by another filter.
Here, the second filter is called dependent filter since it processes, the data passed through
the context filter. Purposes of Context Filters:
Improves performance
Creates a dependent numerical or top N filter
16. Groups
Tableau allows creating groups to combine the related members in a field.
Groups help us to correct errors and answer "what if" questions.
After creating a group in Tableau, you still have an option to group all the remaining
members in a group called Other Group. Steps involved in creating Other Group include:
You can make changes to the added group. The changes may be: Adding or removing
group members, creating new groups, changing the default group names and changing
the names of grouped field.
17. Sets
A custom field that defines a subset of data on some conditions is called a set. It can be
used to compare and ask questions about the subsets of the data.
Creating a Set
Right-click a field under the Dimensions in the Data pane and then select Create>Set.
Configure the set you need in the Create Set dialog box that follows.
Then click on OK button.
Combine Sets
Select the two sets you want to combine, under the Sets in the Data pane.
Click on Create Combined Set after right-clicking the sets.
Now, you can see the Create Set dialog box. Give a name for the combined set, verify
the sets and select how to combine the two sets.
Finally, click on OK button.
Editing Sets
Edit the values that it contains
Change the name of the set
18. Crosstab
A crosstab in Tableau is otherwise called Text Table. The crosstab consists of one or more
dimensions and one or more measures. It can perform various calculations on the values of
the measured field.
19. Charts
This section focuses on different kinds of charts in Tableau. The subtopics that will be
covered include:
Bar Chart
A rectangular bar with the value of a variable directly proportional to the length of the bar
is a bar chart. Different kinds of bar charts that can be created in Tableau includes:
6.
ROHIT GARG Page6 of 6
Bubble Chart
Data is represented as a cluster of circles in bubble charts. Each dimension is represented
as a circle while the values represent the size of the circle. The following kinds of bubble
charts can be created in Tableau:
Simple Bubble Chart
Bubble Chart with Measure Values
Bubble Chart with Measure Colors
Scatter Plot
A plot which has the points scattered in the Cartesian Plane is called a scatter plot. The
following video shows how to create scatter plots in Tableau.
Gantt Chart
Gantt Chart can be used to show the progress of the value of a resource or task for a
period of time.
Time is a very important field in the Gantt Chart.
In addition to the time dimension, the Gantt Chart takes at least a measure and a
dimension.
Histograms
Histograms represent the frequencies of values grouped into ranges.
Histograms are similar to bar charts except that they group the values in continuous
ranges.
Treemap
Data is represented as nested rectangles in Treemap.
The structure of the treemap is represented by the structure and color by the measure.
Bump Chart
Comparison of two dimensions, against each other for a single measure, is done using
a bump chart.
It is mainly useful to explore the changes in the rank over time, place or any other
dimension relevant to the analysis.
Bump chart can take two dimensions with any number of measures including zero.
Waterfall Chart
Waterfall charts can display the cumulative effect of positive and negative values
effectively.
It can display the start, the end and how the value reaches there incrementally.
This helps to find the difference between the values and the size of changes.
A dimension and a measure are needed to create a waterfall chart in Tableau.
20. Dashboard
A dashboard is a consolidated view of many worksheets and its related information in a
single place.
This helps in monitoring and comparing a variety of data simultaneously.
We can view different data views at once.
![ROHIT GARG Page 3 of 6
8. Field Operations
Many features are provided by Tableau to manipulate the fields present in the data plane.
Some of the important field operations are discussed below:
Add Fields to Worksheet: To add fields to worksheet click on the right mouse button
and then click on the Add to Sheet option.
Combine two Fields: You can create a combined field by clicking the right mouse
button and further choosing the Create Combined Field option from the Create menu.
The name of the created field will be the combination of the combined fields.
Search Fields: The search option is provided by Tableau to search names of the fields.
Reordering Fields: The position of fields can be changed by dragging them up or down.
9. Data Blending
Data blending feature is useful when we want to analyze related data from multiple data
sources in a single view. It is a compelling feature in Tableau. Steps involved in Data
Blending:
Preparing data for blending: Click Data >> New Data Source and then choose the data
source.
Adding Secondary Data Source: For adding a secondary data source, follow the same
steps Data >> New Data Source and then choose the data source.
Data Blending: Now, it is possible to integrate the data from the above sources.
10. Operators
Any symbol that tells the compiler to perform some mathematical or logical operations is
an operator.
Tableau supports different operators for creating formulas and calculated fields.
Different operators that are supported by Tableau include:
o General Operators (+, -)
o Arithmetic Operators (* ,/, %, ^)
o Comparison Operators (==, =, !=, <>, >, <)
o Logical Operators (AND, OR, NOT)
11. Functions
In Tableau, the calculations are applied to the fields being analyzed using the calculation
editor. Tableau has many inbuilt functions that help in creating expressions. Some of them
are discussed below:
Number Functions: They are used for numerical operations. They take only numerical
values as input. Examples of number functions include:
CEILING (number): Rounds the number to the nearest integer greater than or equal
to that value
POWER (number, power): Finds the power of the number
ROUND (number, [decimals]): Rounds the number to the nearest integer
Functions
String Functions: They are used for string manipulations.
LEN (string): Finds and returns the length of the string.
LTRIM (string): Returns the string with the leading spaces removed.
REPLACE (string, substring, replacement): Searches the substring in the string and
replaces it with the replacement string.
UPPER (string): Returns the string with all the characters in uppercase.](https://image.slidesharecdn.com/notesontableau-251226010142-075d36e0/75/Lecture-Notes-on-Tableau-for-Data-Analytics-3-2048.jpg)
![ROHIT GARG Page 4 of 6
Logical Functions: This evaluates the expression and gives a boolean output.
IFNULL (expression1, expression2): If the result is not null, it returns expression 1
else returns expression 2.
ISDATE (string): Returns true if the argument string can be converted to date else
return false.
MIN(expression): Returns minimum of expression across all records.
Date Functions: Tableau has a number of date functions.
DATEADD (date_part, increment, date): Returns the increment added to the date.
The date_part specifies the type of increment.
DATENAME (date_part, date, [start_of_week]): The date_part of date is returned as
a string. The start_of_week is an optional parameter.
DAY (date): Returns the integer value of the date.
NOW ( ): It returns the current date and time.
Aggregate Functions
AVG (expression): Given an expression, the average of all the numerical values in
the expression ignoring the null values is returned.
COUNT (expression): Given an expression, the number of items in the group other
than null values is returned.
MEDIAN (expression): Returns the median of all the numerical values across all the
records.
STDEV (expression): For a given expression, it returns the standard deviation of all
the values.
12. Level of Detail Expressions
Level of Detail expressions (also known as LOD expressions) allow you to compute values
at the data source level and the visualization level. However, LOD expressions give you
even more control over the level of granularity you want to compute. They can be performed
at a more granular level (INCLUDE), a less granular level (EXCLUDE), or an entirely
independent level (FIXED). Types of LOD Expressions:
FIXED LOD Expressions: It calculates values using specified dimensions without
having any reference to other expressions in the view.
INCLUDE LOD Expressions: In addition to the expressions in the view, it calculates
values using specified dimensions.
EXCLUDE LOD Expressions: It subtracts the dimensions from the view level.
13. Sorting
Sorting is an important feature of data analysis. Tableau allows sorting data in the fields,
called as dimensions. There are two types of sorting in Tableau:
Computed Sorting: In this sorting, select the field to be sorted and then apply sort using
the Sort dialog box.
Manual Sorting: Here, you need to manually position the fields by dragging them one
after the other.
14. Filtering
Filtering is the process of removing a value or a range of values from the result set.
Tableau supports both simple filters as well as context-based or advanced calculation filters.
There are three types of filters in Tableau. They are:
Filter Dimensions: Filter applied to dimensional fields
Filter Measures: Filter applied in measure fields
Filter Dates: Filter applied on date fields](https://image.slidesharecdn.com/notesontableau-251226010142-075d36e0/75/Lecture-Notes-on-Tableau-for-Data-Analytics-4-2048.jpg)


![ict_presentation_final_final_final[1].pptx](https://cdn.slidesharecdn.com/ss_thumbnails/ictpresentationfinalfinalfinal1-251230145259-2b4839bd-thumbnail.jpg?width=640&height=640&fit=bounds)


