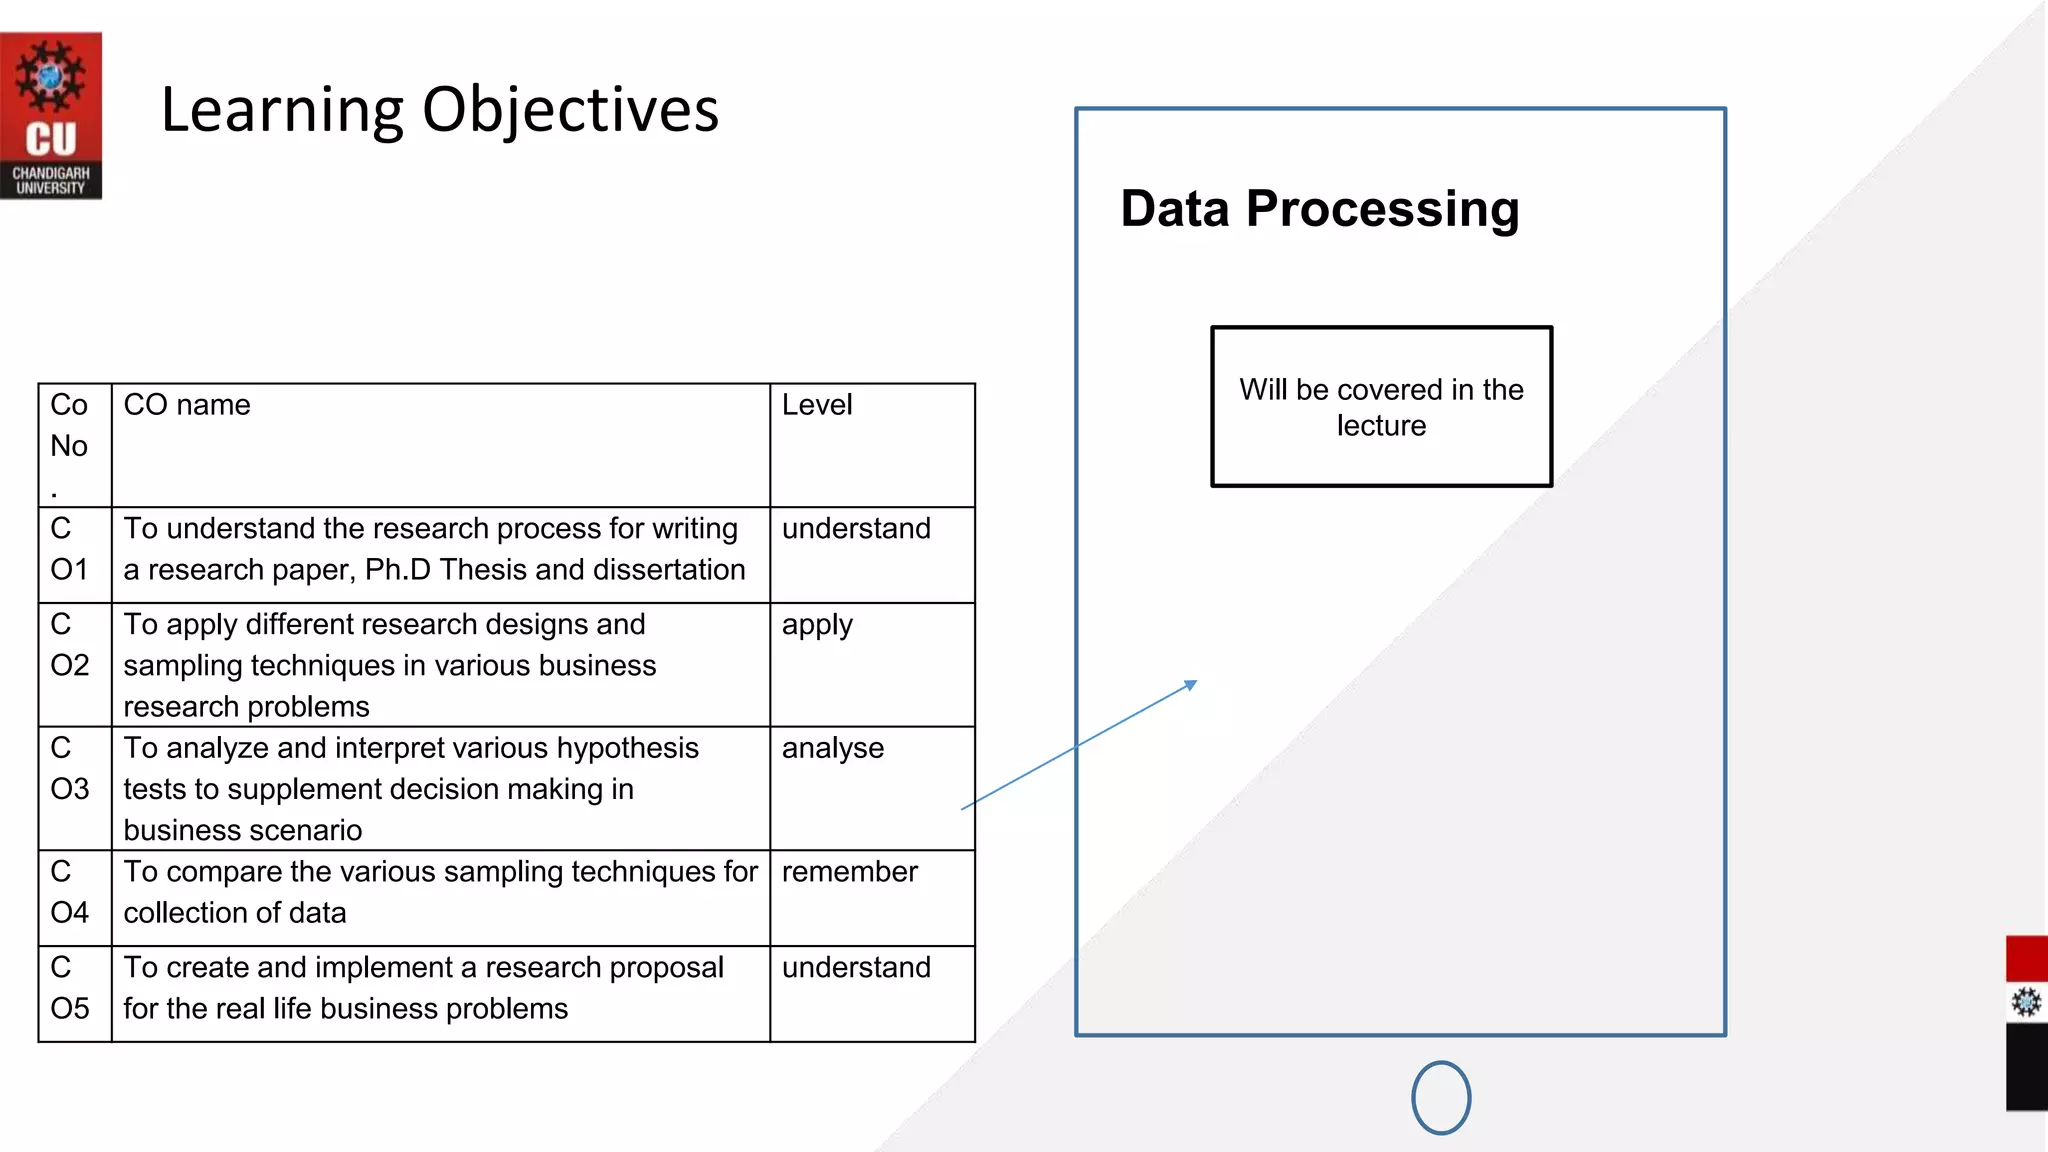
DISCOVER . LEARN . EMPOWER
UNIT-3 –Data
Processing and
Report Writing
INSTITUTE –University School of
Business
DEPARTMENT -Management
BUSINESS RESEARCH METHODS
Course Name: 21BAT-624
Dr Neha Singh
Assistant Professor
Chandigarh University
1
Learning Objectives
Data Processing
Will be covered in the
lecture
Co
No
.
CO name Level
C
O1
To understand the research process for writing
a research paper, Ph.D Thesis and dissertation
understand
C
O2
To apply different research designs and
sampling techniques in various business
research problems
apply
C
O3
To analyze and interpret various hypothesis
tests to supplement decision making in
business scenario
analyse
C
O4
To compare the various sampling techniques for
collection of data
remember
C
O5
To create and implement a research proposal
for the real life business problems
understand
Topic of discussion
• Data preparation
• Data Coding
• Data Tabulation
• Data Cleaning
3
Data Preparation Process
• Questionnaire Checking
• The first step of data preparation process is to check the questionnaire if they are
acceptable or not. This examination of all questionnaires for their completeness and
interviewing quality. A questionnaire may not be acceptable if;
• It is incomplete partially or fully,
• It answered by a person who has inadequate knowledge or does not qualify for the
participation.
• It is answered in such a way which gives the impression that the respondent could not
understand the questions.
4
Editing
• Editing of data is a process of examining the collected raw data to detect errors or
omissions and to correct these when possible. As a matter of fact, editing involves a
careful scrutiny of the completed questionnaires or schedules. Editing is done to assure
that the data are accurate, consistent with other facts gathered, uniformly entered, as
completed as possible and have been well arranged to facilitate coding and tabulation.
Two phases where editing can be done;
• - Field editing consists in the review of the reporting forms by the investigator for
completing what the latter has written in abbreviated or in illegible form at the time of
recording the respondent’s responses.
• - Central editing should take place when all forms or schedule have been completed and
returned to the office. This type of editing implies that all forms should get a thorough
editing by a single editor in a small study and by a team of editors in case of a large inquiry.
5
Coding
• Coding refers to the process of assigning numerical or other
symbols to answers so that the responses can be put into
limited number of categories or classes.
• Such classes should be appropriate to the research
problem under consideration.
• They must also posses the characteristic of exhaustiveness
and also that of mutual exclusively which means that a
specific answer can be place in one and only one cell in a
given category set.
6
Classification
• Most research studies result in a large volume of raw data which must be
reduced into homogeneous groups if we are to get meaningful
relationships. This fact necessitates classification of data which happens
to be the process of arranging data in groups or classes on the basis of
common characteristics. Classification can be one of the following two
types;
• Classification according to attributes: data are classified on the basis of
common characteristics which can either be descriptive (such as literacy,
sex, honesty, etc.) or numerical (such as weight, height, income, etc.).
• Classification according to class-intervals: data relating to income,
production, age, weight, etc. come under this category. Such data are
known as statistics of variables and are classified on the basis of class
intervals.
7
Tabulation
• When a mass of data has been assembled, it becomes necessary for the researcher to
arrange the same in some kind of concise and logical order. This procedure is referred to
as tabulation. Thus, tabulation is the process of summarizing raw data and displaying the
same in compact form for further analysis. Generally accepted principles of tabulation;
• Every table should have a clear, concise, and adequate title.
• Every table should be given a distinct number to facilitate easy reference.
• The unit for measurement under each heading or sub-heading must always be indicated.
• Sources or sources from where the data in the table have been obtained must be
indicated.
• Table should be made as logical, clear, accurate and simple as possible.
8
Graphical Representation
• Graphs help to understand the data easily. All statistical packages, MS Excel, and
OpenOffice.org offer a wide range of graphs. In case of qualitative (or categorized data),
most commom graphs are bar charts and pie charts.
• Bar Charts: a bar chart consists of a series of rectangles (or bars). The height of each
rectangle is determined by the frequency of that category.
• A line chart can also be plotted in this data by connecting the midpoints of each rectangle.
Line chart are useful when we wish to compare to data sets as we can overlap to line
charts.
• Pie Chart: a pie chart is used to emphasize relative proportion or shares of each category.
It’s a circular chart divided into sectors, illustrating relative frequencies. The relative
frequency in each category of sector is proportional to the arc length of that sector or the
area of that sector or the central angle of that sector.
9
Data Cleaning
• This includes checking the data for consistency and treatment for
missing value. Preliminary consistency checks are made in editing.
• Here we check the consistency in an extensive manner. Consistency
checks look for the data which are not consistent or outlines.
• Such data may either be discarded or replaced by the mean value.
• Missing values are the values which are unknown or not answered by
the respondent.
10
Data Adjusting
• Data adjusting is not always necessary but it may improve the quality of analysis sometimes.
This consists of following methods;
• Weight assigning: each respondent or case is assigned a weight to reflect its importance
relative to other respondents or cases. Using this method, the collected sample can be made a
stronger representative of a target population on specific characteristics.
• Variable Specification: This involves creating new variables or modifying existing variables. For
example, if the usefulness of a certain product is measured on 10 point scale, it may be
reduced on a 4 point scale- ‘very useful’, ‘useful’, ‘neutral’, ‘not useful’. Method of dummy
variables for respecifying categorical variables is also very popular.
• Scale Transformation: scale transformation is done to ensure the comparability with other
scales or to make the data suitable for analysis. Different type of characteristics are measured
on different scale. For example, attitude variables are measured on continuous scale, life
stytle variables are usually measured on a 5 point Likert scale.
11
12
Blackboard
Assessment Pattern
12
Components HT-1 HT-2 Assignment Surprise
Test
Business
Quiz
GD Forum Attendance Scaled
Marks
Max. Marks 10 10 6 4 4 4 2 40
References
• Textbooks / Reference Books
• T1 Cooper, D., Schindler, P. 2106. Business Research Methods, 9th Edition, Tata McGraw
Hill, India ISBN: 9781259001857.
• T2 Malhotra, N. 2110. Marketing Research: An Applied Orientation, 6th Edition, Pearson
Publication, India, ISBN: 9781292103129
• T3 Kothari, C. 2104. Research Methodology – Methods and Techniques, 2nd Edition, New
Age International, ISBN: 9788122424881
• R1 Nargundkar, R. 2102. Marketing Research, 4th Ed., Tata McGraw Hill, India, ISBN:
9780070221874
13
THANK YOU

Lecture 1- data preparation.pptx

  • 1.
    DISCOVER . LEARN. EMPOWER UNIT-3 –Data Processing and Report Writing INSTITUTE –University School of Business DEPARTMENT -Management BUSINESS RESEARCH METHODS Course Name: 21BAT-624 Dr Neha Singh Assistant Professor Chandigarh University 1
  • 2.
    Learning Objectives Data Processing Willbe covered in the lecture Co No . CO name Level C O1 To understand the research process for writing a research paper, Ph.D Thesis and dissertation understand C O2 To apply different research designs and sampling techniques in various business research problems apply C O3 To analyze and interpret various hypothesis tests to supplement decision making in business scenario analyse C O4 To compare the various sampling techniques for collection of data remember C O5 To create and implement a research proposal for the real life business problems understand
  • 3.
    Topic of discussion •Data preparation • Data Coding • Data Tabulation • Data Cleaning 3
  • 4.
    Data Preparation Process •Questionnaire Checking • The first step of data preparation process is to check the questionnaire if they are acceptable or not. This examination of all questionnaires for their completeness and interviewing quality. A questionnaire may not be acceptable if; • It is incomplete partially or fully, • It answered by a person who has inadequate knowledge or does not qualify for the participation. • It is answered in such a way which gives the impression that the respondent could not understand the questions. 4
  • 5.
    Editing • Editing ofdata is a process of examining the collected raw data to detect errors or omissions and to correct these when possible. As a matter of fact, editing involves a careful scrutiny of the completed questionnaires or schedules. Editing is done to assure that the data are accurate, consistent with other facts gathered, uniformly entered, as completed as possible and have been well arranged to facilitate coding and tabulation. Two phases where editing can be done; • - Field editing consists in the review of the reporting forms by the investigator for completing what the latter has written in abbreviated or in illegible form at the time of recording the respondent’s responses. • - Central editing should take place when all forms or schedule have been completed and returned to the office. This type of editing implies that all forms should get a thorough editing by a single editor in a small study and by a team of editors in case of a large inquiry. 5
  • 6.
    Coding • Coding refersto the process of assigning numerical or other symbols to answers so that the responses can be put into limited number of categories or classes. • Such classes should be appropriate to the research problem under consideration. • They must also posses the characteristic of exhaustiveness and also that of mutual exclusively which means that a specific answer can be place in one and only one cell in a given category set. 6
  • 7.
    Classification • Most researchstudies result in a large volume of raw data which must be reduced into homogeneous groups if we are to get meaningful relationships. This fact necessitates classification of data which happens to be the process of arranging data in groups or classes on the basis of common characteristics. Classification can be one of the following two types; • Classification according to attributes: data are classified on the basis of common characteristics which can either be descriptive (such as literacy, sex, honesty, etc.) or numerical (such as weight, height, income, etc.). • Classification according to class-intervals: data relating to income, production, age, weight, etc. come under this category. Such data are known as statistics of variables and are classified on the basis of class intervals. 7
  • 8.
    Tabulation • When amass of data has been assembled, it becomes necessary for the researcher to arrange the same in some kind of concise and logical order. This procedure is referred to as tabulation. Thus, tabulation is the process of summarizing raw data and displaying the same in compact form for further analysis. Generally accepted principles of tabulation; • Every table should have a clear, concise, and adequate title. • Every table should be given a distinct number to facilitate easy reference. • The unit for measurement under each heading or sub-heading must always be indicated. • Sources or sources from where the data in the table have been obtained must be indicated. • Table should be made as logical, clear, accurate and simple as possible. 8
  • 9.
    Graphical Representation • Graphshelp to understand the data easily. All statistical packages, MS Excel, and OpenOffice.org offer a wide range of graphs. In case of qualitative (or categorized data), most commom graphs are bar charts and pie charts. • Bar Charts: a bar chart consists of a series of rectangles (or bars). The height of each rectangle is determined by the frequency of that category. • A line chart can also be plotted in this data by connecting the midpoints of each rectangle. Line chart are useful when we wish to compare to data sets as we can overlap to line charts. • Pie Chart: a pie chart is used to emphasize relative proportion or shares of each category. It’s a circular chart divided into sectors, illustrating relative frequencies. The relative frequency in each category of sector is proportional to the arc length of that sector or the area of that sector or the central angle of that sector. 9
  • 10.
    Data Cleaning • Thisincludes checking the data for consistency and treatment for missing value. Preliminary consistency checks are made in editing. • Here we check the consistency in an extensive manner. Consistency checks look for the data which are not consistent or outlines. • Such data may either be discarded or replaced by the mean value. • Missing values are the values which are unknown or not answered by the respondent. 10
  • 11.
    Data Adjusting • Dataadjusting is not always necessary but it may improve the quality of analysis sometimes. This consists of following methods; • Weight assigning: each respondent or case is assigned a weight to reflect its importance relative to other respondents or cases. Using this method, the collected sample can be made a stronger representative of a target population on specific characteristics. • Variable Specification: This involves creating new variables or modifying existing variables. For example, if the usefulness of a certain product is measured on 10 point scale, it may be reduced on a 4 point scale- ‘very useful’, ‘useful’, ‘neutral’, ‘not useful’. Method of dummy variables for respecifying categorical variables is also very popular. • Scale Transformation: scale transformation is done to ensure the comparability with other scales or to make the data suitable for analysis. Different type of characteristics are measured on different scale. For example, attitude variables are measured on continuous scale, life stytle variables are usually measured on a 5 point Likert scale. 11
  • 12.
    12 Blackboard Assessment Pattern 12 Components HT-1HT-2 Assignment Surprise Test Business Quiz GD Forum Attendance Scaled Marks Max. Marks 10 10 6 4 4 4 2 40
  • 13.
    References • Textbooks /Reference Books • T1 Cooper, D., Schindler, P. 2106. Business Research Methods, 9th Edition, Tata McGraw Hill, India ISBN: 9781259001857. • T2 Malhotra, N. 2110. Marketing Research: An Applied Orientation, 6th Edition, Pearson Publication, India, ISBN: 9781292103129 • T3 Kothari, C. 2104. Research Methodology – Methods and Techniques, 2nd Edition, New Age International, ISBN: 9788122424881 • R1 Nargundkar, R. 2102. Marketing Research, 4th Ed., Tata McGraw Hill, India, ISBN: 9780070221874 13
  • 14.