This document discusses various metrics and factors for measuring software quality. It describes McCall's quality factors for product operation, product revision, and product transition. It also discusses FURPS and ISO 9126 quality factors. The document outlines the measurement process and describes technical metric formulation. It provides examples of representative analysis, design, testing, and maintenance metrics.

![21
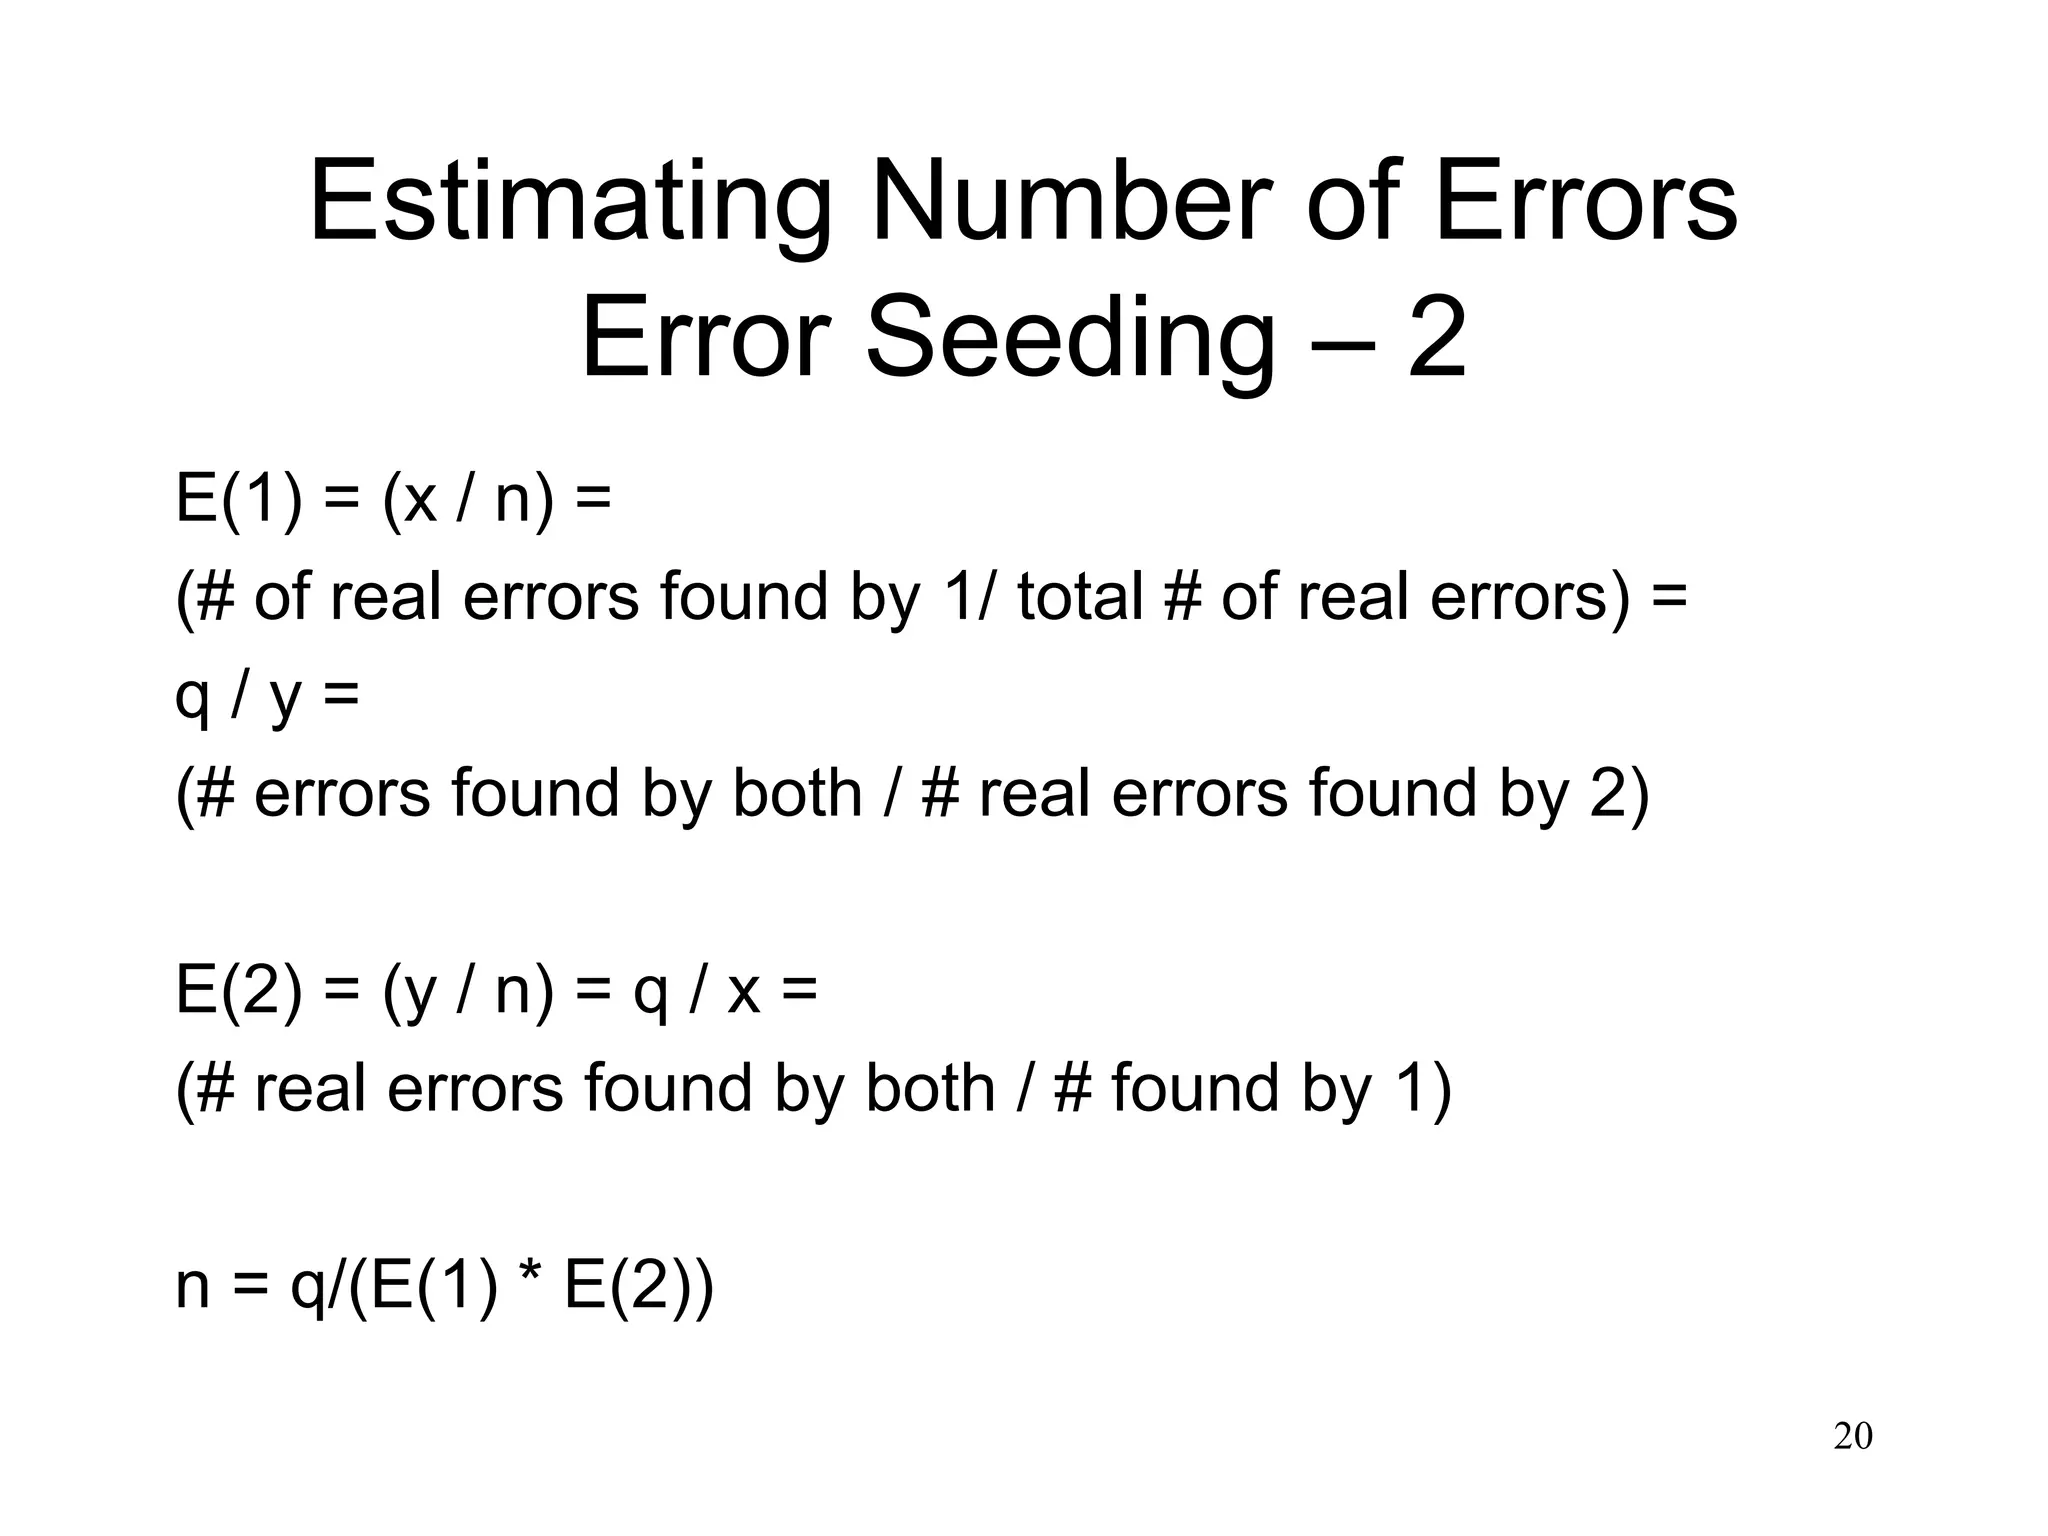
Estimating Number of Errors
Error Seeding – 3
Assume
x = 25
y = 30
q = 15
E(1) = (15 / 30) = .5
E(2) = (15 / 25) = .6
n = [15 / (.5)(.6)] = 50 errors](https://image.slidesharecdn.com/lec27-230404175501-32b47cb1/75/lec27-ppt-21-2048.jpg)
![22
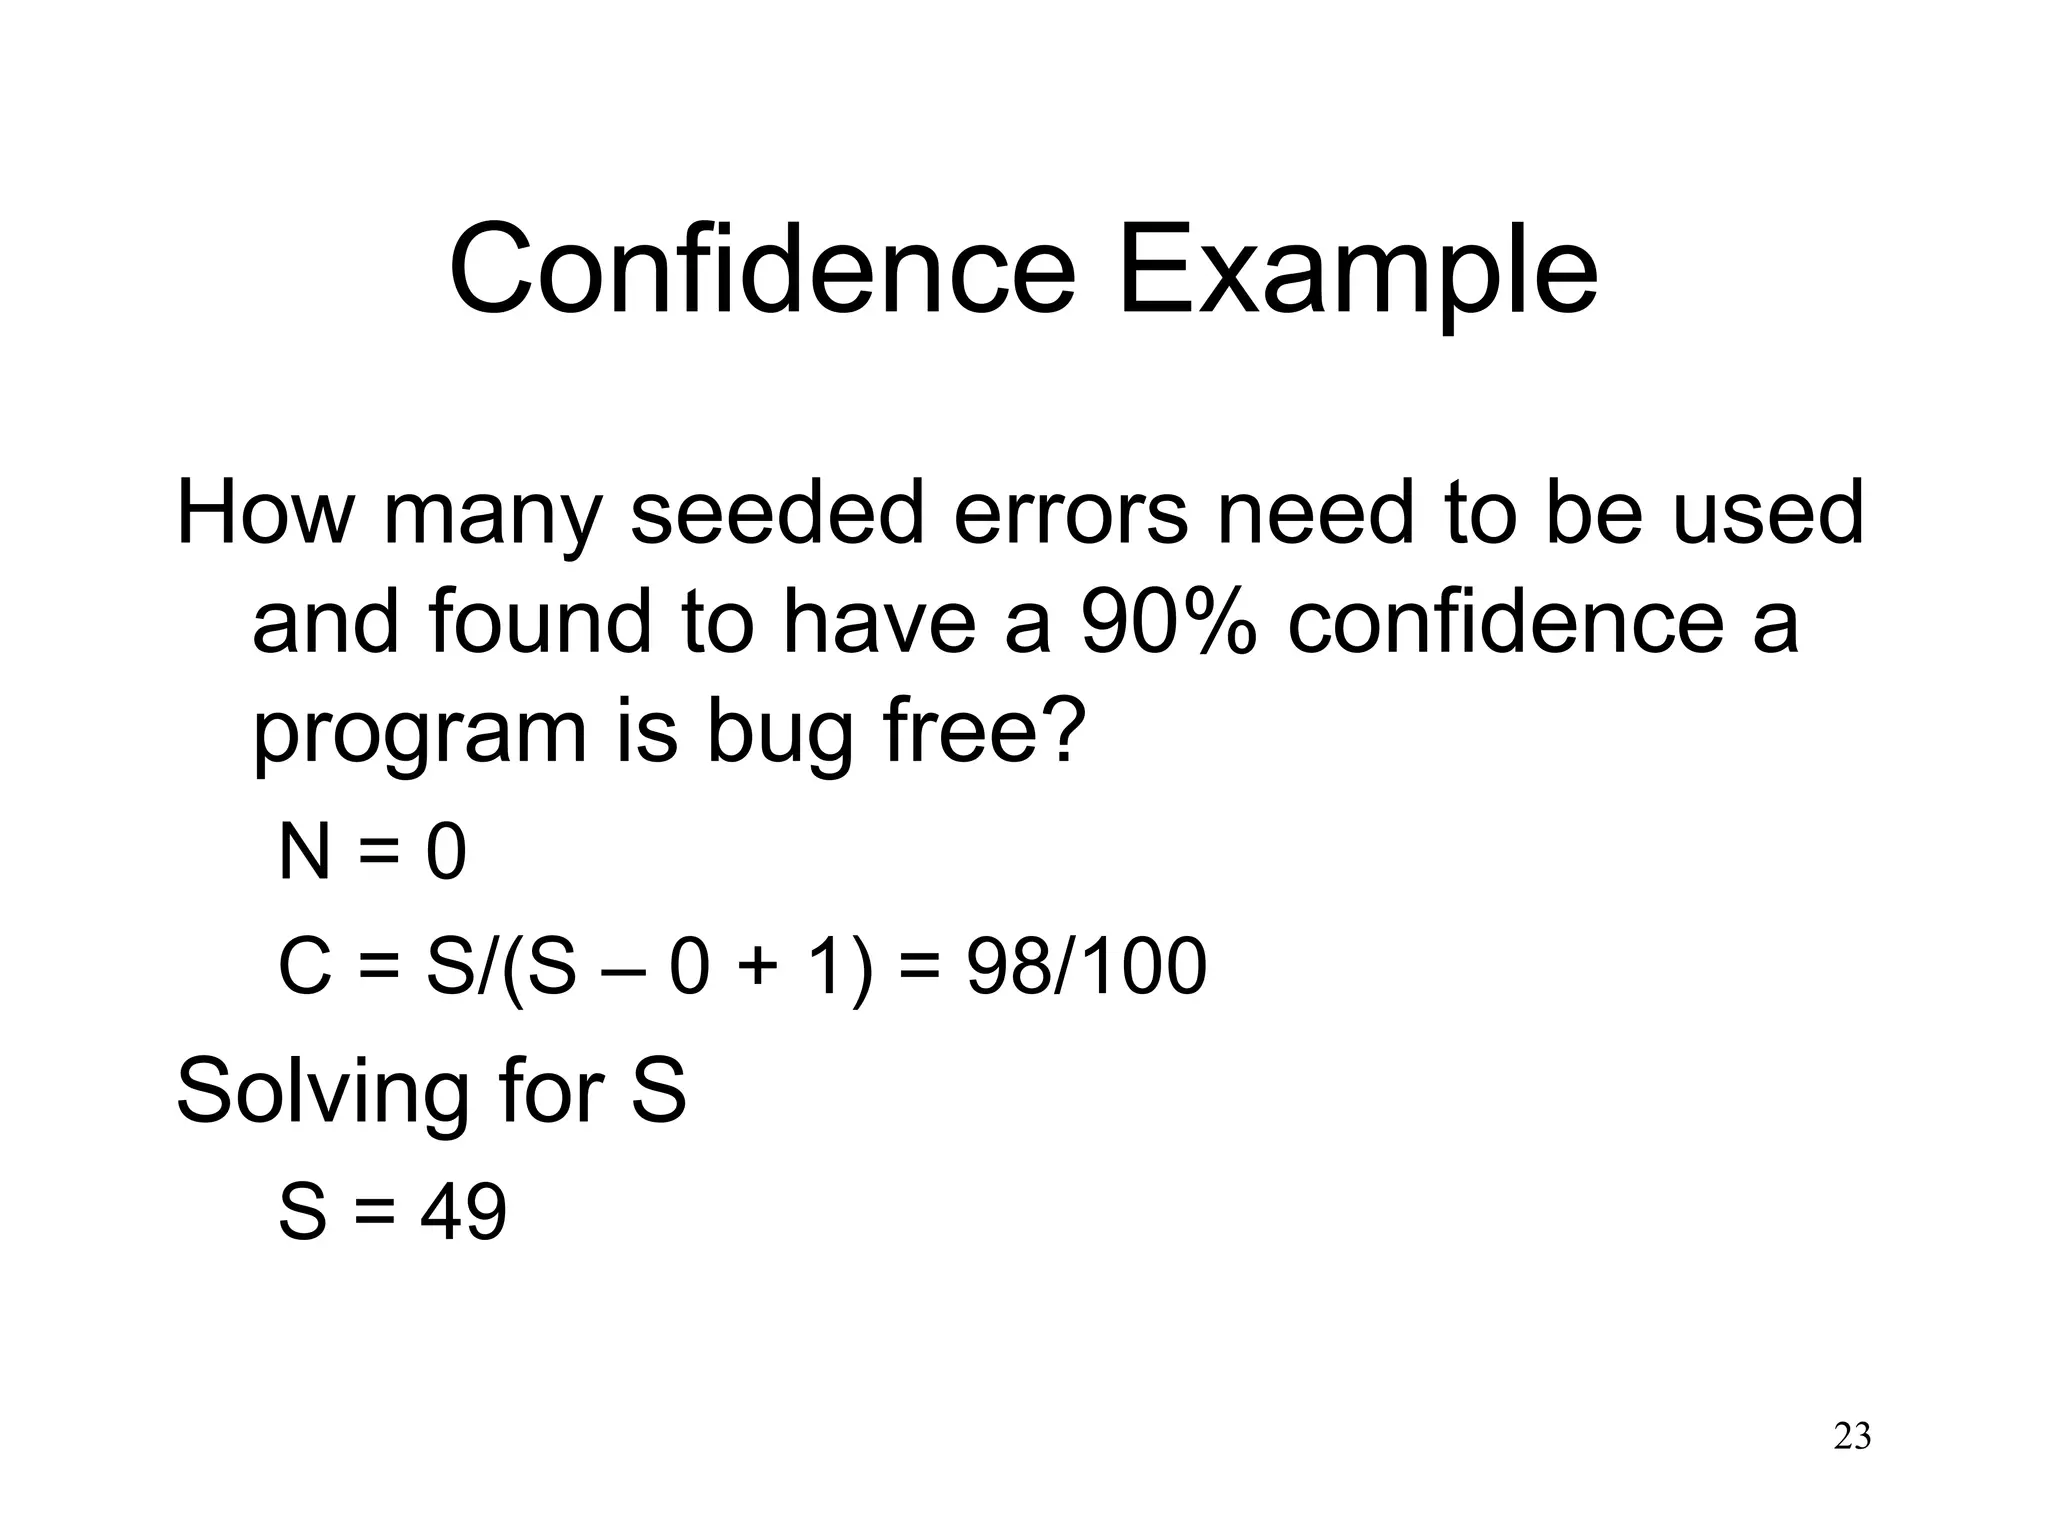
Software Confidence
S = # of seeded errors.
N = # of actual errors.
C (confidence level) = 1 if n > N
C (confidence level) =
[S / (S – N + 1)] if n <= N
Example: N = 0 and S = 10
C = 10/(10 – 0 + 1) = 10/11 91%](https://image.slidesharecdn.com/lec27-230404175501-32b47cb1/75/lec27-ppt-22-2048.jpg)
![25
Maintenance Metrics
Software Maturity Index
SMI = [Mt = (Fa + Fc + Fd)]/Mt
Mt = number of modules in current release.
Fa = modules added.
Fc = modules changed.
Fd = modules deleted.
• SMI approaches 1.0 as product begins to
stabilize](https://image.slidesharecdn.com/lec27-230404175501-32b47cb1/75/lec27-ppt-25-2048.jpg)