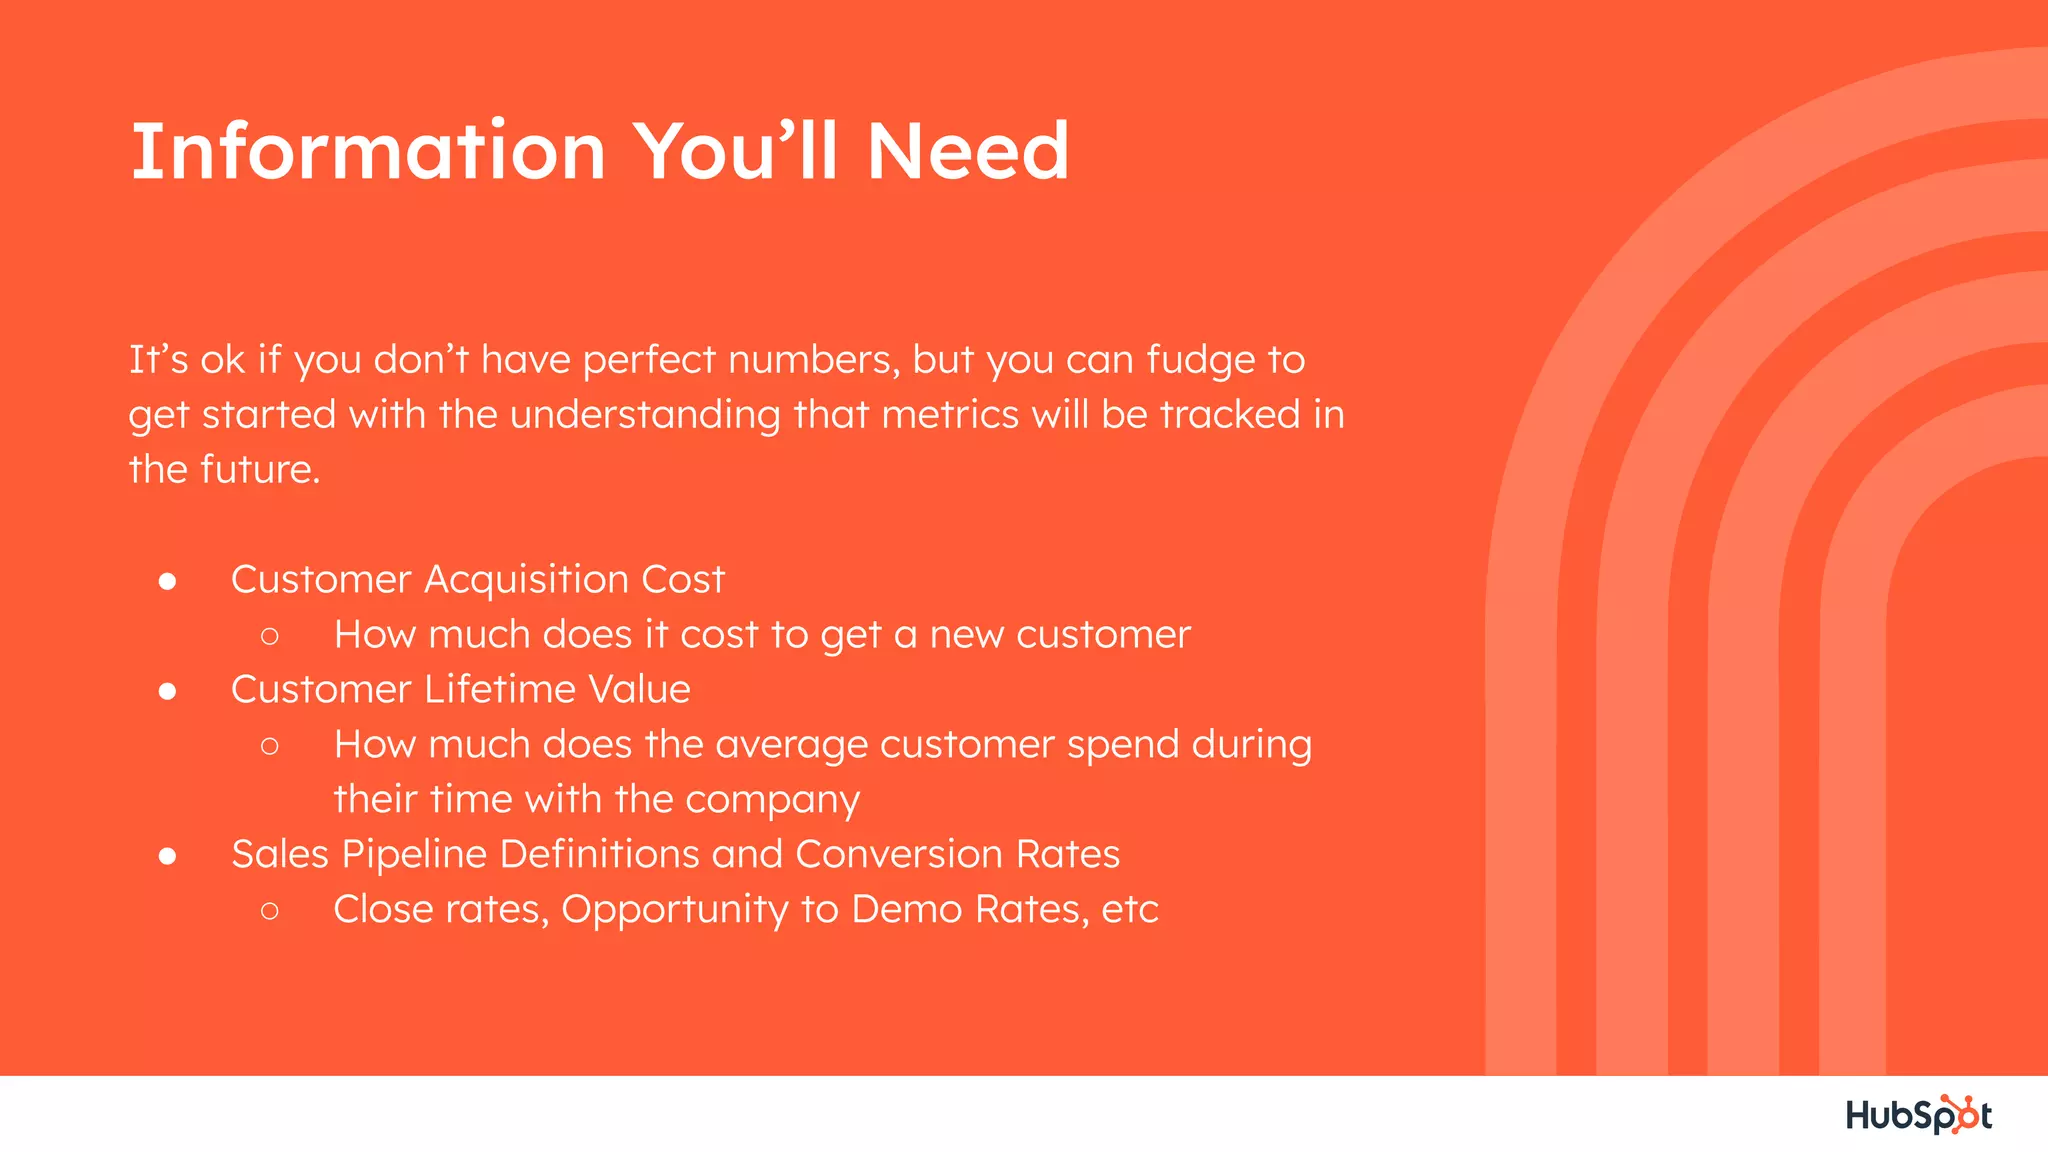
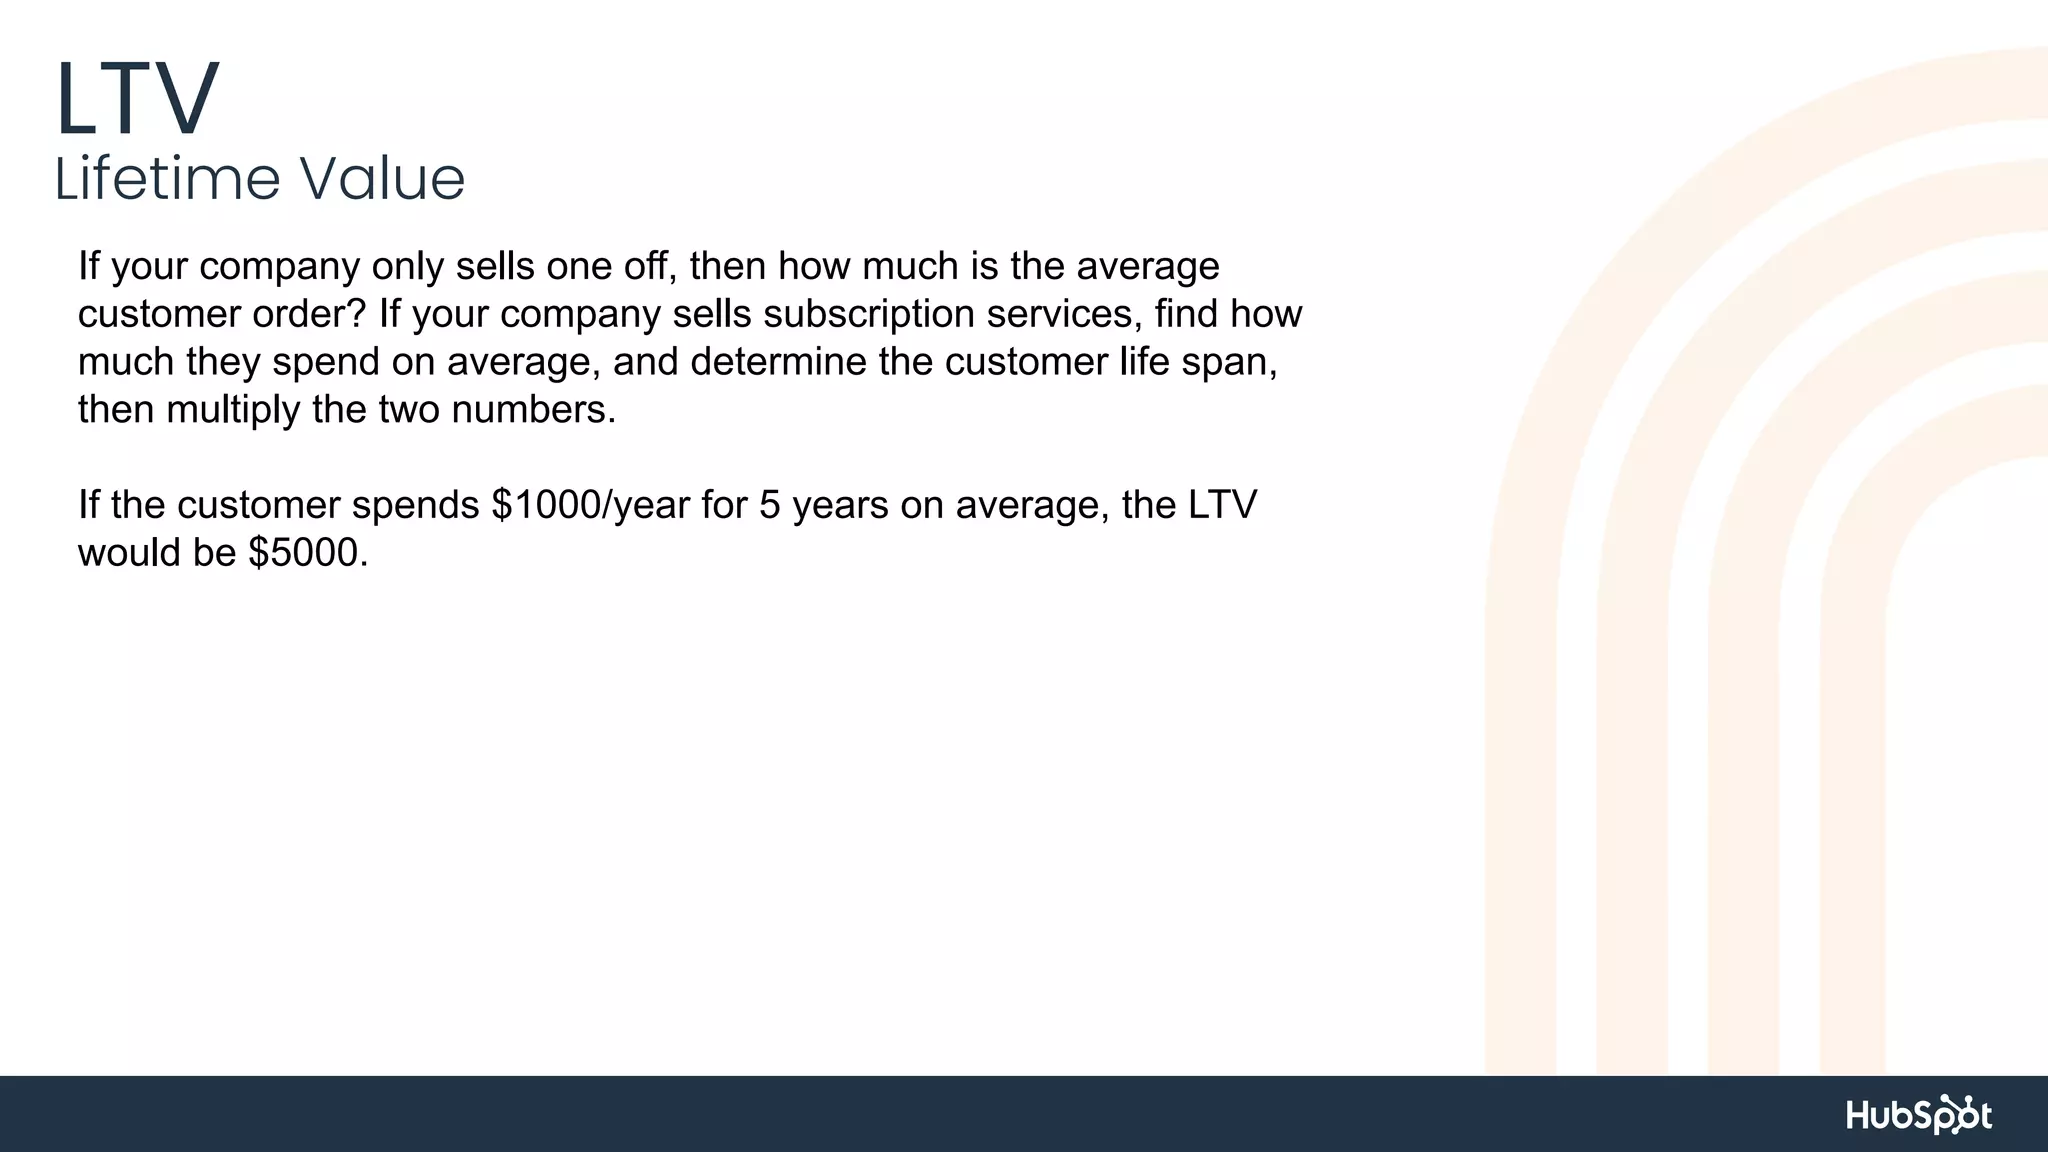
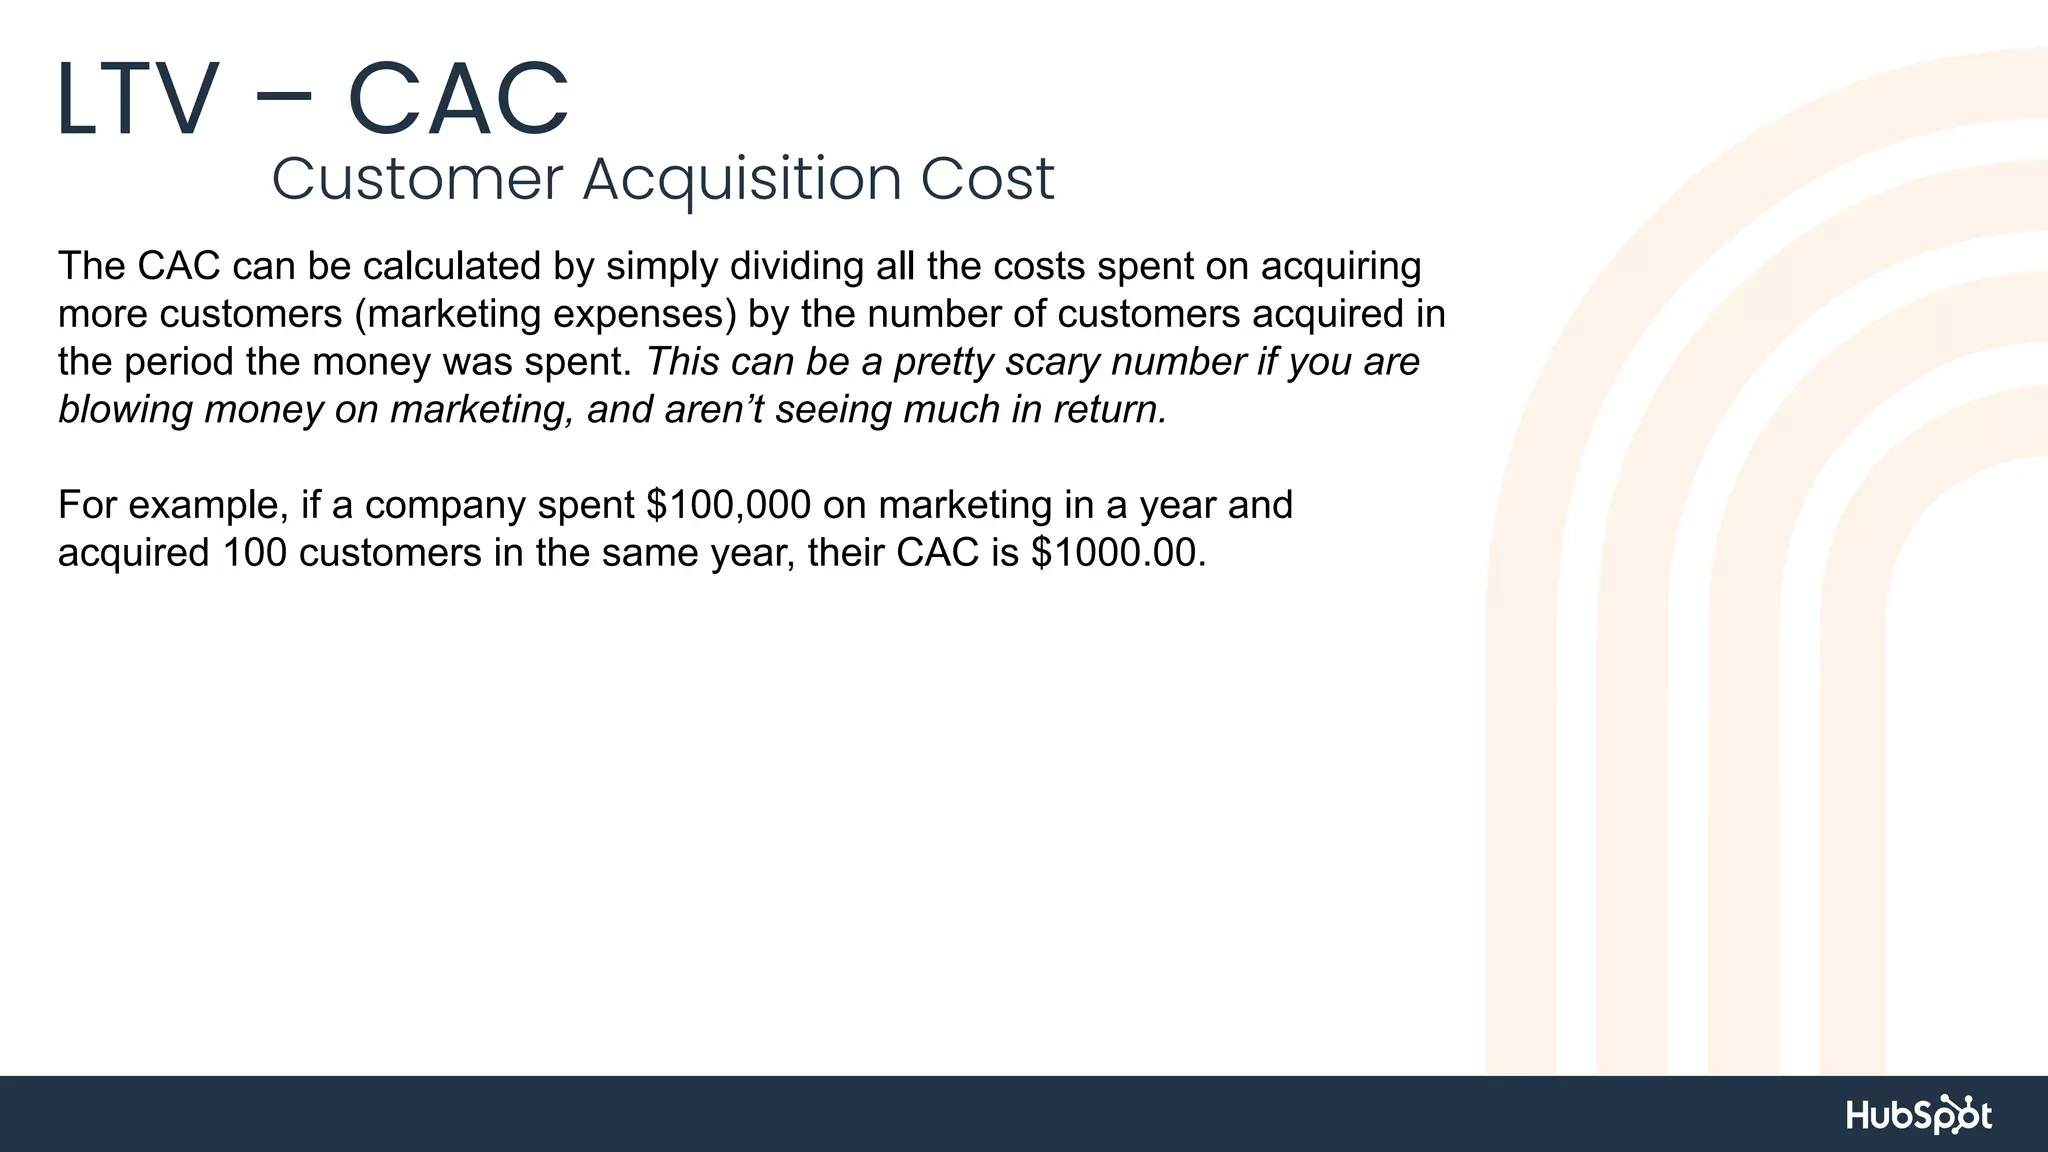
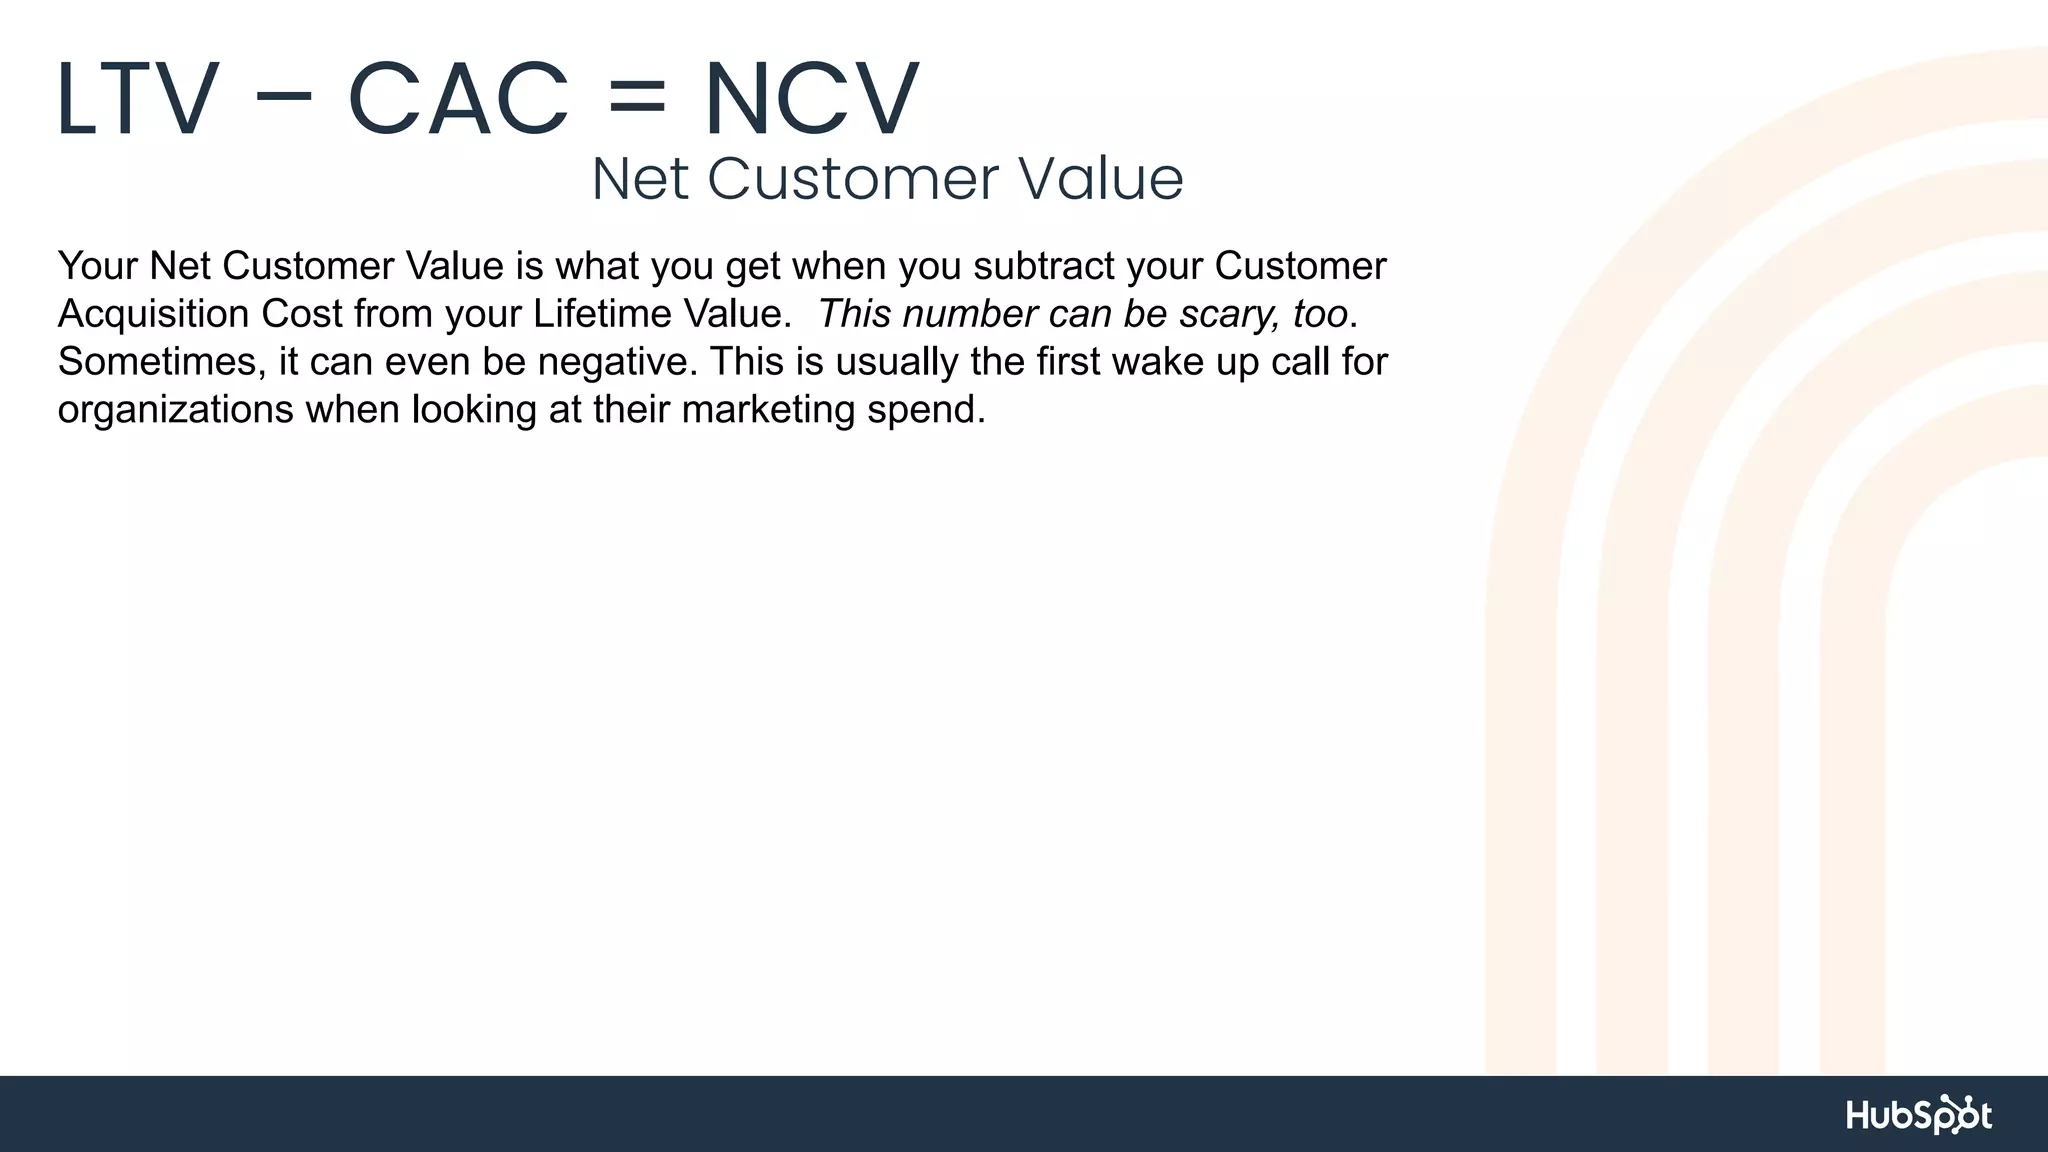
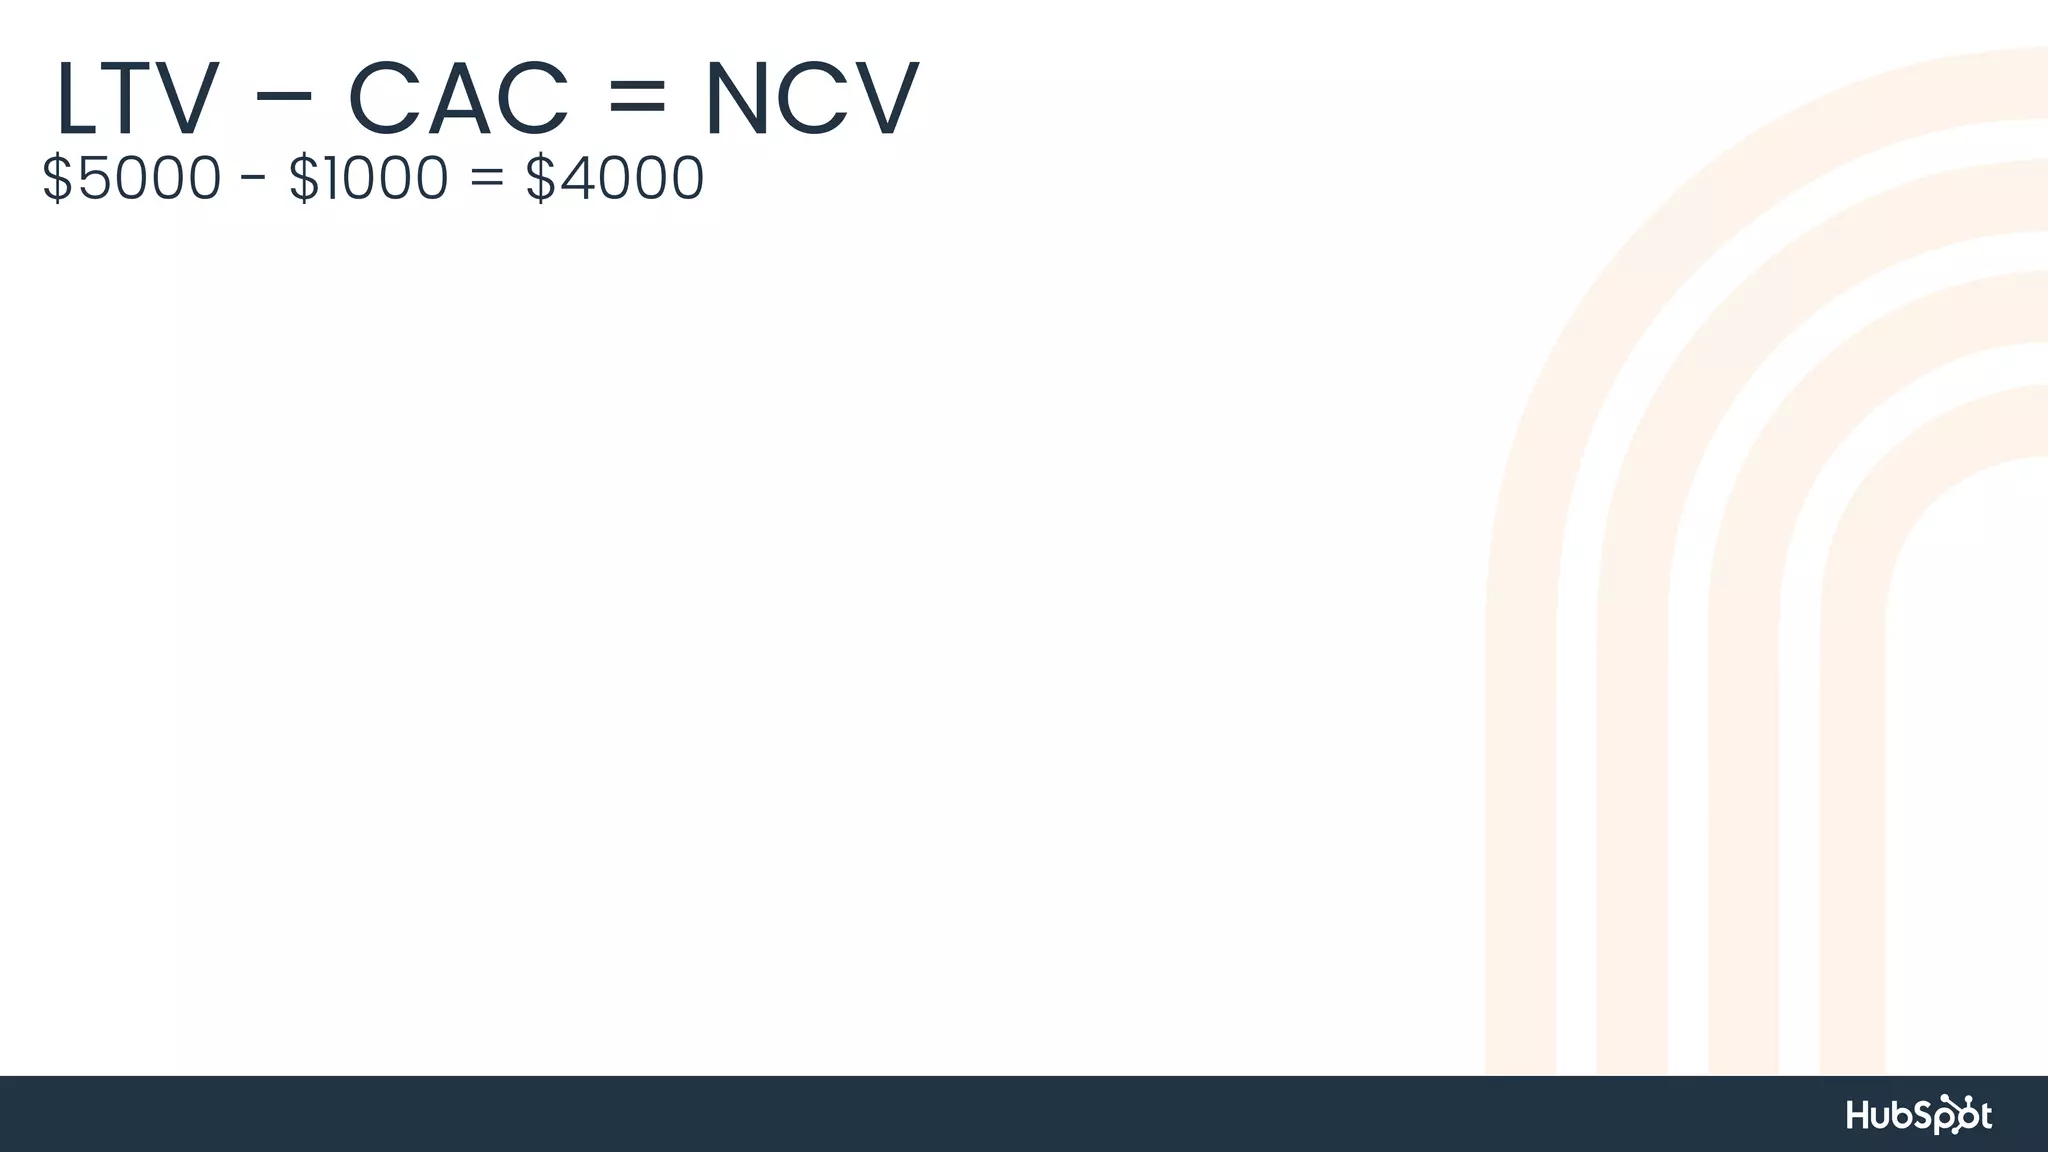
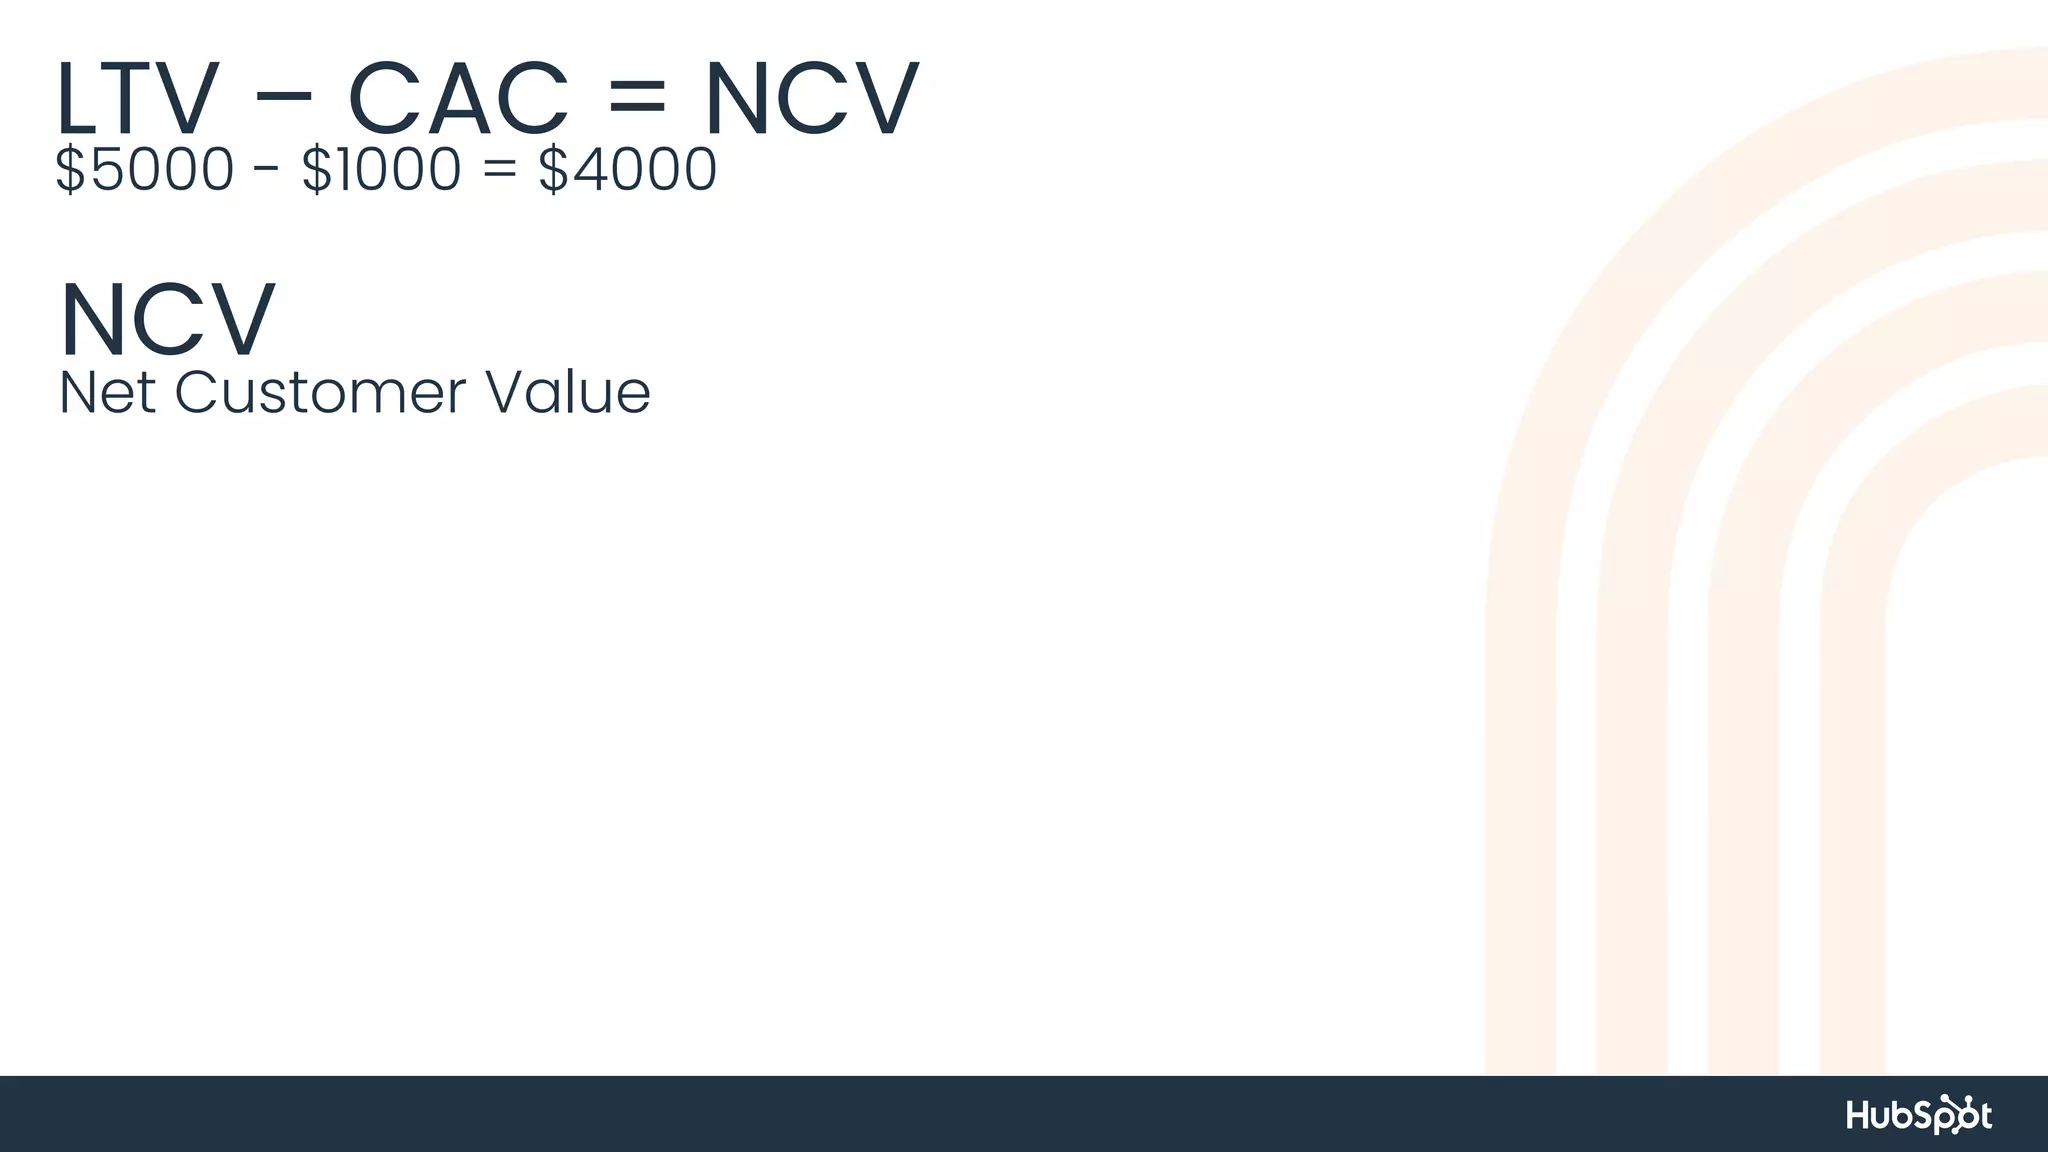
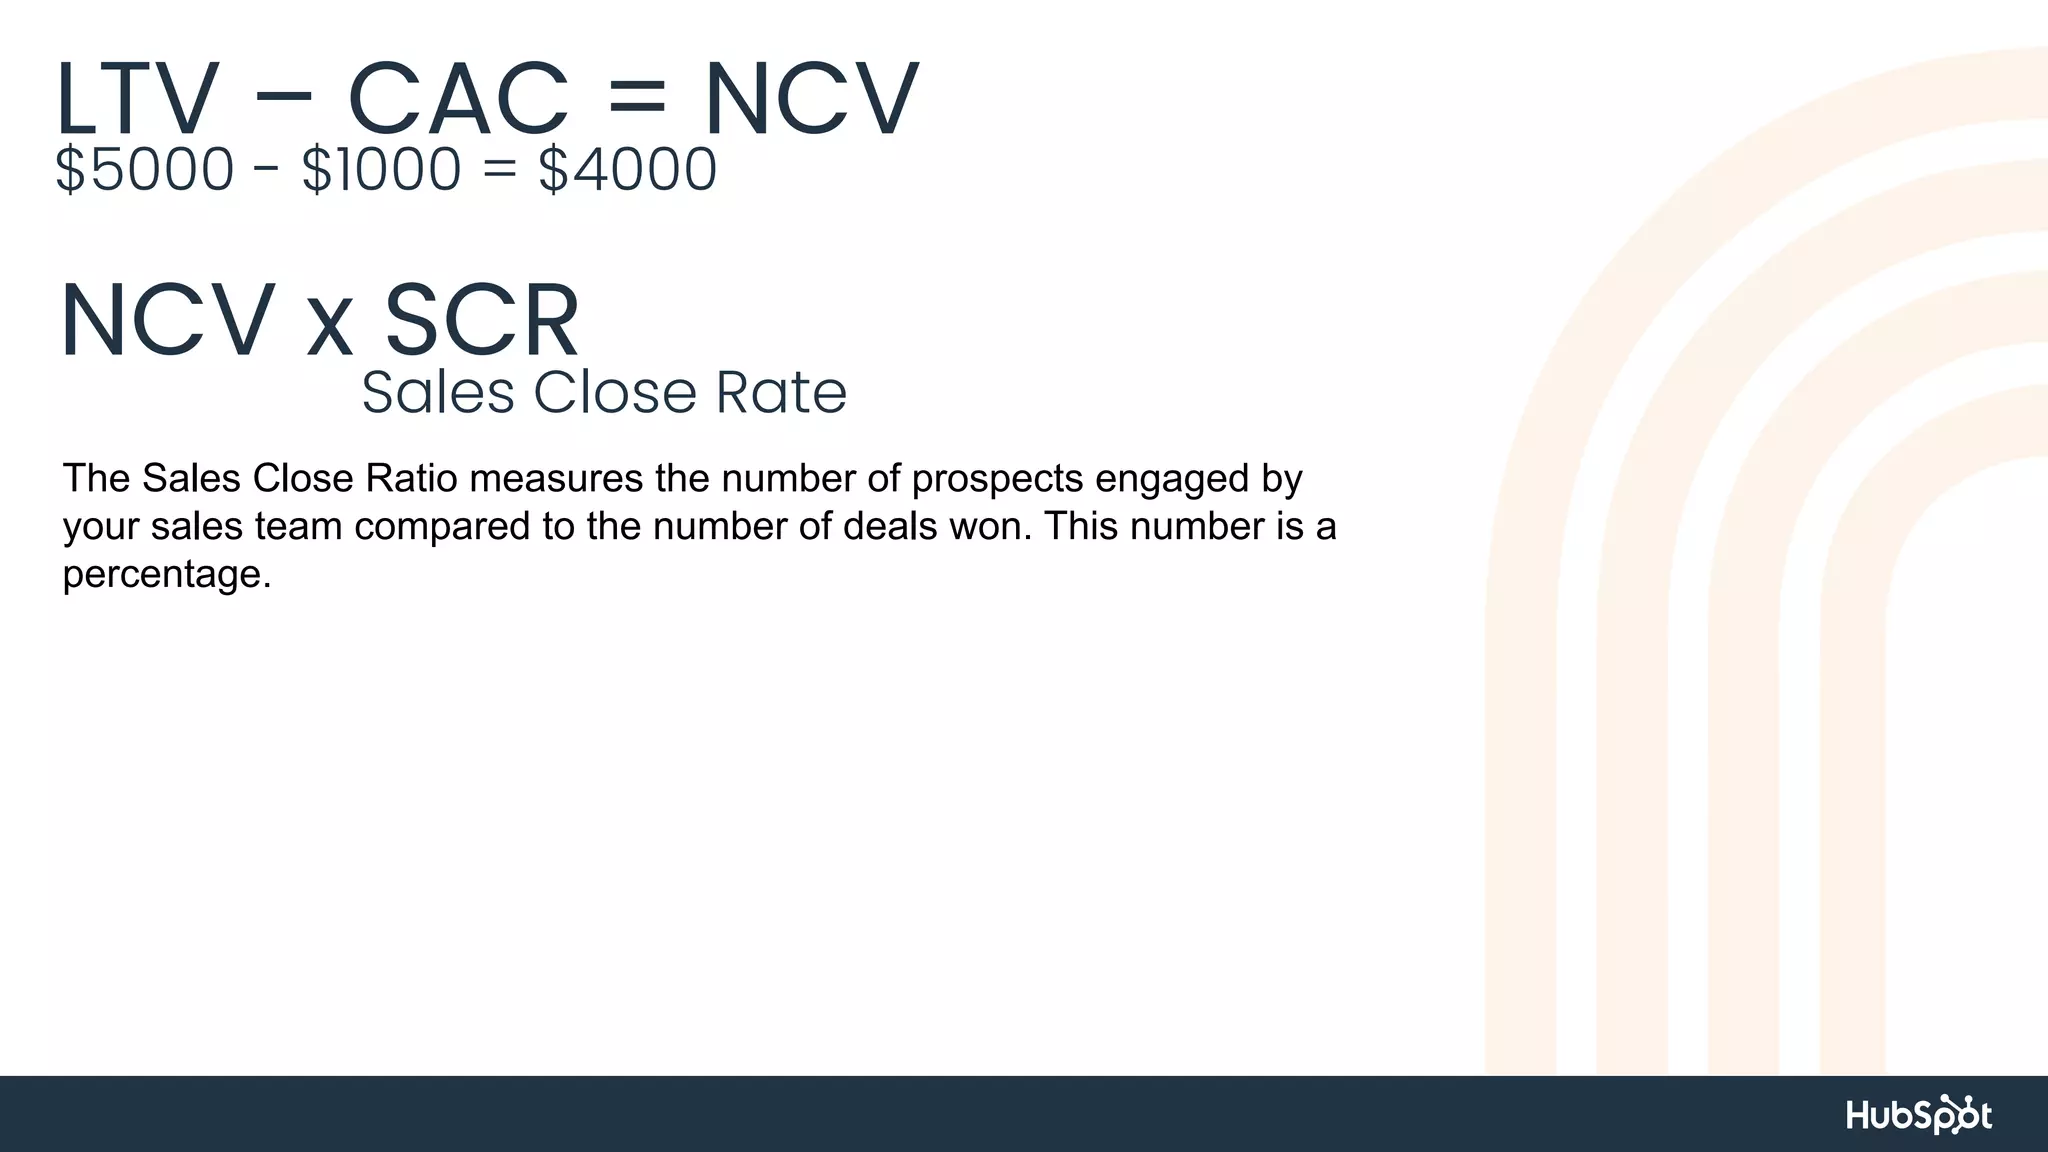
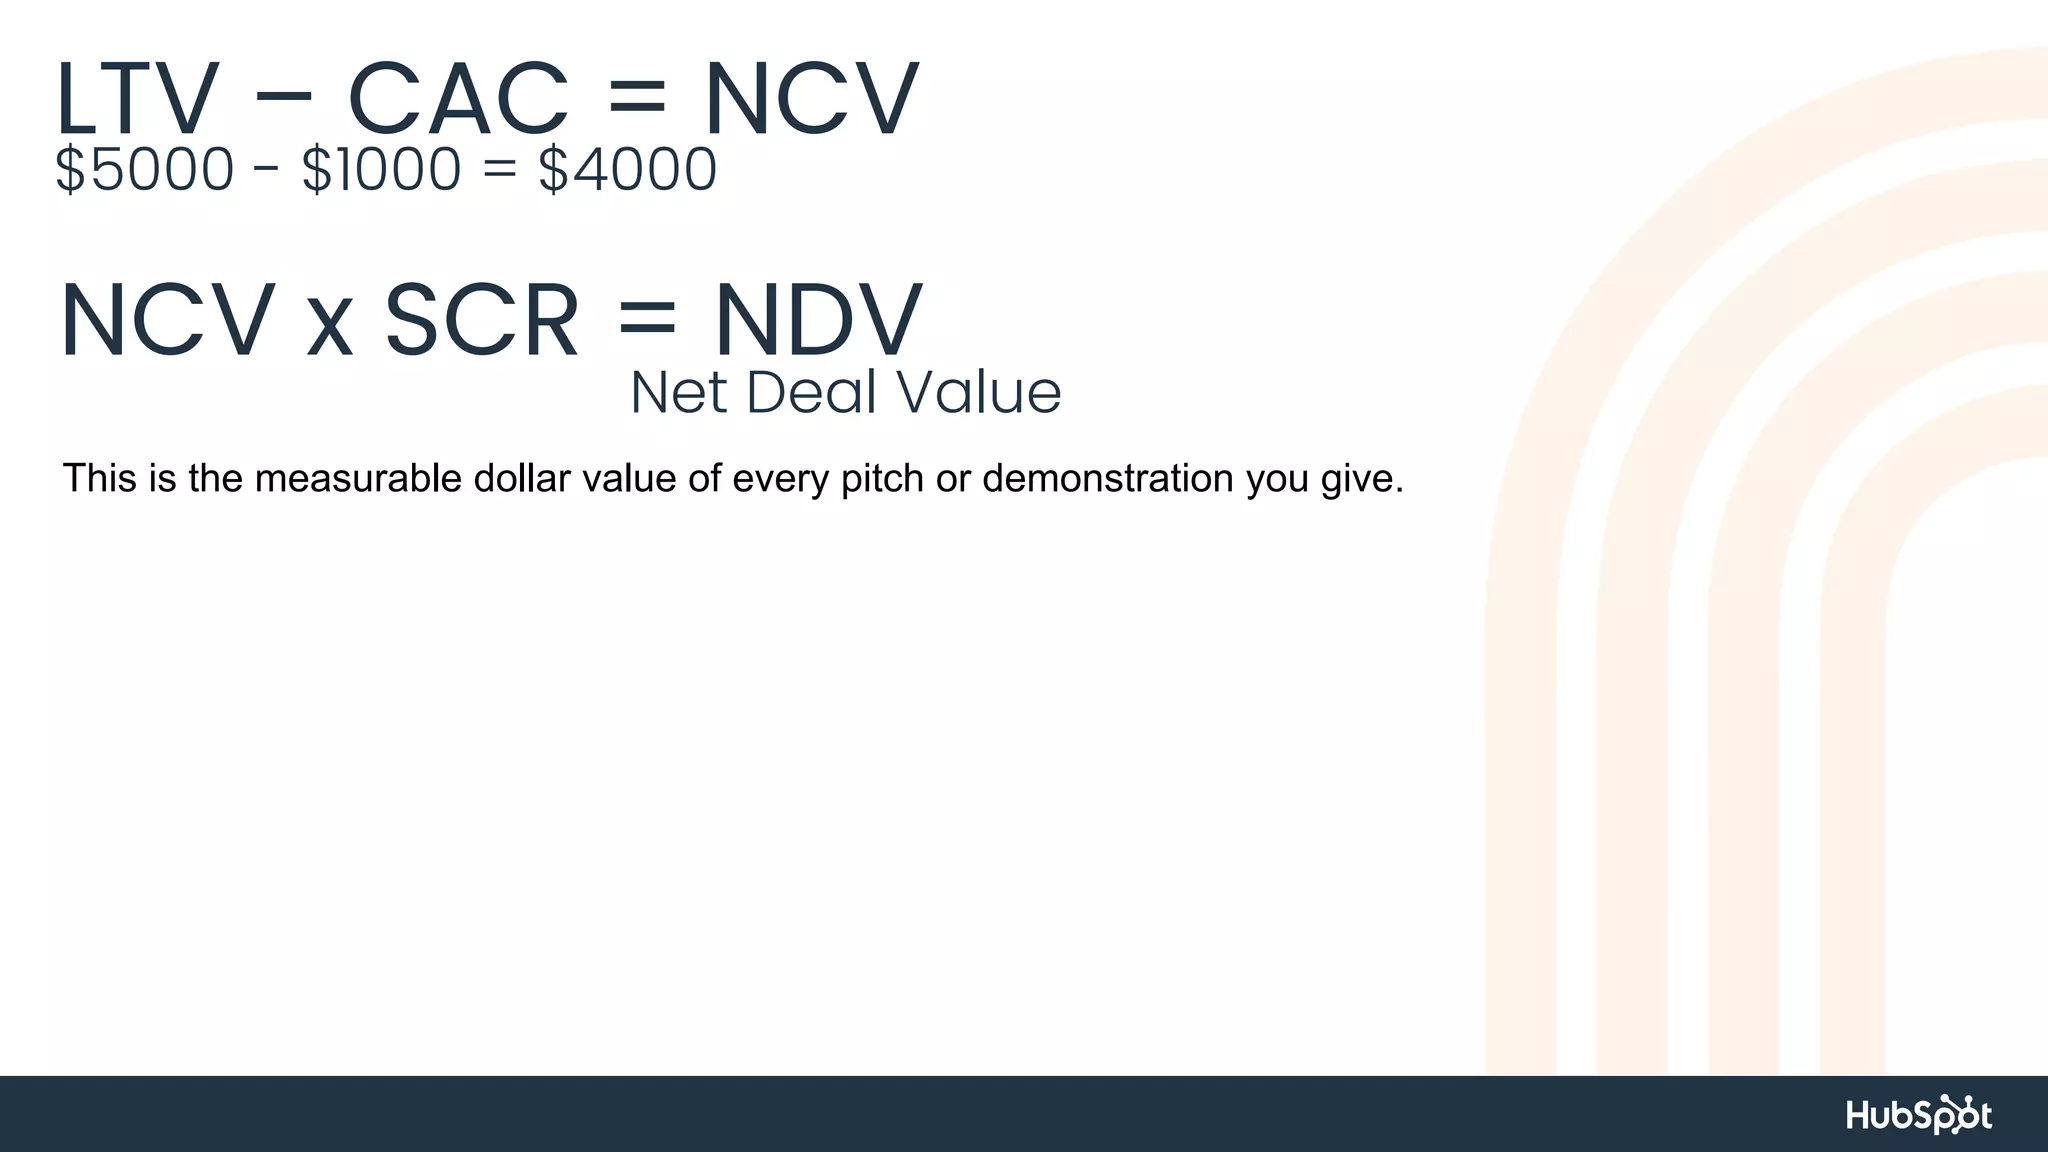
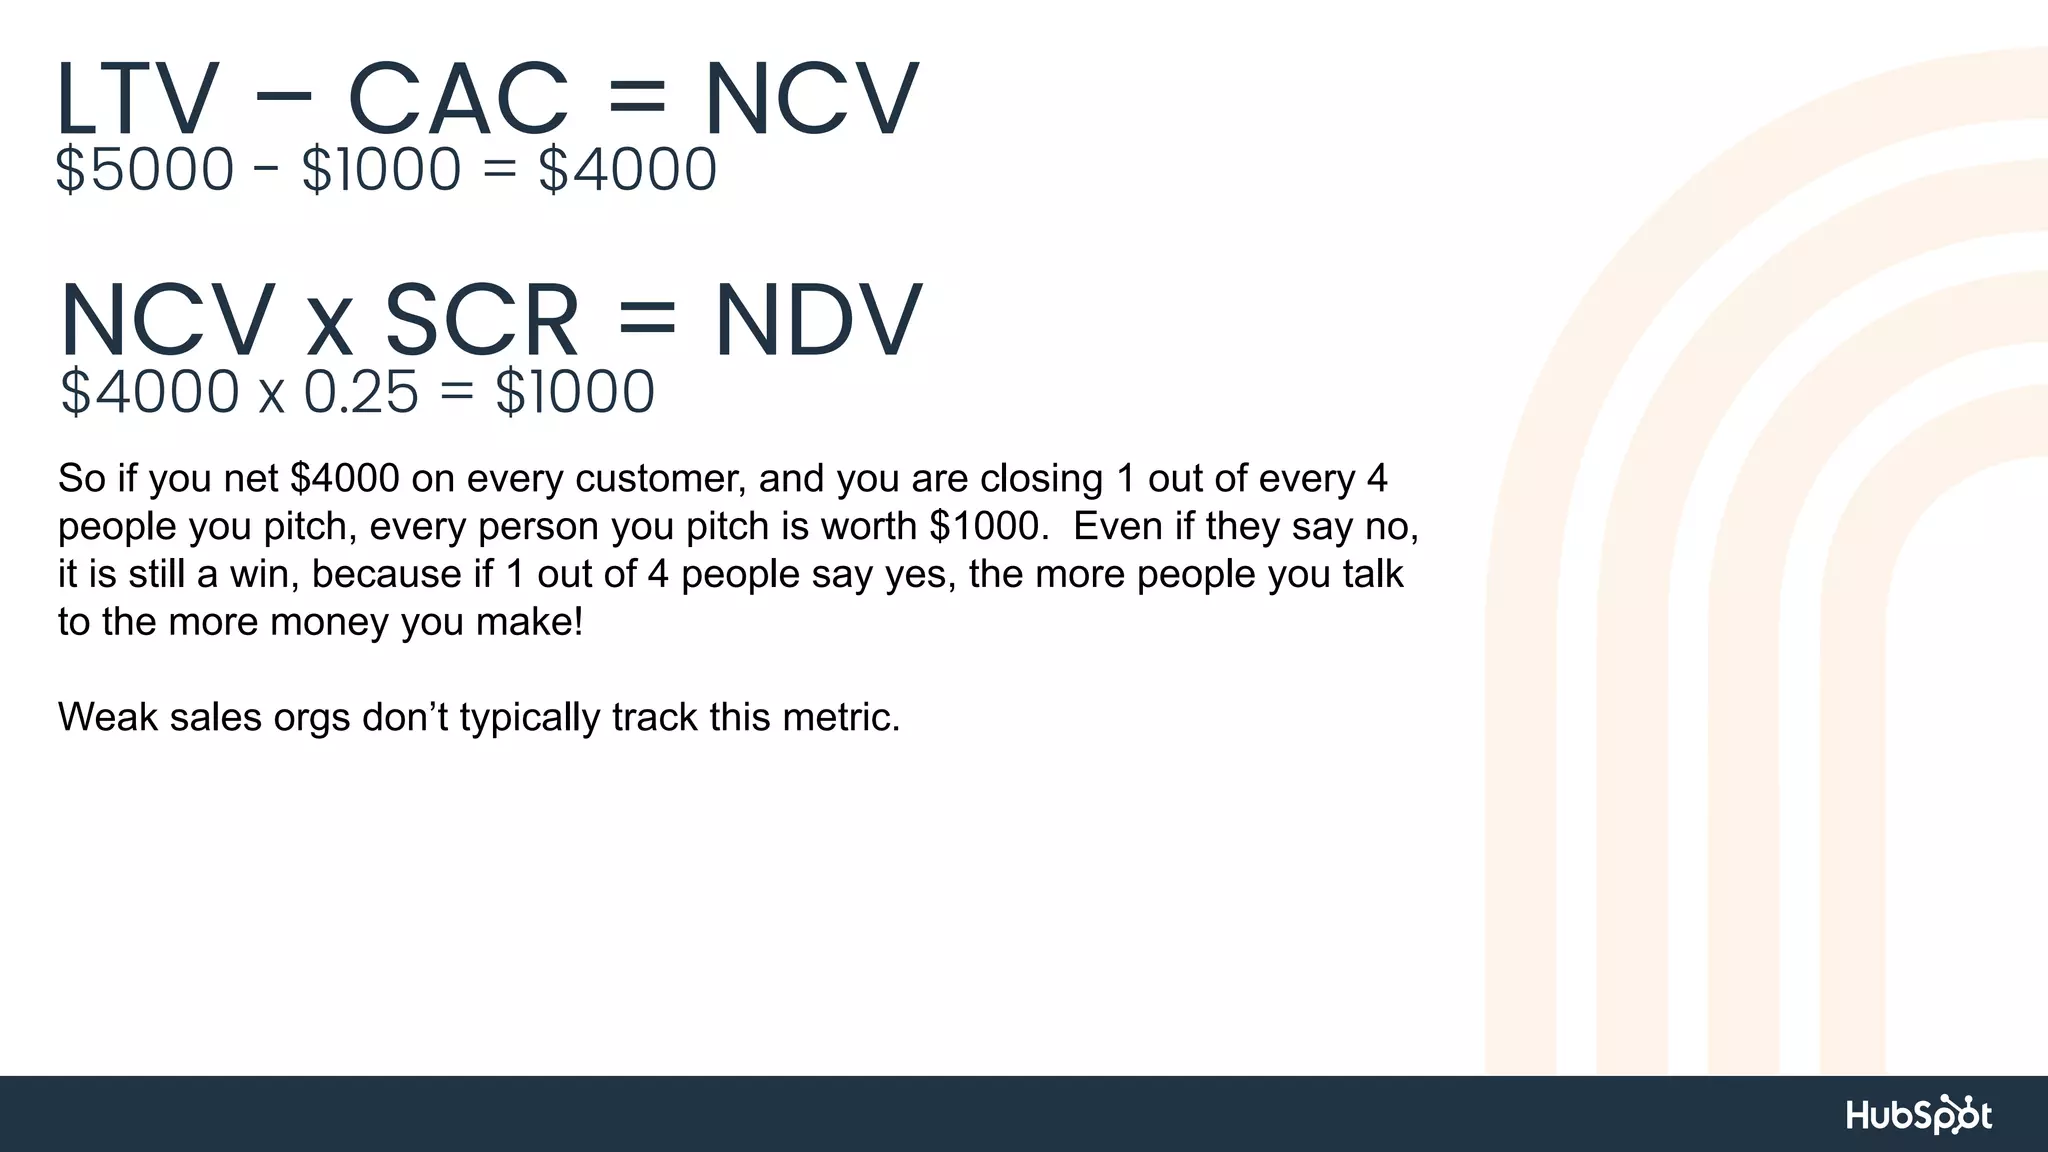
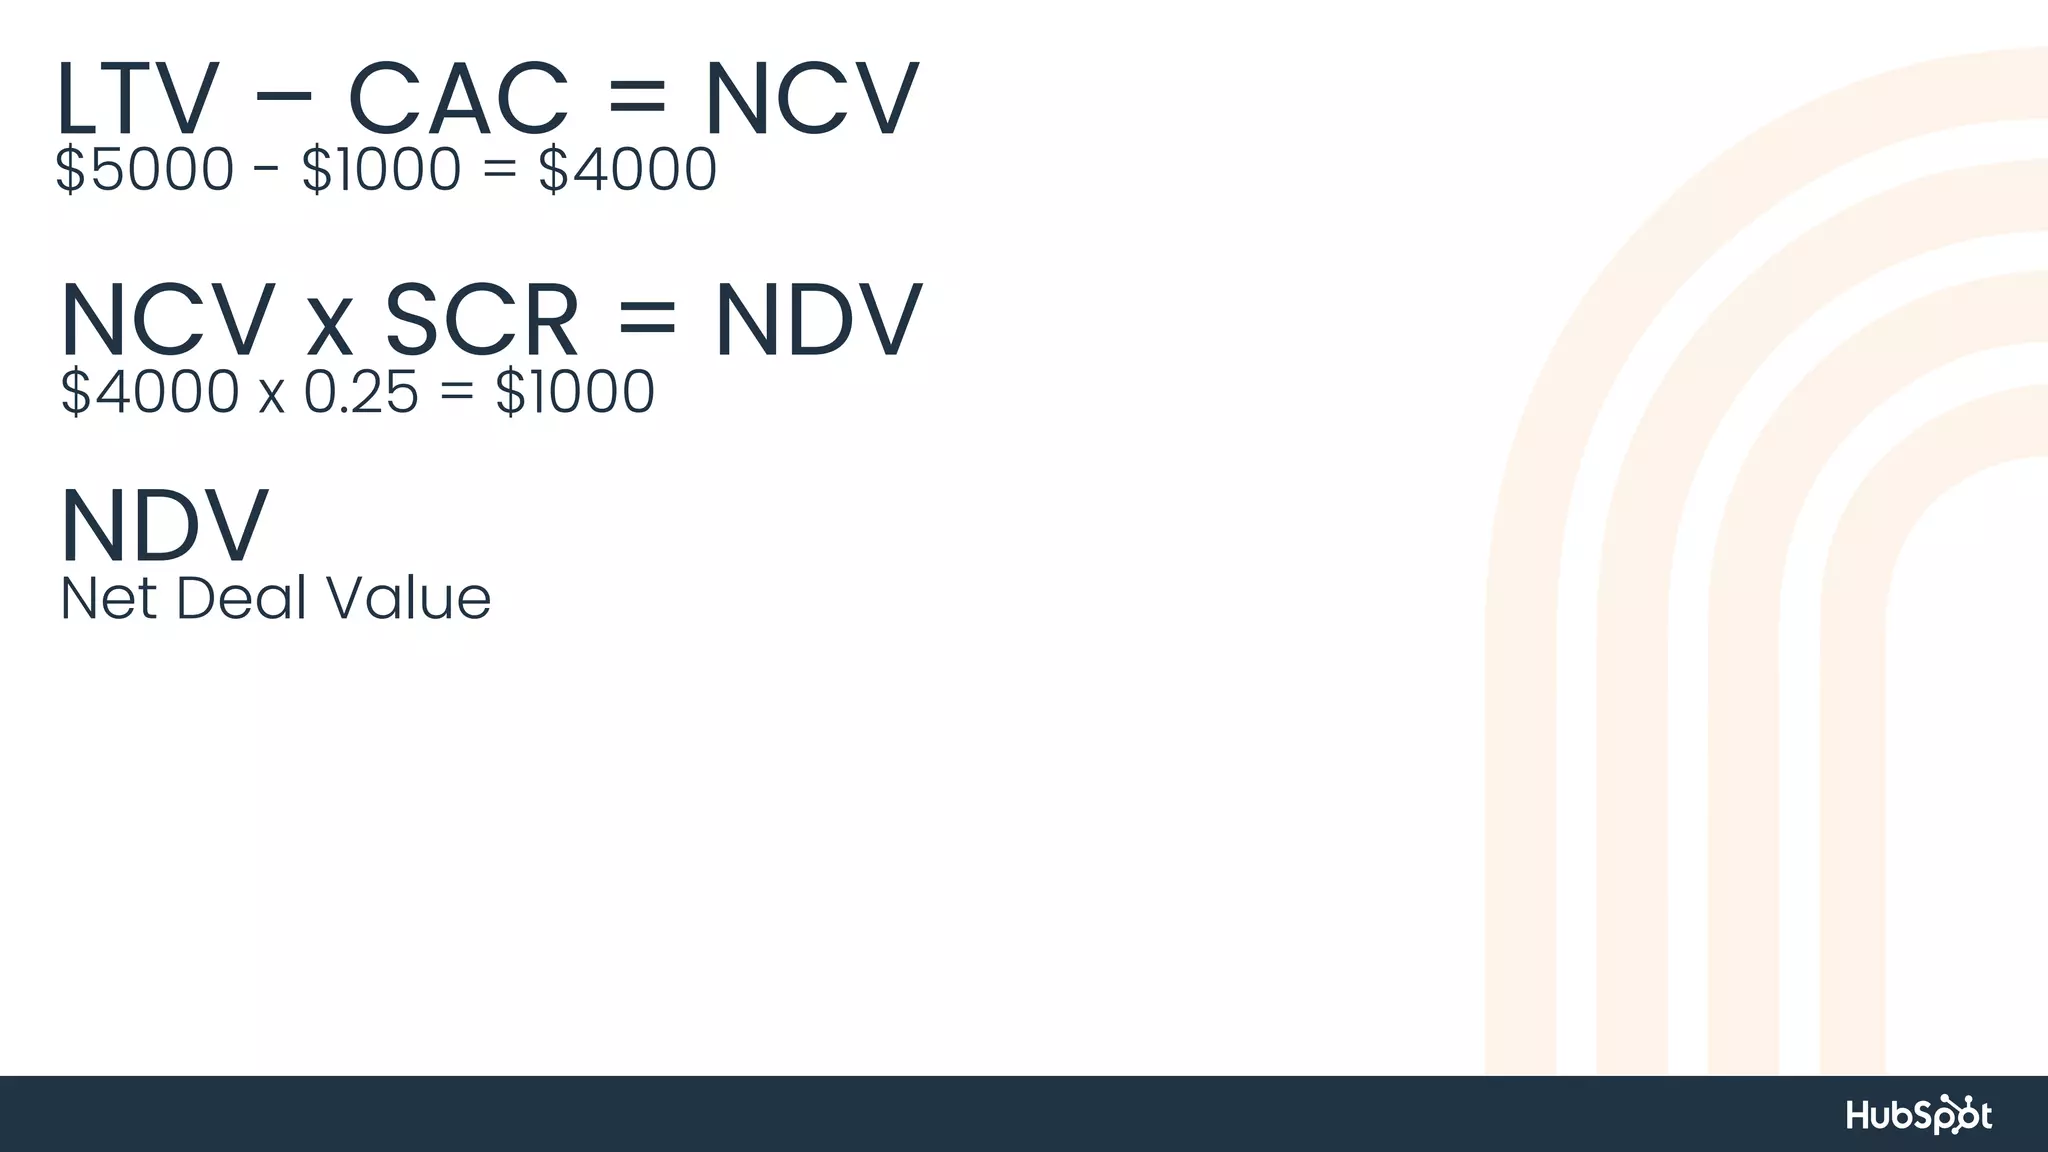
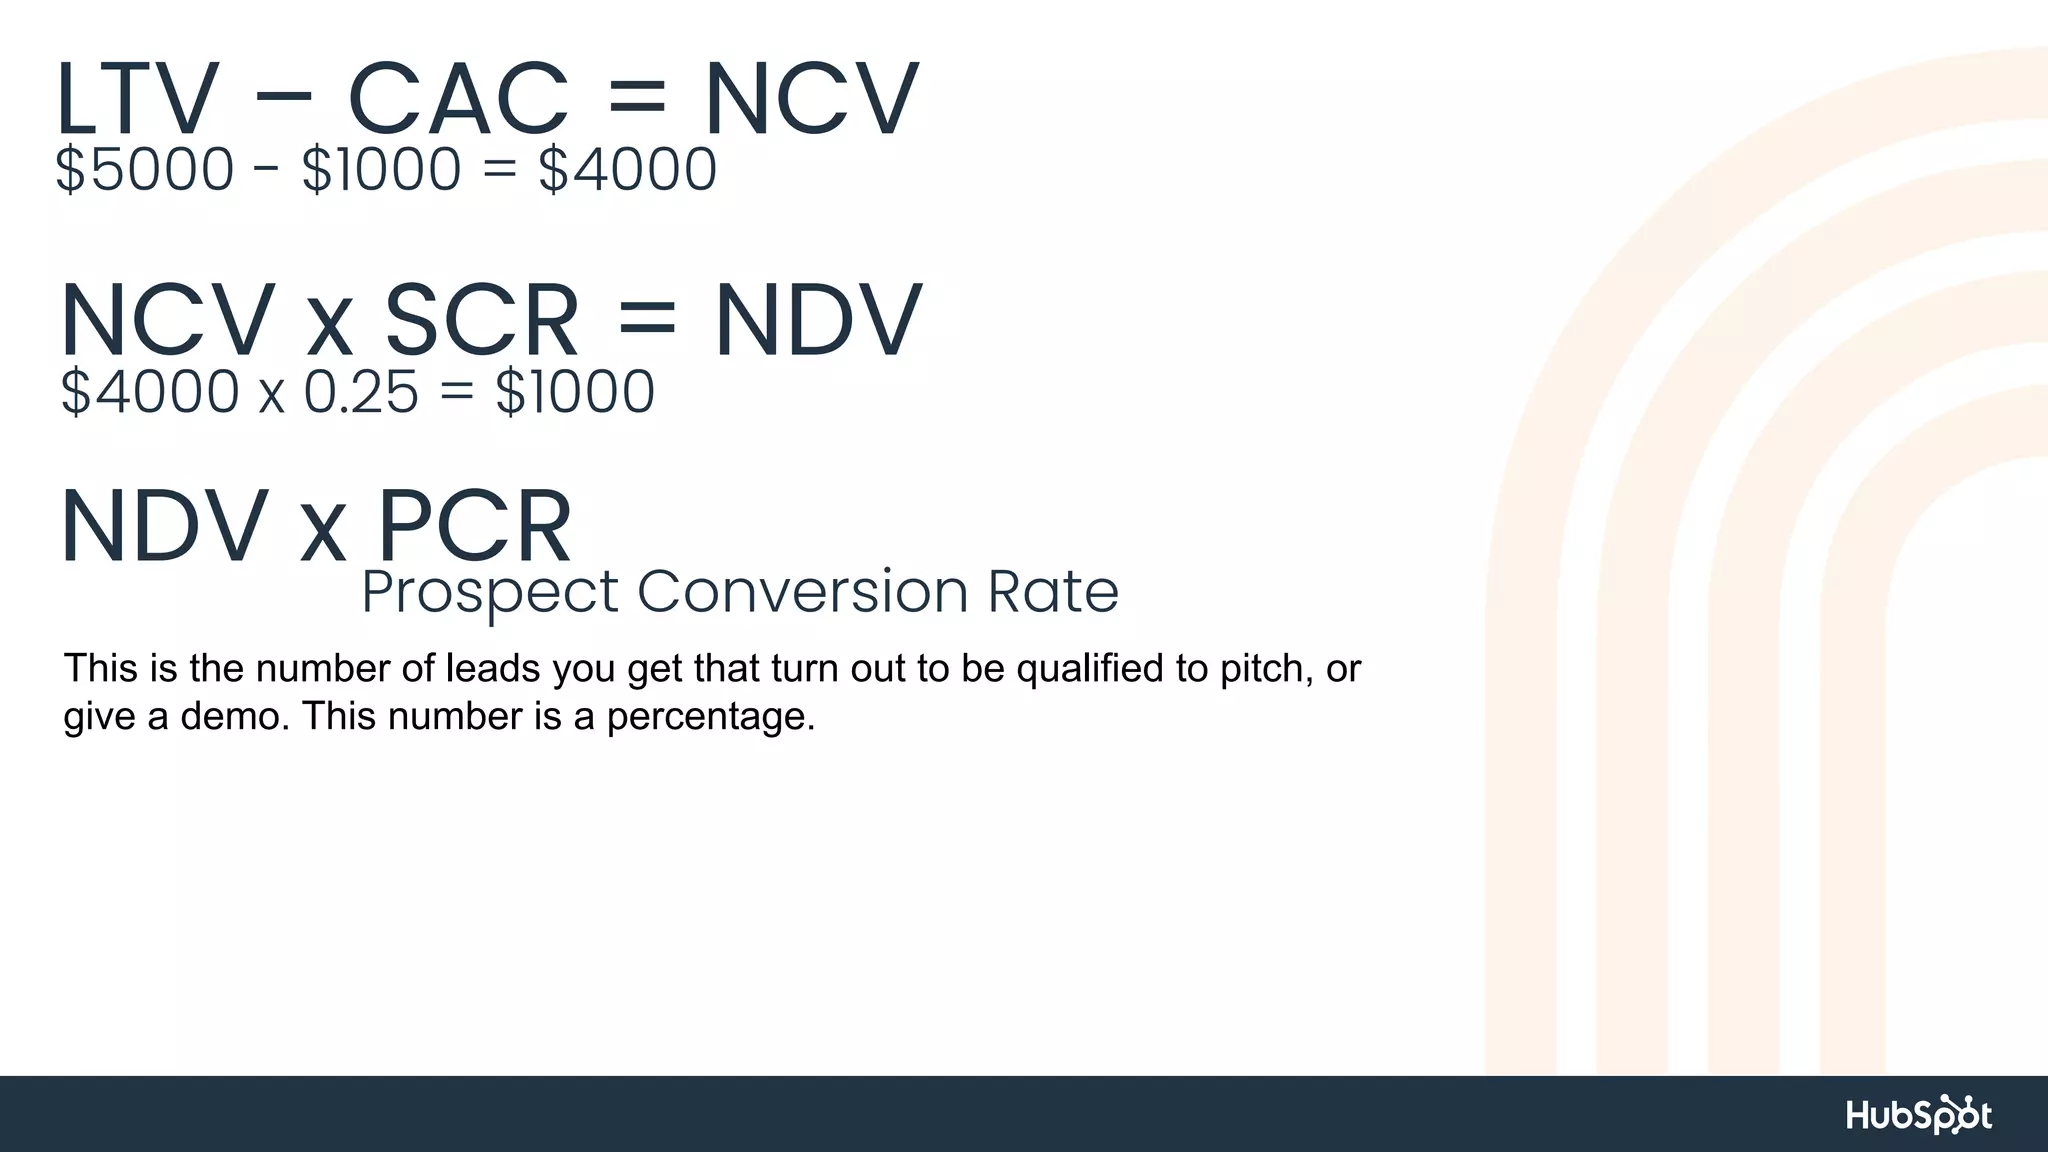
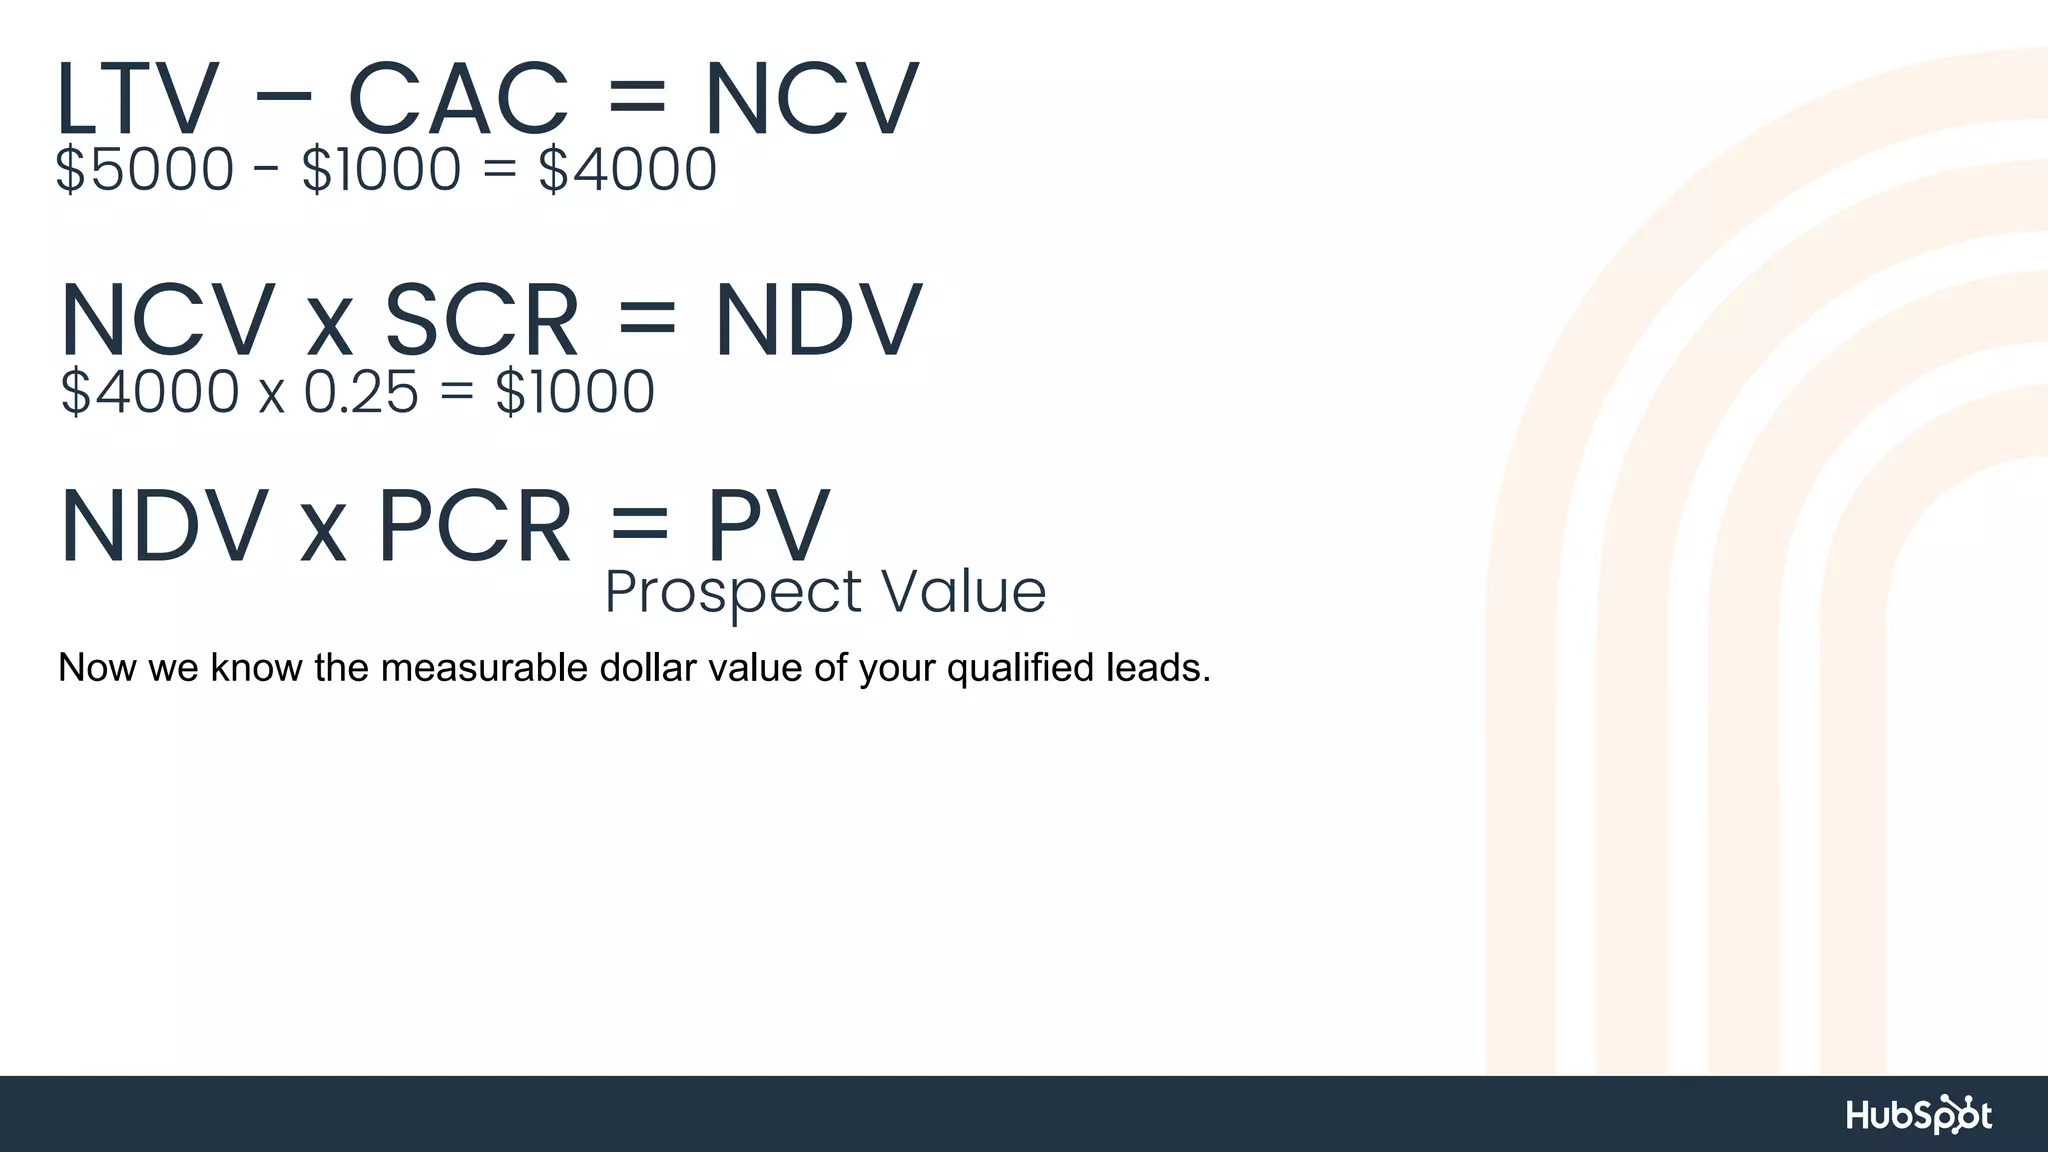
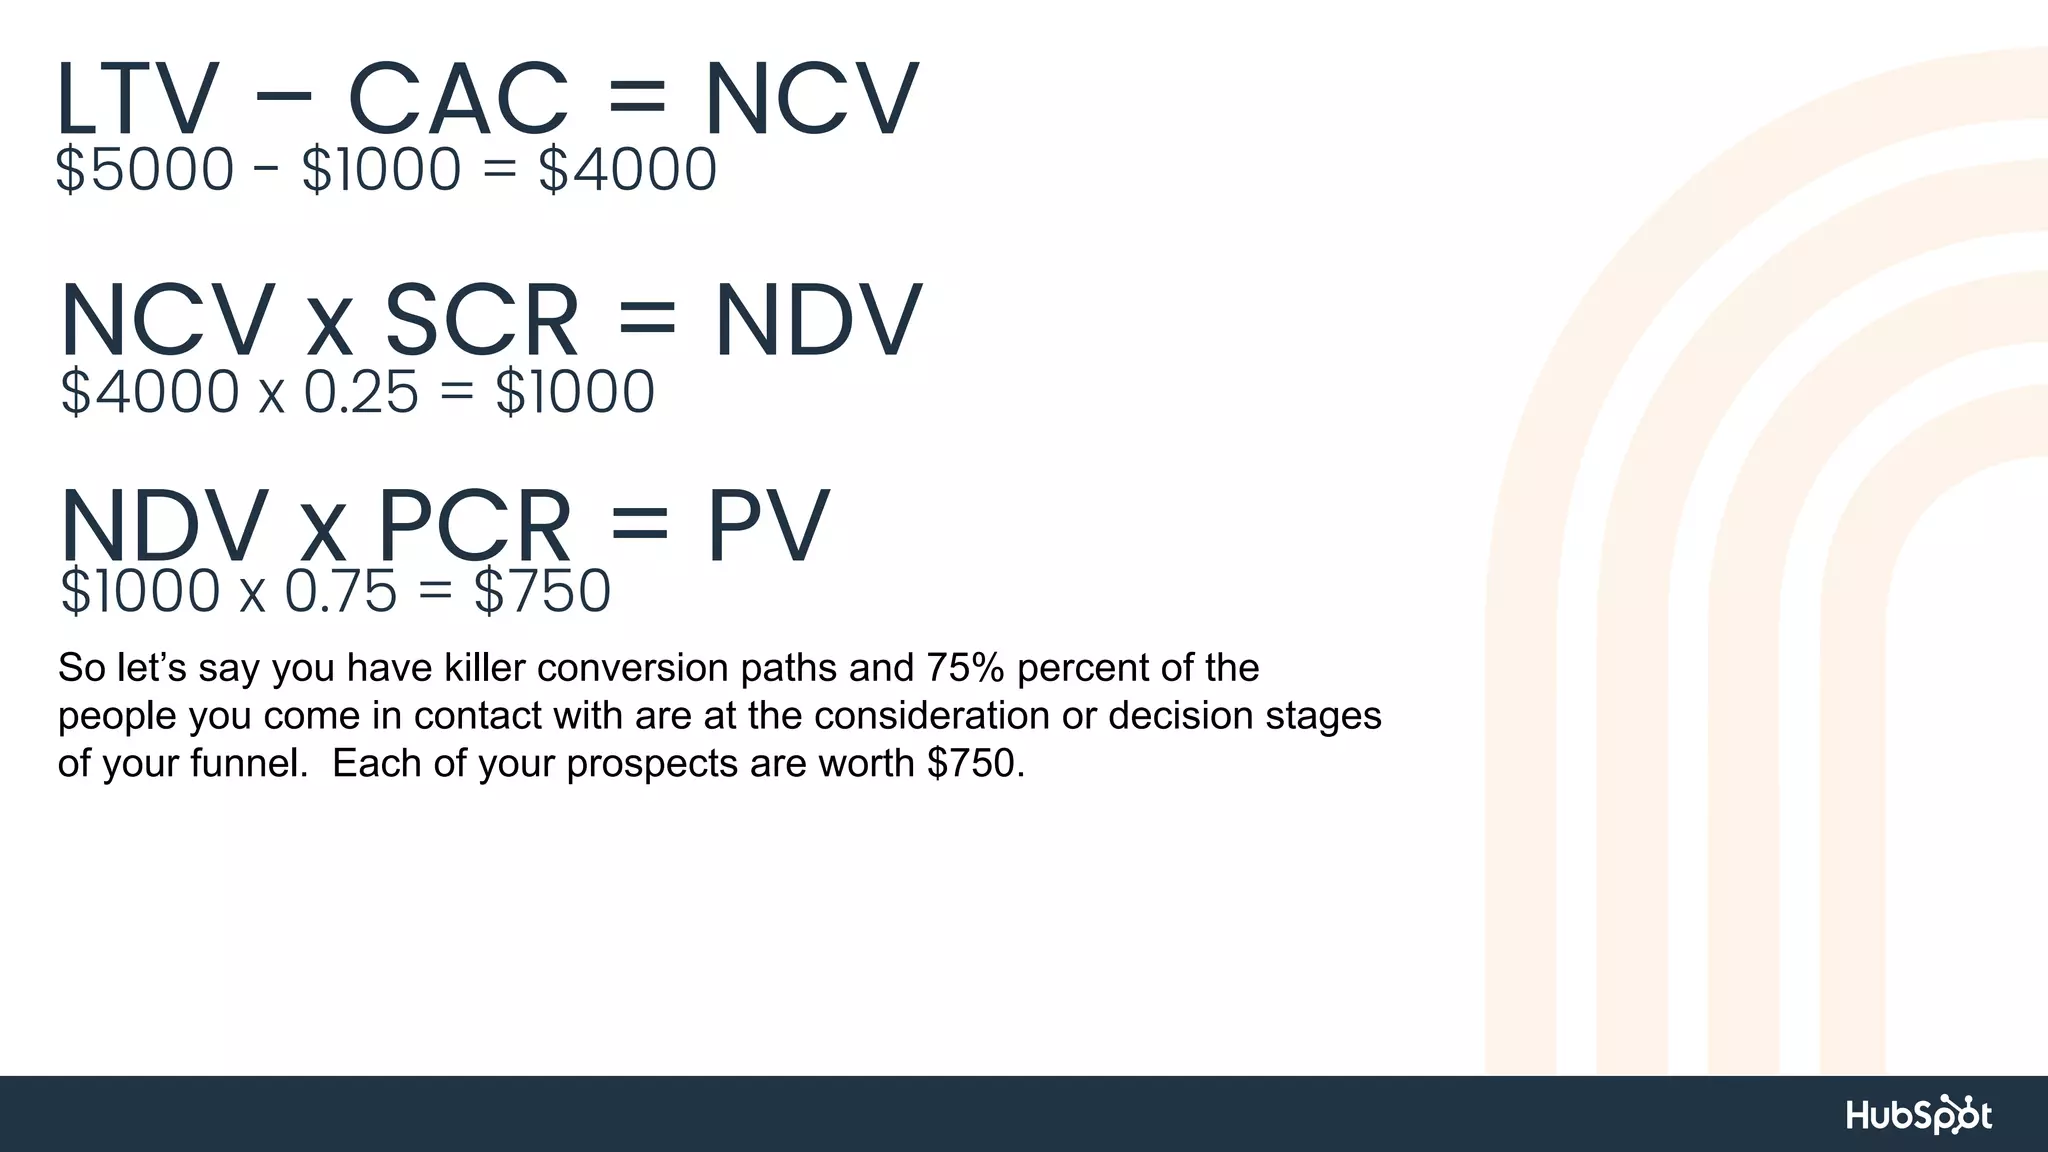
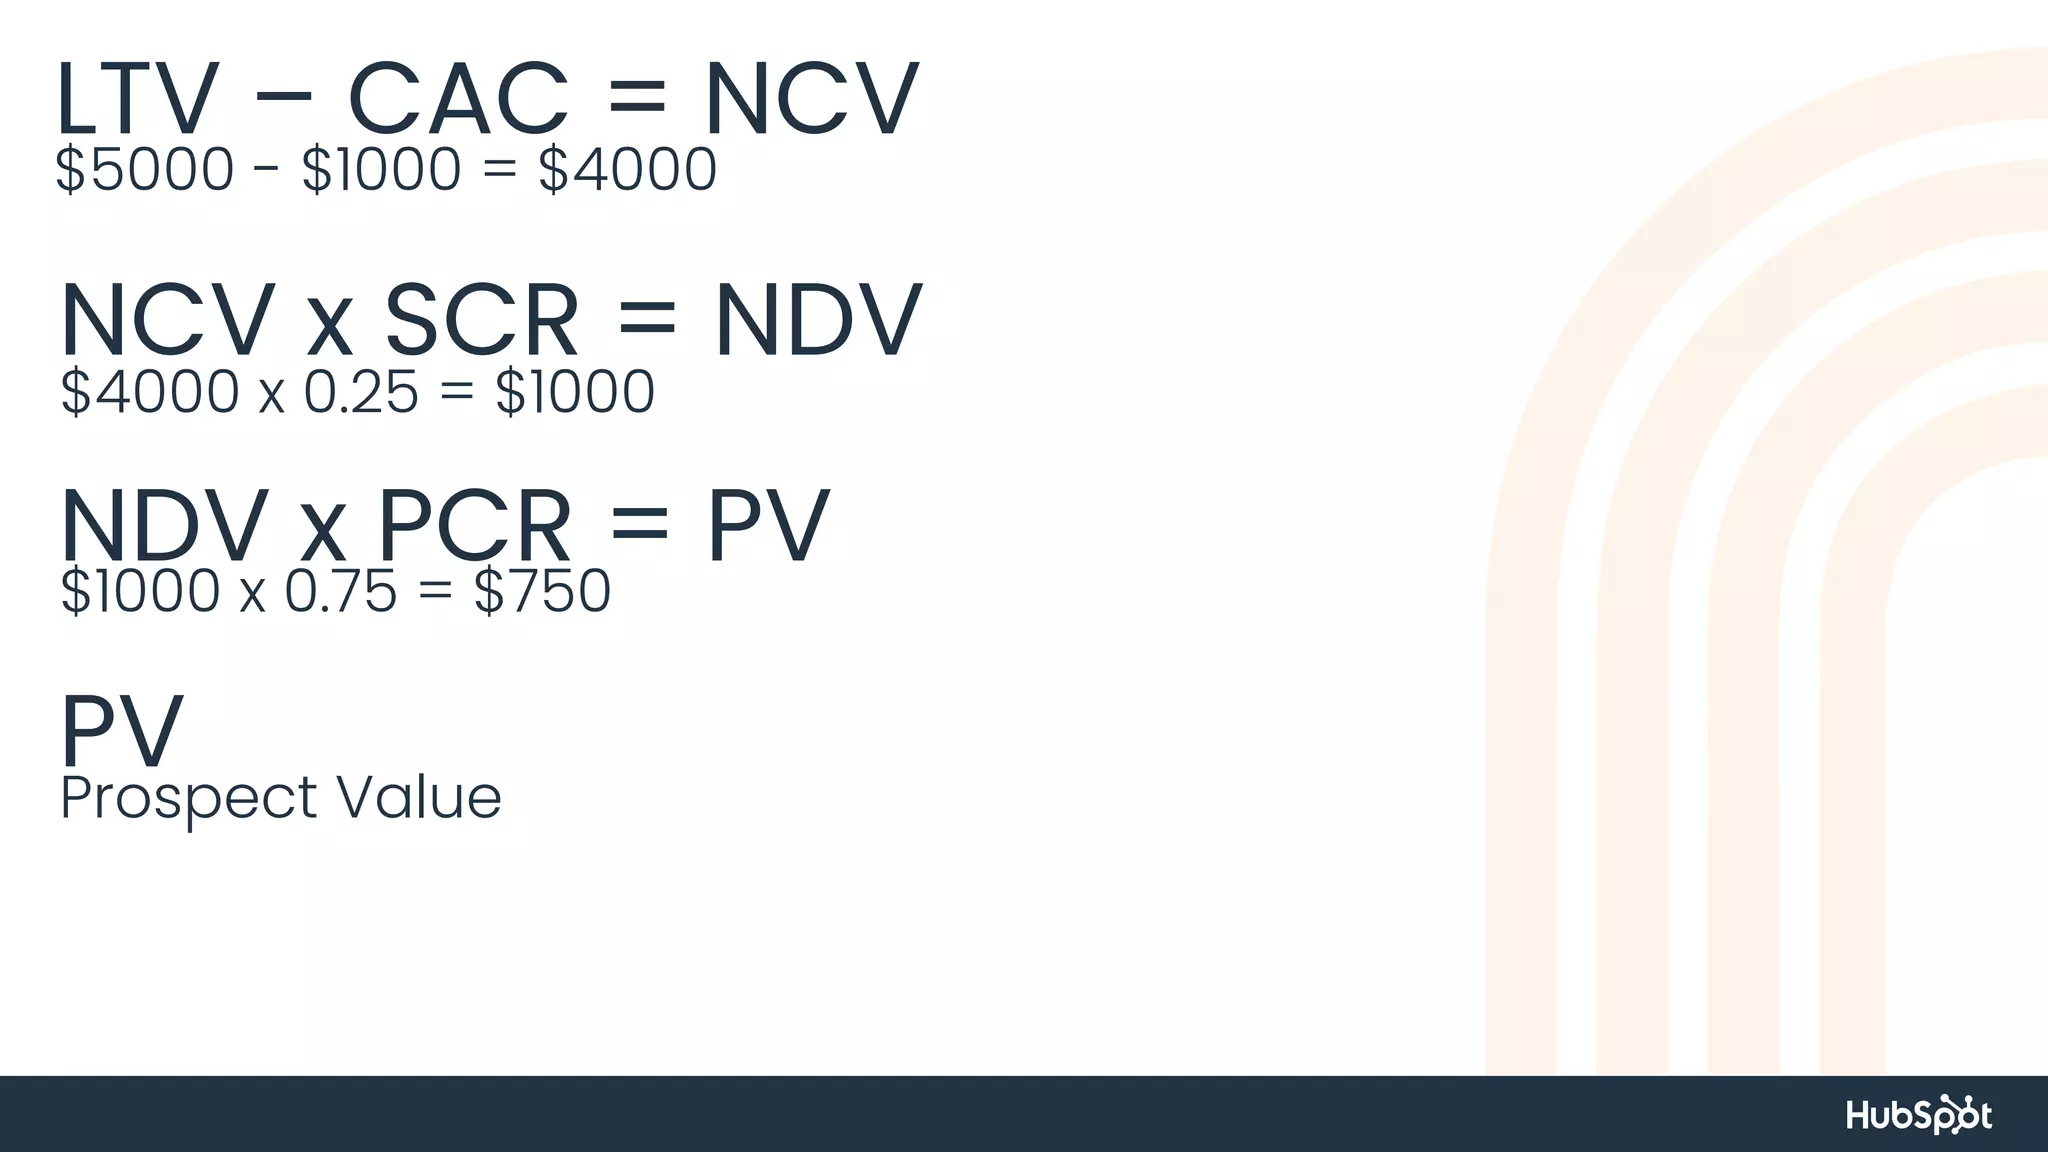
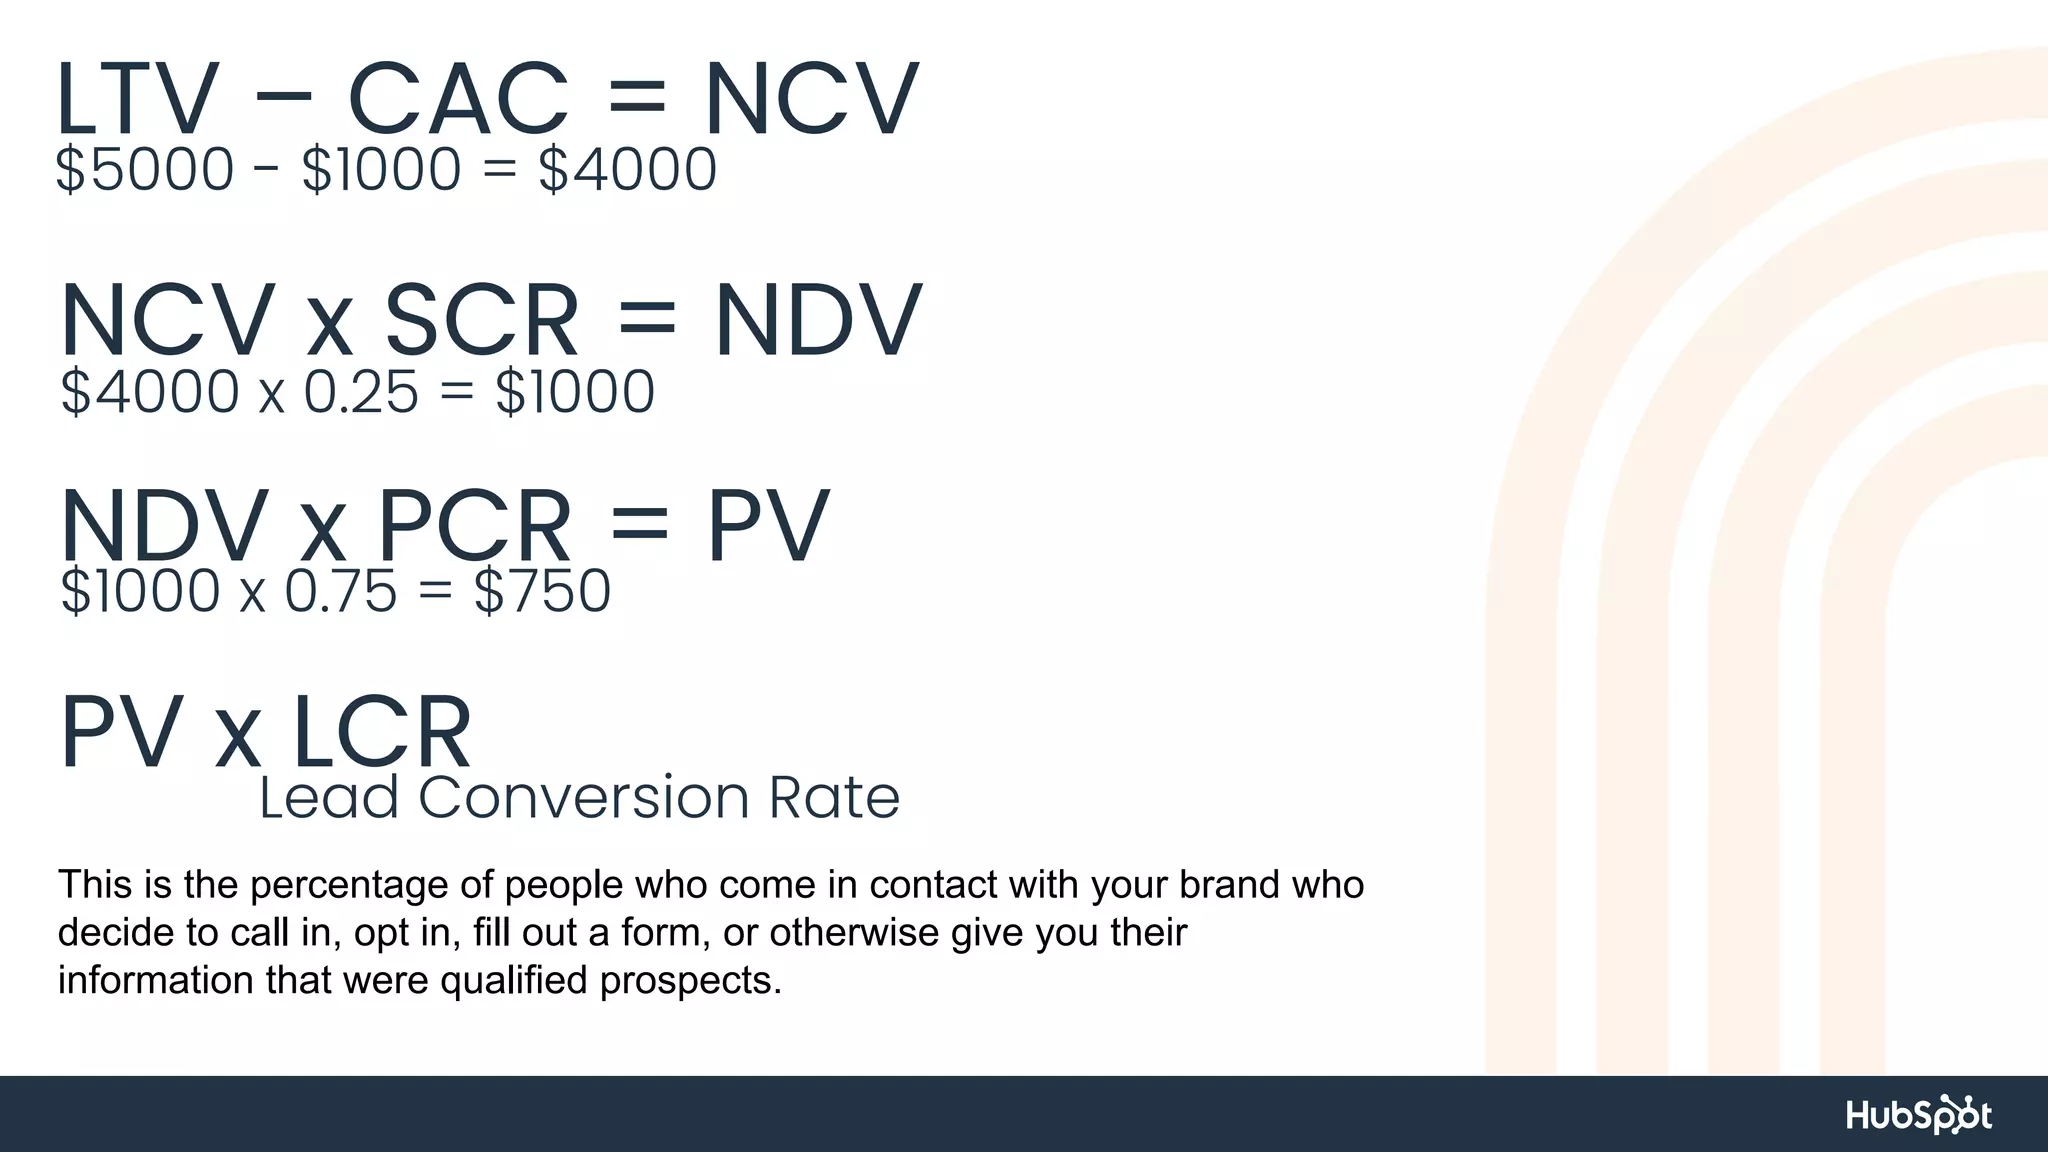
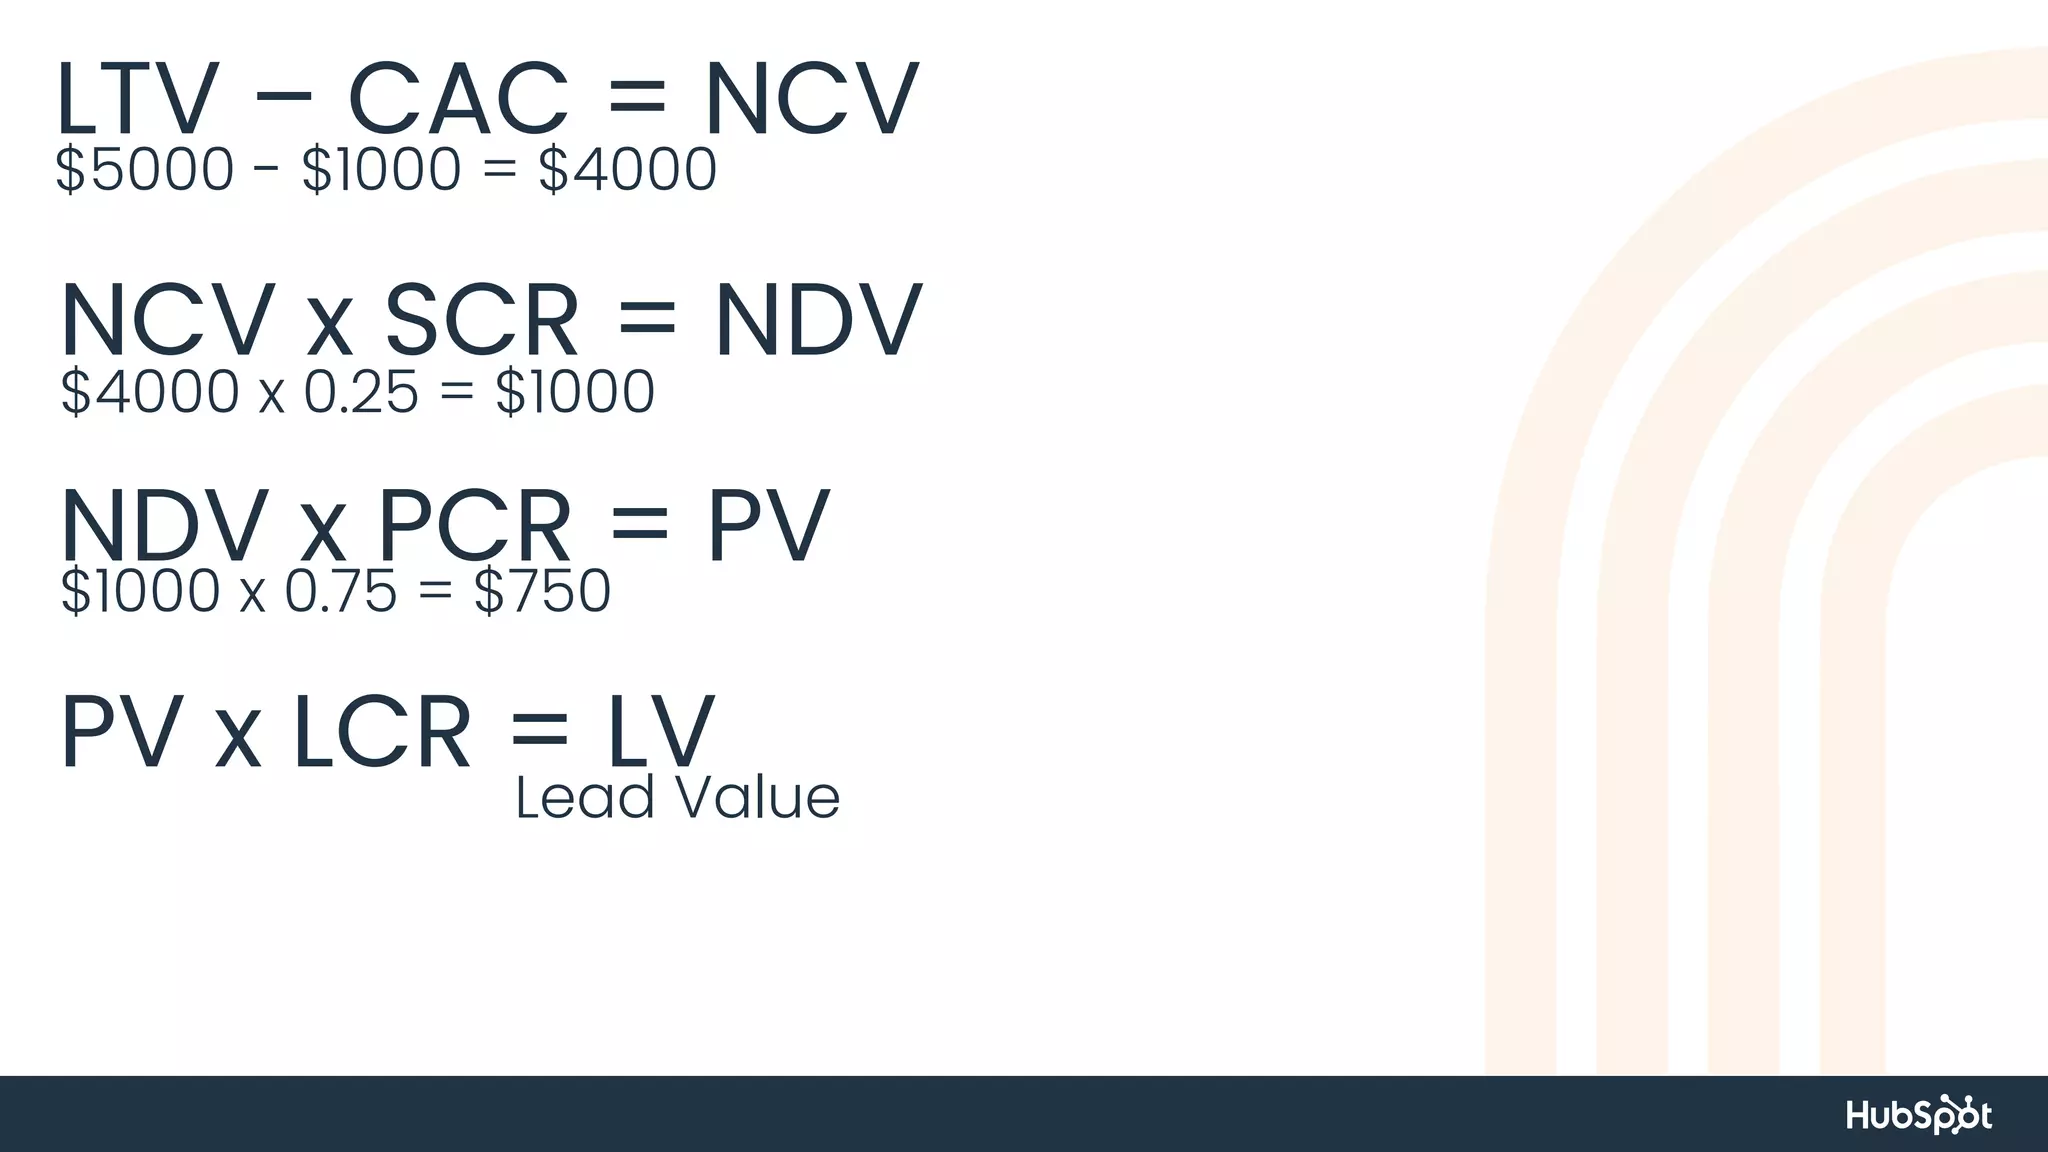
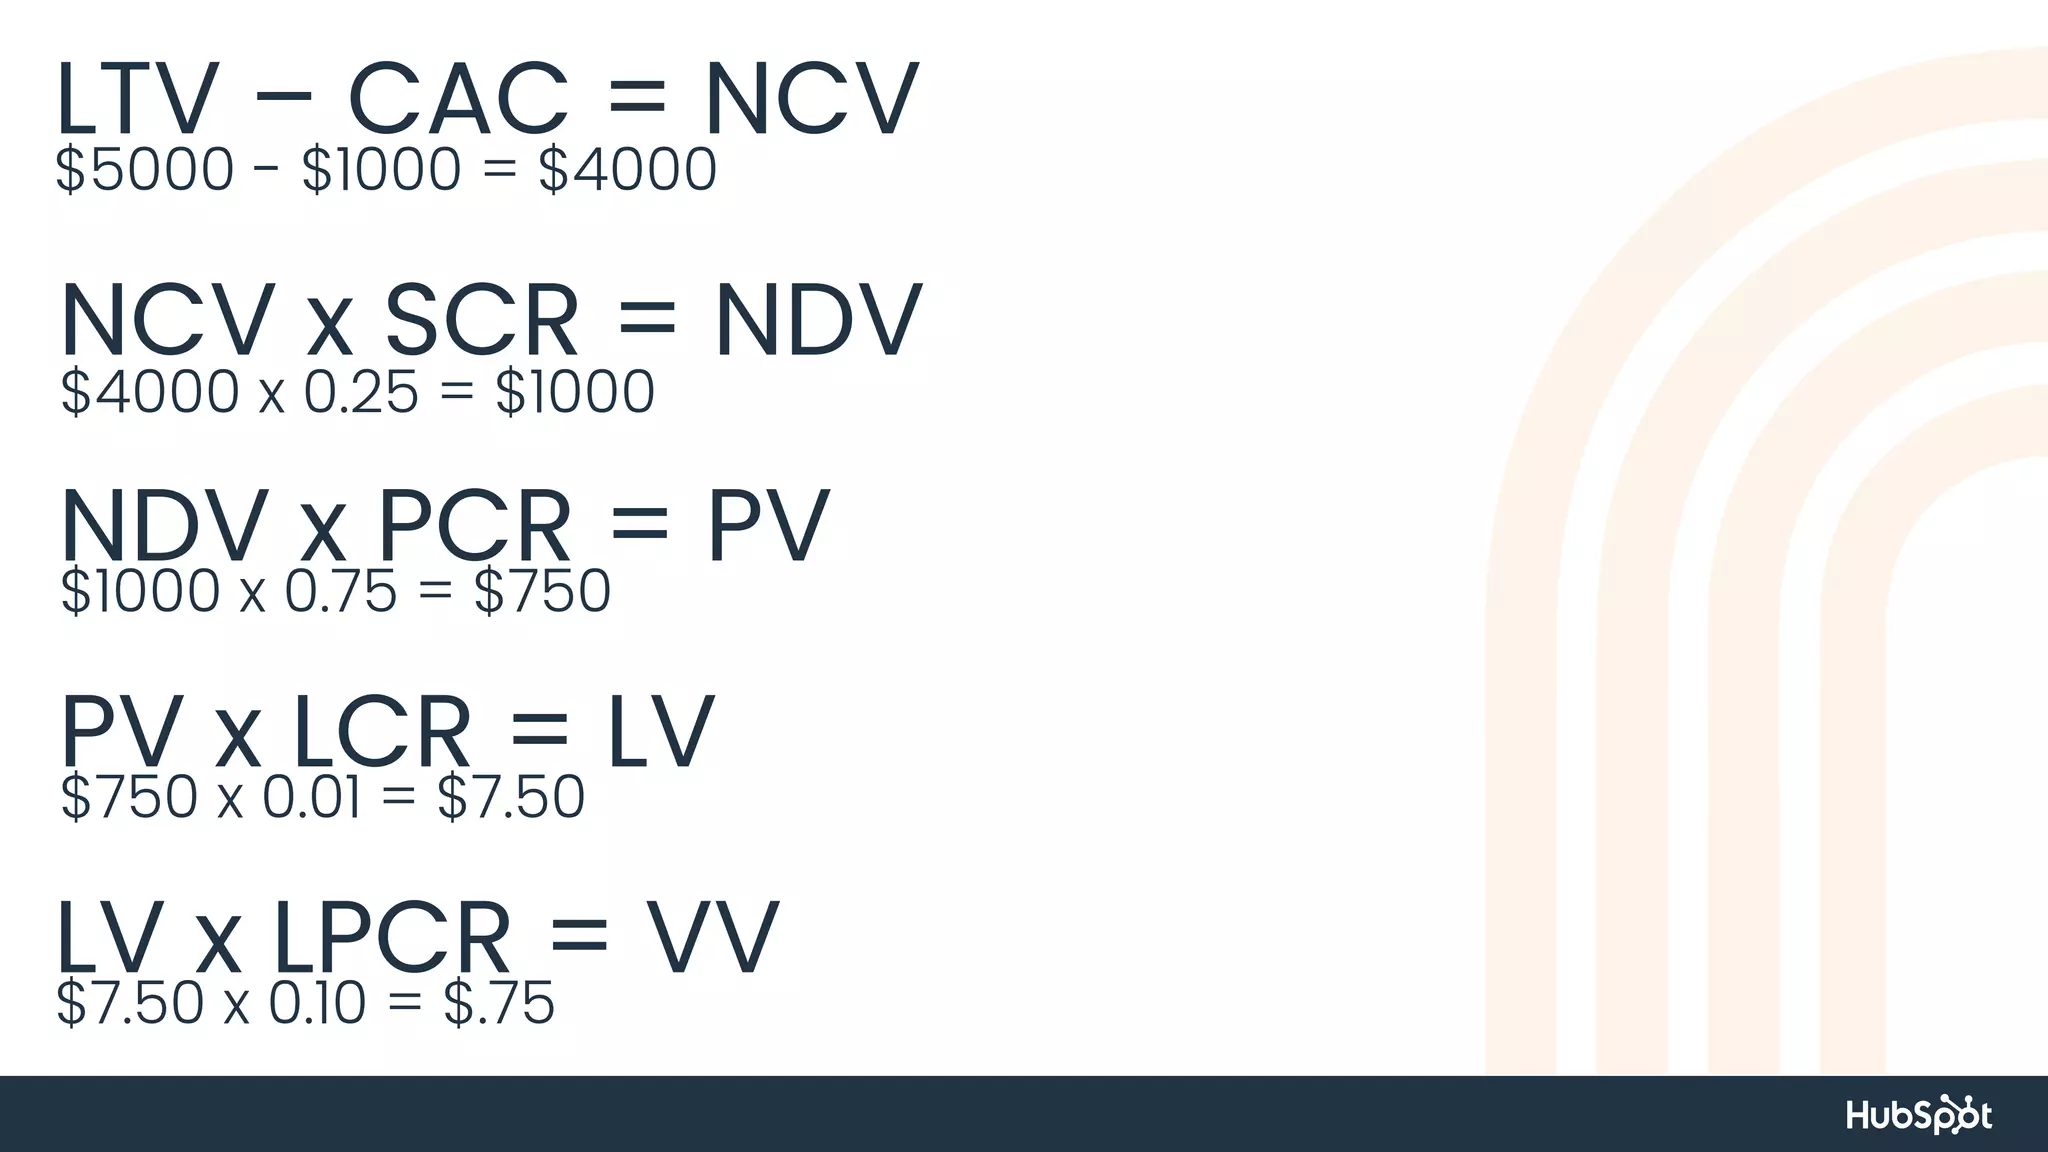
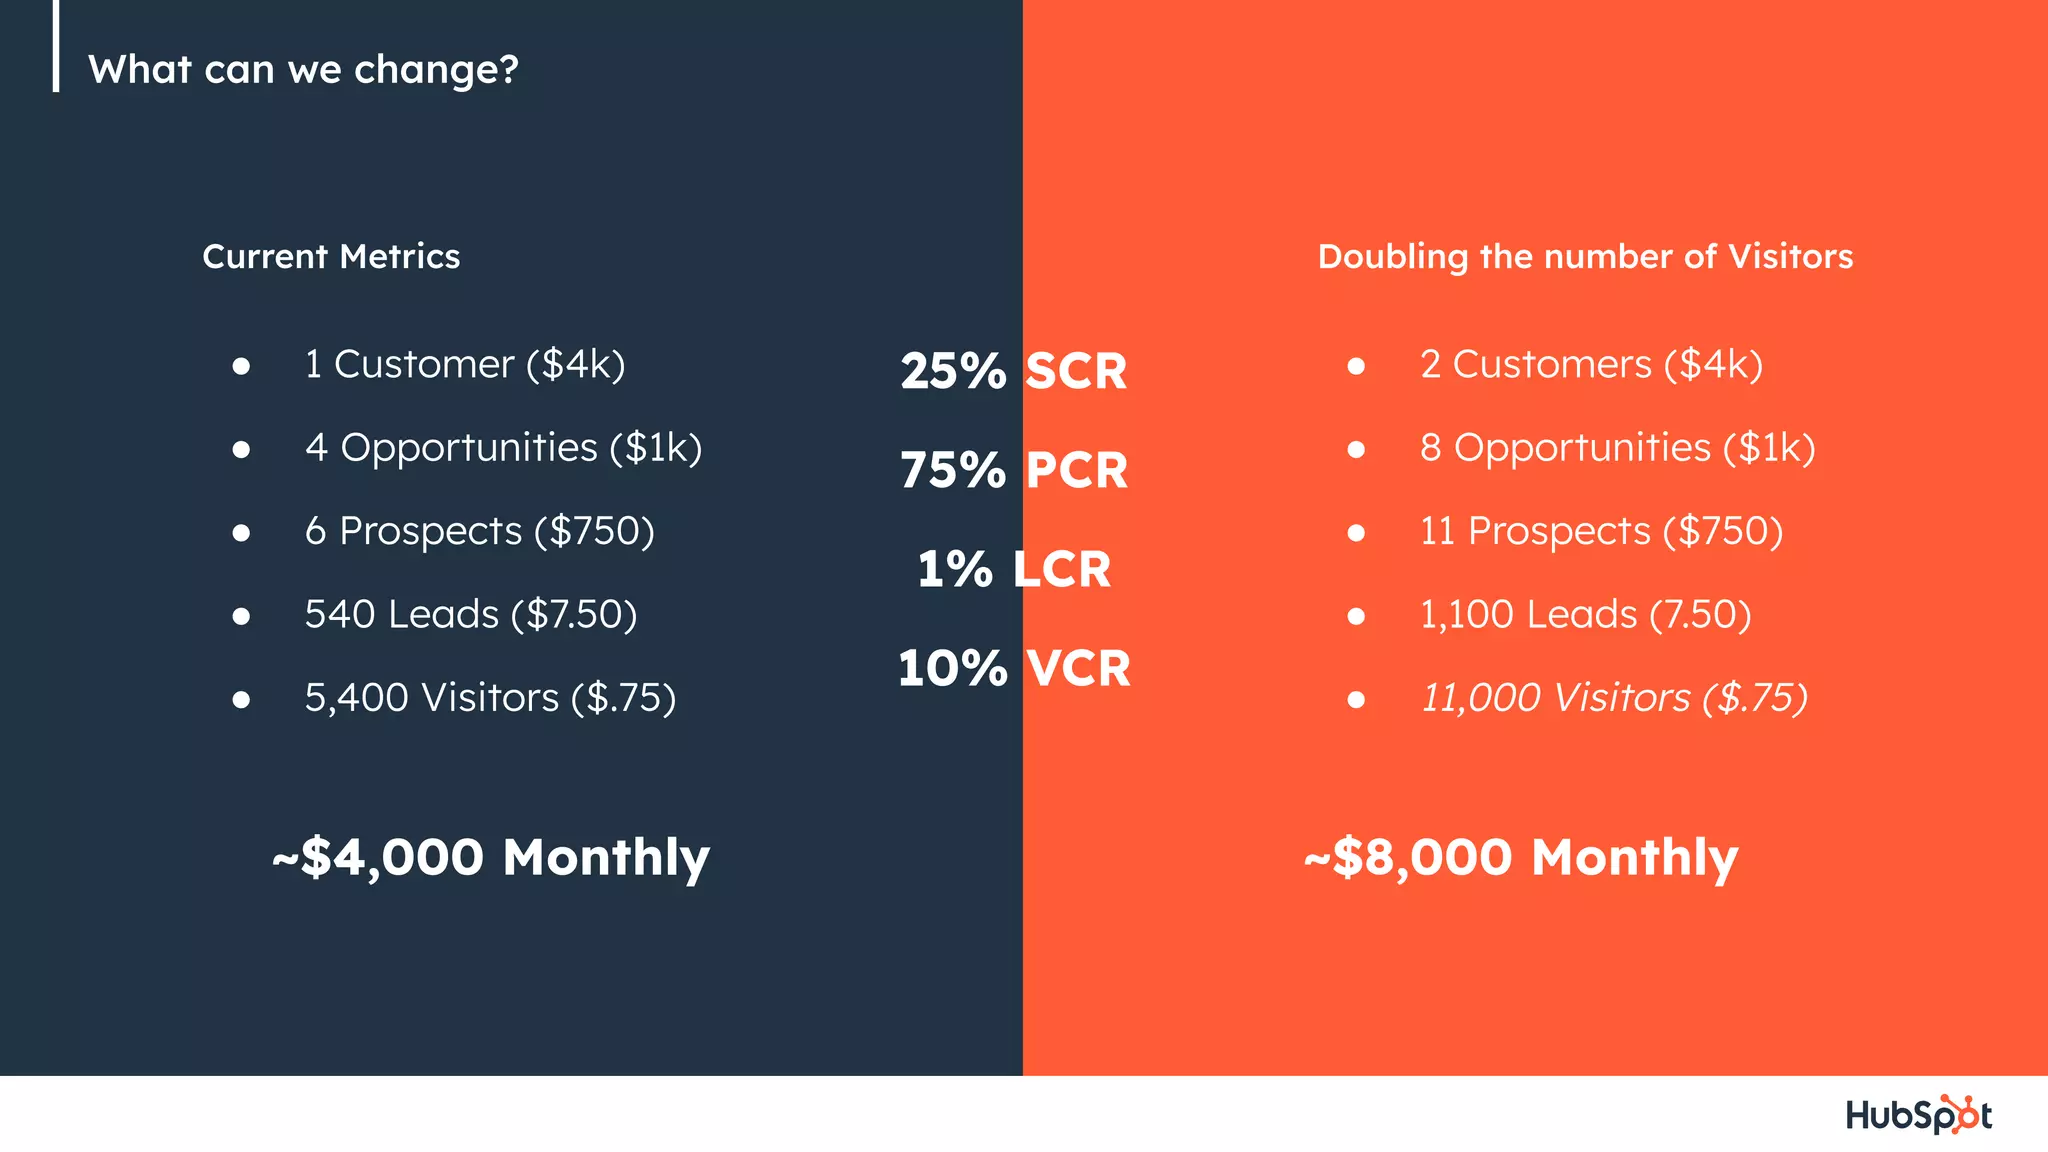
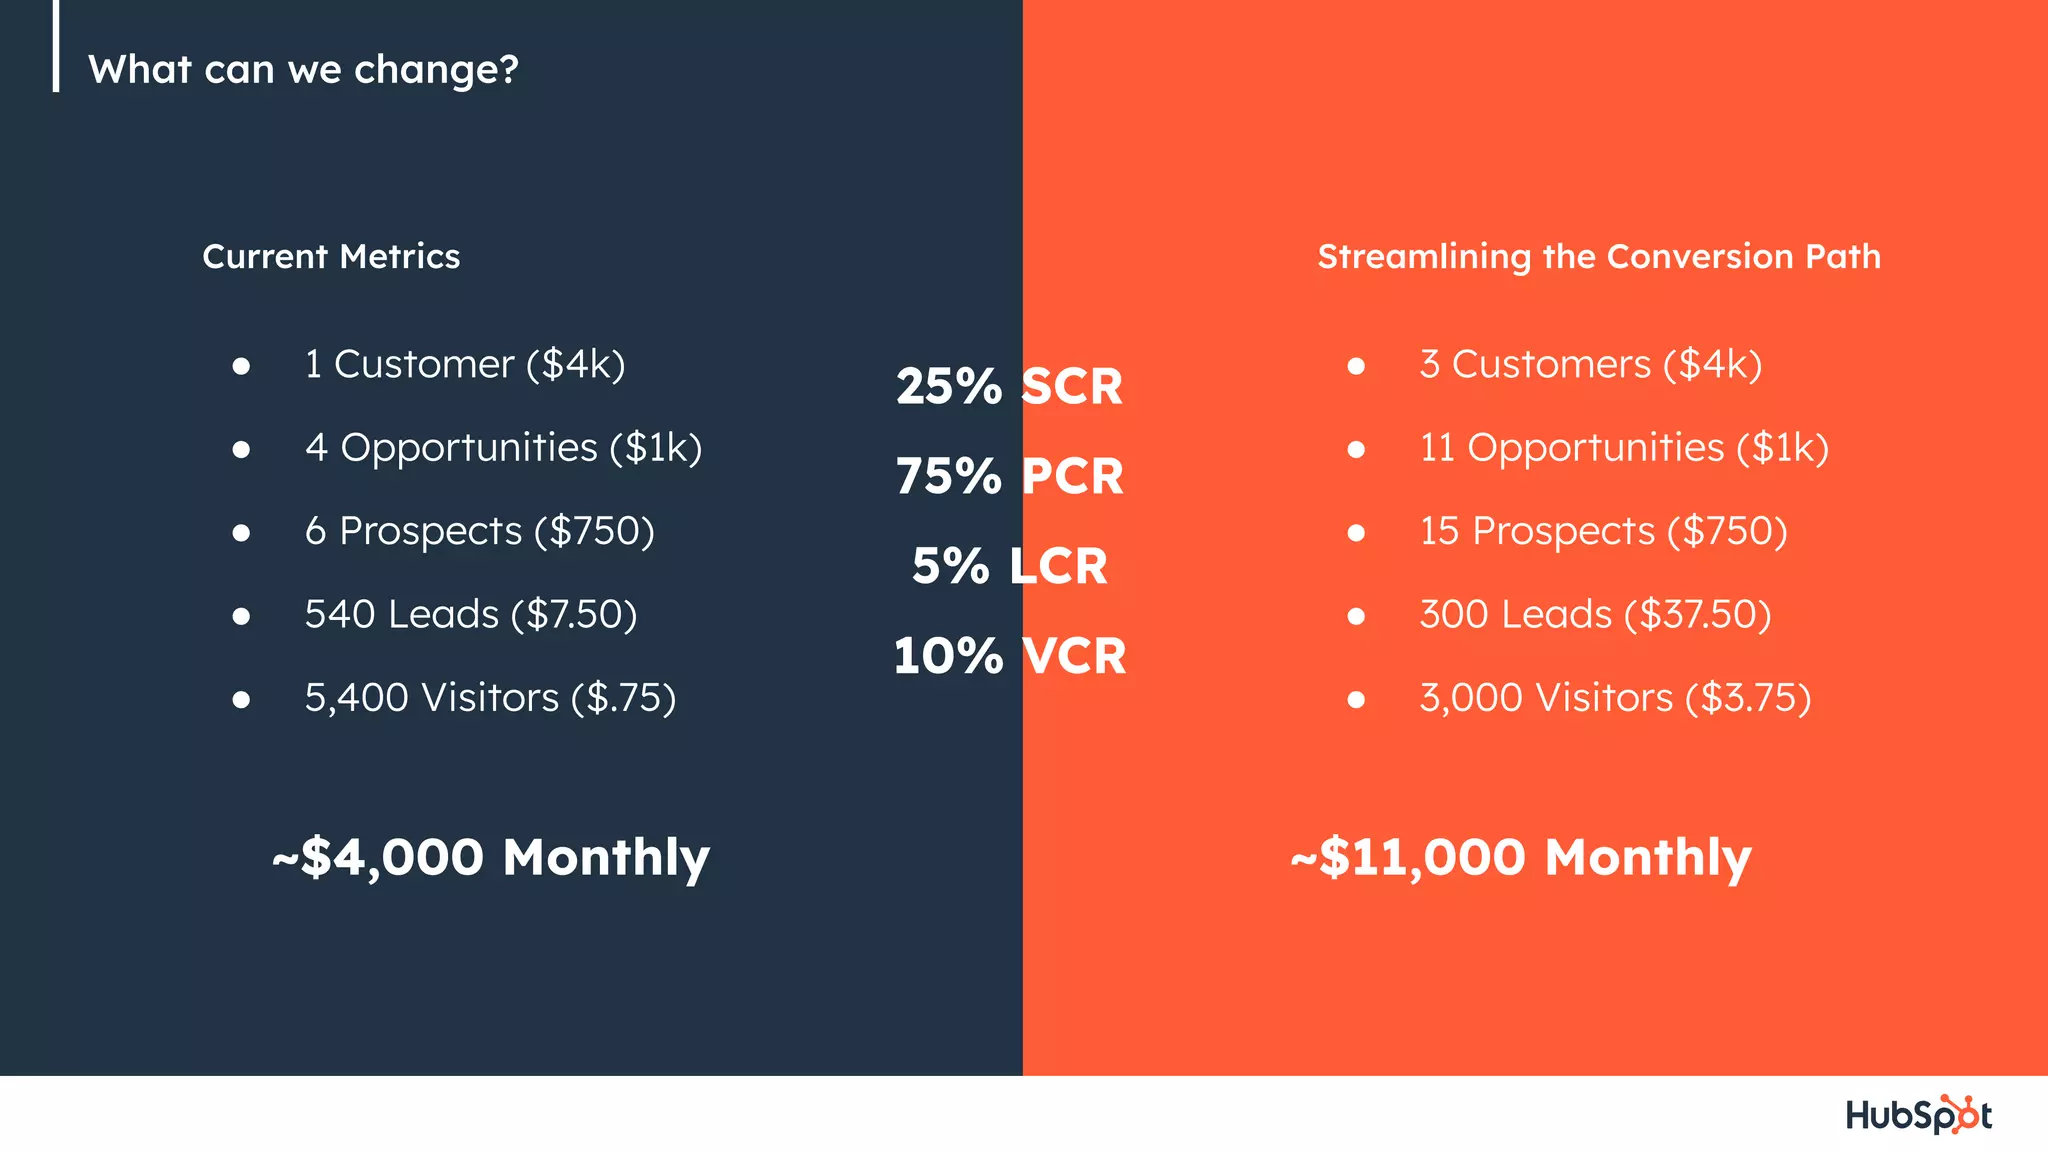
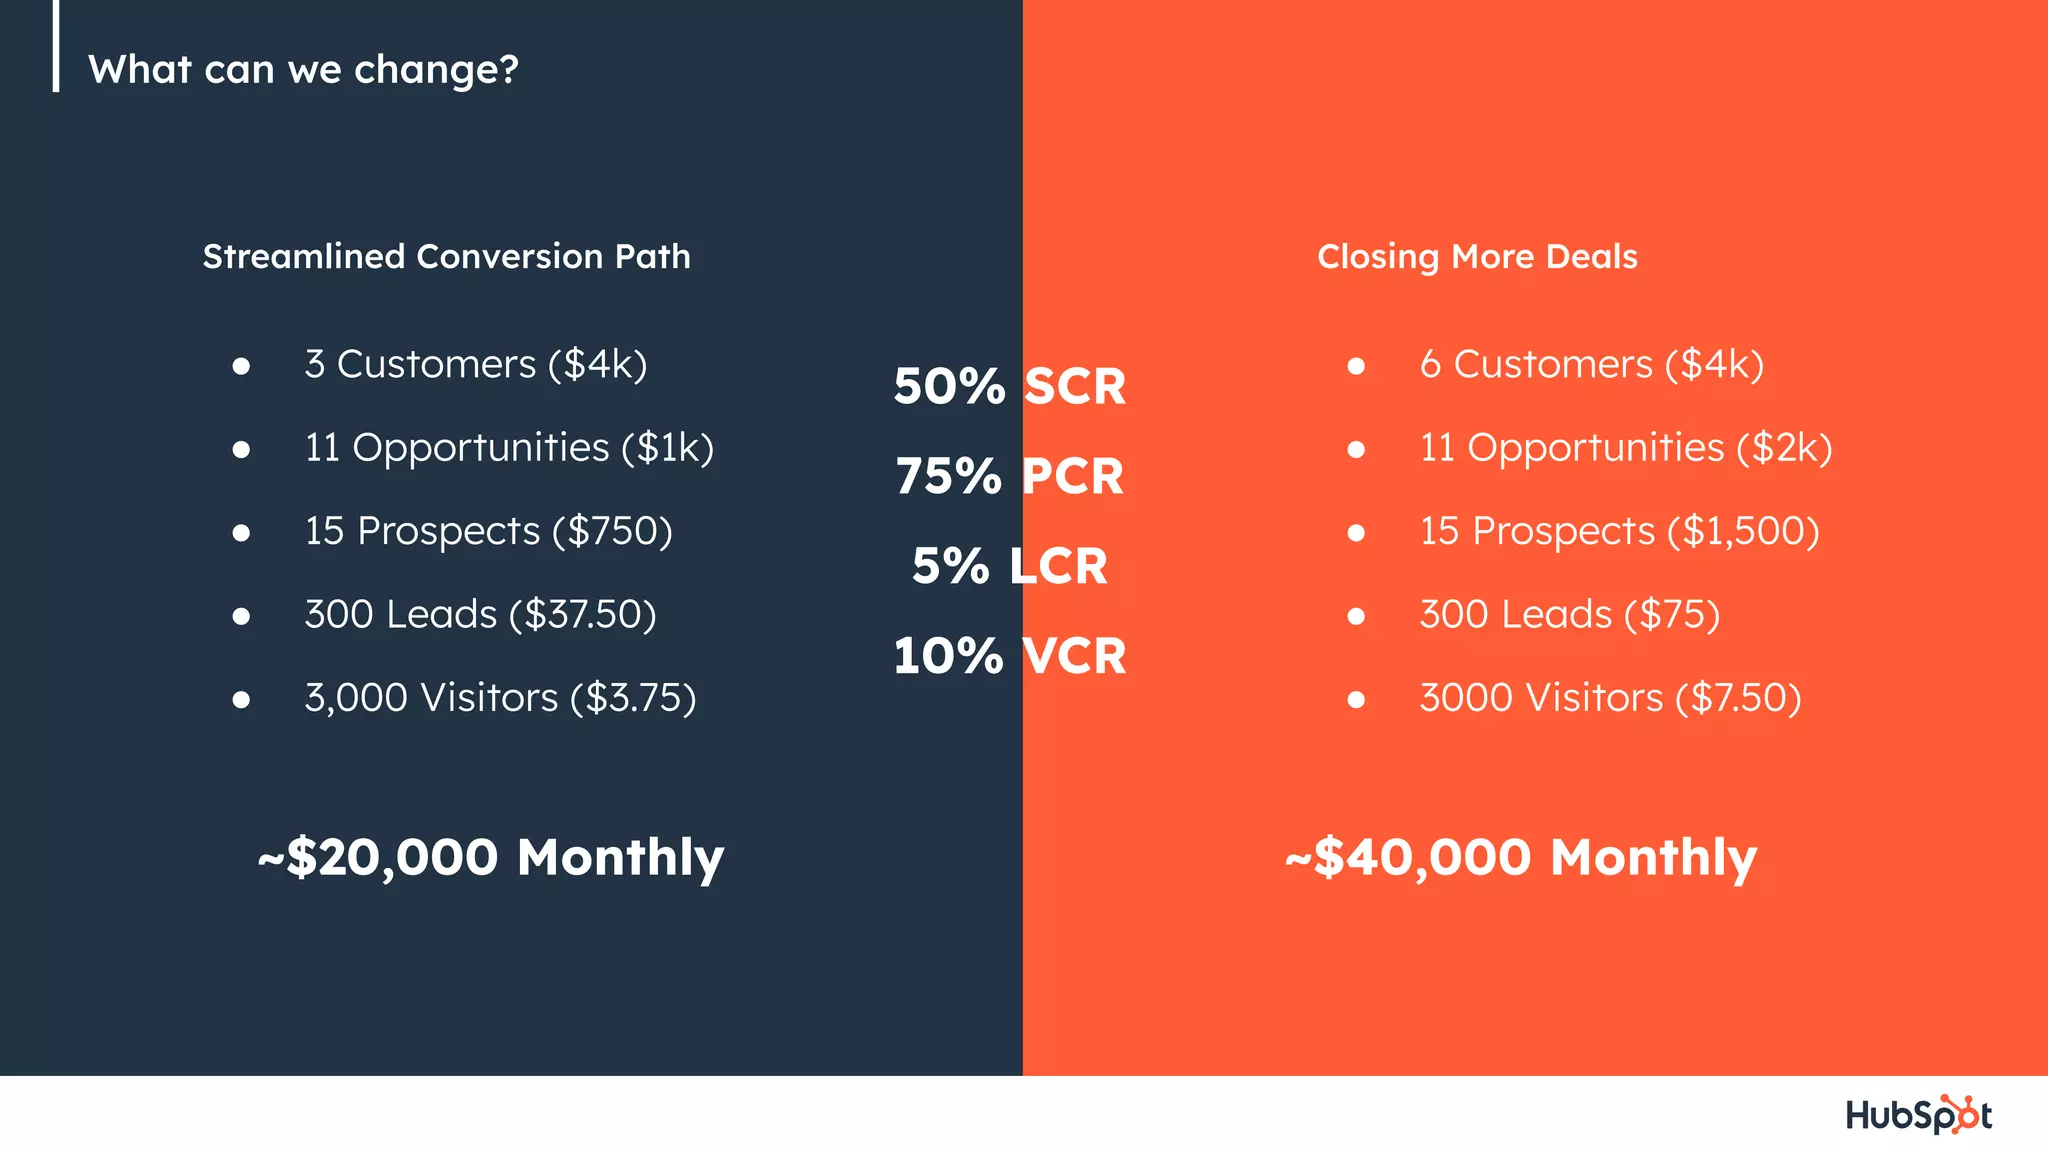
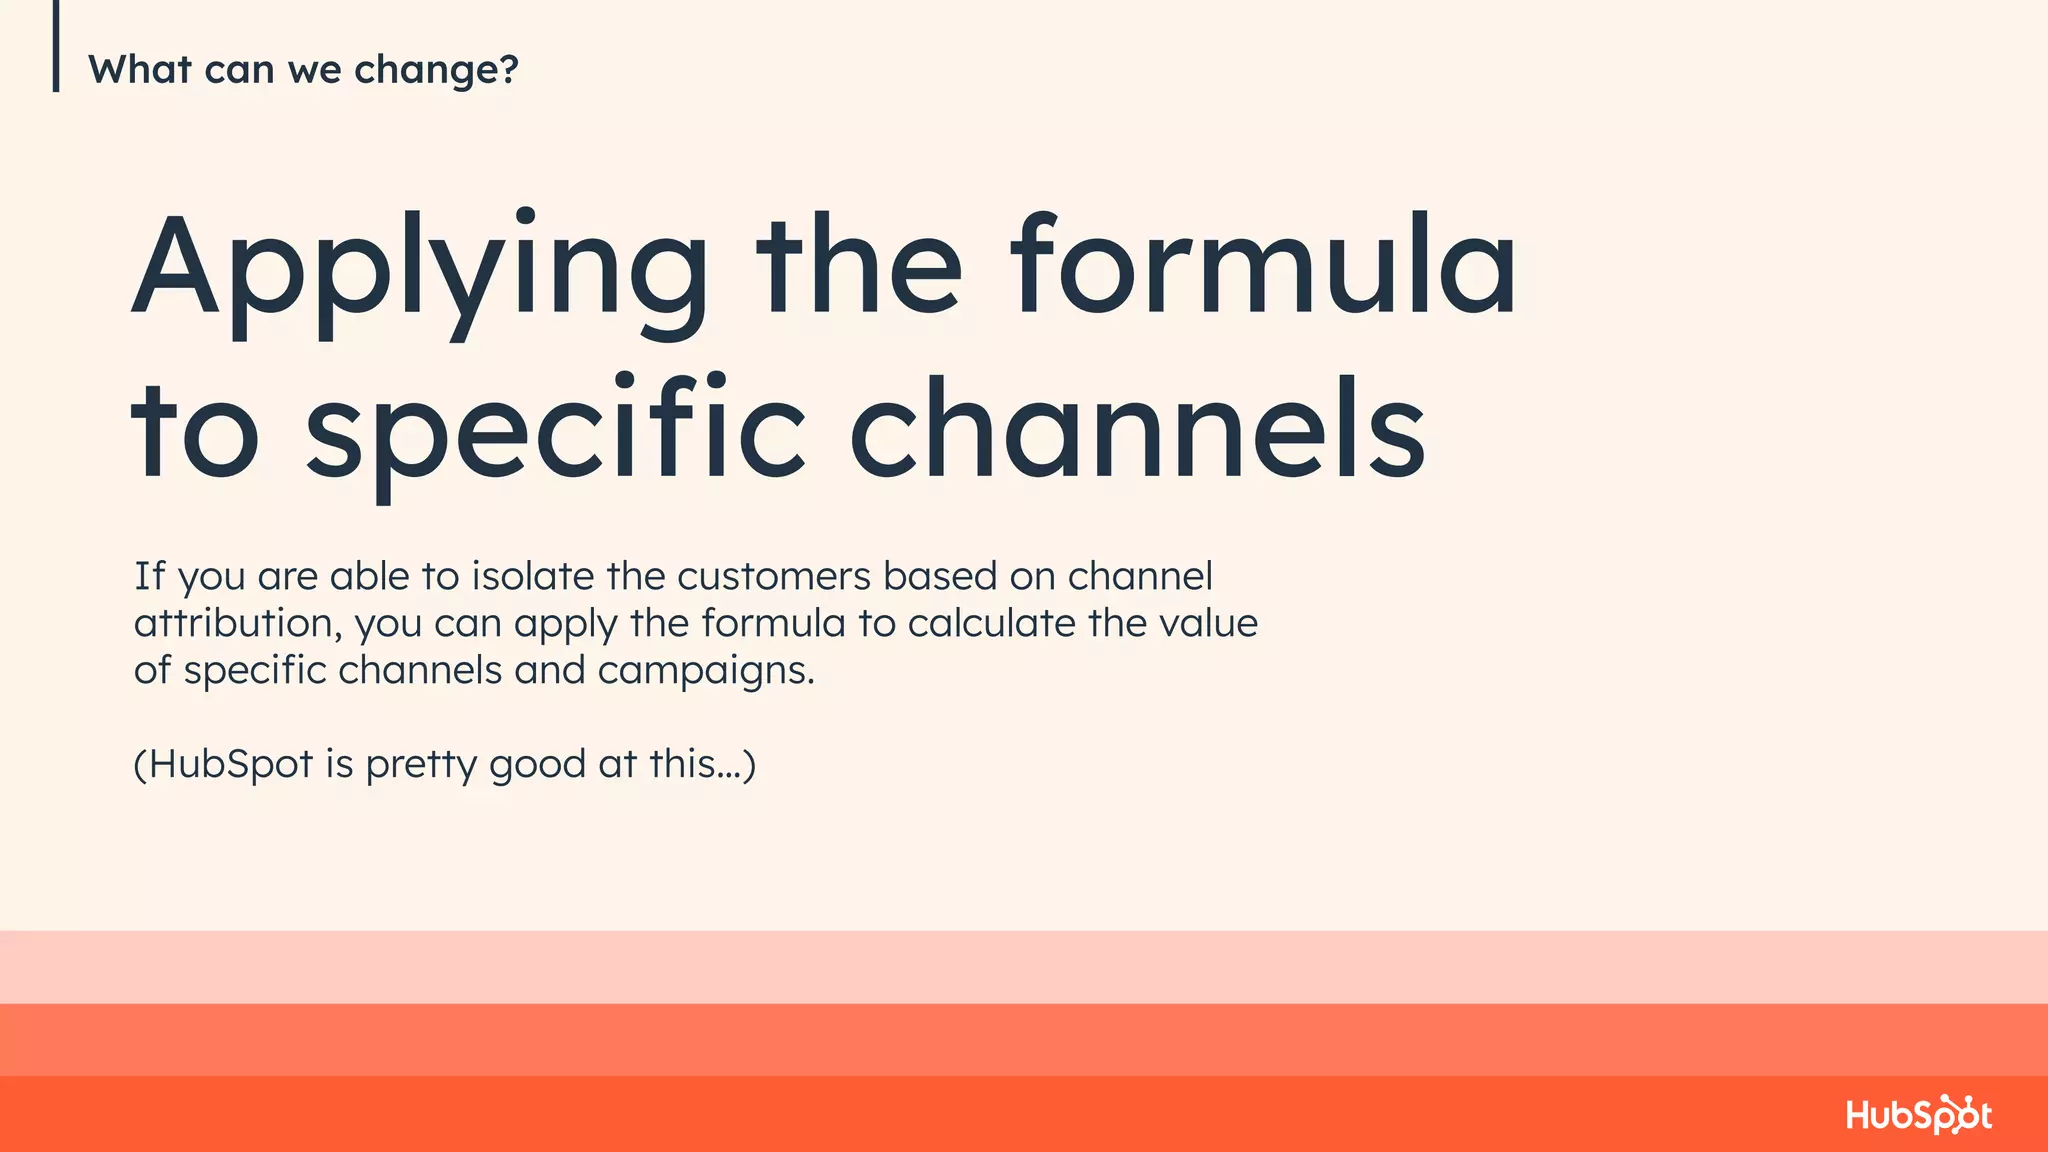
Adding Financial Metrics to the Conversion Path
Calculating Lead Values
Hi, I’m Devyn
I’ve been marketing since the dial-up
days. My paid social media campaign
was on MySpace. I learned how to do
everything in this presentation by going
to INBOUND in 2016.
I went to college to be a High School
Band Director.
Vanity Metrics Vs Real Metrics
Information You’ll
Need
Gather the metrics
you’ll need to perform
the calculations
Doing the
Math
The magic, career
changing formula to
calculate lead values
Applying the
information
How to take this
information to the
next level
Growth
Tips
How can you improve
your conversion rates
by being better
What We’ll Go Over
Marketing is giving
us bad leads.
- Every sales team that misses their metrics
C-Suite when the sales team’s goals are met and they want a new ivory back scratcher
C-Suite when the Marketing Team asks for budget
Information You’ll Need
It’s ok if you don’t have perfect numbers, but you can fudge to
get started with the understanding that metrics will be tracked in
the future.
● Customer Acquisition Cost
○ How much does it cost to get a new customer
● Customer Lifetime Value
○ How much does the average customer spend during
their time with the company
● Sales Pipeline Definitions and Conversion Rates
○ Close rates, Opportunity to Demo Rates, etc
Warning: Math
Ahead
LTV
Lifetime Value
If your company only sells one off, then how much is the average
customer order? If your company sells subscription services, find how
much they spend on average, and determine the customer life span,
then multiply the two numbers.
If the customer spends $1000/year for 5 years on average, the LTV
would be $5000.
LTV – CAC
Customer Acquisition Cost
The CAC can be calculated by simply dividing all the costs spent on acquiring
more customers (marketing expenses) by the number of customers acquired in
the period the money was spent. This can be a pretty scary number if you are
blowing money on marketing, and aren’t seeing much in return.
For example, if a company spent $100,000 on marketing in a year and
acquired 100 customers in the same year, their CAC is $1000.00.
LTV – CAC = NCV
Net Customer Value
Your Net Customer Value is what you get when you subtract your Customer
Acquisition Cost from your Lifetime Value. This number can be scary, too.
Sometimes, it can even be negative. This is usually the first wake up call for
organizations when looking at their marketing spend.
LTV – CAC = NCV
$5000 - $1000 = $4000
LTV – CAC = NCV
$5000 - $1000 = $4000
NCV
Net Customer Value
LTV – CAC = NCV
$5000 - $1000 = $4000
NCV x SCR
Sales Close Rate
The Sales Close Ratio measures the number of prospects engaged by
your sales team compared to the number of deals won. This number is a
percentage.
LTV – CAC = NCV
$5000 - $1000 = $4000
NCV x SCR = NDV
Net Deal Value
This is the measurable dollar value of every pitch or demonstration you give.
LTV – CAC = NCV
$5000 - $1000 = $4000
NCV x SCR = NDV
$4000 x 0.25 = $1000
So if you net $4000 on every customer, and you are closing 1 out of every 4
people you pitch, every person you pitch is worth $1000. Even if they say no,
it is still a win, because if 1 out of 4 people say yes, the more people you talk
to the more money you make!
Weak sales orgs don’t typically track this metric.
LTV – CAC = NCV
$5000 - $1000 = $4000
NCV x SCR = NDV
$4000 x 0.25 = $1000
NDV
Net Deal Value
LTV – CAC = NCV
$5000 - $1000 = $4000
NCV x SCR = NDV
$4000 x 0.25 = $1000
NDV x PCR
Prospect Conversion Rate
This is the number of leads you get that turn out to be qualified to pitch, or
give a demo. This number is a percentage.
LTV – CAC = NCV
$5000 - $1000 = $4000
NCV x SCR = NDV
$4000 x 0.25 = $1000
NDV x PCR = PV
Prospect Value
Now we know the measurable dollar value of your qualified leads.
LTV – CAC = NCV
$5000 - $1000 = $4000
NCV x SCR = NDV
$4000 x 0.25 = $1000
NDV x PCR = PV
$1000 x 0.75 = $750
So let’s say you have killer conversion paths and 75% percent of the
people you come in contact with are at the consideration or decision stages
of your funnel. Each of your prospects are worth $750.
LTV – CAC = NCV
$5000 - $1000 = $4000
NCV x SCR = NDV
$4000 x 0.25 = $1000
NDV x PCR = PV
$1000 x 0.75 = $750
PV
Prospect Value
LTV – CAC = NCV
$5000 - $1000 = $4000
NCV x SCR = NDV
$4000 x 0.25 = $1000
NDV x PCR = PV
$1000 x 0.75 = $750
PV x LCR
Lead Conversion Rate
This is the percentage of people who come in contact with your brand who
decide to call in, opt in, fill out a form, or otherwise give you their
information that were qualified prospects.
LTV – CAC = NCV
$5000 - $1000 = $4000
NCV x SCR = NDV
$4000 x 0.25 = $1000
NDV x PCR = PV
$1000 x 0.75 = $750
PV x LCR = LV
Lead Value
LTV – CAC = NCV
$5000 - $1000 = $4000
NCV x SCR = NDV
$4000 x 0.25 = $1000
NDV x PCR = PV
$1000 x 0.75 = $750
PV x LCR = LV
$750 x 0.01 = $7.50
You now have a monetary value associated with every hand raiser that
comes in contact with your brand. Every person who you enters their
information into your CRM is worth $7.50
LTV – CAC = NCV
$5000 - $1000 = $4000
NCV x SCR = NDV
$4000 x 0.25 = $1000
NDV x PCR = PV
$1000 x 0.75 = $750
PV x LCR = LV
$750 x 0.01 = $7.50
LV x LPCR = VV
$7.50 x 0.10 = $.75
That was a lot.
How to use this information
There are three ways to make more money. Get more
customers, cut costs, or raise prices. Since the last two are
probably out of your control, you need to focus on the first.
You can use this data to inform your sales and marketing
leadership where to improve your operations, and where to
apply more force to your flywheel.
● 1 Customer ($4k)
● 4 Opportunities ($1k)
● 6 Prospects ($750)
● 540 Leads ($7.50)
● 5,400 Visitors ($.75)
Current Metrics
● 2 Customers ($4k)
● 8 Opportunities ($1k)
● 11 Prospects ($750)
● 1,100 Leads (7.50)
● 11,000 Visitors ($.75)
Doubling the number of Visitors
What can we change?
25% SCR
75% PCR
1% LCR
10% VCR
~$4,000 Monthly ~$8,000 Monthly
What else can we change?
Let’s, instead, look at the playing with some of the conversion
rates. If you use the data to tell a story, you can see that only 1
percent of the leads are qualified to become prospects.
● Students filling out forms
● People trying to sell you stuff
● Non-Targeted Messaging and CTAs
● Too many forms
● SPAMMERS
● 1 Customer ($4k)
● 4 Opportunities ($1k)
● 6 Prospects ($750)
● 540 Leads ($7.50)
● 5,400 Visitors ($.75)
Current Metrics
● 3 Customers ($4k)
● 11 Opportunities ($1k)
● 15 Prospects ($750)
● 300 Leads ($37.50)
● 3,000 Visitors ($3.75)
Streamlining the Conversion Path
What can we change?
25% SCR
75% PCR
5% LCR
10% VCR
~$4,000 Monthly ~$11,000 Monthly
● 3 Customers ($4k)
● 11 Opportunities ($1k)
● 15 Prospects ($750)
● 300 Leads ($37.50)
● 3,000 Visitors ($3.75)
Streamlined Conversion Path
● 6 Customers ($4k)
● 11 Opportunities ($2k)
● 15 Prospects ($1,500)
● 300 Leads ($75)
● 3000 Visitors ($7.50)
Closing More Deals
What can we change?
50% SCR
75% PCR
5% LCR
10% VCR
~$20,000 Monthly ~$40,000 Monthly
What can we change?
Applying the formula
to specific channels
If you are able to isolate the customers based on channel
attribution, you can apply the formula to calculate the value
of specific channels and campaigns.
(HubSpot is pretty good at this…)
Let’s say you look at your social media and find you
have a VERY high number of hand raisers that
convert from that channel:
● 25 Leads
● 13 Prospects
● 9 Opportunities
● 2 Customers
1% LCR
75% PCR
25% SCR
~$9,000 Monthly
What can we change?
Channel Metrics
Growth Tips
● More Visitors
○ Paid Ads
○ Social Media
○ SEO/Content Strategy
○ Video content creation
● Visitor to Lead Conversion Rates
○ Site redesign
○ Form management
○ Content Offers
● Lead to Prospect Rates
○ Retargeting Ads
○ Solid Email Marketing
○ CRM Segmentation
● Prospect to Opportunity Rates
○ Sales and Marketing Alignment
○ Sales Enablement
○ Playbooks
○ Sales Sequences
● Opportunity to Close Rates
○ Better demo calls
○ Custom presentations
○ Consultative selling
○ Sales Training (Sandler, etc)
Growth Tips
QUESTION TIME!!
Thank you
Free Lead Value Calculator
LinkedIn

LA HUG - Conversion Path Metrics

  • 1.
    Adding Financial Metricsto the Conversion Path Calculating Lead Values
  • 2.
    Hi, I’m Devyn I’vebeen marketing since the dial-up days. My paid social media campaign was on MySpace. I learned how to do everything in this presentation by going to INBOUND in 2016. I went to college to be a High School Band Director. Vanity Metrics Vs Real Metrics
  • 3.
    Information You’ll Need Gather themetrics you’ll need to perform the calculations Doing the Math The magic, career changing formula to calculate lead values Applying the information How to take this information to the next level Growth Tips How can you improve your conversion rates by being better What We’ll Go Over
  • 4.
    Marketing is giving usbad leads. - Every sales team that misses their metrics
  • 5.
    C-Suite when thesales team’s goals are met and they want a new ivory back scratcher
  • 6.
    C-Suite when theMarketing Team asks for budget
  • 7.
    Information You’ll Need It’sok if you don’t have perfect numbers, but you can fudge to get started with the understanding that metrics will be tracked in the future. ● Customer Acquisition Cost ○ How much does it cost to get a new customer ● Customer Lifetime Value ○ How much does the average customer spend during their time with the company ● Sales Pipeline Definitions and Conversion Rates ○ Close rates, Opportunity to Demo Rates, etc
  • 8.
  • 9.
    LTV Lifetime Value If yourcompany only sells one off, then how much is the average customer order? If your company sells subscription services, find how much they spend on average, and determine the customer life span, then multiply the two numbers. If the customer spends $1000/year for 5 years on average, the LTV would be $5000.
  • 10.
    LTV – CAC CustomerAcquisition Cost The CAC can be calculated by simply dividing all the costs spent on acquiring more customers (marketing expenses) by the number of customers acquired in the period the money was spent. This can be a pretty scary number if you are blowing money on marketing, and aren’t seeing much in return. For example, if a company spent $100,000 on marketing in a year and acquired 100 customers in the same year, their CAC is $1000.00.
  • 11.
    LTV – CAC= NCV Net Customer Value Your Net Customer Value is what you get when you subtract your Customer Acquisition Cost from your Lifetime Value. This number can be scary, too. Sometimes, it can even be negative. This is usually the first wake up call for organizations when looking at their marketing spend.
  • 12.
    LTV – CAC= NCV $5000 - $1000 = $4000
  • 13.
    LTV – CAC= NCV $5000 - $1000 = $4000 NCV Net Customer Value
  • 14.
    LTV – CAC= NCV $5000 - $1000 = $4000 NCV x SCR Sales Close Rate The Sales Close Ratio measures the number of prospects engaged by your sales team compared to the number of deals won. This number is a percentage.
  • 15.
    LTV – CAC= NCV $5000 - $1000 = $4000 NCV x SCR = NDV Net Deal Value This is the measurable dollar value of every pitch or demonstration you give.
  • 16.
    LTV – CAC= NCV $5000 - $1000 = $4000 NCV x SCR = NDV $4000 x 0.25 = $1000 So if you net $4000 on every customer, and you are closing 1 out of every 4 people you pitch, every person you pitch is worth $1000. Even if they say no, it is still a win, because if 1 out of 4 people say yes, the more people you talk to the more money you make! Weak sales orgs don’t typically track this metric.
  • 17.
    LTV – CAC= NCV $5000 - $1000 = $4000 NCV x SCR = NDV $4000 x 0.25 = $1000 NDV Net Deal Value
  • 18.
    LTV – CAC= NCV $5000 - $1000 = $4000 NCV x SCR = NDV $4000 x 0.25 = $1000 NDV x PCR Prospect Conversion Rate This is the number of leads you get that turn out to be qualified to pitch, or give a demo. This number is a percentage.
  • 19.
    LTV – CAC= NCV $5000 - $1000 = $4000 NCV x SCR = NDV $4000 x 0.25 = $1000 NDV x PCR = PV Prospect Value Now we know the measurable dollar value of your qualified leads.
  • 20.
    LTV – CAC= NCV $5000 - $1000 = $4000 NCV x SCR = NDV $4000 x 0.25 = $1000 NDV x PCR = PV $1000 x 0.75 = $750 So let’s say you have killer conversion paths and 75% percent of the people you come in contact with are at the consideration or decision stages of your funnel. Each of your prospects are worth $750.
  • 21.
    LTV – CAC= NCV $5000 - $1000 = $4000 NCV x SCR = NDV $4000 x 0.25 = $1000 NDV x PCR = PV $1000 x 0.75 = $750 PV Prospect Value
  • 22.
    LTV – CAC= NCV $5000 - $1000 = $4000 NCV x SCR = NDV $4000 x 0.25 = $1000 NDV x PCR = PV $1000 x 0.75 = $750 PV x LCR Lead Conversion Rate This is the percentage of people who come in contact with your brand who decide to call in, opt in, fill out a form, or otherwise give you their information that were qualified prospects.
  • 23.
    LTV – CAC= NCV $5000 - $1000 = $4000 NCV x SCR = NDV $4000 x 0.25 = $1000 NDV x PCR = PV $1000 x 0.75 = $750 PV x LCR = LV Lead Value
  • 24.
    LTV – CAC= NCV $5000 - $1000 = $4000 NCV x SCR = NDV $4000 x 0.25 = $1000 NDV x PCR = PV $1000 x 0.75 = $750 PV x LCR = LV $750 x 0.01 = $7.50 You now have a monetary value associated with every hand raiser that comes in contact with your brand. Every person who you enters their information into your CRM is worth $7.50
  • 25.
    LTV – CAC= NCV $5000 - $1000 = $4000 NCV x SCR = NDV $4000 x 0.25 = $1000 NDV x PCR = PV $1000 x 0.75 = $750 PV x LCR = LV $750 x 0.01 = $7.50 LV x LPCR = VV $7.50 x 0.10 = $.75
  • 26.
  • 27.
    How to usethis information There are three ways to make more money. Get more customers, cut costs, or raise prices. Since the last two are probably out of your control, you need to focus on the first. You can use this data to inform your sales and marketing leadership where to improve your operations, and where to apply more force to your flywheel.
  • 28.
    ● 1 Customer($4k) ● 4 Opportunities ($1k) ● 6 Prospects ($750) ● 540 Leads ($7.50) ● 5,400 Visitors ($.75) Current Metrics ● 2 Customers ($4k) ● 8 Opportunities ($1k) ● 11 Prospects ($750) ● 1,100 Leads (7.50) ● 11,000 Visitors ($.75) Doubling the number of Visitors What can we change? 25% SCR 75% PCR 1% LCR 10% VCR ~$4,000 Monthly ~$8,000 Monthly
  • 29.
    What else canwe change? Let’s, instead, look at the playing with some of the conversion rates. If you use the data to tell a story, you can see that only 1 percent of the leads are qualified to become prospects. ● Students filling out forms ● People trying to sell you stuff ● Non-Targeted Messaging and CTAs ● Too many forms ● SPAMMERS
  • 30.
    ● 1 Customer($4k) ● 4 Opportunities ($1k) ● 6 Prospects ($750) ● 540 Leads ($7.50) ● 5,400 Visitors ($.75) Current Metrics ● 3 Customers ($4k) ● 11 Opportunities ($1k) ● 15 Prospects ($750) ● 300 Leads ($37.50) ● 3,000 Visitors ($3.75) Streamlining the Conversion Path What can we change? 25% SCR 75% PCR 5% LCR 10% VCR ~$4,000 Monthly ~$11,000 Monthly
  • 31.
    ● 3 Customers($4k) ● 11 Opportunities ($1k) ● 15 Prospects ($750) ● 300 Leads ($37.50) ● 3,000 Visitors ($3.75) Streamlined Conversion Path ● 6 Customers ($4k) ● 11 Opportunities ($2k) ● 15 Prospects ($1,500) ● 300 Leads ($75) ● 3000 Visitors ($7.50) Closing More Deals What can we change? 50% SCR 75% PCR 5% LCR 10% VCR ~$20,000 Monthly ~$40,000 Monthly
  • 32.
    What can wechange? Applying the formula to specific channels If you are able to isolate the customers based on channel attribution, you can apply the formula to calculate the value of specific channels and campaigns. (HubSpot is pretty good at this…)
  • 33.
    Let’s say youlook at your social media and find you have a VERY high number of hand raisers that convert from that channel: ● 25 Leads ● 13 Prospects ● 9 Opportunities ● 2 Customers 1% LCR 75% PCR 25% SCR ~$9,000 Monthly What can we change? Channel Metrics
  • 34.
    Growth Tips ● MoreVisitors ○ Paid Ads ○ Social Media ○ SEO/Content Strategy ○ Video content creation ● Visitor to Lead Conversion Rates ○ Site redesign ○ Form management ○ Content Offers ● Lead to Prospect Rates ○ Retargeting Ads ○ Solid Email Marketing ○ CRM Segmentation
  • 35.
    ● Prospect toOpportunity Rates ○ Sales and Marketing Alignment ○ Sales Enablement ○ Playbooks ○ Sales Sequences ● Opportunity to Close Rates ○ Better demo calls ○ Custom presentations ○ Consultative selling ○ Sales Training (Sandler, etc) Growth Tips
  • 36.
  • 37.
    Thank you Free LeadValue Calculator LinkedIn