Download as PDF, PPTX

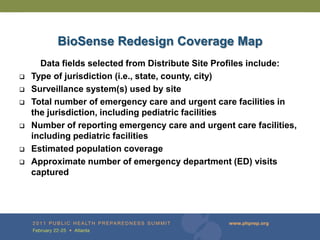
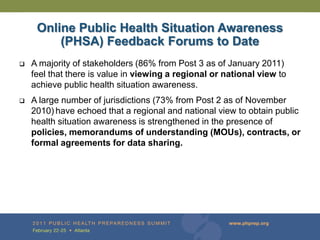
![BioSense Program
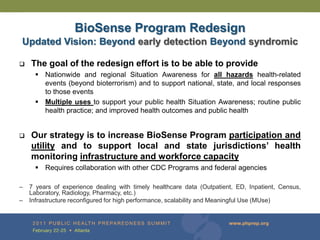
Civilian Hospitals
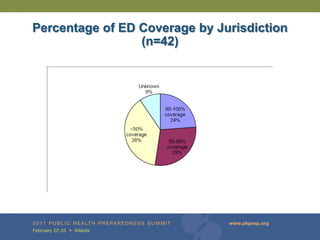
• ~640 facilities [~12% ED coverage in US, patchy geo
coverage] [Chief complaints: median 24-hour
latency, Diagnoses: median 6 days latency]
• 8 health department sending data from 482
hospitals
• 165 facilities reporting ED data directly to CDC
or a health department
Veterans Affairs and Department of Defense
• ~1400 facilities in 50 states, District of Columbia, and
Puerto Rico [final diagnosis ~2->5 days latency]
National Labs [LabCorp and Quest]
• 47 states, the District of Columbia, and Puerto Rico
[24-hour latency]
Hospital Labs
• 49 hospital labs in 17 states/jurisdictions [24-hours
latency]
Pharmacies
• 50,000 (27,000 Active) in 50 states [24-hour latency]](https://image.slidesharecdn.com/kass-houtphps-110222014408-phpapp02/85/Updates-on-the-BioSense-Program-Redesign-2011-Public-Health-Preparedness-Summit-6-320.jpg)

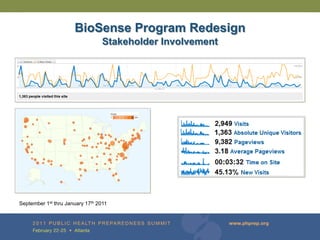
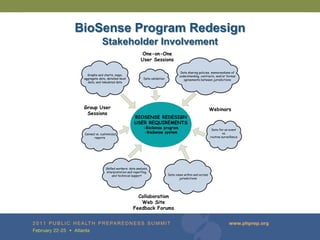
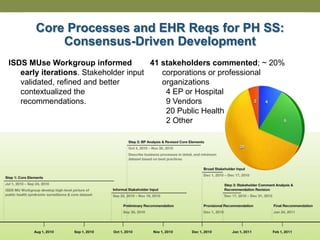

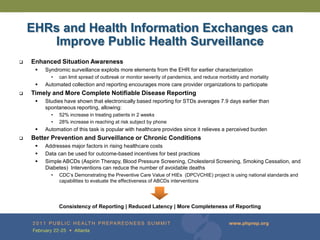
The document provides updates on the redesign of the Biosense program aimed at enhancing public health surveillance by improving data sharing, collaboration, and timely reporting across various healthcare entities. The redesign emphasizes the use of electronic health records and other data sources to facilitate quicker detection and response to health-related events, thereby improving overall health outcomes. Key recommendations include streamlining data processes and fostering partnerships among public health organizations to support a more robust health monitoring infrastructure.


![PERI-PROSTHETIC FRACTURE NAIL-PLATE CONSTRUCT [NPC].pptx](https://cdn.slidesharecdn.com/ss_thumbnails/drarunkumardrmohamedashrafperiprostheticfrasturenail-plateconstructnpc-260209164459-7e9d15a1-thumbnail.jpg?width=640&height=640&fit=bounds)


![CTEV [ clubfoot] DR ARUN LAL ,DR MOHAMED ASHRAF travancore medical college k...](https://cdn.slidesharecdn.com/ss_thumbnails/ctevclubfootdrarunlaldrmohamedashraftravancoremedicalcollegekollamkeralaindia-260208063247-18fc466c-thumbnail.jpg?width=640&height=640&fit=bounds)


