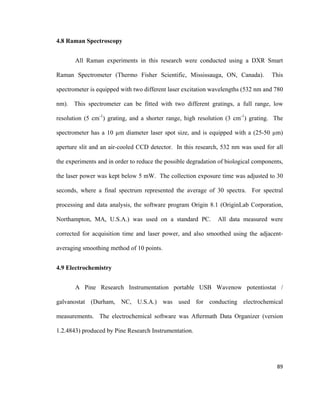
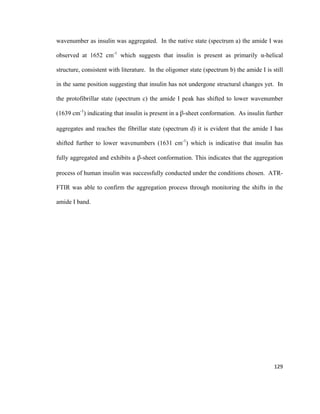
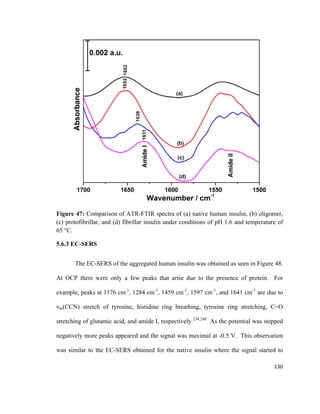
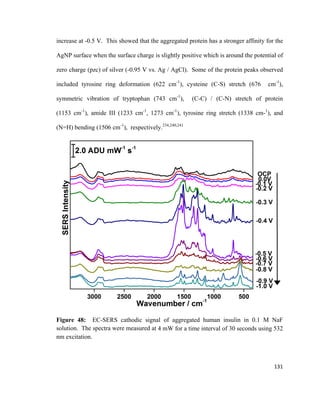
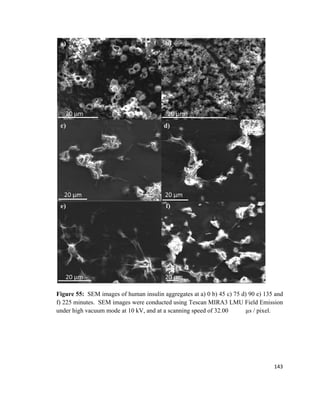
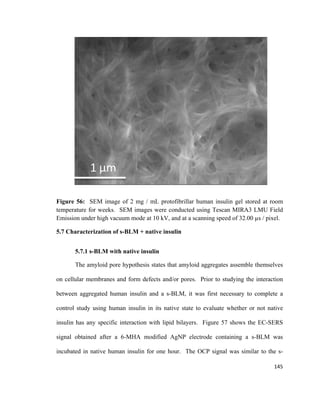
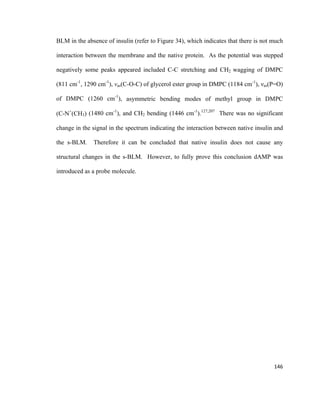
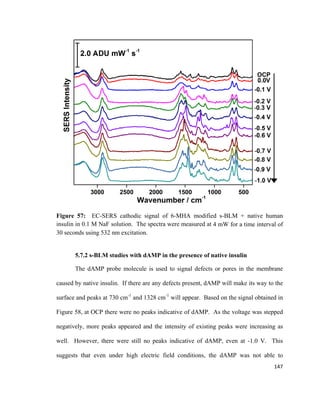
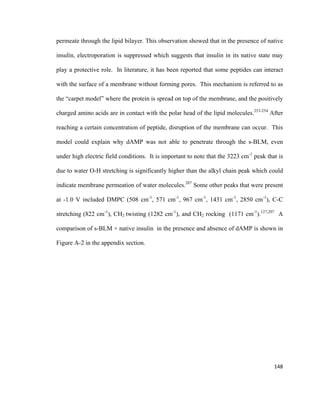
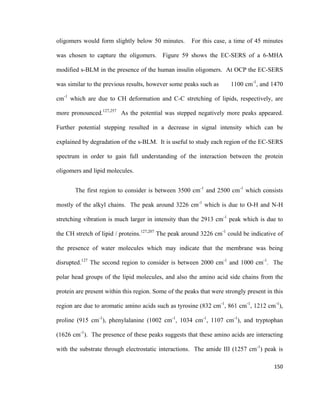
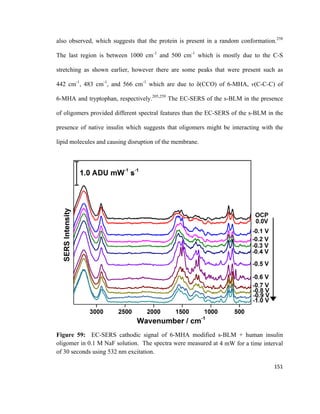
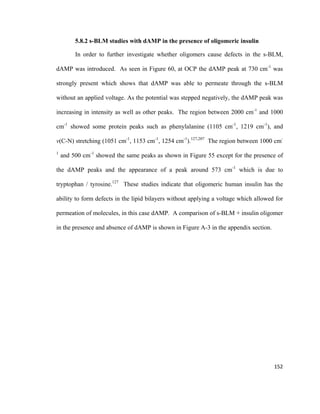
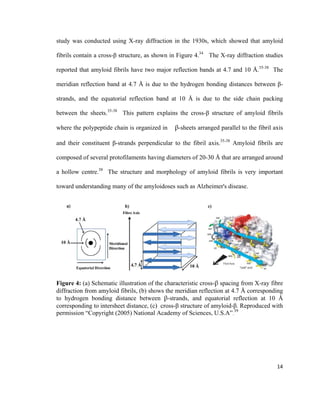
This thesis investigates the interaction between protein aggregates associated with diseases like Alzheimer's and model biomimetic membranes using spectroscopy. Chapter 1 introduces protein aggregation disorders and the objective to study how insulin aggregates interact with lipid bilayers. Chapter 2 provides background on protein structure/misfolding, disease-linked aggregates, cell membranes, biomimetic models, and characterization techniques. The document describes the author's Masters research conducting spectroscopic analysis of insulin aggregate interactions with lipid bilayers to further understand the mechanism of aggregate-induced membrane damage relevant to disease.
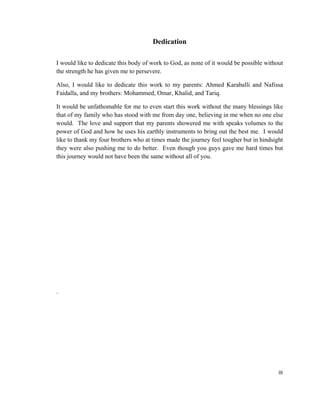

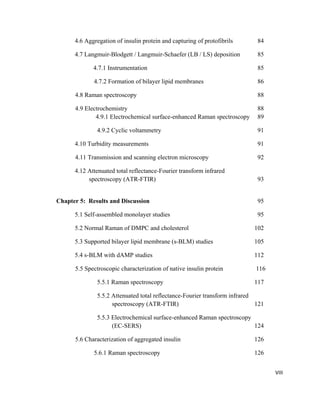
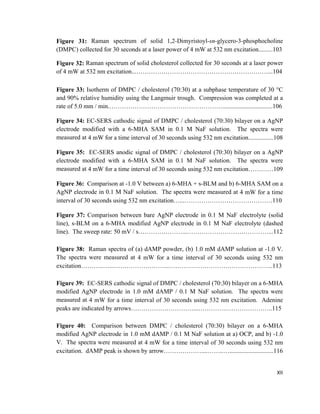


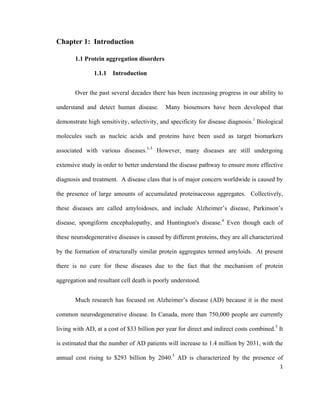
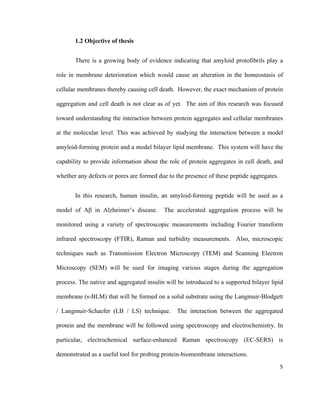
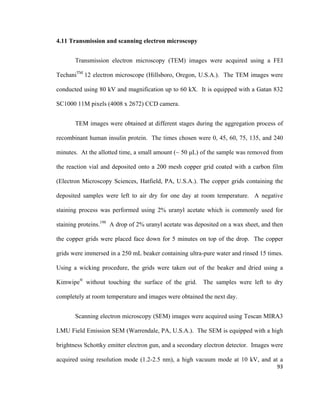
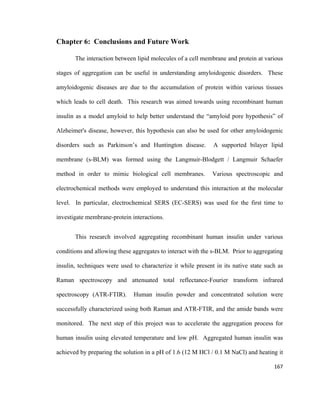
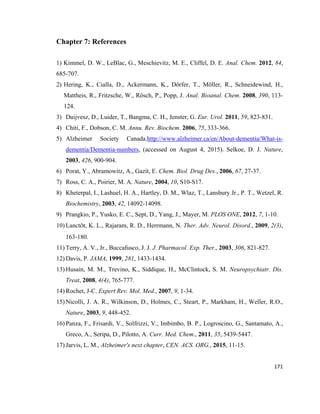
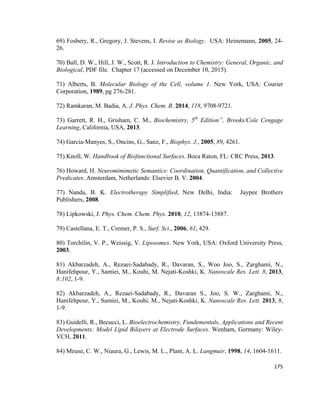
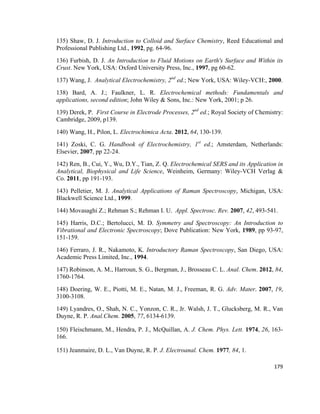
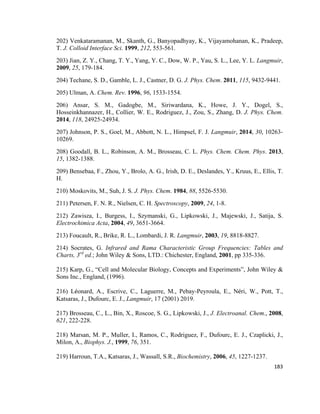
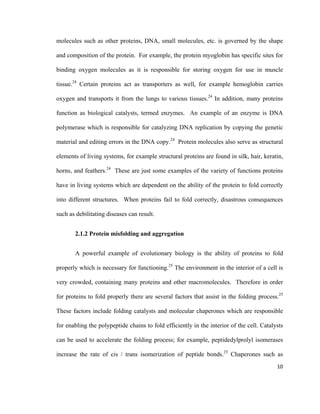
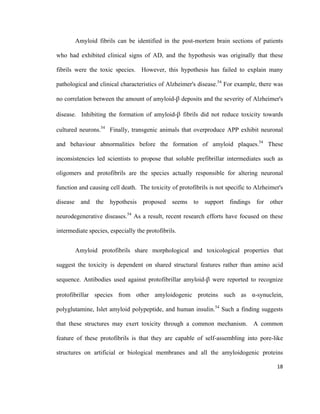
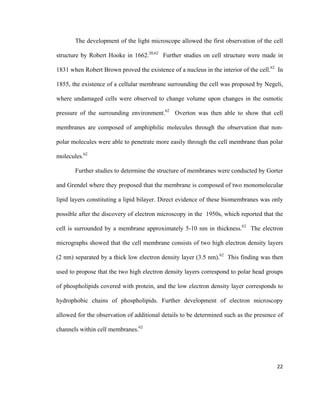
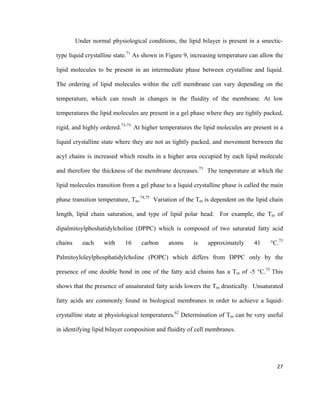
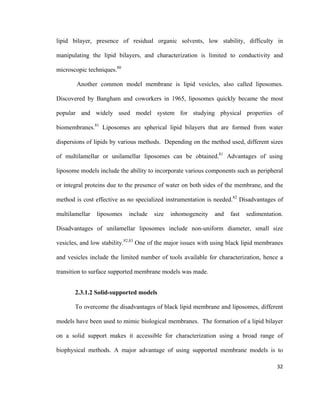
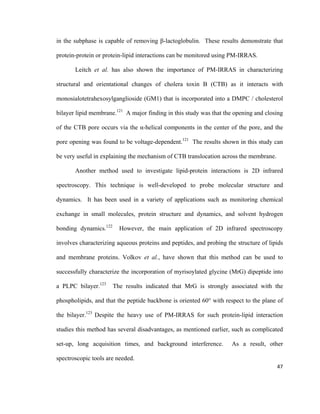
![Figure 2: Representation of all twenty essential amino acids. Adapted from reference
[20].
The linear sequence of amino acids is considered the primary structure of the
protein, and it is the driving force for intramolecular bonding which stabilizes the protein
structure.20
Hydrogen bonding between amino groups and carboxyl groups can cause
folding to occur which determines the protein's three dimensional shape, known as the
protein secondary structure.20
The two most stable secondary structure elements in
proteins are α-helices and β-sheets. These helices and sheets assemble and fold to give
the tertiary structure of proteins.20,21
Protein tertiary structure is the result of hydrogen
bonding and three other possible types of interactions: disulphide bridges, ionic bonds,
and hydrophobic interactions.22
Disulphide bridges are strong covalent bonds that occur
8](https://image.slidesharecdn.com/af097d3b-6f99-45be-be2e-699d382f6b92-161027162519/85/Karaballi_Reem_MASTERS_2015-30-320.jpg)
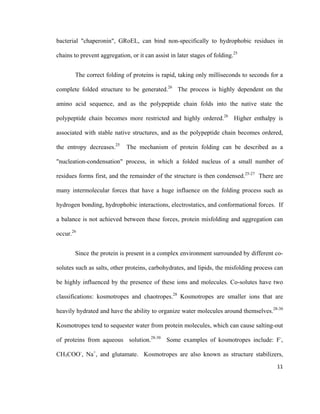
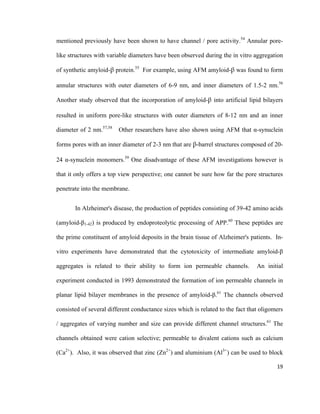
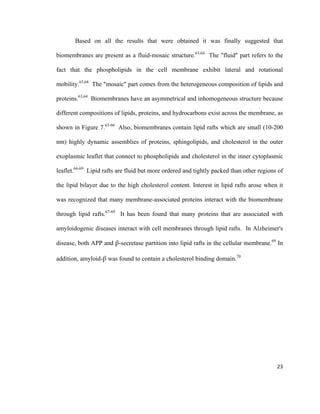
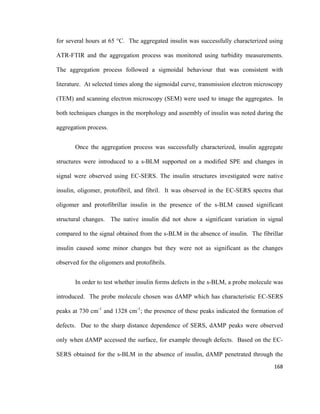
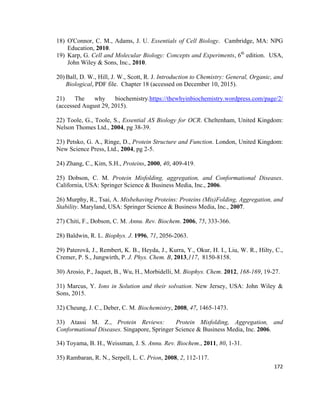
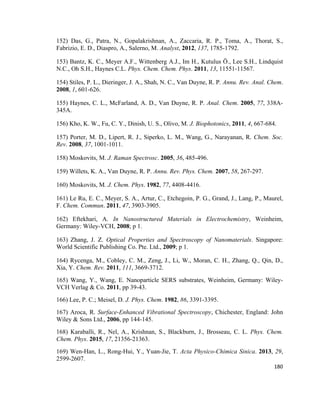
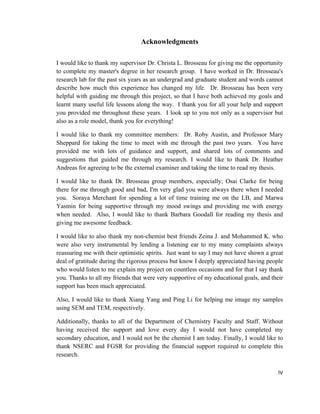
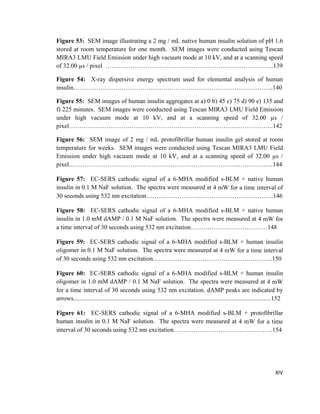
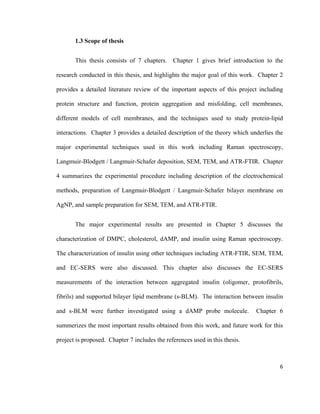
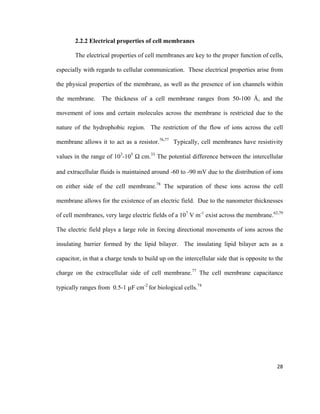
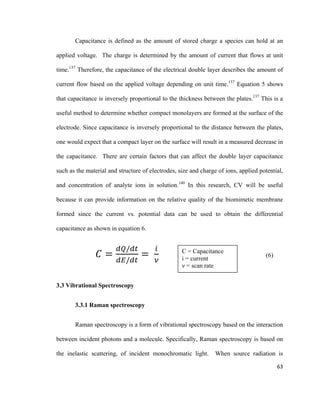
![Figure 8: The structure of a typical glycerophospholipid; phosphatidylcholine: a)
chemical structure b) schematic representation. Adapted from reference [62].
Figure 9: Schematic illustration of phase transition behaviour and molecular order of
liquid crystals. Adapted from reference [71].
26](https://image.slidesharecdn.com/af097d3b-6f99-45be-be2e-699d382f6b92-161027162519/85/Karaballi_Reem_MASTERS_2015-48-320.jpg)
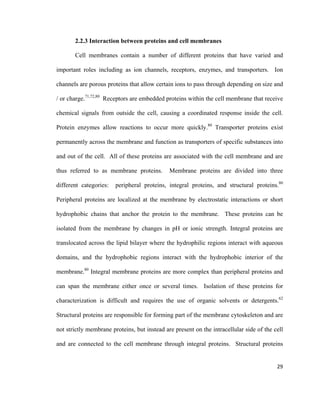
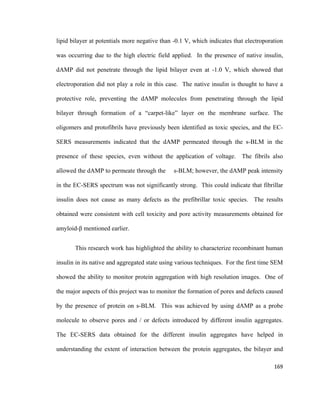
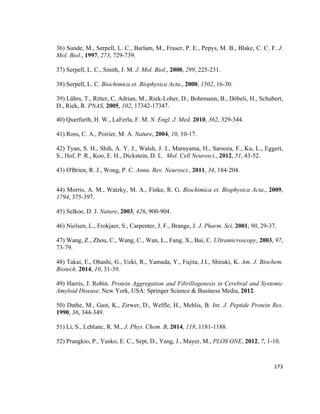
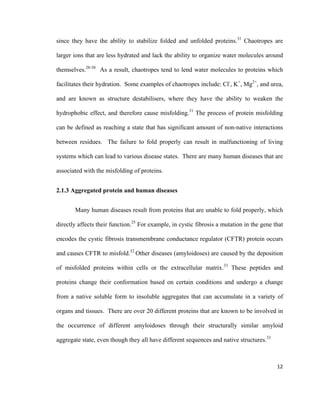
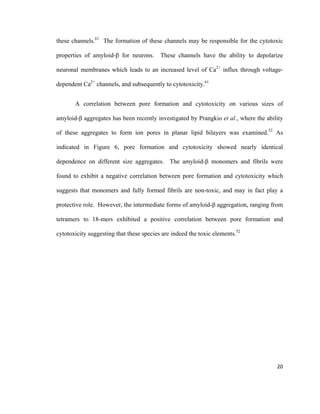
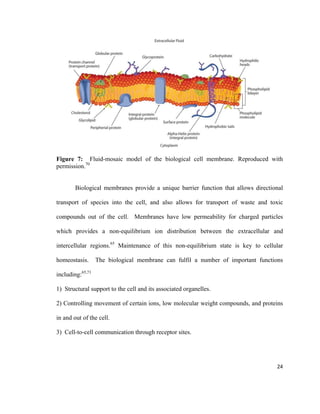
![Table 1: Comparison of physical and electrical properties between biological cell
membranes and bilayer lipid membrane models. Adapted from reference [62].
Membrane Properties Biological Cell
Membranes
Bilayer Lipid
Membrane Model
Thickness (Å) 60-130 60-90
Resistivity (Ω·cm) 102
-105
106
-108
Capacitance (μF/cm2
) 0.5-1.3 0.3-1.3
Resting Potential (mV) 10-90 0-140
Water permeability (10-4
cm/sec) 0.25-58 2.3-24
Surface tension, mN m-1
0.03-3.0 0.2-6.0
Conductivity, Ω-1
cm-2
10-2
-10-5
10-6
-10-10
Breakdown voltage, mV 100 150-300
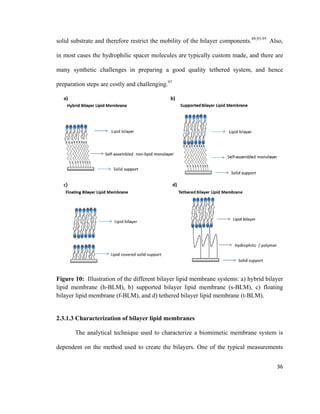
Over the past few decades many models were proposed in order to mimic
biological cell membranes. Initial model membranes were prepared using two different
methods: 1) black lipid membrane fabrication, and 2) liposome formation. Both of these
methods are described below.
In 1962 the first stable bilayer lipid membranes were prepared by Mueller and
coworkers. The bilayer was formed from a crude fraction of phospholipids in a Teflon
cup with circular holes of a small diameter (0.8-2.5 mm) immersed in aqueous solution.80
The addition of phospholipids to the hole resulted in the immediate formation of a thick
film (>100 nm). Due to changes in hydrodynamic pressure, the solvent tends to escape
from the central part of the film to the borders. This would result in thinning of the
membrane, and as this process caused black spots to appear, these membranes were
initially called "black lipid membranes".62,80
The advantage of using the black lipid
membrane model system is that both lipid layers are in contact with aqueous solution
which can be useful for incorporating transmembrane protein. Disadvantages of this
technique include difficulty in incorporating large molecules (i.e. proteins) within the
31](https://image.slidesharecdn.com/af097d3b-6f99-45be-be2e-699d382f6b92-161027162519/85/Karaballi_Reem_MASTERS_2015-53-320.jpg)
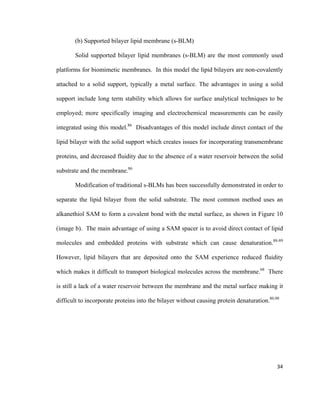
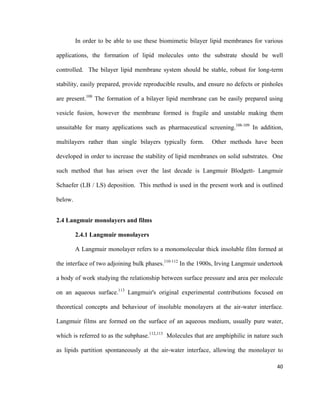
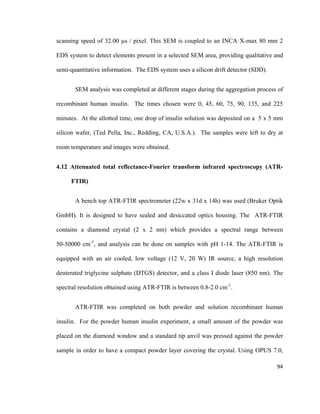
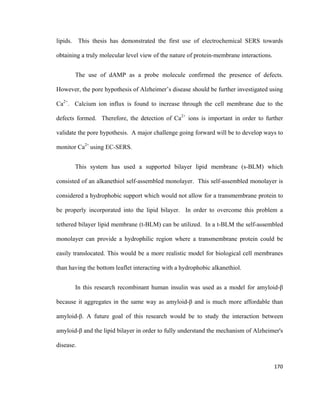
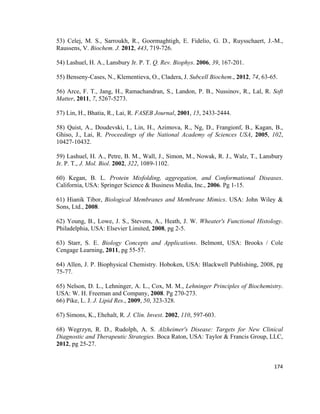
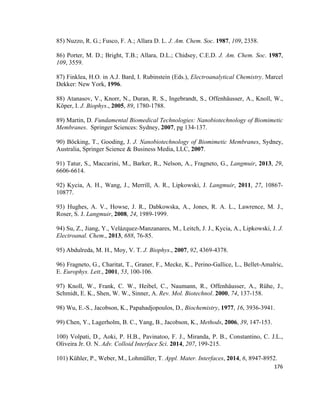
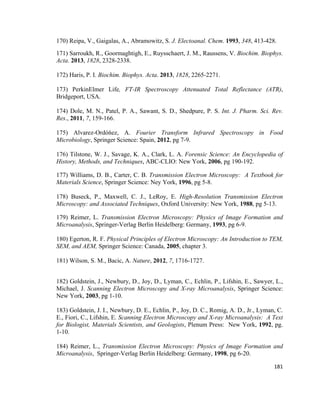
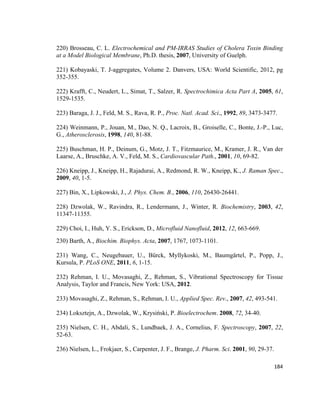
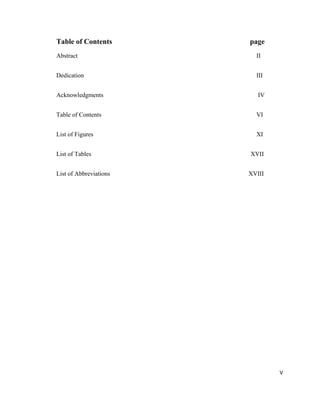
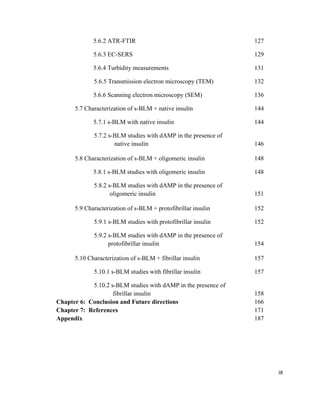
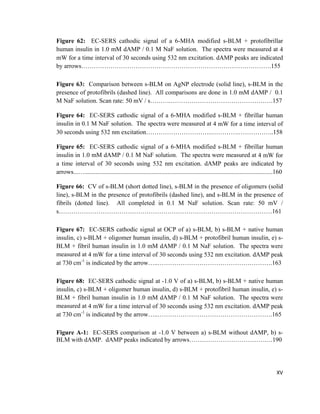
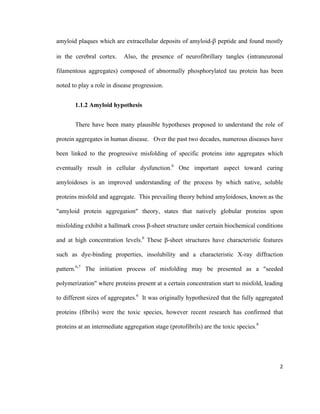
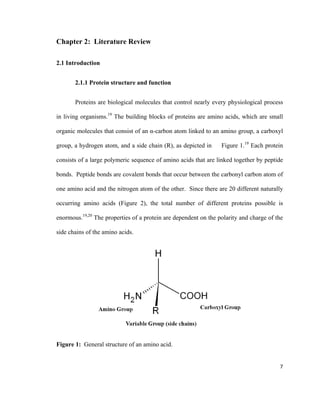
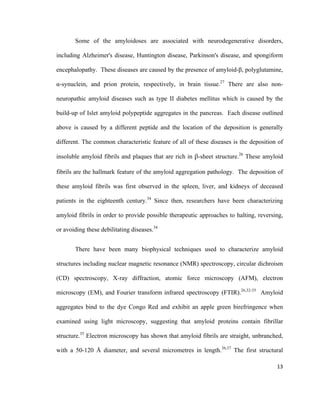
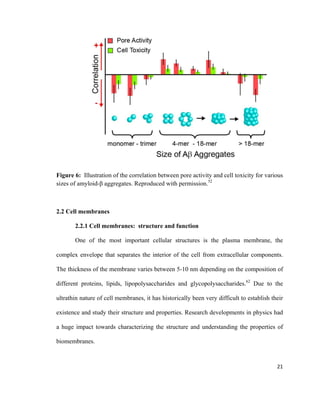
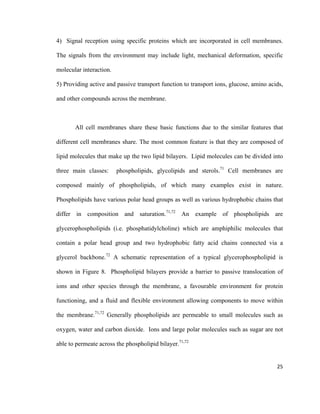
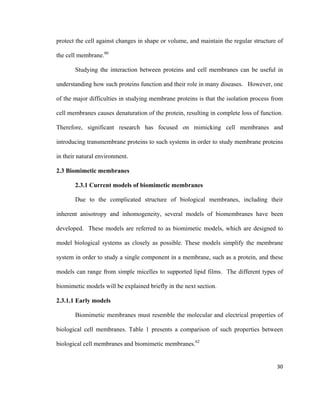
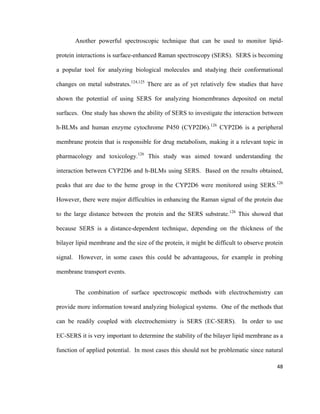
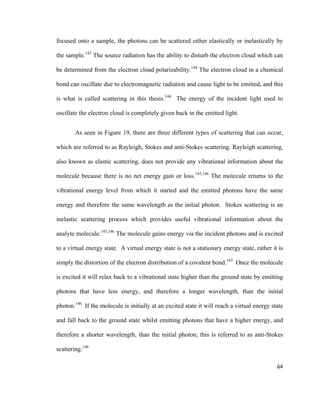
![Figure 11: Langmuir-Blodgett transfer of a monolayer onto a) hydrophilic substrate, b)
hydrophobic substrate. Adapted from reference [114].
There are different methods to transfer a monolayer onto a solid substrate. One
method involves immersing a hydrophillic substrate in the subphase prior to monolayer
formation. Once the monolayer is formed, the substrate is slowly drawn vertically
through the compressed monolayer at the air-water interface. This allows the hydrophilic
heads of the lipid molecules to adsorb onto the hydrophilic substrate, with the
hydrophobic tails oriented perpendicular to the surface of the substrate. This process can
be repeated multiple times to achieve bilayers or multilayers. There are different styles
used in order to form multilayers which include a) Y-type, b) Z-type, and c) X-type, as
shown in Figure 12.114
Y-type deposition involves the formation of a multilayer film by
passing the solid substrate through the air-water interface in alternating up and down
strokes. The Z-type deposition involves passing the solid substrate in an upward stroke
only, hence hydrophilic substrates need to be used.114
The X-type deposition involves
42](https://image.slidesharecdn.com/af097d3b-6f99-45be-be2e-699d382f6b92-161027162519/85/Karaballi_Reem_MASTERS_2015-64-320.jpg)
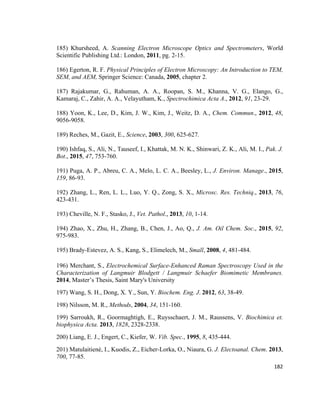
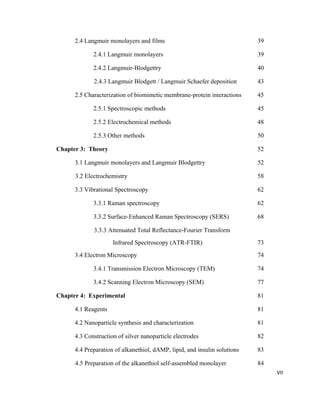
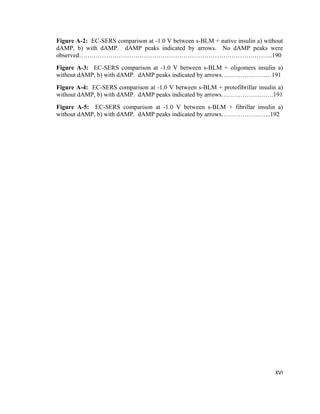
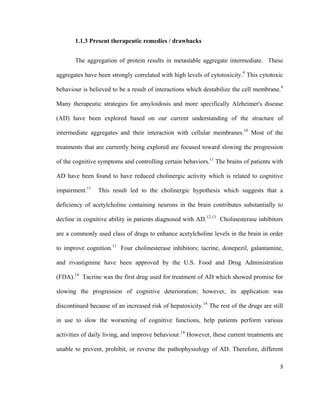
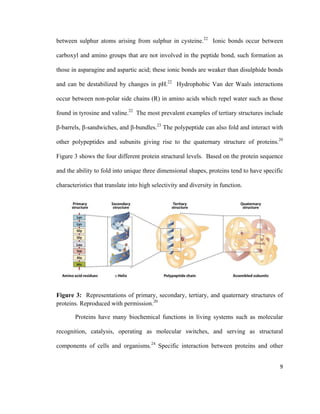
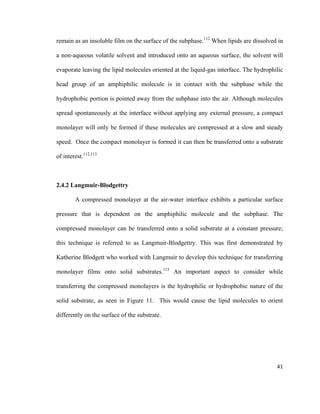
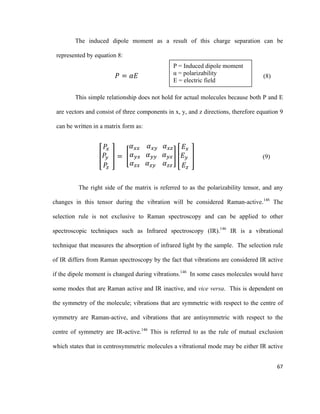
![passing the solid substrate in a downward stroke only, hence hydrophobic substrates need
to be used.114
Figure 12: a) Y-type, b) Z-type, and c) X-type Langmuir-Blodgett film deposition
schemes. Adapted from reference [114].
The Langmuir-Blodgett technique is a very sensitive method and considerable
care should be taken while transferring these monolayers onto solid substrates. There are
a number of factors that should be considered prior to performing any experiments in
order to ensure successful monolayer transfer and afford reproducible results. Some of
these factors include the nature and dimensions of the solid substrate, the nature of the
amphiphilic molecule, the nature of the subphase such as composition, pH, ionic strength,
temperature, surface pressure during deposition, the rate of speed of the substrate passing
through the interface, and number of layers deposited.114
The transfer of a poor quality
monolayer will have an effect on the compactness and stability of the monolayer.
43](https://image.slidesharecdn.com/af097d3b-6f99-45be-be2e-699d382f6b92-161027162519/85/Karaballi_Reem_MASTERS_2015-65-320.jpg)
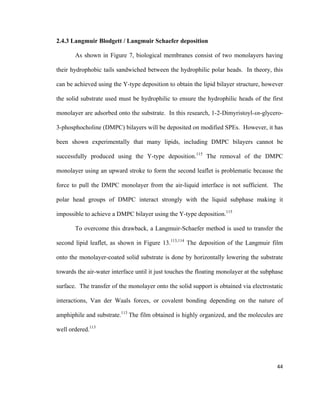
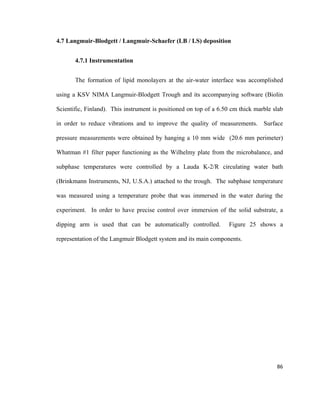
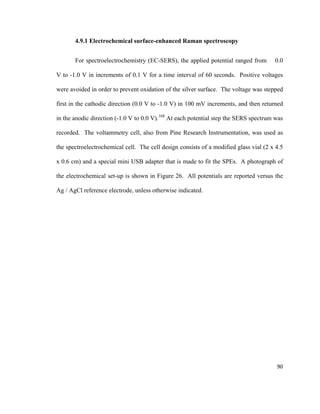
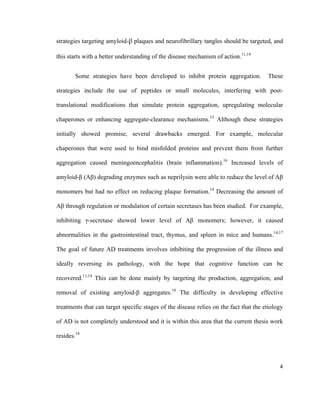
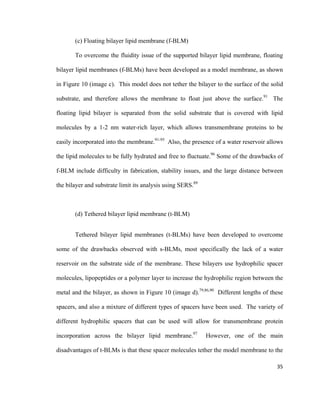
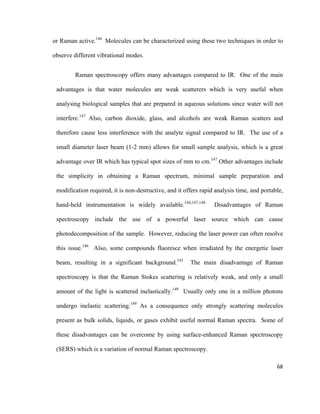
![Figure 13: Langmuir-Schaefer transfer (horizontal touch technique) on a solid substrate.
Adapted from reference [113].
The formation of a bilayer lipid membrane using the Langmuir-Blodgett /
Langmuir Schaefer (LB / LS) method has been used in literature for a decade and offers
several advantages over the more common vesicle fusion method.116,117
For example,
monolayers can be transferred onto the substrate at a precisely known surface pressure,
molecular area, and physical state of the film.79
Also, LB / LS allows for a different lipid
composition in the bottom and the top leaflet of the bilayer lipid membrane.79
A PM-
IRRAS experiment conducted by Garcia-Araez et al. showed that the LB / LS method
allows for the formation of a stable and well-ordered bilayer lipid membrane that can be
used for mimicking biological membranes.118
A layer-by-layer characterisation of a
DMPC bilayer where one of the DMPC leaflets is all-hydrogenated (h-DMPC) and the
45](https://image.slidesharecdn.com/af097d3b-6f99-45be-be2e-699d382f6b92-161027162519/85/Karaballi_Reem_MASTERS_2015-67-320.jpg)
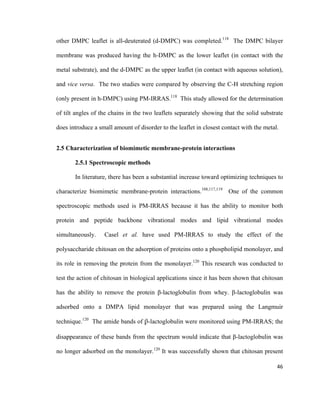
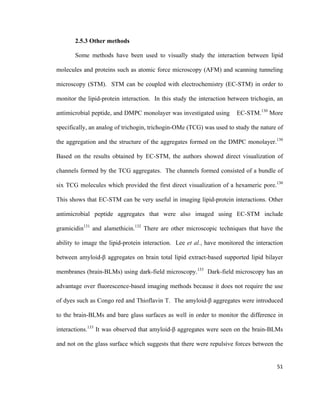
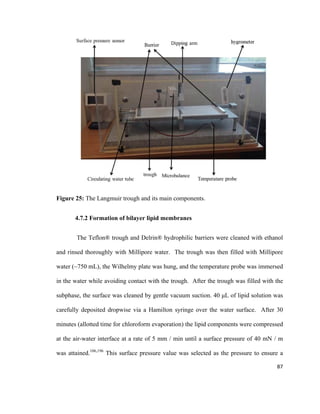
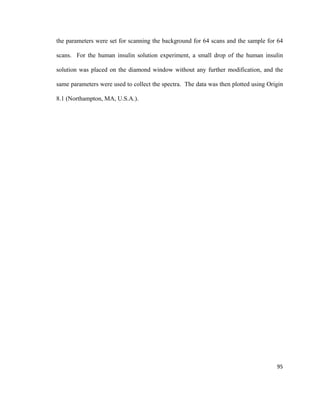
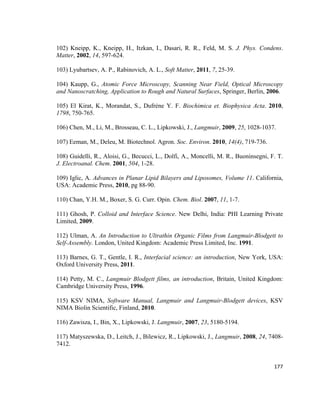
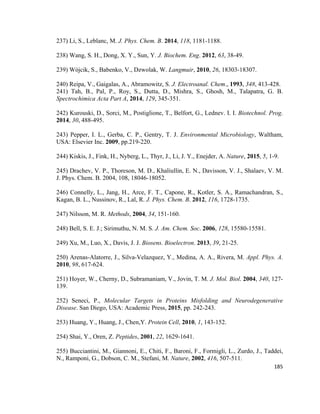
![Figure 14: Cohesive ( ) and adhesive ( ) forces acting on molecules at the gas-
liquid interface and molecules in the bulk liquid. Adapted from reference [135].
The force acting on molecules at the gas-liquid interface is the surface tension (γ)
which is one of the basic physical values that characterizes liquid phases, including lipid
monolayers.113
The surface tension is a result of short-range intermolecular forces
including Van der Waals forces and hydrogen bonding.135
A convenient way to explain
surface tension is by comparing it to surface pressure, Π. This can be explained by the
compression of a lipid monolayer using a barrier at the air-water interface on the LB
trough.62
Surface pressure increases as molecules are compressed with a movable barrier.
Figure 15 shows the compression of a lipid monolayer.
54](https://image.slidesharecdn.com/af097d3b-6f99-45be-be2e-699d382f6b92-161027162519/85/Karaballi_Reem_MASTERS_2015-76-320.jpg)
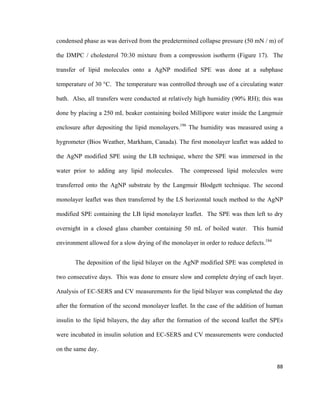
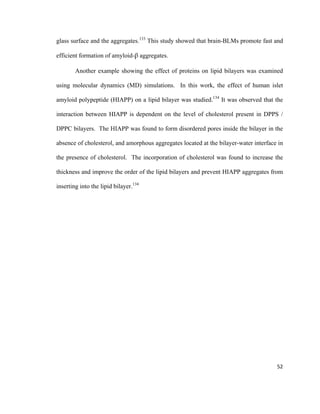
![Figure 15: Compression of a lipid monolayer at the air-water interface using a movable
barrier. Adapted from reference [62].
The work done by moving the barrier can be expressed as the product of the distance
travelled by the barrier (Δx), its length (l), and the surface pressure (Π), as shown in
equation 1:
w = Δx ∗ l ∗ Π (1)
As the molecules are compressed at the interface, a change in the surface energy results.
In monolayer experiments, it is very common to refer to a measurement of surface
pressure instead of surface tension.113,114
The difference between the surface tension of
water (γ0) and the surface tension of the monolayer (γ) is equal to the surface pressure, as
shown in equation 2:
Π= γ0 − γ (2)
The surface tension can also be expressed as the force per length acting on the
surface. The SI unit of surface tension is mN m-1
; for example, the surface tension of
water at 20°C is 72.75 mN m-1
.113,114
There are different methods used to obtain the
γ0 = Surface tension of water
γ = Surface tension of
monolayer
Π = Surface pressure
l = Length of barrier
Δx = Distance travelled
55](https://image.slidesharecdn.com/af097d3b-6f99-45be-be2e-699d382f6b92-161027162519/85/Karaballi_Reem_MASTERS_2015-77-320.jpg)
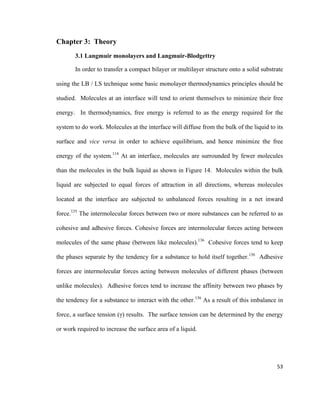
![surface tension as the monolayer is compressed, and the most commonly used method is
known as the Wilhelmy plate method. 113,114
This method involves dipping a flat plate
through the surface of a liquid and measuring the force acting on it.114
The plate can be
made of glass, mica, platinum or filter paper and is connected to an electromicrobalance.
An illustration of a Wilhelmy plate is shown in Figure 16.
Figure 16: The Wihelmy plate method to measure the surface tension. Adapted from
reference [114].
There are two forces that act on the plate which include 1) weight force Fp acting
downward, and 2) Archimedes’ buoyancy force, Fa acting upward.110
The resulting net
force acting on the Wilhelmy plate is shown in equation 3:
F= F𝑃𝑃 + 2γw − F𝑎𝑎 (3)
γ = Surface tension of monolayer
w = width of the plate
56](https://image.slidesharecdn.com/af097d3b-6f99-45be-be2e-699d382f6b92-161027162519/85/Karaballi_Reem_MASTERS_2015-78-320.jpg)
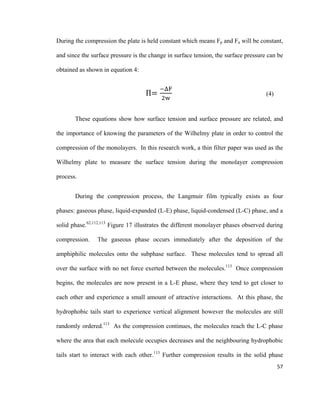
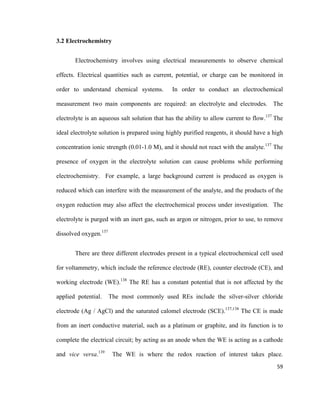
![hydrogen atoms will interact with the electrode surface, and cations will have a higher
affinity as well.
Figure 18: Illustration of the electrical double layer according to Bockris / Devanthan /
Mueller model. Adapted from reference [141].
Due to the alternating charged layers, the electrical double layer resembles a
parallel-plate capacitor.137
The capacitance of a parallel-plate capacitor is described in
equation 5:
𝐶𝐶 =
𝑘𝑘𝑘𝑘0 𝐴𝐴
𝑑𝑑
(5)
C = Capacitance
k = Relative permittivity of the material
separating the plates
ε0 = Permittivity of free space
A = Area of plates
d = Distance between plates
62](https://image.slidesharecdn.com/af097d3b-6f99-45be-be2e-699d382f6b92-161027162519/85/Karaballi_Reem_MASTERS_2015-84-320.jpg)
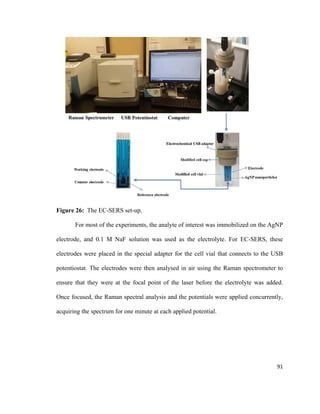
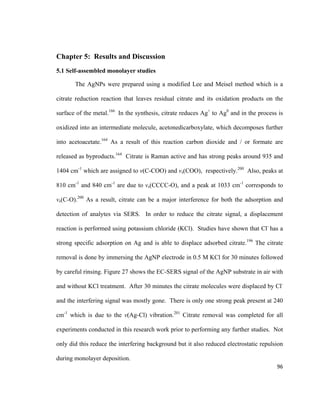
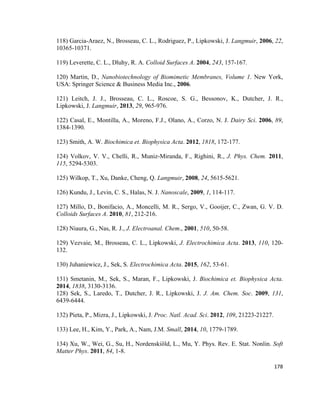
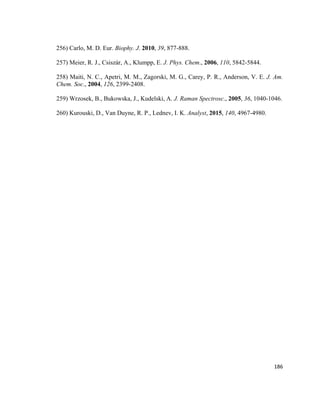
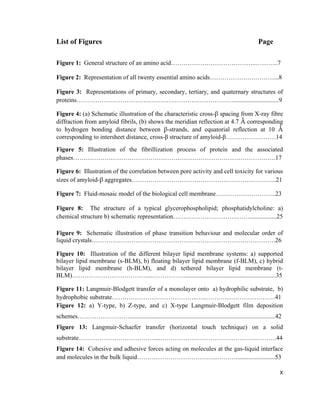
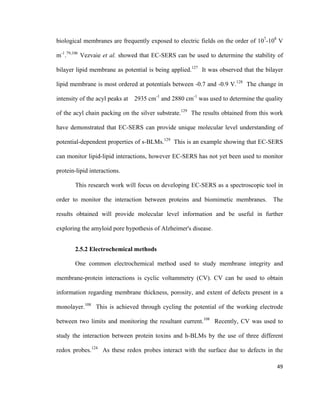
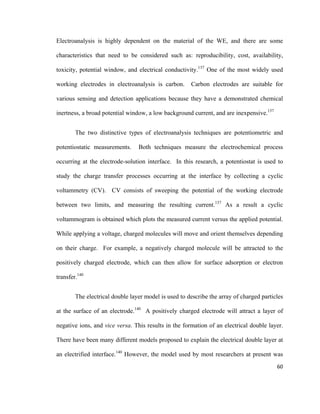
![Figure 19: Diagram showing the energy-level diagram for: Infrared absorption,
Rayleigh, Stokes, and anti-Stokes scattering. Adapted from reference [143].
Under typical experimental conditions molecules are mostly present in the ground
state, and therefore Stokes Raman scattering is more probable and it is commonly what is
measured in Raman spectroscopy. Since the intensity of the Raman scattering is not
equivalent in all directions, a certain angle should be present between the incident source
and the detector. Efficient Raman scattering can be obtained at 90° (right angle
scattering) or 180° (back-scattering).143
Each molecule will scatter light differently which
provides a unique Raman signal for each sample component. The data obtained can be
displayed as a plot of Raman scattering intensity versus wavelength. The x-axis in a
Raman spectrum represents the difference between the excitation wavelength and the
Raman wavelength expressed in wavenumbers (ῡ).143
Wavenumbers are the reciprocal of
65](https://image.slidesharecdn.com/af097d3b-6f99-45be-be2e-699d382f6b92-161027162519/85/Karaballi_Reem_MASTERS_2015-87-320.jpg)
![wavelength (ῡ = 1/λ) having units of cm-1
, which can also be expressed as a unit of
energy, E as shown in equation 7:
𝐸𝐸 = ℎ𝜈𝜈 =
ℎ𝑐𝑐
𝜆𝜆
= ℎ𝑐𝑐ῡ (7)
The peaks observed in a Raman spectrum are a result of the photon interacting
with the electron cloud and causing changes in the polarizability of the molecule, thus
producing an induced dipole moment.146
This is referred to as the Raman selection rule
which determines whether certain vibrations are Raman active or inactive.146
As shown in
Figure 20, when an incident electric field (i.e. laser beam) is in contact with a molecule
there is a distortion such that the nuclei and electrons are attracted to opposite poles.
Figure 20: Polarization of a diatomic molecule in an electric field. Adapted from
reference [146].
E = energy
ℎ = Planck’s constant
𝜈𝜈 = Frequency of light
c = Speed of light
λ = Wavelength of light
ῡ = Wavenumber of light
66](https://image.slidesharecdn.com/af097d3b-6f99-45be-be2e-699d382f6b92-161027162519/85/Karaballi_Reem_MASTERS_2015-88-320.jpg)
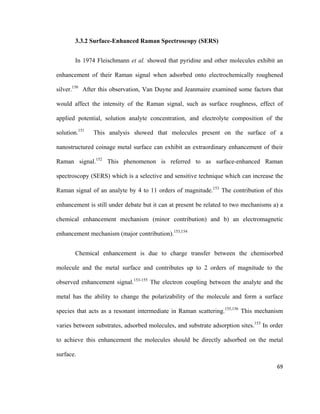
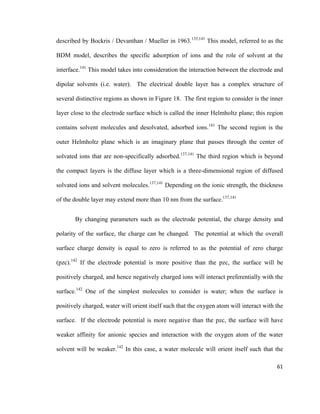
![Electromagnetic enhancement is a wavelength-dependent effect that contributes
up to 4-10 orders of magnitude in terms of signal enhancement.154,157
This primarily arises
from the collective oscillation of conduction electrons when an electric field (i.e. incident
electromagnetic radiation of a laser) interacts with nano-structured metallic surfaces. The
collective oscillation of free electrons in the metal is termed the localized surface plasmon
resonance (LSPR).154,158,159
The LSPR is dependent on the size, shape, nanometric
roughness, and the material of the nanostructured surface.155
As shown in Figure 21,
LSPR occurs in nano-structures that are smaller in all dimensions than the wavelength of
incident light which will cause the free electrons in the metal to collectively oscillate in
resonance with the electric field whereas the positively charged metallic nuclei remain
fixed.155,159
Figure 21: Schematic illustration of localized surface plasmon resonance on metal
nanospheres. Adapted from reference [154].
70](https://image.slidesharecdn.com/af097d3b-6f99-45be-be2e-699d382f6b92-161027162519/85/Karaballi_Reem_MASTERS_2015-92-320.jpg)
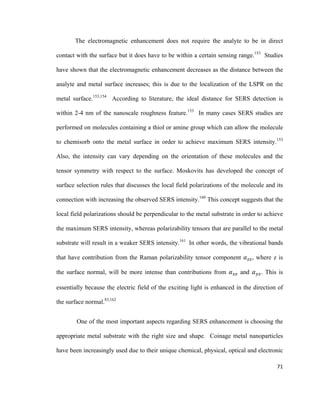
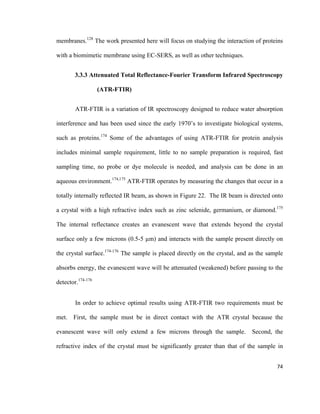
![order for internal reflectance to occur.174-176
ATR-FTIR has been widely used to analyze a
wide variety of materials such as fiber, glass, paint, and also biological components such
as lipid, proteins, cells, and tissues.174-176
Figure 22: Schematic diagram of a typical attenuated total reflectance (ATR) system.
Adapted from reference [176].
3.4 Electron Microscopy
3.4.1 Transmission Electron Microscopy (TEM)
Electron microscopes were developed to overcome the limited image resolution of
light microscopes, which is imposed by the wavelength of visible light.177
In 1925, the
first theory stating that electrons had wave-like characteristics with a wavelength
substantially less than visible light was developed by Louis de Broglie.177
This allowed
the development of the first electron microscope in 1932 by Knoll and Ruska.177
Later on,
transmission electron microscopy (TEM) were commercially developed and became
widely available. Since the initial discovery of TEM, significant developments have led
to major improvements such as using digital technology for high sensitivity images, use
75](https://image.slidesharecdn.com/af097d3b-6f99-45be-be2e-699d382f6b92-161027162519/85/Karaballi_Reem_MASTERS_2015-97-320.jpg)
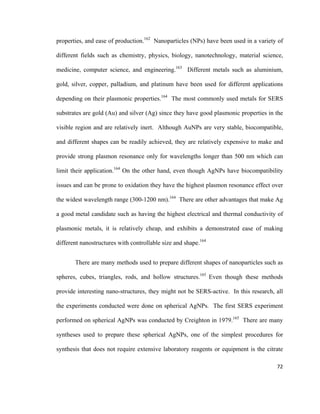
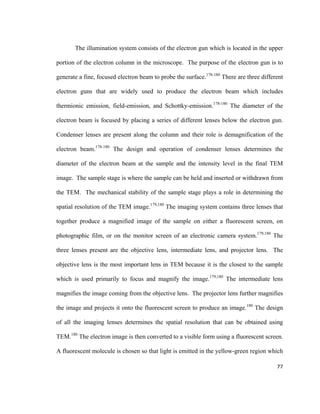
![of vibration isolation, high voltage stability, and electronic and mechanical stability.177
The basic imaging arrangement of TEM involves the use of an electron gun to produce an
electron beam that interacts with the sample. The electron beam is focused using a series
of lenses prior to reaching the sample.177
Upon this interaction the beam is transmitted
and then brought to a focus by an objective lens. A TEM image is then produced by
magnifying lenses. TEM requires high vacuum in order for the electrons to interact with
sample to obtain good quality images. Figure 23 shows a schematic illustration of the
TEM components.
Figure 23: Schematic diagram of transmission electron microscopy (TEM) system.
Adapted from reference [179].
76](https://image.slidesharecdn.com/af097d3b-6f99-45be-be2e-699d382f6b92-161027162519/85/Karaballi_Reem_MASTERS_2015-98-320.jpg)
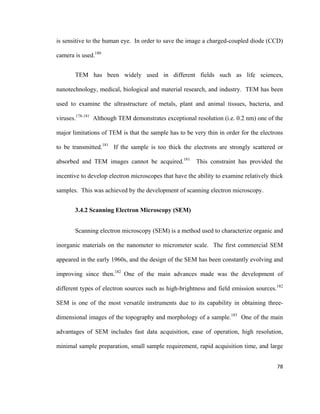
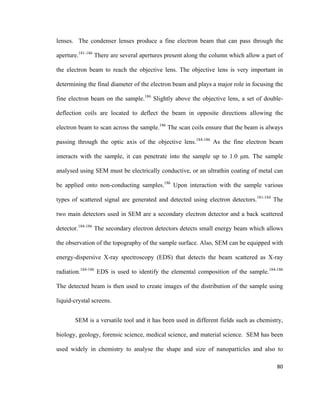
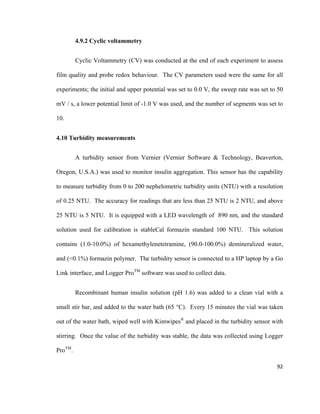
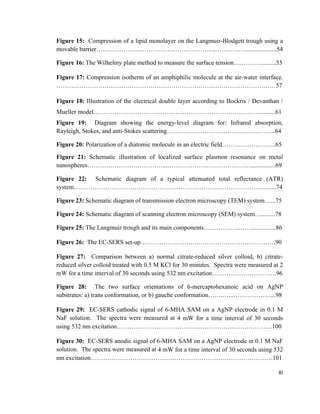
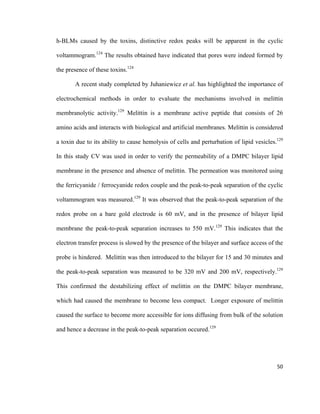
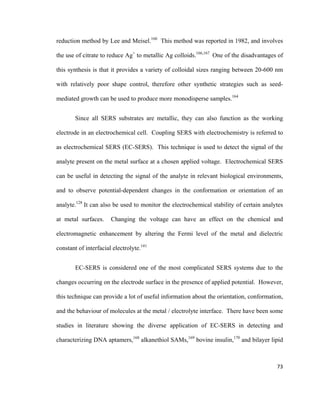
![depth of field.183
Figure 24 shows a schematic drawing of a typical SEM. The basic
theory of SEM involves scanning a high energy focused beam of electrons over the
sample in order to produce an image.182-184
Figure 24: Schematic diagram of scanning electron microscopy (SEM) system. Adapted
from reference [184].
The SEM column consists of the following main components: an electron gun,
two condenser lenses, an objective lens, beam scanning coils, large sample chamber with
a stage, and electron detection system, all operating in vacuum.184
The chamber is kept at
a high vacuum of about 10-3
to 10-4
Pa.184
Most of the SEM components are very similar
to the TEM components. SEM does not include a sample stage after the condenser
79](https://image.slidesharecdn.com/af097d3b-6f99-45be-be2e-699d382f6b92-161027162519/85/Karaballi_Reem_MASTERS_2015-101-320.jpg)