4
실습파일 다운로드
https://www.dropbox.com/s/znp9247yjl11d7w/jadeedu_jvm_20211103.zip?dl=0
jadeedu_jvm.zip 파일을 C: 하위에 압축 해제
실습 환경설정 (1/8) - 실습파일 다운로드 및 압축 해제
실습 환경설정
jadeedu_jvm_20211103.zip
5.
5
실습 환경설정 (2/8)- VirtualBox 설치
VirtualBox 6 설치
C:jadeedu_jvmswVirtualBox-6.1.16-140961-Win.exe 더블클릭
VirtualBox 환경 설정
파일 환경설정
실습 환경설정
입력 확장
가상 머신
┗▶ 호스트 키 조합
확장 패키지 추가
Ctrl + Alt
C:jadeedu_jvmswOracle_VM_
VirtualBox_Extension_Pack-
6.1.16.vbox-extpack 선택
6.
6
실습 환경설정 (3/8)- VirtualBox 환경설정
네트워크 설정
“Tools 네트워크” 선택
IP 대역 설정
192.168.56.0/24 대역으로 네트워크 설정
실습 환경설정
192.168.56.1/24 192.168.56.1/24
192.168.56.1
192.168.56.100
192.168.56.101
192.168.56.254
7.
7
“NAT 네트워크”추가
파일 환경 설정 네트워크“
NAT 네트워크 정보
네트워크 이름 : EduNatNetwork
네트워크 CIDR : 192.168.55.0/24
실습 환경설정 (4/8) - VirtualBox 환경설정
실습 환경설정
8.
8
실습 환경설정 (5/8)- 실습 VM 가져오기 및 실행
버튼 클릭하여 VM 가져오기
jvmedu 가상머신 실행
실습 환경설정
계정 : root
암호 : edu
“C:jadeedu_jvmvmjvmedujvmedu.vbox”
파일 선택
jvmedu.vbox
jvmedu.vbox
9.
9
실습 환경설정 (6/8)- 원격 접속
MobaXterm 실행
jvmedu VM 원격 접속
192.168.56.96
실습 환경설정
10.
10
실습 환경설정 (7/8)
실습 환경 최소 조건
Windows 10, 8G RAM, VirtualBox(하이퍼바이저) 실행 가능해야 함
SSD 디스크 사용할수록 실습이 용이함
최소 VM 자원 설정
vCPU : 4 Core
Memory : 4 GB
실습 환경설정
VirtualBox(Win 10)
jvmedu
(192.168.56.96)
internet
7080
9080
11.
11
실습 환경설정 (8/8)
JAVA_HOME 환경변수 설정
실습 환경설정
C:jadeedu_jvmswjava_tooljdk1.8.0_281
PATH 환경 변수 설정
java.exe가 실행되도록 PATH 환경변수에 %JAVA_HOME%bin 설정
16
메모리 계층 구조
하드웨어및 운영체제 리뷰
https://ko.wikipedia.org/wiki/%EC%A7%90_%EA%B7%B8%EB%A0%88%EC%9D%B4
속도
가격
17.
17
프로그램 = 실행파일 + 라이브러리
C 실행파일의 빌드 절차
하드웨어 및 운영체제 리뷰
hello.c
(소스 파일)
hello.i
(전처리된 소스파일)
hello.o
(목적 파일)
a.out
(실행 파일)
hello.s
(어셈블리 파일)
C 전처리
C 전처리기
cpp
C 컴파일
C 컴파일러
cc1
어셈블
어셈블러
as
링킹
링커
ld,collect2
사용자 작성
라이브러리
시스템 내장
라이브러리
18.
18
프로그램 -vs- 프로세스
프로그램
컴파일, 링크 과정을 거쳐 실행할 수 있는 머신코드로 디스크에 저장되어 있음
가상메모리를 사용하는 범용 OS에서는 프로그램의 코드 및 변수의 주소가 이미 결정되어짐
ELF (Executable and Linkable Format)
리눅스의 오브젝트 파일 형식 (원도우즈에서는 PE(Portable Executable) 사용)
https://ko.wikipedia.org/wiki/ELF_파일_형식
프로세스
실행중인 프로그램
하드웨어 및 운영체제 리뷰
Run-Time
19.
19
LAB) C 프로그램빌드, 실행, 메모리 레이아웃 이해 (1/3)
Static Allocation -vs- Dynamic Allocation
하드웨어 및 운영체제 리뷰
cprog.c
#include <stdio.h>
#include <stdlib.h>
int f2(int x);
int a = 10;
int a2 = 20;
int b;
int b2;
int f1(int x) {
return ++x;
}
int main() {
int c = 100, c2;
char *d = "hello";
char *name;
int *score;
name = malloc(50);
score = malloc(20 * sizeof(int));
printf("%sn", d);
printf("addr(TEXT) => main:%p, f1:%p, f2:%pn", main, f1, f2);
printf("addr(CONST) => d:%pn", d);
printf("addr(DATA) => a:%p, a2:%pn", &a, &a2);
printf("addr(BSS) => b:%p, b2:%pn", &b, &b2);
printf("addr(STACK) => c:%p, c2:%pn", &c, &c2);
printf("addr(HEAP) => name:%p, score:%pn", name, score);
return 0;
}
int f2(int x) {
return --x;
}
프로그램
(HDD)
코드/상수
Static
Allocation
TEXT
초기화된 전역변수와 정적변수 DATA
초기화되지 않은 전역변수와 정적변수 BSS
프로세스
(RAM)
코드/상수
Static
Allocation
TEXT
초기화된 전역변수와 정적변수 DATA
초기화되지 않은 전역변수와 정적변수
(0으로 자동 초기화) BSS
동적 할당 메모리
(포인터로 접근)
Dynamic
Allocation
HEAP
지역변수
함수 인자와 리턴 값 STACK
실행
20.
20
LAB) C 프로그램빌드, 실행, 메모리 레이아웃 이해 (2/3)
C 프로그램 빌드 및 주소 확인
하드웨어 및 운영체제 리뷰
C 언어 소스를 빌드하여 실행파일 생성
[root@jvmedu ~]# cd ~/lab/cprogram
[root@jvmedu cprogram]# gcc cprog.c
[root@jvmedu cprogram]# ls -l
total 16
-rwxr-xr-x 1 root root 8624 Oct 18 14:12 a.out
-rw-r--r-- 1 root root 689 Oct 18 14:10 cprog.c
빌드된 실행파일의 형식을 확인
[root@jvmedu cprogram]# file a.out
a.out: ELF 64-bit LSB executable, x86-64, version 1 (SYSV), dynamically linked (uses shared libs),
for GNU/Linux 2.6.32, BuildID[sha1]=d97dd1cd5b319eb15e2d7fe252100ad309f8c1b7, not stripped
a.out 실행파일의 변수 및 함수의 주소를 확인
[root@jvmedu cprogram]# readelf -a a.out 또는 nm a.out 으로 주소 확인
Section Headers:
[Nr] Name Type Address Offset Size EntSize Flags Link Info Align
[ 0] NULL 0000000000000000 00000000 0000000000000000 0000000000000000 0 0 0
[ 1] .text PROGBITS 0000000000000000 00000040 0000000000000027 0000000000000000 AX 0 0 1
[ 2] .rela.text RELA 0000000000000000 00000200 0000000000000030 0000000000000018 I 10 1 8
[ 3] .data PROGBITS 0000000000000000 00000067 0000000000000000 0000000000000000 WA 0 0 1
[ 4] .bss NOBITS 0000000000000000 00000067 0000000000000000 0000000000000000 WA 0 0 1
[ 5] .rodata PROGBITS 0000000000000000 00000067 000000000000000a 0000000000000000 A 0 0 1
[ 6] .comment PROGBITS 0000000000000000 00000071 000000000000002e 0000000000000001 MS 0 0 1
[ 7] .note.GNU-stack PROGBITS 0000000000000000 0000009f 0000000000000000 0000000000000000 0 0 1
[ 8] .eh_frame PROGBITS 0000000000000000 000000a0 0000000000000038 0000000000000000 A 0 0 8
[ 9] .rela.eh_frame RELA 0000000000000000 00000230 0000000000000018 0000000000000018 I 10 8 8
[10] .symtab SYMTAB 0000000000000000 000000d8 0000000000000108 0000000000000018 11 9 8
[11] .strtab STRTAB 0000000000000000 000001e0 000000000000001c 0000000000000000 0 0 1
[12] .shstrtab STRTAB 0000000000000000 00000248 0000000000000061 0000000000000000 0 0 1
Key to Flags:
W (write), A (alloc), X (execute), M (merge), S (strings), I (info), L (link order), O (extra OS processing required), G (group), T (TLS),
C (compressed), x (unknown), o (OS specific), E (exclude), l (large), p (processor specific)
...
21.
21
LAB) C 프로그램빌드, 실행, 메모리 레이아웃 이해 (3/3)
프로그램을 실행하여 프로세스 상태의 메모리 레이아웃 이해
하드웨어 및 운영체제 리뷰
a.out 프로그램을 실행하고 결과를 보고 프로세스의 메모리 레이아웃에 대해 이해
[root@jvmedu cprogram]# ./a.out
hello
addr(TEXT) => main:0x4005cd, f1:0x4005bd, f2:0x4006ad
addr(CONST) => d:0x400750
addr(DATA) => a:0x601044, a2:0x601048
addr(BSS) => b:0x601050, b2:0x601054
addr(STACK) => c:0x7fff55dabff4, c2:0x7fff55dabff0
addr(HEAP) => name:0xbbf010, score:0xbbf050
22.
22
정적 링킹 (StaticLinking) 동적 링킹 (Dynamic Linking)
최종 실행파일에 필요한 오브젝트 파일들을 미리 링크하여 실행파일에
포함
실행파일만 있으면 별도의 파일 없이 실행 가능함
실행파일의 크기가 커지고 라이브러리 갱신 시 모든 파일의 재 컴파일
필요
정적 링킹은 라이브러리 코드가 실행 파일 내에 저장되기 때문에 배포
와 설치를 간단하게 만듦
최종 실행파일에 필요한 오브젝트 파일들을 미리 링크하지 않고, 실행
하려고 할 때 필요한 프로그램 모듈을 결합하여 실행을 계속함
실행파일의 크기가 작음
실행파일 이외의 별도의 필요한 모듈을 제공해야 함
종류
Build-time Linking
Run-time Linking
링킹(Linking)의 종류
하드웨어 및 운영체제 리뷰
23.
23
LAB) 링킹 방법및 링킹 정보 확인 (1/2)
링킹 방법
Dynamic Linking
디폴트 - 아무런 옵션 없이 사용
Static Linking
링크 작업시 -static 옵션 사용
하드웨어 및 운영체제 리뷰
cprog.c
#include <stdio.h>
#include <stdlib.h>
int f2(int x);
int a = 10;
int b;
int a2 = 20;
int b2;
int f1(int x) {
return ++x;
}
int main() {
int c = 100, c2;
char *d = "hello";
char *name;
int *score;
name = malloc(50);
score = malloc(20 * sizeof(int));
printf("%sn", d);
printf("addr(TEXT) => main:%p, f1:%p, f2:%pn", main, f1, f2);
printf("addr(CONST) => d:%pn", d);
printf("addr(DATA) => a:%p, a2:%pn", &a, &a2);
printf("addr(BSS) => b:%p, b2:%pn", &b, &b2);
printf("addr(STACK) => c:%p, c2:%pn", &c, &c2);
printf("addr(HEAP) => name:%p, score:%pn", name, score);
return 0;
}
int f2(int x) {
return --x;
}
24.
24
LAB) 링킹 방법및 링킹 정보 확인 (2/2)
하드웨어 및 운영체제 리뷰
Dynamic Linking Static Linking
cprog.c 소스파일을 Dynamic Linking으로 a.out_dynamic 실행 파일을 빌드 cprog.c 소스파일을 Static Linking으로 a.out_static 실행 파일 빌드
[root@jvmedu ~]# cd ~/lab/cprogram
[root@jvmedu cprogram]# gcc cprog.c -o a.out_dynamic
[root@jvmedu ~]# cd ~/lab/cprogram
[root@jvmedu cprogram]# gcc -static cprog.c -o a.out_static
빌드된 a.out_dynamic 실행파일의 파일 정보 확인 빌드된 a.out_static 실행파일의 파일 정보 확인
[root@jvmedu cprogram]# file a.out_dynamic
a.out_dynamic: ELF 64-bit LSB executable, x86-64, version 1 (SYSV),
dynamically linked (uses shared libs), for GNU/Linux 2.6.32,
BuildID[sha1]=fef585c519097eb7b47761185909d8d20ec47545, not stripped
[root@jvmedu cprogram]# file a.out_static
a.out_static: ELF 64-bit LSB executable, x86-64, version 1 (GNU/Linux),
statically linked, for GNU/Linux 2.6.32,
BuildID[sha1]=c6acb31c946e031cd81c5c9e54fb55ab2ff73675, not stripped
빌드된 a.out_dynamic 실행파일의 SYMBOL 정보 확인 빌드된 a.out_static 실행파일의 SYMBOL 정보 확인
[root@jvmedu 01]# nm a.out_dynamic
000000000060103c D a
0000000000601040 D a2
0000000000601048 B b
000000000060104c B b2
0000000000601044 B __bss_start
0000000000601044 b completed.6355
0000000000601038 D __data_start
0000000000601038 W data_start
00000000004004f0 t deregister_tm_clones
0000000000400560 t __do_global_dtors_aux
0000000000600e18 t __do_global_dtors_aux_fini_array_entry
0000000000400738 R __dso_handle
0000000000600e28 d _DYNAMIC
...
[root@jvmedu 01]# nm a.out_static
00000000006bd084 D a
00000000006bd088 D a2
000000000041ce80 T abort
00000000006bf730 B __abort_msg
000000000043de60 W access
000000000043de60 T __access
0000000000490dd0 t add_fdes
000000000044b700 t add_module.isra.1
0000000000440d90 t add_name_to_object.isra.2
00000000006be708 d adds.8362
000000000041d300 T __add_to_environ
0000000000488690 t add_to_global
00000000006bf4c0 V __after_morecore_hook
...
Dynamic Linking된 바이너리와 Static Linking된 바이너리의 사이즈 비교
[root@jvmedu cprogram]# ls -lh a.out_*
-rwxr-xr-x 1 root root 8.6K Oct 24 14:51 a.out_dynamic
-rwxr-xr-x 1 root root 842K Oct 24 20:05 a.out_static
Static Linking의
사이즈가 97배 더 큼
25.
25
LAB) Shared Library제작 (1/2)
Shared Library 제작
gcc -c -fPIC max.c
gcc -c -fPIC min.c
gcc -shared -o libtest.so max.o min.o
하드웨어 및 운영체제 리뷰
max.c 와 min.c를 빌드하여 object 파일이 생성되었는지 확인
[root@jvmedu ~]# cd ~/lab/cprogram/libTest1/libSrc
[root@jvmedu libSrc]# gcc -c max.c min.c
[root@jvmedu libSrc]# ls -l *.o
-rw-r--r-- 1 root root 1248 Oct 24 15:37 max.o
-rw-r--r-- 1 root root 1248 Oct 24 15:37 min.o
gcc의 -shared 옵션으로 libtest.o 라는 Shared Library 생성하고 파일 정보를 확인
[root@jvmedu libSrc]# gcc -shared -o libtest.so max.o min.o
[root@jvmedu libSrc]# file libtest.so
libtest.so: ELF 64-bit LSB shared object, x86-64, version 1 (SYSV), dynamically
linked, BuildID[sha1]=f2167ffbae307a30ecde862fd12777949ce917d4, not stripped
[라이브러리 실습 소스]
26.
26
LAB) Shared Library제작 (2/2)
Shared Library 이용
gcc -c -I<라이브러리헤더파일위치> app.c
gcc app.o -ltest -L<정적라이브러리위치>
하드웨어 및 운영체제 리뷰
[라이브러리 실습 소스]
appSrc 폴더로 이동하여, app.c 소스파일을 빌드하여 object 파일을 생성
[root@jvmedu ~]# cd ~/lab/cprogram/libTest1/appSrc
[root@jvmedu appSrc]# gcc -c -I ../include/ app.c
-L 옵션으로 Library 위치를 명시하고 링크를 수행하고, 실행파일의 파일 정보를 확인
[root@jvmedu appSrc]# gcc app.o -ltest -L ../libSrc/
[root@jvmedu appSrc]# file a.out
a.out: ELF 64-bit LSB executable, x86-64, version 1 (SYSV), dynamically linked
(uses shared libs), for GNU/Linux 2.6.32,
BuildID[sha1]=91e33185650af97a7869a15687fdcaa324efd8bb, not stripped
링크된 실행파일을 실행해보고 정상 수행되는지 확인하고, 실패하는 원인은?
[root@jvmedu appSrc]# ./a.out
./a.out: error while loading shared libraries: libtest.so: cannot open shared
object file: No such file or directory
LD_LIBRARY_PATH 환경변수에 libtest.so 파일경로를 추가하고, a.out 실행
[root@jvmedu appSrc]# export
LD_LIBRARY_PATH=$LD_LIBRARY_PATH:/root/lab/cprogram/libTest1/libSrc
[root@jvmedu appSrc]# ./a.out
max(5, 2) : 5
min(5, 2) : 2
a.out 실행파일에 포함된 동적 라이브러를 확인
[root@jvmedu appSrc]# ldd a.out
linux-vdso.so.1 => (0x00007ffd495e4000)
libtest.so => /root/lab/cprogram/libTest1/libSrc/libtest.so (0x00007fa4615ba000)
libc.so.6 => /lib64/libc.so.6 (0x00007fa4611ec000)
/lib64/ld-linux-x86-64.so.2 (0x00007fa4617bc000)
27.
27
LAB) Runtime Loading+ Linking 되는 동적 라이브러리 (1/2)
동적 라이브러리 인터페이스 함수
하드웨어 및 운영체제 리뷰
#include <dlfcn.h>
/* Open the shared object FILE and map it in; return a handle that can be
passed to `dlsym' to get symbol values from it. */
void *dlopen(const char *filename, int flag);
/* Find the run-time address in the shared object HANDLE refers to
of the symbol called NAME. */
void *dlsym(void *handle, const char *symbol);
/* Unmap and close a shared object opened by `dlopen'.
The handle cannot be used again after calling `dlclose'. */
int dlclose(void *handle);
/* When any of the above functions fails, call this function
to return a string describing the error. Each call resets
the error string so that a following call returns null. */
char *dlerror(void);
flag 의미
RTLD_LAZY
동적 라이브러리가 실행되면서 코드의 정의되지 않은 심볼을 처리
정의되지 않은 심볼이 있으면 알아볼 수 없는 에러 발생
RTLD_NOW
dlopen()이 리턴하기 전에 모든 정의되지 않은 심볼을 처리하고,
그것이 되지 않을 경우 실패. 디버깅시 사용
RTLD_GLOBAL
라이브러리에 적제되는 외부 심볼들은 그 후에 적재되는 라이브러리에
의해서 가능함
라이브러리를 여는데 약간의 시간이 더 걸림
28.
28
LAB) Runtime Loading+ Linking 되는 동적 라이브러리 (2/2)
동적 라이브러리 사용 절차
1) 공유 라이브러리 제작 & LD_LIBRARY_PATH에 등록
2) 동적 라이브러리를 사용하는 응용프로그램 작성 : dltest.c
3) 동적 라이브러리를 이용하는 응용프로그램 컴파일
4) 동적 라이브러리를 사용한 응용프로그램 실행
동적 라이브러리 실습
하드웨어 및 운영체제 리뷰
dltest.c
#include <stdio.h>
#include <stdlib.h>
#include <dlfcn.h>
typedef int (*FP)(int, int);
int main(void) {
void *handle;
FP fp_max, fp_min;
char *error;
handle = dlopen("libtest.so", RTLD_LAZY);
if (!handle) {
fputs(dlerror(), stderr);
exit(1);
}
fp_max = dlsym(handle, "max");
if ((error = dlerror()) != NULL) {
fprintf(stderr, "%s", error);
exit(1);
}
fp_min = dlsym(handle, "min");
if ((error = dlerror()) != NULL) {
fprintf(stderr, "%s", error);
exit(1);
}
printf("max(7, 4) : %dn", fp_max(7, 4));
printf("min(5, 2) : %dn", fp_min(5, 2));
dlclose(handle);
return 0;
}
① 공유 라이브러리 제작 & LD_LIBRARY_PATH에 등록
앞 슬라이드에서 작업 완료
② 동적 라이브러리를 사용하는 응용프로그램 작성 : dltest.c
옆의 소스 참고
③ 동적 라이브러리를 이용하는 응용프로그램 컴파일
[root@jvmedu ~]# cd ~/lab/cprogram
[root@jvmedu cprogram]# gcc dltest.c -ldl
④ 동적 라이브러리를 사용한 응용프로그램 실행
[root@jvmedu cprogram]# ./a.out
max(7, 4) : 7
min(5, 2) : 2
a.out 실행파일에 libtest.so 동적 라이브러리 정보가 링크되지 않았음을 확인
[root@jvmedu cprogram]# ldd a.out
linux-vdso.so.1 => (0x00007ffe25de1000)
libdl.so.2 => /lib64/libdl.so.2 (0x00007fc92e4f2000)
libc.so.6 => /lib64/libc.so.6 (0x00007fc92e124000)
/lib64/ld-linux-x86-64.so.2 (0x00007fc92e6f6000)
Runtime Loading
Runtime
Linking
31
WOCA WORA
Write OnceRun Anywhere
Java Virtual Machine
JAVA의 철학(WORA)을 실현하기 위한 4가지 기술
① Java Programming Language
② Java Class File Format
③ Java Application Programming Interface
④ Java Virtual Machine
32.
32
JAVA 프로그램 수행과정
Java Virtual Machine
A.java
A.java B.java
B.java C.java
C.java
Java
compiler
A.class
A.class B.class
B.class C.class
C.class
Java source file
Java class file
Object.class
Object.class String.class
String.class
Java API’s class files
Java class file
A.class
A.class B.class
B.class C.class
C.class
Java Virtual
Machine
Compile
Time
Compile
Time
Run
Time
Run
Time
① Java Programming Language
② Class File Format
③ API
④ JVM
33.
33
① Java ProgrammingLanguage
Java Virtual Machine
object-orientation
multi-threading
structured error-handling
garbage collection
dynamic linking
dynamic extension
Source Code의 재사용
Memory관리에서 해방
Array bound check를 통한 Program의
corruption방지
Object Reference check를 통한 Null
Reference 방지
최신 Software 기술의 적용
최신 Software 기술의 적용
생산성의 극대화
생산성의 극대화
Java Virtual Machine
Other Class
Runtime Memory를
직접 핸들링하지 않음
Dynamic Linking
Linking : 개발한 코드에 표준 라이브러리를 연결하는 작업
Class 파일은 JVM에 로드 된 후 실행이 가능한 형태로 변환되는데, 이
때 표준 라이브러리와 Linking이 수행됨
Class 파일 사이즈가 적음
이러한 Link작업이 필요할 때마다 동적으로 이루어짐
34.
34
② Java ClassFile Format
Class File Format
Network Byte Order 사용
서로 다른 계열의 CPU끼리 데이터 통신시 Byte Order(Big Endian/Little Endian)에 상관없이 전송하기 위한 규약
Compact한 형태
ByteCode로 변경
Platform 독립적
Java Virtual Machine
Presentation
Presentation
클래스파일
Introduction to Class File Format Byte Code.pptx
https://www.dropbox.com/s/djz1ogobx38s9v7/Introduction%20to%20Class%20File%20Format%20%26%20Byte%20Code.pptx?dl=0
Class File Format Image
https://www.dropbox.com/s/dcesinbnh0g7dmj/%ED%81%B4%EB%9E%98%EC%8A%A4%ED%8C%8C%EC%9D%BC%ED%8F%AC%EB%A7%B7.png?dl=0
35.
35
③ Java API(ApplicationProgramming Interface) (1/2)
Runtime Library의 집합
Platform Independent
java -XshowSettings:properties -version
sun.boot.class.path
Java Virtual Machine
Java API
Java Class
Linux
Linux
jvm.so
jvm.so
Java API
Java Class
jvm.dll
jvm.dll
Windows
Windows
Java API
Java Class
Others
Others
jvm.xxx
Native Library (Dynamic Linking)
Host Operating System
38
④ Java VirtualMachine (2/3)
자바를 위한 가상의 머신
Java Virtual Machine
Java API
Java Class
Linux
Linux
jvm.so
Java API
Java Class
jvm.dll
Windows
Windows
Java API
Java Class
Others
Others
jvm.xxx
Java
Virtual
Machine
Host Operating System
39.
39
④ Java VirtualMachine (3/3)
JVM Architecture
① Class Loader System을 통해 Class 파일들을 JVM으로 로딩한다.
② 로딩된 Class 파일들은 Execution Engine에 의해 해석된다.
③ 이렇게 해석된 프로그램은 Runtime Data Area 배치되어 실질적인 수행이 이루어지게 된다.
④ 이러한 실행 과정 속에서 JVM은 필요에 따라 Thread Synchronization과 Garbage Collection 같은 관리작업을 수행하게 된다
Java Virtual Machine
Java Application
(Real-Time) Operating System
Native
Method
Libraries
Class
Libraries
Class Loader System
Execution
Engine
Run-time
Data Area
Garbage
Collector
Java
Threads
Native
Threads
40.
40
JVM 히스토리
Java VirtualMachine
https://www.geeksforgeeks.org/the-complete-history-of-java-programming-language/
-javaagent
옵션 추가
Modern JAVA
Microsoft Word
문서
42
참고) JVM 구현체(2/3)
Java Virtual Machine
Vendor Product Commercial Architecture Description
ORACLE Oracle JDK Commercial Hotspot
Java 8 2019년 1월 이후 License 필요
검토 시 기준 값으로 사용
AZUL Zing Commercial Zing
Azul의 자체 아키텍처를 가진 JVM
상용버전으로, 아키텍처가 독특함
OpenJDK.org OpenJDK OSS Hotspot
썬 마이크로시스템즈 시절에 만들어진 커뮤니티 그룹으로 OpenJDK가 만들어지는 곳
커뮤니티에 집중되어 있고 Source는 배포하지만
Binary 배포는 https://jdk.java.net을 통하여 이루어짐
https://jdk.java.net에서 배포되는 Binary는 참조용으로 사용할 것을 권장
AZUL Zulu OSS Hotspot
Azul에서 오픈소스로 제공하는 JDK
Zing과는 아키텍처 자체가 다르며, OpenJDK를 기반으로 개발되지만 별도의 계약으로 지원을 받을
수 있음
Red Hat/CentOS OpenJDK OSS Hotspot
레드햇에서 RHEL(Red Hat Enterprise Linux) 또는 CentOS yum repository를 통하여 rpm(binary)으
로 배포
OS 버전에 따라서 지원되는 버전이 조금씩 다름
AdoptOpenJDK.net OpenJDK OSS
Hotspot
OpenJ9
OpenJDK 배포를 주 목적으로 하며, 여러 기업의 후원을 받아 개발자들이 운영하는 커뮤니티
오라클의 지원으로 OpenJDK.org가 주도하는 Hotspot(openjdk)과, IBM의 지원으로 Eclipse가 주도
하는 OpenJ9 VM의 Binary를 모두 제공
다양한 플랫폼과 VM아키텍처의 Binary를 제공 받을 수 있음
Eclipse.org OpenJ9 OSS OpenJ9
(IBM)
IBM이 자체 JDK를 Eclipse에 기부하면서 시작된 프로젝트로 VM 아키텍처가 Hotspot과 다름
IBM 계열의 JDK를 사용 중이던 기업에서 OpenJDK를 고려할 경우 OpenJ9을 고려할 수 있음
기존의 Hotspot 계열의 JVM과 설정 및 아키텍처에서 다수의 차이가 있음
43.
43
참고) JVM 구현체(3/3)
VM Options Explorer
https://chriswhocodes.com
Java Virtual Machine
44.
44
JVM Option
JAVAOption
https://docs.oracle.com/javase/8/docs/technotes/tools/windows/java.html#CBBIJCHG
Java Virtual Machine
Standard Option Non-standard Option
모든 JVM에 공통인 Option
JVM버전에 따라 다름
설정 값, 성능개선 등의 Parameter 등이 포함
- 뒤에 옵션이 들어감 -X option -XX option
Macro한 측면의 제어 Micro한 측면의 제어
Boolean
on : -XX:+option
off : -XX:-option
설정된 Option을 끄거나 새로운 기능을 추가하기 위해 사용
Numeric -XX:option=number
보통 용량 설정
• k, K - Kilobyte
• m, M - Megabyte
• g, G - Gigabyte
• 단위가 없으면 byte로 인식
String -XX:option=string 특정 파일 또는 Path 의 지정에 많이 사용
Non-standard Option
Standard Option
JVM Option -X Option
-XX Option
45.
45
LAB) JVM Standard옵션 확인
https://docs.oracle.com/javase/8/docs/technotes/tools/unix/java.html
Java Virtual Machine
[root@jvmedu ~]# java -help
Usage: java [-options] class [args...]
(to execute a class)
or java [-options] -jar jarfile [args...]
(to execute a jar file)
where options include:
-d32 use a 32-bit data model if available
-d64 use a 64-bit data model if available
-server to select the server VM
The default VM is server,
because you are running on a server-class machine.
-cp class search path of directories and zip/jar files
-classpath class search path of directories and zip/jar files
A : separated list of directories, JAR archives,
and ZIP archives to search for class files.
-Dname=value
set a system property
-verbose:[class|gc|jni]
enable verbose output
-version print product version and exit
-version:value
Warning: this feature is deprecated and will be removed
in a future release.
require the specified version to run
-showversion print product version and continue
-jre-restrict-search | -no-jre-restrict-search
Warning: this feature is deprecated and will be removed
in a future release.
include/exclude user private JREs in the version search
-? -help print this help message
-X print help on non-standard options
-ea[:packagename...|:classname]
-enableassertions[:packagename...|:classname]
enable assertions with specified granularity
-da[:packagename...|:classname]
-disableassertions[:packagename...|:classname]
disable assertions with specified granularity
-esa | -enablesystemassertions
enable system assertions
-dsa | -disablesystemassertions
disable system assertions
-agentlib:libname[=options]
load native agent library libname, e.g. -agentlib:hprof
see also, -agentlib:jdwp=help and -agentlib:hprof=help
-agentpath:pathname[=options]
load native agent library by full pathname
-javaagent:jarpath[=options]
load Java programming language agent
, see java.lang.instrument
-splash:imagepath
show splash screen with specified image
See http://www.oracle.com/technetwork/java/javase/documentation/index.html
for more details.
46.
46
LAB) JVM Non-Standard-X 옵션 확인
Java Virtual Machine
[root@jvmedu ~]# java -X
-Xmixed mixed mode execution (default)
-Xint interpreted mode execution only
-Xbootclasspath:directories and zip/jar files separated by :
set search path for bootstrap classes and resources
-Xbootclasspath/a:directories and zip/jar files separated by :
append to end of bootstrap class path
-Xbootclasspath/p:directories and zip/jar files separated by :
prepend in front of bootstrap class path
-Xdiag show additional diagnostic messages
-Xnoclassgc disable class garbage collection
-Xincgc enable incremental garbage collection
-Xloggc:file log GC status to a file with time stamps
-Xbatch disable background compilation
-Xmssize set initial Java heap size
-Xmxsize set maximum Java heap size
-Xsssize set java thread stack size
-Xprof output cpu profiling data
-Xfuture enable strictest checks, anticipating future default
-Xrs reduce use of OS signals by Java/VM (see documentation)
-Xcheck:jni perform additional checks for JNI functions
-Xshare:off do not attempt to use shared class data
-Xshare:auto use shared class data if possible (default)
-Xshare:on require using shared class data, otherwise fail.
-XshowSettings show all settings and continue
-XshowSettings:all show all settings and continue
-XshowSettings:vm show all vm related settings and continue
-XshowSettings:system (Linux Only) show host system or container configuration and continue
-XshowSettings:properties show all property settings and continue
-XshowSettings:locale show all locale related settings and continue
The -X options are non-standard and subject to change without notice.
47.
47
LAB) JVM 디폴트설정 값 확인 (1/2)
Java Virtual Machine
vm 디폴트 설정 값 확인
[root@jvmedu ~]# java -XshowSettings:vm -version
VM settings:
Max. Heap Size (Estimated): 878.50M
Ergonomics Machine Class: server
Using VM: OpenJDK 64-Bit Server VM
Locale 디폴트 설정 값 확인
[root@jvmedu ~]# java -XshowSettings:locale -version
Locale settings:
default locale = English
default display locale = English (United States)
default format locale = English (United States)
available locales = , ar, ar_AE, ar_BH, ar_DZ, ar_EG, ar_IQ, ar_JO,
ar_KW, ar_LB, ar_LY, ar_MA, ar_OM, ar_QA, ar_SA, ar_SD,
ar_SY, ar_TN, ar_YE, be, be_BY, bg, bg_BG, ca,
ca_ES, cs, cs_CZ, da, da_DK, de, de_AT, de_CH,
de_DE, de_GR, de_LU, el, el_CY, el_GR, en, en_AU,
en_CA, en_GB, en_IE, en_IN, en_MT, en_NZ, en_PH, en_SG,
en_US, en_ZA, es, es_AR, es_BO, es_CL, es_CO, es_CR,
es_CU, es_DO, es_EC, es_ES, es_GT, es_HN, es_MX, es_NI,
es_PA, es_PE, es_PR, es_PY, es_SV, es_US, es_UY, es_VE,
et, et_EE, fi, fi_FI, fr, fr_BE, fr_CA, fr_CH,
fr_FR, fr_LU, ga, ga_IE, hi, hi_IN, hr, hr_HR,
hu, hu_HU, in, in_ID, is, is_IS, it, it_CH,
it_IT, iw, iw_IL, ja, ja_JP, ja_JP_JP_#u-ca-japanese, ko, ko_KR,
lt, lt_LT, lv, lv_LV, mk, mk_MK, ms, ms_MY,
mt, mt_MT, nl, nl_BE, nl_NL, no, no_NO, no_NO_NY,
pl, pl_PL, pt, pt_BR, pt_PT, ro, ro_RO, ru,
ru_RU, sk, sk_SK, sl, sl_SI, sq, sq_AL, sr,
sr_BA, sr_BA_#Latn, sr_CS, sr_ME, sr_ME_#Latn, sr_RS, sr_RS_#Latn, sr__#Latn,
sv, sv_SE, th, th_TH, th_TH_TH_#u-nu-thai, tr, tr_TR, uk,
uk_UA, vi, vi_VN, zh, zh_CN, zh_HK, zh_SG, zh_TW
Automatic Selection
Java 5 부터 자동으로 Garbage Collector, Heap Size등을 자동으
로 선택
Hardware Resource와 OS정보가 기준
Sever Class와 Client Class의 구분
java -XX:+PrintCommandLineFlags -version
-XX:InitialHeapSize=64717248
-XX:MaxHeapSize=1035475968
-XX:+PrintCommandLineFlags
-XX:+UseCompressedClassPointers
-XX:+UseCompressedOops
-XX:+UseParallelGC
openjdk version 1.8.0_302
OpenJDK Runtime Environment (Temurin)(build 1.8.0_302-b08)
OpenJDK 64-Bit Server VM (Temurin)(build 25.302-b08, mixed
mode)
51
Runtime Data Area의구조
Runtime Data Area
Class files
Run-Time Data Area
Method Area
Method Area Heap
Heap JVM Stacks
JVM Stacks
PC Register
PC Register
native method interface
native
method
libraries
Class libraries
“Process로서의 JVM이 프로그램을 수행하기 위해 OS로 부터 할당 받은 메모리 영역“
Native
Method Stacks
Native
Method Stacks
모든 Thread에 공유됨 Thread별로 생성
Class Loader
subsystem
Class Loader
subsystem
Execution
engine
Execution
engine
52.
52
PC(Program Counter) Register(1/2)
JVM 스펙 문서의 PC Register
The Java Virtual Machine can support many threads of execution at once. Each Java Virtual Machine
thread has its own pc (program counter) register. At any point, each Java Virtual Machine thread is
executing the code of a single method, namely the current method for that thread. If that method is
not native, the pc register contains the address of the Java Virtual Machine instruction currently
being executed. If the method currently being executed by the thread is native, the value of the Java
Virtual Machine's pc register is undefined. The Java Virtual Machine's pc register is wide enough to
hold a returnAddress or a native pointer on the specific platform.
(참고) 프로세서(CPU)의 프로그램 실행 절차
Runtime Data Area
FETCH
DECODE
EXECUTE
53.
53
PC(Program Counter) Register(2/2)
현재 작업하는 내용(Byte Code Instruction)을 CPU에 instruction으로 제공할 때 사용하는 버퍼 공간
Thread 별로 하나씩 존재하며, Thread가 시작될 때 생성됨
Thread가 java method를 수행하고 있다면, PC Register에는 현재 수행중인 JVM Instruction을 주소를 가지고 있게 된다.
Runtime Data Area
Thread PC register (Program Counter)
Create
Start
Java Method Call { … }
Native Pointer
Native Pointer
or
Return Address
Current Instruction Address
Current Instruction Address
(native pointer or
method bytecode 시작 offset)
undefined
Native Method Call
54.
54
Java Virtual MachineStacks (1/2)
JVM 스펙의 JVM Stacks
Each Java Virtual Machine thread has a private Java Virtual Machine stack, created at the same time as the thread. A Java Virtual
Machine stack stores frames. A Java Virtual Machine stack is analogous to the stack of a conventional language such as C: it holds local
variables and partial results, and plays a part in method invocation and return. Because the Java Virtual Machine stack is never
manipulated directly except to push and pop frames, frames may be heap allocated. The memory for a Java Virtual Machine stack does
not need to be contiguous.
In the First Edition of The Java® Virtual Machine Specification, the Java Virtual Machine stack was known as the Java stack.
This specification permits Java Virtual Machine stacks either to be of a fixed size or to dynamically expand and contract as required by
the computation. If the Java Virtual Machine stacks are of a fixed size, the size of each Java Virtual Machine stack may be chosen
independently when that stack is created.
A Java Virtual Machine implementation may provide the programmer or the user control over the initial size of Java Virtual Machine stacks, as well as, in
the case of dynamically expanding or contracting Java Virtual Machine stacks, control over the maximum and minimum sizes.
Runtime Data Area
④
③
②
①
삽입(push) 제거(pop)
①②③④의 순서로 데이터 삽입 ④③②①의 순서로 데이터 제거
스택의 상위(Top)
[그림 5-2] 스택의 구조
The following exceptional conditions are associated with Java Virtual
Machine stacks:
If the computation in a thread requires a larger Java Virtual Machine stack than
is permitted, the Java Virtual Machine throws a StackOverflowError.
If Java Virtual Machine stacks can be dynamically expanded, and expansion is
attempted but insufficient memory can be made available to effect the
expansion, or if insufficient memory can be made available to create the initial
Java Virtual Machine stack for a new thread, the Java Virtual Machine throws an
OutOfMemoryError.
55.
55
Java Virtual MachineStacks (2/2)
Runtime Data Area
Java
Stack
Java
Stack
Thread
Java
Stack
Java
Stack
Thread
Stack Frame
Stack Frame
Stack Frame
Stack Frame
Stack Frame
Stack Frame
Stack Frame
Stack Frame
Stack Frame
Stack Frame
Stack Frame
Stack Frame
Stack Frame
Stack Frame
Thread
Thread
Java
Stack
Java Stacks
Java Stack은 Thread의 상태 값을 저장
Thread당 1개의 Stack Area
Stack의 모든 데이터는 Thread의 소유
다른 Thread 접근 불허
Implement는 JVM Vendor의 재량
Stack Frame들로 구성됨
Thread 가 Java Method 를 하나 수행하게 되면 JVM 은 Stack Frame 을 하
나 생성 하여 JVM Stacks 에 Push
Stack Trace
‘kill -3 pid’로 생성되는 Thread Dump는 Stack Frame을 한라인으로 표시한 것
56.
56
LAB) Stack Trace(Thread Dump) 확인 (1/3)
jpetstore 샘플 웹어플리케이션 실행
Runtime Data Area
STS를 실행하고 “Tomcat v8.5” 서버 시작
[root@jvmedu ~]# sts
http://192.168.56.96:8080/jpetstore URL로 접속
Tomcat 시작
http://192.168.56.96:8080/jpetstore/
57.
57
LAB) Stack Trace(Thread Dump) 확인 (2/3)
VisualVM
https://visualvm.github.io/
Runtime Data Area
visualvm 프로그램을 설치하고 Alias 를 등록하고 visualvm 실행 후 visualgc 플러그인 설치
Tools Plugins Available Plugins Visual GC Install
[root@jvmedu ~]# cd ~/lab/java-tool
[root@jvmedu java-tool]# unzip visualvm_211.zip
[root@jvmedu java-tool]# echo alias visualvm='/root/lab/java-tool/visualvm_211/bin/visualvm /dev/null 21 ' ~/.bashrc
[root@jvmedu java-tool]# source ~/.bash_profile
[root@jvmedu java-tool]# visualvm
Applications 뷰에서 “Tomcat” 오픈 “Threads” 탭 “Thread Dump” 버튼 클릭
58.
58
LAB) Stack Trace(Thread Dump) 확인 (3/3)
Stack Trace 내용 확인
Runtime Data Area
60
Stack Frame (1/7)
JVM 스펙 상의 Stack Frame
A frame is used to store data and partial results, as well as to perform dynamic linking, return values for methods, and dispatch
exceptions.
A new frame is created each time a method is invoked. A frame is destroyed when its method invocation completes, whether that
completion is normal or abrupt (it throws an uncaught exception). Frames are allocated from the Java Virtual Machine stack (§2.5.2) of
the thread creating the frame. Each frame has its own array of local variables (§2.6.1), its own operand stack (§2.6.2), and a reference to
the runtime constant pool (§2.5.5) of the class of the current method.
A frame may be extended with additional implementation-specific information, such as debugging information.
Runtime Data Area
61.
61
Stack Frame (2/7)
Stack Frame
Thread가 수행하고 있는 Application을 Method단위로 기록하는 곳.
3부분으로 구성됨(Local Variable Section, Operand Stack, Frame Data)
Method를 호출할 때 Class의 메타정보를 이용하여 적절한 크기(Compile-Time에 이미 결정됨)로 Stack Frame을 생성하여 JVM Stack에 Push 한 후
Method를 실행한다.
StackTrace는 각 Stack Frame 을 한 라인으로 표현한 것이다.
Runtime Data Area
Stack Frame
Stack Frame
Stack Frame
Stack Frame
Stack Frame
Stack Frame
Stack Frame
Stack Frame
Stack Frame
Stack Frame
Stack Frame
Stack Frame
Stack Frame
Stack Frame
Thread
Thread
JvM
Stack
Local Variable
Section
Operand Stack
Frame Data
Method Parameters
Local Variables
JVM의 Work Space
Constant pool Resolution
Normal Method Return
Exception Dispatch
62.
62
Stack Frame (3/7)
Local Variable Section (1/3)
Method의 지역변수(Parameter variable, Local variable)를 저장하는 곳
0-Base 배열로 구성되어 있고, 배열의 index를 통해 data access
Method parameter는 선언된 순서대로 index가 할당되며, Local variable은 compiler가 알아서 index 할당
Runtime Data Area
Stack Frame
Stack Frame
Stack Frame
Stack Frame
Stack Frame
Stack Frame
Stack Frame
Stack Frame
Stack Frame
Stack Frame
Stack Frame
Stack Frame
Stack Frame
Stack Frame
Thread
Thread
JvM
Stack
Local Variable
Section
Operand Stack
Frame Data
Method Parameters
Local Variables
JVM의 Work Space
Constant pool Resolution
Normal Method Return
Exception Dispatch
63.
63
Stack Frame (4/7)
Local Variable Section (2/3) - JVM 8 스펙문서
Each frame (§2.6) contains an array of variables known as its local variables. The length of the local variable array of a frame is
determined at compile-time and supplied in the binary representation of a class or interface along with the code for the method
associated with the frame (§4.7.3).
A single local variable can hold a value of type boolean, byte, char, short, int, float, reference, or returnAddress. A pair of local variables
can hold a value of type long or double.
Local variables are addressed by indexing. The index of the first local variable is zero. An integer is considered to be an index into the
local variable array if and only if that integer is between zero and one less than the size of the local variable array.
A value of type long or type double occupies two consecutive local variables. Such a value may only be addressed using the lesser
index. For example, a value of type double stored in the local variable array at index n actually occupies the local variables with indices
n and n+1; however, the local variable at index n+1 cannot be loaded from. It can be stored into. However, doing so invalidates the
contents of local variable n.
The Java Virtual Machine does not require n to be even. In intuitive terms, values of types long and double need not be 64-bit aligned
in the local variables array.
Implementors are free to decide the appropriate way to represent such values using the two local variables reserved for the value.
The Java Virtual Machine uses local variables to pass parameters on method invocation. On class method invocation, any parameters
are passed in consecutive local variables starting from local variable 0. On instance method invocation, local variable 0 is always used to
pass a reference to the object on which the instance method is being invoked (this in the Java programming language). Any parameters
are subsequently passed in consecutive local variables starting from local variable 1.
Runtime Data Area
64.
64
// Compiled fromLocalVariableSection.java (version 1.8 : 52.0, super bit)
public class LocalVariableSection {
// Method descriptor #6 ()V
// Stack: 1, Locals: 1
public LocalVariableSection();
0 aload_0 [this]
1 invokespecial java.lang.Object() [8]
4 return
Line numbers:
[pc: 0, line: 2]
Local variable table:
[pc: 0, pc: 5] local: this index: 0 type: LocalVariableSection
// Method descriptor #15 (ICJFLjava/lang/Object;DLjava/lang/String;BSZ)I
// Stack: 1, Locals: 13
public int testMethod(int a, char b, long c, float d, java.lang.Object e,
double f, java.lang.String g, byte h, short i, boolean j);
0 iconst_0
1 ireturn
Line numbers:
[pc: 0, line: 4]
Local variable table:
[pc: 0, pc: 2] local: this index: 0 type: LocalVariableSection
[pc: 0, pc: 2] local: a index: 1 type: int
[pc: 0, pc: 2] local: b index: 2 type: char
[pc: 0, pc: 2] local: c index: 3 type: long
[pc: 0, pc: 2] local: d index: 5 type: float
[pc: 0, pc: 2] local: e index: 6 type: java.lang.Object
[pc: 0, pc: 2] local: f index: 7 type: double
[pc: 0, pc: 2] local: g index: 9 type: java.lang.String
[pc: 0, pc: 2] local: h index: 10 type: byte
[pc: 0, pc: 2] local: i index: 11 type: short
[pc: 0, pc: 2] local: j index: 12 type: boolean
}
Stack Frame (5/7)
Local Variable Section (3/3)
Local Variable Section의 크기도 Compile-Time에 결정됨
Primitive Type은 실제 값이 저장되고, Object Type은 객체가 저장되는
Heap의 Reference가 저장
hidden this
0번 인덱스에 저장되는 reference형으로, 모든 Local Method, Instance Method
에 자동으로 추가되는 변수로, 여기에 저장된 reference를 통해 Heap에 있는
Class의 Instance 데이터를 찾아가는데 이용
static으로 선언한 Class Method의 경우에는 “hidden this” 레퍼런스가 존재하지
않음 Method Area에 저장됨
(샘플) Local Variable Section에서의 Method parameter
Runtime Data Area
class LocalVariableSection {
public int testMethod(int a,
char b,
long c,
float d,
Object e,
double f,
String g,
byte h,
short i,
boolean j) {
return 0;
}
}
index 선언 할당
0 reference hidden this
1 int int a
2 int int b
3
long long c
5 float float d
6 reference Object e
7
double double f
9 reference String g
10 int byte h
11 int short i
12 int boolean j
int -vs- Integer 어떤 자료형이 효율적일까?
Byte
Code
65.
65
Stack Frame (6/7)
Operand Stack
0-Base 배열로 구성
연산을 위해 사용되는 데이터 및 결과를 Operand Stack에 집어넣고 처리
① 하나의 instruction이 연산을 위해 Operand Stack에 값을 밀어 넣으면(Push)
② 다음 instruction에서는 이 값을 빼서 (Pop) 사용
③ 연산결과가 Operand Stack에 저장되어 지정된 곳으로 보내어 짐
Runtime Data Area
Stack Frame
Stack Frame
Stack Frame
Stack Frame
Stack Frame
Stack Frame
Stack Frame
Stack Frame
Stack Frame
Stack Frame
Stack Frame
Stack Frame
Stack Frame
Stack Frame
Thread
Thread
JvM
Stack
Local Variable
Section
Operand Stack
Frame Data
Method Parameters
Local Variables
JVM의 Work Space
Constant pool Resolution
Normal Method Return
Exception Dispatch
66.
66
Stack Frame (7/7)
Operand Stack 데모
Runtime Data Area
자바 소스 Byte Code
public class OperandStack {
public void testMethod() {
int a, b, c;
a = 5;
b = 6;
c = a + b;
}
}
// Compiled from OperandStack.java (version 1.8 : 52.0, super bit)
public class OperandStack {
// Method descriptor #6 ()V
// Stack: 1, Locals: 1
public OperandStack();
0 aload_0 [this]
1 invokespecial java.lang.Object() [8]
4 return
Line numbers:
[pc: 0, line: 2]
Local variable table:
[pc: 0, pc: 5] local: this index: 0 type: OperandStack
// Method descriptor #6 ()V
// Stack: 2, Locals: 4
public void testMethod();
0 iconst_5
1 istore_1 [a]
2 bipush 6
4 istore_2 [b]
5 iload_1 [a]
6 iload_2 [b]
7 iadd
8 istore_3 [c]
9 return
Line numbers:
[pc: 0, line: 5]
[pc: 2, line: 6]
[pc: 5, line: 7]
[pc: 9, line: 8]
Local variable table:
[pc: 0, pc: 10] local: this index: 0 type: OperandStack
[pc: 2, pc: 10] local: a index: 1 type: int
[pc: 5, pc: 10] local: b index: 2 type: int
[pc: 9, pc: 10] local: c index: 3 type: int
}
67.
67
Stack Frame 메소드수행 시뮬레이션 (1/10)
Runtime Data Area
public void testMethod() {
int a, b, c;
a = 5;
b = 6;
c = a + b;
}
0: iconst_5
1: istore_1
2: bipush 6
4: istore_2
5: iload_1
6: iload_2
7:
iadd
8: istore_3
9: return
store
load
상수 5를 Operand Stack에 PUSH
Operand Stack
PUSH
PUSH
POP
POP
명령 설명
iconst_n
iconst_n represents the series of opcodes iconst_0, iconst_1, iconst_2, iconst_3, iconst_4
and iconst_5.
These are used to push the constant ints 0 through 5 onto the stack.
istore_n
Pops an int off the stack and stores it in local variable n, where n is 0, 1, 2 or 3.
n must be a valid local variable number in the current frame.
bipush
bipush takes a single parameter, and pushes the resulting int value onto the operand
stack.
iload_n
iload_n represents the series of opcodes iload_0, iload_1, iload_2, and iload_3 that
retrieve a single precision float in local variables 0, 1, 2 or 3 and push it onto the stack.
iadd
Pops two integers from the operand stack, adds them, and pushes the integer result
back onto the stack.
return
return is used to return from a method whose return type is void.
All items on the current method's operand stack are discarded. If the current method is
marked as synchronized, then an implicit monitorexit instruction is executed. Then the
current method's frame is discarded, the invoker's frame is reinstated, and control
returns to the invoker.
Local Variables Section
ref hidden this
int a
int b
int c
0
1
2
3
5
68.
68
Stack Frame 메소드수행 시뮬레이션 (2/10)
Runtime Data Area
public void testMethod() {
int a, b, c;
a = 5;
b = 6;
c = a + b;
}
0: iconst_5
1: istore_1
2: bipush 6
4: istore_2
5: iload_1
6: iload_2
7:
iadd
8: istore_3
9: return
store
load
Local Variable Section의 1번 인덱스에 값을 저장
Operand Stack
PUSH
PUSH
POP
POP
명령 설명
iconst_n
iconst_n represents the series of opcodes iconst_0, iconst_1, iconst_2, iconst_3, iconst_4
and iconst_5.
These are used to push the constant ints 0 through 5 onto the stack.
istore_n
Pops an int off the stack and stores it in local variable n, where n is 0, 1, 2 or 3.
n must be a valid local variable number in the current frame.
bipush
bipush takes a single parameter, and pushes the resulting int value onto the operand
stack.
iload_n
iload_n represents the series of opcodes iload_0, iload_1, iload_2, and iload_3 that
retrieve a single precision float in local variables 0, 1, 2 or 3 and push it onto the stack.
iadd
Pops two integers from the operand stack, adds them, and pushes the integer result
back onto the stack.
return
return is used to return from a method whose return type is void.
All items on the current method's operand stack are discarded. If the current method is
marked as synchronized, then an implicit monitorexit instruction is executed. Then the
current method's frame is discarded, the invoker's frame is reinstated, and control
returns to the invoker.
Local Variables Section
ref hidden this
int a
int b
int c
0
1
2
3
5
69.
69
Stack Frame 메소드수행 시뮬레이션 (3/10)
Runtime Data Area
public void testMethod() {
int a, b, c;
a = 5;
b = 6;
c = a + b;
}
0: iconst_5
1: istore_1
2: bipush 6
4: istore_2
5: iload_1
6: iload_2
7:
iadd
8: istore_3
9: return
store
load
상수 6을 Openand Stack에 PUSH
Operand Stack
PUSH
PUSH
POP
POP
명령 설명
iconst_n
iconst_n represents the series of opcodes iconst_0, iconst_1, iconst_2, iconst_3, iconst_4
and iconst_5.
These are used to push the constant ints 0 through 5 onto the stack.
istore_n
Pops an int off the stack and stores it in local variable n, where n is 0, 1, 2 or 3.
n must be a valid local variable number in the current frame.
bipush
bipush takes a single parameter, and pushes the resulting int value onto the operand
stack.
iload_n
iload_n represents the series of opcodes iload_0, iload_1, iload_2, and iload_3 that
retrieve a single precision float in local variables 0, 1, 2 or 3 and push it onto the stack.
iadd
Pops two integers from the operand stack, adds them, and pushes the integer result
back onto the stack.
return
return is used to return from a method whose return type is void.
All items on the current method's operand stack are discarded. If the current method is
marked as synchronized, then an implicit monitorexit instruction is executed. Then the
current method's frame is discarded, the invoker's frame is reinstated, and control
returns to the invoker.
Local Variables Section
ref hidden this
int a
int b
int c
0
1
2
3
5
6
70.
70
Stack Frame 메소드수행 시뮬레이션 (4/10)
Runtime Data Area
public void testMethod() {
int a, b, c;
a = 5;
b = 6;
c = a + b;
}
0: iconst_5
1: istore_1
2: bipush 6
4: istore_2
5: iload_1
6: iload_2
7:
iadd
8: istore_3
9: return
store
load
Local Variable Section 2번 인덱스에 6을 저장
Operand Stack
PUSH
PUSH
POP
POP
명령 설명
iconst_n
iconst_n represents the series of opcodes iconst_0, iconst_1, iconst_2, iconst_3, iconst_4
and iconst_5.
These are used to push the constant ints 0 through 5 onto the stack.
istore_n
Pops an int off the stack and stores it in local variable n, where n is 0, 1, 2 or 3.
n must be a valid local variable number in the current frame.
bipush
bipush takes a single parameter, and pushes the resulting int value onto the operand
stack.
iload_n
iload_n represents the series of opcodes iload_0, iload_1, iload_2, and iload_3 that
retrieve a single precision float in local variables 0, 1, 2 or 3 and push it onto the stack.
iadd
Pops two integers from the operand stack, adds them, and pushes the integer result
back onto the stack.
return
return is used to return from a method whose return type is void.
All items on the current method's operand stack are discarded. If the current method is
marked as synchronized, then an implicit monitorexit instruction is executed. Then the
current method's frame is discarded, the invoker's frame is reinstated, and control
returns to the invoker.
Local Variables Section
ref hidden this
int a
int b
int c
0
1
2
3
5
6
71.
71
Stack Frame 메소드수행 시뮬레이션 (5/10)
Runtime Data Area
public void testMethod() {
int a, b, c;
a = 5;
b = 6;
c = a + b;
}
0: iconst_5
1: istore_1
2: bipush 6
4: istore_2
5: iload_1
6: iload_2
7:
iadd
8: istore_3
9: return
store
load
Local Variable Section 1번 인덱스의 값을 LOAD
Operand Stack
PUSH
PUSH
POP
POP
명령 설명
iconst_n
iconst_n represents the series of opcodes iconst_0, iconst_1, iconst_2, iconst_3, iconst_4
and iconst_5.
These are used to push the constant ints 0 through 5 onto the stack.
istore_n
Pops an int off the stack and stores it in local variable n, where n is 0, 1, 2 or 3.
n must be a valid local variable number in the current frame.
bipush
bipush takes a single parameter, and pushes the resulting int value onto the operand
stack.
iload_n
iload_n represents the series of opcodes iload_0, iload_1, iload_2, and iload_3 that
retrieve a single precision float in local variables 0, 1, 2 or 3 and push it onto the stack.
iadd
Pops two integers from the operand stack, adds them, and pushes the integer result
back onto the stack.
return
return is used to return from a method whose return type is void.
All items on the current method's operand stack are discarded. If the current method is
marked as synchronized, then an implicit monitorexit instruction is executed. Then the
current method's frame is discarded, the invoker's frame is reinstated, and control
returns to the invoker.
Local Variables Section
ref hidden this
int a
int b
int c
0
1
2
3
5
6
5
72.
72
Stack Frame 메소드수행 시뮬레이션 (6/10)
Runtime Data Area
public void testMethod() {
int a, b, c;
a = 5;
b = 6;
c = a + b;
}
0: iconst_5
1: istore_1
2: bipush 6
4: istore_2
5: iload_1
6: iload_2
7:
iadd
8: istore_3
9: return
store
load
Local Variable Section 2번 인덱스의 값을 LOAD
Operand Stack
PUSH
PUSH
POP
POP
명령 설명
iconst_n
iconst_n represents the series of opcodes iconst_0, iconst_1, iconst_2, iconst_3, iconst_4
and iconst_5.
These are used to push the constant ints 0 through 5 onto the stack.
istore_n
Pops an int off the stack and stores it in local variable n, where n is 0, 1, 2 or 3.
n must be a valid local variable number in the current frame.
bipush
bipush takes a single parameter, and pushes the resulting int value onto the operand
stack.
iload_n
iload_n represents the series of opcodes iload_0, iload_1, iload_2, and iload_3 that
retrieve a single precision float in local variables 0, 1, 2 or 3 and push it onto the stack.
iadd
Pops two integers from the operand stack, adds them, and pushes the integer result
back onto the stack.
return
return is used to return from a method whose return type is void.
All items on the current method's operand stack are discarded. If the current method is
marked as synchronized, then an implicit monitorexit instruction is executed. Then the
current method's frame is discarded, the invoker's frame is reinstated, and control
returns to the invoker.
Local Variables Section
ref hidden this
int a
int b
int c
0
1
2
3
5
6
5
6
73.
73
Stack Frame 메소드수행 시뮬레이션 (7/10)
Runtime Data Area
public void testMethod() {
int a, b, c;
a = 5;
b = 6;
c = a + b;
}
0: iconst_5
1: istore_1
2: bipush 6
4: istore_2
5: iload_1
6: iload_2
7:
iadd
8: istore_3
9: return
store
load
연산의 대상이 되는 Operand Stack의 값들을 모두 pop하여
Operand Stack
PUSH
PUSH
POP
POP
명령 설명
iconst_n
iconst_n represents the series of opcodes iconst_0, iconst_1, iconst_2, iconst_3, iconst_4
and iconst_5.
These are used to push the constant ints 0 through 5 onto the stack.
istore_n
Pops an int off the stack and stores it in local variable n, where n is 0, 1, 2 or 3.
n must be a valid local variable number in the current frame.
bipush
bipush takes a single parameter, and pushes the resulting int value onto the operand
stack.
iload_n
iload_n represents the series of opcodes iload_0, iload_1, iload_2, and iload_3 that
retrieve a single precision float in local variables 0, 1, 2 or 3 and push it onto the stack.
iadd
Pops two integers from the operand stack, adds them, and pushes the integer result
back onto the stack.
return
return is used to return from a method whose return type is void.
All items on the current method's operand stack are discarded. If the current method is
marked as synchronized, then an implicit monitorexit instruction is executed. Then the
current method's frame is discarded, the invoker's frame is reinstated, and control
returns to the invoker.
Local Variables Section
ref hidden this
int a
int b
int c
0
1
2
3
5
6
5
6
int형 값으로 더한 후 그 결과를 Operand Stack에 PUSH
11
74.
74
Stack Frame 메소드수행 시뮬레이션 (8/10)
Runtime Data Area
public void testMethod() {
int a, b, c;
a = 5;
b = 6;
c = a + b;
}
0: iconst_5
1: istore_1
2: bipush 6
4: istore_2
5: iload_1
6: iload_2
7:
iadd
8: istore_3
9: return
store
load
Local Variable Section 3번 인덱스에 11을 저장
Operand Stack
PUSH
PUSH
POP
POP
명령 설명
iconst_n
iconst_n represents the series of opcodes iconst_0, iconst_1, iconst_2, iconst_3, iconst_4
and iconst_5.
These are used to push the constant ints 0 through 5 onto the stack.
istore_n
Pops an int off the stack and stores it in local variable n, where n is 0, 1, 2 or 3.
n must be a valid local variable number in the current frame.
bipush
bipush takes a single parameter, and pushes the resulting int value onto the operand
stack.
iload_n
iload_n represents the series of opcodes iload_0, iload_1, iload_2, and iload_3 that
retrieve a single precision float in local variables 0, 1, 2 or 3 and push it onto the stack.
iadd
Pops two integers from the operand stack, adds them, and pushes the integer result
back onto the stack.
return
return is used to return from a method whose return type is void.
All items on the current method's operand stack are discarded. If the current method is
marked as synchronized, then an implicit monitorexit instruction is executed. Then the
current method's frame is discarded, the invoker's frame is reinstated, and control
returns to the invoker.
Local Variables Section
ref hidden this
int a
int b
int c
0
1
2
3
5
6
11
75.
75
Stack Frame 메소드수행 시뮬레이션 (9/10)
Runtime Data Area
public void testMethod() {
int a, b, c;
a = 5;
b = 6;
c = a + b;
}
0: iconst_5
1: istore_1
2: bipush 6
4: istore_2
5: iload_1
6: iload_2
7:
iadd
8: istore_3
9: return
store
load
method의 수행을 마치고 Stack Frame을 삭제
PUSH
PUSH
POP
POP
Operand Stack
명령 설명
iconst_n
iconst_n represents the series of opcodes iconst_0, iconst_1, iconst_2, iconst_3, iconst_4
and iconst_5.
These are used to push the constant ints 0 through 5 onto the stack.
istore_n
Pops an int off the stack and stores it in local variable n, where n is 0, 1, 2 or 3.
n must be a valid local variable number in the current frame.
bipush
bipush takes a single parameter, and pushes the resulting int value onto the operand
stack.
iload_n
iload_n represents the series of opcodes iload_0, iload_1, iload_2, and iload_3 that
retrieve a single precision float in local variables 0, 1, 2 or 3 and push it onto the stack.
iadd
Pops two integers from the operand stack, adds them, and pushes the integer result
back onto the stack.
return
return is used to return from a method whose return type is void.
All items on the current method's operand stack are discarded. If the current method is
marked as synchronized, then an implicit monitorexit instruction is executed. Then the
current method's frame is discarded, the invoker's frame is reinstated, and control
returns to the invoker.
Local Variables Section
ref hidden this
int a
int b
int c
0
1
2
3
5
6
11
76.
76
Stack Frame 메소드수행 시뮬레이션 (10/10)
Runtime Data Area
class OperandStack{
public void testMethod() {
int a, b, c;
a = 5;
b = 6;
c = a + b;
}
}
public void operandStack();
Code:
0: iconst_5
1: istore_1
2: bipush 6
4: istore_2
5: iload_1
6: iload_2
7: iadd
8: istore_3
9: return
javap –c OperandStack
javap –c OperandStack
Operand
Stack
Local
Variable
Section
int c 3
int b 2
int a 1
hidden this 0
ref ref
5
ref
5
ref
5
6
ref
5
6
ref
5
6
5
ref
5
6
6
5
ref
5
6
13
ref
5
6
13
ref
iconst_5 istore_1 bipush 6 istore_2 iload_1 iload_2 istore_3
iadd return
Local
Variables
Section
Operand
Stack
load
store
PUSH
PUSH
POP
POP
77.
77
Stack Frame -Frame Data (1/3)
Constant Pool Resolution
Constant Pool의 Entry를 참조하기 위한 정보
Symbolic Reference Dynamic Reference로 변환하는 과정
java의 모든 reference는 Symbolic Reference이기 때문에 Resolution이 필요함.
Normal Method Return
Method를 호출한 stack frame으로 되돌아 가기 위해 pc register에 이
instruction의 pointer를 보관
반환 값이 있다면 다음 번 Current Frame(자신을 호출한 메소드의 Stack Frame
의 Operand Stack에 반환 값을 PUSH
Exception Dispatch
Exception이 발생하면 이를 핸들링하기 위해 Frame Data를 통해 Exception
Table을 참조
Frame Data에서 관리하는 Exception정보는 Exception Table에 대한 Reference
Exception이 발생하면 Exception Table을 참조하여 catch절에 해당하는 Bytecode
로 점프
Runtime Data Area
Stack Frame
Stack Frame
Stack Frame
Stack Frame
Stack Frame
Stack Frame
Stack Frame
Stack Frame
Stack Frame
Stack Frame
Stack Frame
Stack Frame
Stack Frame
Stack Frame
Thread
Thread
JvM
Stack
Local Variable
Section
Operand Stack
Frame Data
78.
78
Stack Frame -Frame Data (2/3)
Constant Pool Resolution
Runtime Data Area
Constant Pool Resolution
Symbolic Reference Dynamic Reference 변환하는 과정
Symbolic Reference는 Method Area의
Constant Pool에 저장되어 있음
Constant Pool Resolution 결과 = Constant Pool Pointer
변수나 상수에 접근할 때
다른 Class를 참조할 때
Method를 수행할 때
특정 object가 특정 Class나 Interface에
의존관계가 있는지 확인할 때
Constant Pool Resolution 수행
79.
79
Stack Frame -Frame Data (3/3)
Exception Dispatch
Runtime Data Area
class JvmInternal2 {
public void operandStack() {
int a, b, c;
a = 5;
b = 6;
try {
c = a + b;
} catch (NullPointerException e){
c = 0;
}
}
}
public void operandStack();
Code:
0: iconst_5
1: istore_1
2: bipush 6
4: istore_2
5: iload_1
6: iload_2
7: iadd
8: istore_3
9: goto 16
12: astore 4
14: iconst_0
15: istore_3
16: return
Exception table:
from to target type
5 9 12 Class java/lang/NullPointerException
javap –c JvmInternal2
javap –c JvmInternal2
from
try 블록이 시작되는
bytecode의 entry number
to
try 블록이 끝나는
bytecode의 entry number
target
exception이 발생했을때 점
프해야할 entry number
type 정의한 exception
예외처리 절차
① try 블럭내에서 예외 발생 또는 throw
② exception 오브젝트의 type의 Class정보와 비교
③ Class정보와 일치하면 target으로 점프
④ Class정보와 일치하지 않으면, JVM은 Current Frame을
종료하고 이 메소드를 호출한 메소드의 Stack Frame에
이 exception을 다시 던져 처리를 반복
80.
80
Native Method Stack
Java Native Interface
Java는 JNI를 통해 native function을 호출하고 결과값을 받아 올 수 있다.
JVM은 native method를 위해 Native Method Stacks 메모리 공간을 마련하였다.
① 어플리케이션에서 native method를 수행
② Native Method Stacks에 새로운 Stack Frame을 생성하여 PUSH하고 native function을 수행
③ native method 수행이 끝나면, native method 를 수행한 java stack frame으로 돌아가는 것이 아니라 새로운 Stack Frame을 생성하여 다시 작업을 수행하게
된다.
Runtime Data Area
Java Stacks
Stack Frame
Stack Frame
Stack Frame
Stack Frame
Stack Frame
Stack Frame
Java Method 1
Java Method 2
Native Method 1
Native
Method
Stack
Native Function Call
81.
81
참고) Java NativeInterface
JAVA 8 JNI Spec
https://docs.oracle.com/javase/8/docs/technotes/guides/jni/spec/jniTOC.html
자바와 자바 이외의 언어로 만들어진 애플리케이션이나 라이브러리가 상호 작용할 수 있도록 연결시켜 주는 인터페이스
Runtime Data Area
왜 JNI를 사용하는가?
JVM에서 지원되지 않은 특정 운영체제 서비스를 이용하고 싶을 때
자바의 클래스 라이브러리는 방대하고 다양한 서비스를 제공하지만, 특정 플랫폼
에서 제공하는 고유의 서비스의 기능을 모두 포함할 수는 없다. 특히, 특수한 목적
으로 제작된 하드웨어를 자바에서 제어해야 할 필요가 있다고 한다면, 자바만으로
해결하기는 힘들다.
Native Code(플랫폼에 종속적인 기계어 코드)로 개발된 함수를 이용하고 싶을 때
부하테스트 수행 시 3rd party가 개발한 보안 모듈 호출
자바에서 하드웨어 제어를 하고 싶을 때
기존의 프로그램(C/C++)에서 자바가 제공하는 서비스를 이용하고 싶을 때
기존에 작성된 프로그램이나 기존의 시스템(legacy)과의 연계 문제
82.
82
LAB) JNI를 이용한Native Method 호출 (1/5)
구현 순서
Runtime Data Area
순서 작업 산출물
1 native method 프로토타입이 정의된 자바 소스 작성 HelloNative.java
2 자바 소스 컴파일 HelloNative.class
3 JNI-style header 파일 생성 HelloNative.h
4 native method를 구현한 C 소스파일 작성 HelloNative.c
5 C 소스파일을 compile하여 Native Library 생성 libHelloNative.so
6 HelloNative 자바 프로그램 실행
83.
83
LAB) JNI를 이용한Native Method 호출 (2/5)
① native method 프로토타입이 정의된 자바 소스 작성
Runtime Data Area
native method 프로토타입이 정의된 자바 소스 작성
[root@jvmedu ~]# cd ~/lab/jni/ex01
[root@jvmedu ex01]# cat HelloNative.java
public class HelloNative {
private native void nativeMethod(int sleepSec); 함수 원형 정의
static {
System.loadLibrary(HelloNative);
}
nativeMethod() 가 구현된 라이브러리 로드
private void javaMethod(int sleepSec) {
System.out.println(javaMethod Called....);
this.nativeMethod(sleepSec);
}
네이티브 메소드 호출
public static void main(String[] args) throws Exception {
int sleepSec = Integer.parseInt(args[0]);
new HelloNative().javaMethod(sleepSec);
}
}
자바 메소드 호출
② 자바 소스 컴파일
HelloNative.java 파일을 컴파일하여 HelloNative.class 파일 생성
[root@jvmedu ex01]# javac HelloNative.java
[root@jvmedu ex01]# ls -l HelloNative.class
-rw-r--r-- 1 root root 781 Oct 20 23:21 HelloNative.class
84.
84
LAB) JNI를 이용한Native Method 호출 (3/5)
③ JNI-style header 파일 생성
Runtime Data Area
javah 명령으로 이용하여 HelloNative.class에 정의된 native method에 대해 JNI-style의 헤더 파일 생성
[root@jvmedu ex01]# javah HelloNative
생성된 헤더 파일의 내용 확인
[root@jvmedu ex01]# cat HelloNative.h
/* DO NOT EDIT THIS FILE - it is machine generated */
#include jni.h
/* Header for class HelloNative */
#ifndef _Included_HelloNative
#define _Included_HelloNative
#ifdef __cplusplus
extern C {
#endif
/*
* Class: HelloNative
* Method: nativeMethod
* Signature: (I)V
*/
JNIEXPORT void JNICALL Java_HelloNative_nativeMethod
(JNIEnv *, jobject, jint);
nativeMethod() 함수 원형
#ifdef __cplusplus
}
#endif
#endif
85.
85
LAB) JNI를 이용한Native Method 호출 (4/5)
④ native method를 구현한 C 소스파일 작성
Runtime Data Area
native method를 구현한 C 소스파일 작성
[root@jvmedu ex01]# vi HelloNative.c
HelloNative.c
#include jni.h
#include stdio.h
#include HelloNative.h
JNIEXPORT void JNICALL Java_HelloNative_nativeMethod(JNIEnv *env, jobject obj, jint sleepSec) {
printf(NativeMethod Called.....!n);
sleep(sleepSec);
return;
}
⑤ C 소스파일을 compile하여 Native Library 생성
gcc 컴파일러를 이용하여 HelloNative.c 를 compile하여 libHelloNative.so 공유 라이브러리 생성
[root@jvmedu ex01]# gcc HelloNative.c -o libHelloNative.so -shared -I${JAVA_HOME}/include -I${JAVA_HOME}/include/linux -fPIC
[root@jvmedu ex01]# file libHelloNative.so
libHelloNative.so: ELF 64-bit LSB shared object, x86-64, version 1 (SYSV), dynamically linked,
BuildID[sha1]=44fd5c90604df6023335a2211b4c39dd3fa797b3, not stripped
86.
86
LAB) JNI를 이용한Native Method 호출 (5/5)
⑥ HelloNative 자바 프로그램 실행하고 visualvm으로 Thread Dump 생성 후 Native Stack 확인
Runtime Data Area
-Djava.library.path 옵션을 이용하여 HelloNative 자바 프로그램 실행
[root@jvmedu ex01]# java -Djava.library.path=. HelloNative 1000
javaMethod Called....
NativeMethod Called.....!
visualvm으로 Thread Dump 를 생성하고 main thread의 Stack Trace를 확인
Top Stack
-Djava.library.path 와 LD_LIBRARY_PATH 환경변수
native library를 찾을 위치 지정
java.lang.Thread.State: RUNNABLE
at java.net.SocketInputStream.socketRead0(Native Method)
at java.net.SocketInputStream.read(SocketInputStream.java:152)
at java.net.SocketInputStream.read(SocketInputStream.java:122)
at java.io.BufferedInputStream.fill(BufferedInputStream.java:235)
at java.io.BufferedInputStream.read(BufferedInputStream.java:254)
- locked 0x00000000fd47b808 (a java.io.BufferedInputStream)
at java.io.FilterInputStream.read(FilterInputStream.java:83)
87.
87
Name 설명 비고
YoungGeneration
object가 생성되면 이 영역에 저장되었다가 시간이 지남에 따라
해제되지 않는 object들은 Old Generation으로 옮겨짐
Minor GC
Eden new 메소드로 object를 생성했을 때 가장 먼저 저장되는 영역
Survivor Alive객체를 저장하기 위한 영역 저장되는 영역
Old Generation Young 영역에서 저장되었던 객체 중에 오래된 객체가 이동되어서 저장되는 영역 Major GC
Permanent Generation
(Metaspace)
Class 메타정보, 메소드 실행 코드, Constant Pool등이 저장되는 영역
JVM Memory Layout
Runtime Data Area
Heap Space Method Area Native Area
Young Generation Old Generation Permanent Generation
(Metaspace - Java 8)
Code Cache
Eden
Survivor
Virtual
Tenured
Virtual
Rntime Constant Pool
Virtual
Thread 1..n
Compile
Native
Virtual
From To
Field Method Data
PC
Stack
Native
Stack
Code
-Xmn(Young Generation Size)
-Xms(Initial Heap Size)
-Xmx(Maximum Heap Size)
-XX:PermSize=n
88.
88
LAB) Native OutOf Memory (1/3)
LAB 개요
C언어로 개발한 Native Method에서 Native Heap에 1mbyte의 메모리를 사용하고 해제(free)하지 않을때 물리메모리를 100% 사용하고 SWAP
메모리도 100%를 다 소진하면 OS에 의해 Java 프로세스가 kill 되는 현상 관찰
Runtime Data Area
NativePmOom.jsp
%@ page language=java contentType=text/html; charset=UTF-8
pageEncoding=UTF-8%
%@ page import=com.jadecross.troubleshoot.oom.nativee.NativeLeak%
물리메모리 부족 데모 - 1회 호출시마다 1m 물리메모리 소진
%
NativeLeak.allocatePhysicalMemory();
%
NativeLeak.java
package com.jadecross.troubleshoot.oom.nativee;
public class NativeLeak {
public static native void allocatePhysicalMemory();
static {
System.loadLibrary(NativeLeak);
}
}
NativeLeak.c
#include jni.h
#include stdio.h
#include stdlib.h
#include memory.h
#include com_jadecross_troubleshoot_oom_nativee_NativeLeak.h
JNIEXPORT void JNICALL
Java_com_jadecross_troubleshoot_oom_nativee_NativeLeak_allocatePhysicalMemory(JNIEnv *env,
jclass classObj)
{
//printf(Allocated 1 mega bytesn);
int i = 0;
for (i; i1000; i++) {
char* bytes = (char*) malloc(1024);
strcpy(bytes,
000000000000000000000000000000000000000000000000000000000000000000000000000000000000000000000000000000000000000000000000000000
0000000000000000000000000000000000000000000000000000000000000000000000000000000000000000000000000000000000000000000000000000000
0000000000000000000000000000000000000000000000000000000000000000000000000000000000000000000000000000000000000000000000000000000
0000000000000000000000000000000000000000000000000000000000000000000000000000000000000000000000000000000000000000000000000000000
0000000000000000000000000000000000000000000000000000000000000000000000000000000000000000000000000000000000000000000000000000000
0000000000000000000000000000000000000000000000000000000000000000000000000000000000000000000000000000000000000000000000000000000
0000000000000000000000000000000000000000000000000000000000000000000000000000000000000000000000000000000000000000000000000000000
0000000000000000000000000000000000000000000000000000000000000000000000000000000000000000000000000000000000000000000000000000000
000000000);
}
//printf(t-- Used 1 mega bytesn);
return;
}
89.
89
LAB) Native OutOf Memory (2/3)
Runtime Data Area
① STS 실행후 Tomcat v8.5 서버 실행
[root@jvmedu ~]# sts
② visualvm을 실행하고 visualgc 플러그인 설치
Applications 뷰에서 Local Tomcat 더블 클릭 Visual GC 탭 클릭
[root@jvmedu ~]# visualvm
③ “System Monitor”를 실행하고 Resources 탭을 클릭하여 메모리 상황 관찰
[root@jvmedu ~]# gnome-system-monitor
90.
90
LAB) Native OutOf Memory (3/3)
Runtime Data Area
④ jadeedu_jvmswjava_toolapache-jmeter-5.4.1bin 폴더 하위의 jmeter.bat 파일 실행
⑤ 부하스크립트 파일 오픈 후 “UTG02_NatviePmOom” Thread Group을 Enable한 후 부하를 발생
시키고 메모리 관찰
스크립트 파일 : jadeedu_jvmswjava_toolapache-jmeter-5.4.1jmxJvmTroubleshoot.jmx
Enable Thread Group : UTG02_NatviePmOom
부하 발생
8080
192.168.56.96
91.
91
Method Area
Class
Data
Class
Data
Class
Data
Class
Data
Class
Data
Class
Data
Class
Data
Class
Data
Method Area
ClassLoader에 의해 Load된 모든 Type의 메타 정보를 저장하는 메모리 공간
Class file에서 type에 관한 메타 정보를 추출하여 Method Area에 저장
Bytecode, 모든 변수, 상수, Reference, Method Data
Class variable, Class method
생성자 정보
JVM이 시작할 때 생성된 GC의 대상
모든 Thread들에 공유
Class file에서 type에 관한 메타 정보를 추출하여 Method Area에 저장
ClassLoader에게 넘겨 받은 Class File 에서 Type 관련 정보를 추출하여 저장
Method Area의 구현은 Vendor의 재량
Hotspot JVM
– JDK7 까지는 Permanent Area로 명명하여 Generation Heap의 한 영역으로 포함
– JDK8 이상에서는 MetaSpace로 명명되었고 Native Memory 사용
IBM에서는 Heap내에 별도의 구분 없이 Class Object 형태로 저장
Runtime Data Area
Thread
Thread Thread
Thread
Thread
Thread
92.
92
LAB) Bytecode 관찰
Bytecode viewer 설치
C:jadeedu_jvmswjava_toolbytecode_viewerjclasslib_win64_5_5.exe
Bytecode viewer 실행 후 Product.class 파일 열기
Product.class 파일 위치 : C:jadeedu_jvmswlabbytecodeProduct.class
Runtime Data Area
Product.java
package org.mybatis.jpetstore.domain;
import java.io.Serializable;
public class Product implements Serializable {
private static final long serialVersionUID = -7492639752670189553L;
private String productId;
private String categoryId;
private String name;
private String description;
public String getProductId() { return productId; }
public void setProductId(String productId) { this.productId = productId.trim(); }
public String getCategoryId() { return categoryId; }
public void setCategoryId(String categoryId) { this.categoryId = categoryId; }
public String getName() { return name; }
public void setName(String name) { this.name = name; }
public String getDescription() { return description; }
public void setDescription(String description) { this.description = description; }
@Override
public String toString() { return getName(); }
}
93.
93
Class metadata inMethod Area (1/7)
Type Information
Type의 전체 이름
package.class 형태 : Fully Qualified Name
Type의 직계 Superclass의 전체이름
Type이 Interface이거나 java.lang.Object Class이거나 SuperClass가 없으면 제외
Type이 Class인지 Interface인지의 여부
Type의 modifier (public, abstract, final)
Interface의 경우 직접 Link되고 있는 객체의 리스트 (참조 순서대로)
Runtime Data Area
Class metadata
in
Method Area
Type Information
Constant Pool
Field Information
Method Information
Class Variables
Reference to class ‘ClassLoader'
Reference to Class class
94.
94
Class metadata inMethod Area (2/7)
Constant Pool
Constant Pool은 Type에서 사용된 Constant의 Ordered Set임
Literal Constant, Type, Field, Method로의 Symbolic Reference가
포함됨
Constant Pool의 Entry는 Array처럼 index로 접근
Type에서 사용되는 모든 Type, Method, Field로의 Symbolic
Reference는 Dynamic Linking의 핵심 요소임
Runtime Data Area
Class metadata
in
Method Area
Type Information
Constant Pool
Field Information
Method Information
Class Variables
Reference to class ‘ClassLoader'
Reference to Class class
95.
95
Class metadata inMethod Area (3/7)
Field Information
Type에서 선언된 모든 Field의 정보가 순서대로 저장되는 장소
Field 이름
Member Variable, Class Variable 을 의미
Field의 Data Type, 선언된 순서
Field Modifier
public, private, protected, static, final, volatile, transient
Runtime Data Area
Class metadata
in
Method Area
Type Information
Constant Pool
Field Information
Method Information
Class Variables
Reference to class ‘ClassLoader'
Reference to Class class
참고) Field와 Variable
Java 에는 4가지 종류의 변수가 있는데, 그것은 각각 Instance Variable, Class Variable, Local Variable, Parameter이다.
이중 Field라 함은 Instance Variable과 Class Variable을 의미한다.
이들은 각각 non-static field, static field로 표현되기도 한다.
그리고 나머지 Local Variable과 Parameter Variable은 각각 Method에 속하는 것으로 Field와 이들을 포함하여 Variable이라고 한다.
96.
96
Class metadata inMethod Area (4/7)
Method Information
Method 이름
Method의 Return Type (or void)
Method Parameter수와 Data Type (순서대로)
Method Modifier
public, private, protected, static, final, syncronized, native, abstract
Runtime Data Area
Class metadata
in
Method Area
Type Information
Constant Pool
Field Information
Method Information
Class Variables
Reference to class ‘ClassLoader'
Reference to Class class
native 또는 abstract 메소드가 아니라면 다음
의 정보가 추가됨
Method의 ByteCode
Method Stack Frame의 Operand Stack 및 Local
variable Section의 크기
Exception Table
97.
97
Class metadata inMethod Area (5/7)
Class Variables
Class 변수 = Static 변수
모든 instance에 공유되며 Instance가 없어도 접근이 가능
이 변수는 Instance의 것이 아니라 Class에 속함
Class를 사용하기 이전에 이 변수들은 미리 메모리를 할당 받아 놓아야 함
final로 선언할 경우에는 이를 변수로 취급하는 것이 아니라 상수로 취급하여
Constant Pool의 Literal Constant로 저장된다.
Runtime Data Area
Class metadata
in
Method Area
Type Information
Constant Pool
Field Information
Method Information
Class Variables
Reference to class ‘ClassLoader'
Reference to Class class
Class
Instance
Instance
Instance
Instance
Class Variable
98.
98
Class metadata inMethod Area (6/7)
Reference to class ‘ClassLoader’
하나의 Type이 다른 Type을 참조할 때 JVM은 같은 ClassLoader를 사용
이런 이유로 Type의 Classloader정보가 필요
User-Defined Classloader인 경우만 reference를 저장
Bootstrap Classloader의 경우는 null
JVM이 Dynamic Linking시 이 정보를 이용하여 참조하는 Class를 같은
Classloader를 통해 Load
ClassLoader 종류
Bootstrap ClassLoader
User-defined ClassLoader
Runtime Data Area
Class metadata
in
Method Area
Type Information
Constant Pool
Field Information
Method Information
Class Variables
Reference to class ‘ClassLoader’
Reference to Class class
Reference ClassLoader class
99.
99
Class metadata inMethod Area (7/7)
Reference to Class class
각 Data Type이 load될 때 마다 java.lang.class의 instance가 하나씩 생성
getClass(), forClass(), isInterface() 등의 Method를 호출할 때 이 Reference를
통해 값을 반환
Runtime Data Area
Class metadata
in
Method Area
Type Information
Constant Pool
Field Information
Method Information
Class Variables
Reference to class ‘ClassLoader’
Reference to Class class
Reference java.lang.Class class
101
① STS 실행후Tomcat v7.0 서버 실행
[root@jvmedu ~]# sts
② visualvm을 실행하고 visualgc 플러그인 설치
Applications 뷰에서 Local Tomcat 더블 클릭 Visual GC 탭 클릭
[root@jvmedu ~]# visualvm
③ “System Monitor”를 실행하고 Resources 탭을 클릭하여 메모리 상황 관찰
[root@jvmedu ~]# gnome-system-monitor
LAB) Method Area Out Of Memory (2/6)
Runtime Data Area
Permgen
102.
102
LAB) Method AreaOut Of Memory (3/6)
Runtime Data Area
④ jadeedu_jvmswjava_toolapache-jmeter-5.4.1bin 폴더 하위의 jmeter.bat 파일 실행
⑤ 부하스크립트 파일 오픈 후 “UTG04_Permgen(Metaspace) OOM” Thread Group을 Enable한 후 부하를 발생시키고 메모리 관찰
스크립트 파일 : jadeedu_jvmswjava_toolapache-jmeter-5.4.1jmxJvmTroubleshoot.jmx
Enable Thread Group : UTG04_Permgen(Metaspace) OOM
부하 발생
7080
192.168.56.96
104
Java 7 Java8
LAB) Method Area Out Of Memory (5/6)
Java8 Metaspace
Java7의 Permgen 영역은 Native memory 영역으로 이동하여 Metaspace영역으로 명명되었으며, 다만 static object는 Heap영역으로 옮겨
져서 GC의 대상이 최대한 될 수 있도록 하였다.
Runtime Data Area
https://blog.voidmainvoid.net/210
상기 Java 8의 memory 구조를 보면 알 수 있듯이 Metaspace가
Native Memory를 이용함으로써 java application이 필요한 만큼
계속해서 늘어나는 특징이 있다. 상기 옵션을 통해 알 수 있듯이,
Java 8의 MaxMetaspaceSize는
18,446,744,073,709,547,520Byte(약 16ExaByte, 64bit 프로세서
최고 메모리 상한치)라는 것을 알 수 있다.
그러므로, Java 8의 -XX:MaxMetaspaceSize를 두지 않는 이상,
Native memory 자원을 최대한 사용한다.
Metaspace 옵션 설정
-XX:MetaspaceSize=512m -XX:MaxMetaspaceSize=512m
106
Java Heap
Heap
Instance나 Array가 저장되는 공간으로 모든 Thread들에 공유
JVM은 Heap에 메모리를 할당하는 instruction만 존재
new, newarray, anewarray, multianewarray
메모리 해제를 위한 명시적인 java code나 byte code도 없으며, 메모리의 해제는 Garbage Collection를 통해 수행됨
Java Heap의 구현은 Vendor의 재량
각 JVM Vendor마다 Heap의 구조 및 Garbage Collection, Garbage Collector의 구현이 다름
참고) new Bytecode
Runtime Data Area
JVM
Java Heap
Object
Instance
Data
Class
Pointer
Array
Thread
Thread Thread
Thread
Thread
Thread
new : create an object
Description
new is used to create object instances.
new takes a single parameter, class, the name of the class of object you want to
create. class is resolved into a Java class (see Chapter 7 for a discussion of how
classes are resolved). Then new determines the size in bytes of instances of the given
class and allocates memory for the new instance from the garbage collected heap. The
fields of the instance are set to the initial value 0 (for numeric and boolean fields),
or null (for reference fields). Next, a reference to the new object is pushed onto the
operand stack.
Note that the new object is initialize uninitialized - before the new object can be used,
one of its init methods must be called using invokespecial, as shown in the example
below.
Exceptions
• OutOfMemoryError - not enough memory to allocate a new instance
• InstantiationError - The class named by type is an abstract class or an interface
Share
107.
107
Heap Space MethodArea Native Area
Young Generation Old Generation Permanent Generation
(Metaspace - Java 8)
Code Cache
Eden
Survivor
Virtual
Tenured
Virtual
Rntime Constant Pool
Virtual
Thread 1..n
Compile
Native
Virtual
From To
Field Method Data
PC
Stack
Native
Stack
Code
-Xmn(Young Generation Size)
-Xms(Initial Heap Size)
-Xmx(Maximum Heap Size)
-XX:PermSize=n
JVM의 Memory - Heap
Generational Heap
Runtime Data Area
Name 설명 비고
Young Generation
object가 생성되면 이 영역에 저장되었다가 시간이 지남에 따라
해제되지 않는 object들은 Old Generation으로 옮겨짐
Minor GC
Eden new 메소드로 object를 생성했을 때 가장 먼저 저장되는 영역
Survivor Alive객체를 저장하기 위한 영역 저장되는 영역
Old Generation Young 영역에서 저장되었던 객체 중에 오래된 객체가 이동되어서 저장되는 영역 Major GC
Permanent Generation
(Metaspace)
Class 메타정보, 메소드 실행 코드, Constant Pool등이 저장되는 영역
108.
108
LAB) 디폴트 힙사이즈 확인
Java5부터 자동으로 Garbage Collector, Heap Size등을 자동으로 선택
Hardware Resource와 OS정보가 기준
Sever Class와 Client Class의 구분
-XX:+PrintCommandLineFlags
This option prints all command-line flags to the VM
Runtime Data Area
Version 디폴트 Command Line Flags
JAVA 7
[root@jvmedu ~]# /opt/java/jdk7/bin/java -XX:+PrintCommandLineFlags -version
-XX:InitialHeapSize=64717248 -XX:MaxHeapSize=1035475968 -XX:+PrintCommandLineFlags -XX:+UseCompressedOops -
XX:+UseParallelGC
java version 1.7.0_80
Java(TM) SE Runtime Environment (build 1.7.0_80-b15)
Java HotSpot(TM) 64-Bit Server VM (build 24.80-b11, mixed mode)
JAVA 8
[root@jvmedu ~]# /opt/java/jdk8/bin/java -XX:+PrintCommandLineFlags -version
-XX:InitialHeapSize=64717248 -XX:MaxHeapSize=1035475968 -XX:+PrintCommandLineFlags -XX:+UseCompressedClassPointers
-XX:+UseCompressedOops -XX:+UseParallelGC
openjdk version 1.8.0_302
OpenJDK Runtime Environment (Temurin)(build 1.8.0_302-b08)
OpenJDK 64-Bit Server VM (Temurin)(build 25.302-b08, mixed mode)
110
① STS 실행후Tomcat v8.5 서버 실행
[root@jvmedu ~]# sts
② visualvm을 실행하고 visualgc 플러그인 설치
Tools Plugins Available Plugins Visual GC Install
[root@jvmedu ~]# visualvm
LAB) visualvm을 이용한 JVM 메모리 이해 (1/2)
visualgc 플러그인
Runtime Data Area
③ Applications 뷰에서 Local Tomcat 더블 클릭 Visual GC 탭 클릭
111.
111
④ jadeedu_jvmswjava_toolapache-jmeter-5.4.1bin 폴더하위의 jmeter.bat 파일 실행
⑤ 부하스크립트 파일 오픈 후 “START”버튼을 클릭하여 부하를 발생시키고 visualvm에서 JVM
메모리 변화를 관찰
스크립트 파일 : jadeedu_jvmswjava_toolapache-jmeter-5.4.1jmxjpetstore.jmx
LAB) visualvm을 이용한 JVM 메모리 이해 (2/2)
JVM 메모리 관찰
Runtime Data Area
부하 발생
192.168.56.96
112.
112
LAB) java.lang.OutOfMemoryError: Javaheap space (1/5)
LAB) 개요
Http Request 1번마다 Member 인스턴스를 1개 생성하고 application 객체(Global 객체, 모든 Thread가 공유)의 ArrayList에 추가하여 Heap
Memory 부족해지는 것을 관찰
Runtime Data Area
HeapOom.jsp
%@ page language=java contentType=text/html; charset=UTF-8
pageEncoding=UTF-8%
%@ page import=java.util.*%
%@ page import=com.jadecross.troubleshoot.oom.heap.Member%
Heap 메모리 부족 데모
%
/*
* Http 요청 1건마다 Member객체를 ArrayList에 추가
*/
ArrayListMember members;
members = (ArrayListMember) application.getAttribute(members);
if (members == null) {
members = new ArrayListMember();
application.setAttribute(members, members);
}
members.add(new Member());
%
Member.java
public class Member implements Serializable {
public String name;
public String age;
public String sex;
public String address;
public Member() {
this.name = name_ + UUID.randomUUID().toString();
this.age = age_ + UUID.randomUUID().toString();
this.sex = sex_ + UUID.randomUUID().toString();
this.address = address_ + UUID.randomUUID().toString();
}
}
113.
113
LAB) java.lang.OutOfMemoryError: Javaheap space (2/5)
Runtime Data Area
① STS 실행후 Tomcat v7.0 서버 실행
[root@jvmedu ~]# sts
② visualvm을 실행하고 visualgc 플러그인 설치
Applications 뷰에서 Local Tomcat 더블 클릭 Visual GC 탭 클릭
[root@jvmedu ~]# visualvm
③ “System Monitor”를 실행하고 Resources 탭을 클릭하여 메모리 상황 관찰
[root@jvmedu ~]# gnome-system-monitor
Permgen
114.
114
LAB) java.lang.OutOfMemoryError: Javaheap space (3/5)
Runtime Data Area
④ jadeedu_jvmswjava_toolapache-jmeter-5.4.1bin 폴더 하위의 jmeter.bat 파일 실행
⑤ 부하스크립트 파일 오픈 후 “UTG05_Heap OOM” Thread Group을 Enable한 후 부하를 발생시키고 Heap 메모리 관찰
스크립트 파일 : jadeedu_jvmswjava_toolapache-jmeter-5.4.1jmxJvmTroubleshoot.jmx
Enable Thread Group : UTG05_Heap OOM
부하 발생
7080
192.168.56.96
117
Out Of Memory
RuntimeData Area
NO OOM Error Frequency Cause Solution
1 Java heap space ★★★★★
Object could not be allocated in the Java heap
Increase in Traffic volume
Application is unintentionally holding references to objects which prevents the
objects from being garbage collected
Application makes excessive use of finalizers. Finalizer objects aren't GCed
immediately. Finalizers are executed by a daemon thread that services the
finalization queue. Sometimes finalizer thread cannot keep up, with the
finalization queue.
Increase Heap size '-Xmx'
Fix memory leak in the application
2 GC overhead limit exceeded ★★★★★
Java process is spending more than 98% of its time doing garbage collection and
recovering less than 2% of the heap and has been doing so far the last 5
(compile time constant) consecutive garbage collections
Increase heap size '-Xmx'
GC Overhead limit exceeded can be turned off with '-XX:-
UseGCOverheadLimit'
Fix the memory leak in the application
3 Permgen space ★★★
Permgen space contains:
① Names, Fields, methods of the classes
② Object arrays and type arrays associated with a class
③ Just In Time compiler optimizations When this space runs out of space this
error is thrown
Increase Permgen size '-XX:MaxPermSize'
Application redeployment without restarting can cause this
issues. So restart JVM.
4 Metaspace ★★★
From Java 8 Permgen replaced by Metaspace. Class metadata is allocated in
native memory (referred as metaspace). If metaspace is exhausted then this error
is thrown
If '-XX:MaxMetaSpaceSize', has been set on the command-line,
increase its value.
Remove '-XX:MaxMetsSpaceSize'
Reducing the size of the Java heap will make more space
available for MetaSpace.
Allocate more memory to the server
Could be bug in application. Fix it.
5 Unable to create new native thread ★★★★★
There isn't sufficient memory to create new threads. Threads are created in
native memory.
Allocate more memory to the machine
Reduce Java Heap Space
Fix thread leak in the application.
Increase the limits at the OS level.
ulimit -a
max user processes (-u) 1800
Reduce thread stack size with -Xss parameter
6 Requested array size exceeds VM limit ★★
Application attempted to allocate an array that is larger than the heap size Increase heap size '-Xmx'
Fix bug in application. code attempting to create a huge array
7 Kill process or sacrifice child(1) ★
Kernel Job – Out of Memory Killer. Will kill processes under extremely low
memory conditions
Migrate process to different machine.
Add more memory to machine
8 reason stack_trace_with_native_method ★
Native method encountered allocation failure
a stack trace is printed in which the top frame is a native method
Use OS native utilities to diagnose
(1) Unlike all other OOM errors, this is not triggered by JVM. But by OS.
https://tier1app.files.wordpress.com/2014/12/outofmemoryerror2.pdf
118.
118
Hotspot JVM의 ObjectLayout (1/2)
모든 Object는 Mark Word, Class Address의 2개의 Header를 가짐
Array의 경우 Size를 표현하는 Header가 한 개 더!
각 Header는 1 Word의 크기
32bit OS = 4 byte
64bit OS = 8 byte
Runtime Data Area
Mark
Word
Mark
Word
Class
Address
Class
Address
Array
Size
Array
Size
Array Data
Mark
Word
Mark
Word
Class
Address
Class
Address
Object Data
Mark
Word
Class
Address
Object Data
119.
119
Hotspot JVM의 ObjectLayout (2/2)
Mark Word
Garbage Collection과 Synchronization 작업에 사용
Runtime Data Area
Mark
Word
Class
Address
Object Data
31 9 8 2 1 0
Hash Code (Biased bit가 0일때)
Thread ID (Biased bit가 1일때)
Age
Biased
Tag
Hash Code 저장값
0 0 0 Light-weight Locked Lock Record Address
0 0 1 Unlocked
0 1 0 Heavy-weight Locked Monitor Address
0 1 1 Marked for GC Forwarding Address
1 - - Biased/Biasable
Thread ID
Based bit가 1일때 Biased Lock을 획득한 Thread ID를 기록
Hash Code
Biased bit가 0이고, 이전 Synchronization 작업 때 산출된 Hash Code가 있다면 Tag 값
에 따라 각각 다른값이 저장됨
Young Generation의 Object가
Eden과 Survivor를 넘나든 횟수
Biased Lock
Biased bit가 1이면 Biased Lock을 사용
Synchronization 작업을 수행할 때 Lock을 획
득하기 위한 연산을 수행하지 않고 가볍게
Lock을 획득함을 의미
Synchronization을 수행 하는지에 대한 상태
값만이 존재하므로 빠른 수행이 가능
Method Area의 Class 정보를
가리키는 Reference 정보가 저장
120.
120
Java Variable의 종류
Class Variables
흔히 Static 변수라는 명칭으로도 사용이 된다. 이 Class Variable 은 이름에 걸맞게 Class 에 속해 있는 변수이다. 그렇기 때문에 이 변수는
Method Area의 Class Variable 영역에 할당 받게 된다. Method Area 가 모든 Thread에 의해 공유되기 때문에 이 변수도 모든 Thread에 의
해 공유된다.
Member Variables
Instance 변수라는 별명을 가지고 있다. Instance는 Method Area의 Class 정보를 바탕으로 Heap에 생성되는 Method Area의 구현체 정도
로 정의할 수 있다.
Class 와 Instance 의 관계를 붕어빵틀과 붕어빵으로 비유하곤 한다. 여기서 Class 는 Method Area 의 Class Meta 정보를 의미하고 Instance
는 Class Meta 정보를 바탕으로 Heap 에 생성 되는 Class 의 구현체 이다. Member Variable 은 이 Heap 에 생성 되는 Instance 에 할당되고
Method Area 의 Field Information 에 변수의 정보가 들어있다.
Parameter Variables
Method 의 인수를 의미 한다. 이것은 Method 에 속하는 정보이기 때문에 변수의 정보는 Method Area 의 Method Information 에 포함되
어 있다. 이 Parameter Variable 은 Java Virtual Machine Stacks 에 할당 받게 된다.
Local Variables
Parameter Variable 과 선언되는 곳만 차이가 날뿐, 동일한 부류이다. Parameter Variable 은 Method 를 정의 할 때 인수로 선언되지만,
Local Variable 은 Method 내에서 정의 된다. Local Variable 은 Parameter Variable 와 같이 Method Information 에 변수 정보가 위치하고
Java Virtual Machine Stacks 에 할당 받는다.
Runtime Data Area
121.
121
Java Variable의 종류별메모리 레이아웃
Runtime Data Area
public class VariableArrange {
static int ci = 3;
static String cs = Static;
int mi = 4;
String ms = Member;
void method(int pi, String ps) {
int li = 5;
String ls = Local;
}
}
// Compiled from VariableArrange.java (version 1.8 : 52.0, super bit)
public class VariableArrange {
// Field descriptor #6 I
static int ci;
// Field descriptor #8 Ljava/lang/String;
static java.lang.String cs;
// Field descriptor #6 I
int mi;
// Field descriptor #8 Ljava/lang/String;
java.lang.String ms;
// Method descriptor #12 ()V
// Stack: 1, Locals: 0
static {};
0 iconst_3
1 putstatic VariableArrange.ci : int [14]
4 ldc String Static [16]
6 putstatic VariableArrange.cs : java.lang.String [18]
9 return
Line numbers:
[pc: 0, line: 3]
[pc: 4, line: 4]
// Method descriptor #12 ()V
// Stack: 2, Locals: 1
public VariableArrange();
0 aload_0 [this]
1 invokespecial java.lang.Object() [23]
4 aload_0 [this]
5 iconst_4
6 putfield VariableArrange.mi : int [25]
9 aload_0 [this]
10 ldc String Member [27]
12 putfield VariableArrange.ms : java.lang.String [29]
15 return
Line numbers:
[pc: 0, line: 2]
[pc: 4, line: 5]
[pc: 9, line: 6]
[pc: 15, line: 2]
Local variable table:
[pc: 0, pc: 16] local: this index: 0 type: VariableArrange
// Method descriptor #34 (ILjava/lang/String;)V
// Stack: 1, Locals: 5
void method(int pi, java.lang.String ps);
0 iconst_5
1 istore_3 [li]
2 ldc String Loca1 [35]
4 astore 4 [ls]
6 return
Line numbers:
[pc: 0, line: 9]
[pc: 2, line: 10]
[pc: 6, line: 11]
Local variable table:
[pc: 0, pc: 7] local: this index: 0 type: VariableArrange
[pc: 0, pc: 7] local: pi index: 1 type: int
[pc: 0, pc: 7] local: ps index: 2 type: java.lang.String
[pc: 2, pc: 7] local: li index: 3 type: int
[pc: 6, pc: 7] local: ls index: 4 type: java.lang.String
}
Compile
ByteCode
122.
122
Runtime Data AreasSimulation (1/2)
Runtime Data Area
Java Code Byte Code
public class JvmInternal {
static int cv = 0;
final static int fcv = 100;
public static void main(String[] args) {
int a, b, c;
a = Integer.parseInt(args[0]);
b = Integer.parseInt(args[1]);
c = addTwoArgs(a, b);
}
static int addTwoArgs(int x, int y) {
cv = fcv;
return (x + y);
}
}
public class JvmInternal {
static int cv;
static final int fcv;
static {};
Code:
0: iconst_0
1: putstatic #13 // Field cv:I
4: return
public JvmInternal();
Code:
0: aload_0
1: invokespecial #18 // Method java/lang/Object.init:()V
4: return
public static void main(java.lang.String[]);
Code:
0: aload_0
1: iconst_0
2: aaload
3: invokestatic #24 // Method java/lang/Integer.parseInt:(Ljava/lang/String;)I
6: istore_1
7: aload_0
8: iconst_1
9: aaload
10: invokestatic #24 // Method java/lang/Integer.parseInt:(Ljava/lang/String;)I
13: istore_2
14: iload_1
15: iload_2
16: invokestatic #30 // Method addTwoArgs:(II)I
19: istore_3
20: return
static int addTwoArgs(int, int);
Code:
0: bipush 100
2: putstatic #13 // Field cv:I
5: iload_0
6: iload_1
7: iadd
8: ireturn
}
Presentation
https://youtu.be/1fuavjAjBo0
125
Heap Dump 분석참고 자료
https://wiki.eclipse.org/MemoryAnalyzer/Learning_Material
Eclipse Memory Analyzer Tool Video, San Diego Java User Group, Kevin Grigorenko, June 2019
Eclipse Summit Europe, Ludwigsburg, 4 November '10
TheServerSide Java Symposium - Europe, Prague, October '09
JavaOne, San Francisco, June '09
Eclipse Summit Europe Ludwigsburg, 20 November, '08
JavaOne, San Francisco, May '08
EclipseCon, March '08 (Slides)
JavaOne, San Francisco, May '07
Heap Dump 분석
126.
126
OOM 사례 #1- Heap Memory 부족
데모
웹어플리케이션 Session 객체의 ArrayList Collection 에 Request가 발생할때마다
Member객체를 추가
Heap Dump 분석
Memrory Version 에러 메세지
Heap
JAVA 8
java.lang.OutOfMemoryError: Java heap space
at java.lang.reflect.Array.newInstance(Array.java:70)
at java.util.AbstractCollection.toArray(AbstractCollection.java:176)
at org.apache.catalina.session.ManagerBase.findSessions(ManagerBase.java:807)
at org.apache.catalina.session.ManagerBase.processExpires(ManagerBase.java:655)
at org.apache.catalina.session.ManagerBase.backgroundProcess(ManagerBase.java:646)
at org.apache.catalina.core.ContainerBase.backgroundProcess(ContainerBase.java:1485)
at org.apache.catalina.core.StandardContext.backgroundProcess(StandardContext.java:6063)
JAVA 7 Exception in thread ajp-bio-8009-exec-112 java.lang.OutOfMemoryError: GC overhead limit exceeded
%@ page language=java contentType=text/html; charset=UTF-8
pageEncoding=UTF-8%
%@ page import=java.io.*%
%@ page import=java.util.*%
%@ page import=com.jadecross.perflab.oom.Member%
%
long startTime = System.currentTimeMillis();
ArrayListMember members;
Member member = new Member();
members = (ArrayListMember) request.getSession().getAttribute(members);
if (members == null) {
members = new ArrayListMember();
request.getSession().setAttribute(members, members);
}
members.add(new Member());
long executeMs = System.currentTimeMillis() - startTime;
%
%=member count= + members.size()%/br
%=WAS 처리시간 : + executeMs + ms%
OOM 발생 에러 메세지
127.
127
OOM 사례 #2- PermGen(=Metaspace) Memory 부족
데모
jsp 페이지가 호출될때마다 동적으로 jsp파일을 새로 만들고 호출
하여 로딩되는 class를 증가
Heap Dump 분석
Memrory Version 에러 메세지
PermGen
또는
Metaspace
JAVA 7 20191214 09:44:07 [A146] java.lang.OutOfMemoryError: PermGen space
JAVA 8 java.lang.OutOfMemoryError: Metaspace
%@ page language=java contentType=text/html; charset=UTF-8 pageEncoding=UTF-8%
%@ page import=java.io.*%
%@ page import=java.nio.channels.*%
%@ page import=java.util.*%
%
String contextRoot = getServletContext().getRealPath(/);
String newJspName = C_ + UUID.randomUUID().toString().replace(-, ) + .jsp;
// 01. 신규 JSP 파일 생성
fileCopy(contextRoot + 03_oom/jdbc_sample.jsp, contextRoot + 03_oom/temp_jsp/ + newJspName);
// 02. 신규 JSP 파일로 이동
request.getRequestDispatcher(temp_jsp/ + newJspName).forward(request, response);
%
%!
public void fileCopy(String orgFilePath, String newFilePath) {
File orgFile = new File(orgFilePath);
try {
FileInputStream inputStream = new FileInputStream(orgFile);
FileOutputStream outputStream = new FileOutputStream(newFilePath);
FileChannel fcin = inputStream.getChannel();
FileChannel fcout = outputStream.getChannel();
long size = fcin.size();
fcin.transferTo(0, size, fcout);
fcout.close();
fcin.close();
outputStream.close();
inputStream.close();
} catch (Exception e) {}
}%
OOM 발생 에러 메세지
128.
128
OOM 사례 #3- unable to create new native thread
리눅스OS ulimit의 nproc, nofile과 성능 연관 관계
Heap Dump 분석
Presentation
129.
129
Heap Dump 생성
Heap Dump 생성 방법
명령어 이용
jcmd
jmap
도구 이용
VisualVM
JMC (Java Mission Control)
APM 도구
– Scouter, Jennifer, Whatap,…
Heap Dump 분석
130.
130
LAB) Heap Dump생성(1/3)
LAB) 개요
HttpRequest 마다 Member 객체를 1개 생성하고 application 객체(Global 객체, 모든 Thread가 공유)의 ArrayList에 추가하여 Heap Memory 전부 소진
Heap Memory 부족시 HeapDump 자동 생성 옵션을 추가하여 Heap Dump 획득
-XX:+HeapDumpOnOutOfMemoryError -XX:HeapDumpPath=/root/heapdump
Heap Dump 분석
HeapOom.jsp
%@ page language=java contentType=text/html; charset=UTF-8
pageEncoding=UTF-8%
%@ page import=java.util.*%
%@ page import=com.jadecross.troubleshoot.oom.heap.Member%
Heap 메모리 부족 데모
%
/*
* Http 요청 1건마다 Member객체를 ArrayList에 추가
*/
ArrayListMember members;
members = (ArrayListMember) application.getAttribute(members);
if (members == null) {
members = new ArrayListMember();
application.setAttribute(members, members);
}
members.add(new Member());
%
Member.java
public class Member implements Serializable {
public String name;
public String age;
public String sex;
public String address;
public Member() {
this.name = name_ + UUID.randomUUID().toString();
this.age = age_ + UUID.randomUUID().toString();
this.sex = sex_ + UUID.randomUUID().toString();
this.address = address_ + UUID.randomUUID().toString();
}
}
절대경로 입력
(상대경로 안됨)
131.
131
① STS 실행후Tomcat v7.0 서버에 “HeapDump 자동 생성” 옵션 추가 후 서버 시작
-XX:+HeapDumpOnOutOfMemoryError -XX:HeapDumpPath=/root/heapdump
[root@jvmedu ~]# sts
② visualvm 실행
Applications 뷰에서 Local Tomcat 더블 클릭 Visual GC 탭 클릭
[root@jvmedu ~]# visualvm
LAB) Heap Dump 생성(2/3)
Heap Dump 분석
Permgen
132.
132
LAB) Heap Dump생성(3/3)
Heap Dump 분석
③ jadeedu_jvmswjava_toolapache-jmeter-5.4.1bin 폴더 하위의 jmeter.bat 파일 실행
④ 부하스크립트 파일 오픈 후 “UTG05_Heap OOM” Thread Group을 Enable하고 Heap Dump가 자동으로 생성될때까지 부하를 발생
스크립트 파일 : jadeedu_jvmswjava_toolapache-jmeter-5.4.1jmxJvmTroubleshoot.jmx
Enable Thread Group : UTG05_Heap OOM
⑤ ~/heapdump 하위에 생성도 HeapDump 파일 확인
[root@jvmedu ~]# ls -lh ~/heapdump
total 708M
-rw------- 1 root root 708M Oct 24 16:04 java_pid1518.hprof
부하 발생
133.
133
Heap Dump 개요
왜 분석하나?
메모리를 많이 사용하는 객체를 찾을때
메모리 누수를 유발시키는 특정 객체를 찾을때
GC되어 메모리에서 사라져야할 객체(A객체)가 사용되지도 않는데, 특정
객체(B 객체)에서 사용되지 않는 객체(A 객체)를 계속 참조하고 있으면 메모
리 누수가 발생됨
다양한 명령과 툴을 이용하여 생성 가능
jmap 명령 이용
jmap -dump:format=b,file=filename.hprof pid
Heap Dump 분석
[root@jvmedu ~]# jmap
Usage:
jmap [option] pid
(to connect to running process)
jmap [option] executable core
(to connect to a core file)
jmap [option] [server_id@]remote server IP or hostname
(to connect to remote debug server)
where option is one of:
none to print same info as Solaris pmap
-heap to print java heap summary
-histo[:live] to print histogram of java object heap; if the live
suboption is specified, only count live objects
-clstats to print class loader statistics
-finalizerinfo to print information on objects awaiting finalization
-dump:dump-options to dump java heap in hprof binary format
dump-options:
live dump only live objects; if not specified,
all objects in the heap are dumped.
format=b binary format
file=file dump heap to file
Example: jmap -dump:live,format=b,file=heap.bin pid
-F force. Use with -dump:dump-options pid or -histo
to force a heap dump or histogram when pid does not
respond. The live suboption is not supported
in this mode.
-h | -help to print this help message
-Jflag to pass flag directly to the runtime system
136
Heap Dump 파일정보
로딩된 클래스 정보
클래스명, 부모 클래스, 클래스로더, 멤버변수 정보(이름과 타입), Static 변수값
모든 객체 정보
클래스와 멤버변수(참조변수 및 primitive 변수)의 값
변수명, 컬렉션 크기등
GC Root Set
모든 스레드 Call Stack
JAVA 6.14 이상인 경우
Heap Dump 분석
137.
137
Shallow Heap /Deep Heap / Retained Heap 크기
Shallow Heap
해당 객체의 메모리 크기
Deep Heap
해당 객체의 메모리 크기 + 참조하고 있는 모든 객체의 크기
Retained Heap
해당 객체의 메모리 + 직접/간접적으로 참조하는 다른 객체들을 포함한 메
모리
해당객체가 참조하는 객체를 다른 객체도 함께 참조하면 그 객체는
Retained Heap에서 제외됨
해당객체의 메모리 크기 + GC될때 함께 GC될수 있는 참조하고 있는 객체
의 메모리 크기
Heap Dump 분석
용어 정리
제이드크로스 : Company
Person p1;
Person p2;
Person p3;
자바학원 : School
Person p1;
Person p2;
양병국 : Person
고덕한 : Person
김성환 : Person
정환열 : Person
138.
138
Dominator Tree
dominate하다
GC root로부터 특정 y객체로 연결(참조)되는 패스가 그려지는 어떤 Object Graph에서 향상 x객체를 거쳐
야만 y객체로 참조가 되어진다고 할 때, 이때 x객체가 y객체를 dominate한다 고 할 수 있다.
immediate dominator
패스상에 y객체와 가장 근접한 dominator 인 x객체
Heap Dump 분석
용어 정리
Dominator Tree
객체 참조관계를 dominate 관계로 표현한 그래프
Dominator Tree 특징
x노드의 하위 노드에 있는 객체들은 x의 retained set을 의미한다.
x가 y의 immediate dominator이면, x의 immediate dominator도 y를 dominate한다.
(x의 immediate dominator가 z라고 하연 z가 y의 dominator이다)
dominator tree의 마지막 노드들은 object graph의 객체 참조관계와 일치하지는 않
는다(옆의 그림에서 F, G, H의 참조는 실제 참조 관계와 완전히 일치하지는 않는다)
139.
139
GC Roots
Garbage란?
Heap 과 Method Area 에서 현재 사용되지 않는 Object
Heap Dump 분석
용어 정리
Root Set과의 관계로 판단
Root Set에서 어떤식으로든 Reference 관계가 있다면 Reachable Object라고 한다
Reachable Object 종류
① Thread Stack의 Object 참조 정보
② Method Area에 Loading 된 Class, 그 중에서도 Constant Pool 에 있
는 Reference 정보
③ Native Method 로 넘겨진 Object Reference 로딩된 Class의 Constant
Pool내의 Reference
Unreleased Native Method로
넘겨진 Object Reference
Local Variable, Operand
Stack의 참조 정보
140.
140
Reachable Object
① ThreadStack의 Object Reference
② Method Area에 Loading 된 Class, 그 중에서도 Constant Pool 에 있는 Reference 정보
③ Native Method 로 넘겨진 Object Reference
Heap Dump 분석
용어 정리
Runtime Data Area
Permanent Area
Heap
Object
Object
Object
Object
Object
Stack
Stack
Stack
Stack
Stack
Stack
Stack
Stack Frame
Stack Frame
Stack Frame
JNI ...
Method Area
or
Class Object
Method Area
or
Class Object
Method Area
or
Class Object
1 2
3
UnReachable !!!
141.
141
Heap Dump 분석도구
Memory Analyzer (MAT)
https://www.eclipse.org/mat
Heap Dump 분석
IBM HeapAnalyzer
https://www.ibm.com/support/pages/ibm-heapanalyzer
분석 사이트
https://heaphero.io/
142.
142
MAT 최대 힙메모리 설정
분석하려는 힙 덤프 사이즈 보다 크게 잡아야 함.
32bit 윈도우는 오라클 JVM이 1.3G, Jrocket이 1.7G 까지 할당 가능하나 힙 메모리 부족으로 분석을 못 할 수 있음.
서버 운영체제에 맞는 MAT를 서버에 설치하고 X윈도우를 이용하는 방법도 한가지 방법
$MAT_HOME/MemoryAnalyzer.ini 파일에서 최대 HeapMemory 설정
Heap Dump 분석
MAT
-startup
plugins/org.eclipse.equinox.launcher_1.3.100.v20150511-1540.jar
--launcher.libraryplugins/org.eclipse.equinox.launcher.win32.win32.x86_64_1.1.300.v20150602-
1417
-vmargs
-Xmx1024m 최대 Heap Memory 설정
Icon assist -ALT + I
Toolbar and context menus
Dominator tree
Query browser
Retained set / Customized retained set
Run a report
Compare, compare basket
Show as histogram
Calculate retained size
Immediate Dominators
Histogram
Thread related query
Paths to GC Roots
Export drop-down menu
Search object by its address
Filter
Object Query Language Editor
Shallow / heap sizes (in Object Inspector)
Grouping drop-down menu
Pin current Object Inspector view (keep the content constant)
Pin current Object Inspector tab (keep the tab constant when switching heap dumps)
Out of Memory stack trace (not always available)
Totals row. Decorated with + means that not all the children are shown and the list can be expanded
Open expert system report
Overview pane
Open the heap dump
Open the heap dump from a file
Finalizers overview
Export to .csv
Export to .html
Views
Notes View - write and edit you notes in this view.
History View - list of recently opened heap dumps
Heap Dump Details
Object Inspector - detailed information for the selected object
Error Log - report the errors to our Bugzilla
Indicators added to heap objects
This heap object references the one above
This heap object references the one below
This heap object is a Garbage Collection Root
General Information
Array object
Instances grouped by class
Instances grouped by class where some of the instances have already been shown
Instances grouped by class where all of the instances have already been shown
Package
Super class
Class object
Class loader object
Heap dump
Object address
Other object; not a class, classloader or array object
Heap Dump 분석
MAT
145.
145
Overview - Details
Details
Heap Dump 분석
MAT
힙메모리 크기
GC 대상 -- 분석 시 신경 쓰지 않아도 됨
Class Loader 수
힙메모리에 존재하는 Object 개수
로딩된 Class 개수
146.
146
Overview - BiggestObjects by Retained Size
Biggest Objects by Retained Size
가장 많은 Retained Heap을 사용하고 있어서
문제가 될 수 있는 Object 표시
Heap Dump 분석
MAT
Pie 차트에 Mouse
Over하면 Inspector 창에
Object 상세정보가 표시됨
147.
147
Inspector
다른 뷰에서특정 오브젝트를 선택하면 Inspector 창에 Object 상세정보가 표시됨
Heap Dump 분석
MAT
Object 주소
Class Object 주소
오브젝트를 로딩한 Class Loader 주소
오브젝트 크기
오브젝트 Retained Size
Statice 멤버변수의
이름과 Type, 변수 값
Instance 멤버변수의
이름과 Type, 변수 값
선택한 Class의
상속관계 표시
148.
148
객체 상세 분석- Context Menu 이용
Pie 차트에서 분석하고자하는 객체를 클릭하여 컨텍스트 메뉴 이용
List objects
해당 객체가 참조하는 객체 목록 표시
with outgoing reference
해당 객체의 멤버변수로 사용되어 참조하고 있는 외부객체들의 상세정보 표시
Heap Dump 분석
MAT
149.
149
객체 상세 분석- List Objects (1/2)
with outgoing reference
해당 객체의 멤버변수로 사용되어 참조하고 있는 외부객체들의 상세정보 표시
Heap Dump 분석
MAT
해당객체의 멤버변수
목록과 사이즈 확인 가능
멤버변수가 배열인 경우
Attributes창에서 배열값 확인 가능
sessions 멤버변수의 Retained size가 약 110m이고
sessions객체 하위에 배열들에 골고루 힙메모리가 분산되어 있음
150.
150
객체 상세 분석- List Objects (2/2)
with incoming reference
해당 객체를 참조하고 있는 객체들의 목록을 표시
어떤 객체에서 해당 객체를 사용하고 있는지 파악할 때 용이함
Heap Dump 분석
MAT
151.
151
객체 상세 분석- Show objects by class
참조하는 클래스 타입별로 상세 목록 표시하고, 어떤 Class가 메모리 문제를 야기하는지 찾을때 사용
by outgoing reference
멤버변수의 Class 타입 기준으로 객체의 개수와 사용량 표시 ▶ Retained Size는 계산해야 함
by incoming referenc
해당 클랙스를 멤버변수로 가지고 있는 클래스의 목록 표시
Heap Dump 분석
MAT
152.
152
Path toGC Roots
Find out who is keeping alive a set of objects.
Motivation
Having found an expensive object it is then important to find all the reasons it is kept alive.
Arguments
Argument Description
object One object for which the paths to GC roots should be found.
-excludes Fields of certain classes which should be ignored when finding paths.
For example this allows paths through Weak or Soft Reference referents
to be ignored.
-numberofpaths The number of different paths to be displayed.
객체 상세 분석 - Path To GC Roots
Path To GC Roots
어떤 객체가 해당 객체를 사용하고 있어서 GC가 안되는지에 대
한 정보를 파악할 수 있음
GC Roots로 거슬러 올라가면서 해당 객체를 참조/사용하는 객체
들의 목록 표시
Heap Dump 분석
MAT
https://d2.naver.com/helloworld/329631
153.
153
객체 상세 분석- Merge Shortest Paths to GC Roots
Merge Shortest Paths to GC Roots
1개 인스턴스에 대한 GC Roots를 찾는 것이 아니라 특정 클래스의 여러 인스턴스들에 대한 GC Roots를 찾아 준다.
객체가 아니라 특정 클래스명으로 생성된 객체들의 종합적인 메모리 누수가 의심될 때, 특정 객체에 대한 문제 분석이 아니라 클래스별로 문
제 분석을 접근할 수 있다.
Heap Dump 분석
MAT
154.
154
ClassLoader 누수 분석(PermGen 이슈)
Class Loading 현황 분석
선택한 객체가 어떤 Class Loader에 의해 로딩되었는지 확인
해당 Class Loader에 의해 로딩된 Class 목록과 인스턴스 수를 확인
Heap Dump 분석
MAT
155.
155
Thread 분석
상단의툴바 중 Thread Overview 버튼을 클릭
Heap Dump 수행 시에 실행되고 있던 스레드 목록 정보와, Call Stack 정보도 제공
해당 스레드가 사용하는 변수로 인해서 발생하는 Shallow Heap 크기와 Retained Heap 크기에 대한 정보를 제공
Heap Dump 분석
MAT
156.
156
Collection 분석
JavaCollections
Java Collections 아래에 있는 분석 정보는 컬렉션 크기 정보, 컬렉션의 fill ratio, map의 collision ratio 등에 대한 분석 정보를 제공
컬렉션이 비어있는데 쓸데 없이 생성 되어 있으면 메모리 공간 낭비가 일어나므로 fill ratio 값이 0%로 낮은 값으로 존재하는 컬렉션 객체가
많은지 알아보는 용도로 사용 될 수 있다
Heap Dump 분석
MAT
157.
157
메모리 이슈 분석4단계
Heap Dump 분석
MAT
• Total Heap Size
• Total Number of Ojbects, Classes and Class Loaders
• Class Histogram
Heap Memory Overview
• Check Dominator Tree
• OQL
Find Big Object
• Expand Explore Dominator Tree
• Analyze the Retained Set
• Object outbound reference, Object Inspector
Inspect Content
• Object inbound references
• Paths from the GC roots
• Open in Dominator Tree
Identify Holders
158.
158
LAB) Heap Dump분석 : Heap OOM (1/4)
개요
오랫동안 살아있는 객체를 Heap에 조금씩 생성했을 Heap 메모리 변화와 OOM을 관찰한 후 원인을 Heap Dump를 이용하여 분석
Heap Dump 분석
com.jadecross.troubleshoot.memory.OomTab.java
private java.util.ArrayList list = new java.util.ArrayList();
/**
* Heap OOM 발생 - 한번 호출할때마다 25m Heap 사용
*/
private void genHeapOom() {
for (int i = 0; i 25000; i++) {
list.add(new byte[1000]);
}
}
159.
159
LAB) Heap Dump분석 : Heap OOM (2/4)
Heap Dump 분석
① Heap Memory OOM을 유발하는 샘플 어플리케이션을 최대 힙사이즈 512m 를 사용하도록 실행
C:jadeedu_jvmswlabtroubleshoot java -Xms512m -Xmx512m -jar JavaTroubleShootDemo.jar
② visualvm.exe 실행
┗▶경로 : C:jadeedu_jvmswjava_toolvisualvm_211binvisualvm.exe
┗▶“JavaTroubleshotDemo.jar” 더블 클릭
┗▶Monitor 탭 클릭
160.
160
LAB) Heap Dump분석 : Heap OOM (3/4)
Heap Dump 분석
③ VisualVM에서 “Perform GC”, “Heap Dump” 버튼을 차례대로 클릭하여 첫번째 Heap Dump를 생성
④ “Heap OOM 데모” 버튼을 10번 클릭하면서 VisualVM의 힙 메모리 변화를 관찰한 후 “Perform GC”, “Heap Dump” 버튼을 차례대로 클릭하여 2번째 Heap Dump
를 생성
⑤ OOM 이 발생할때까지 “Heap OOM 데모” 버튼을 10번 클릭하고, “Perform GC”, “Heap Dump” 버튼을 차례대로 클릭하여 3번째 Heap Dump를 생성
⑤ 생성된 3개의 Heap Dump를 로컬에 다운로드
161.
161
LAB) Heap Dump분석 : Heap OOM (4/4)
Heap Dump 분석
⑥ Eclipse Memory Analyzer를 실행하고 OOM이 발생한 3번째 Heap Dump 오픈
162.
162
LAB) Heap Dump분석 : Overview (1/4)
Details
Heap Dump 분석
힙메모리 크기
GC 대상 -- 분석시 신경쓰지 않아도 됨
Class Loader 수
힙메모리에 존재하는 Object 개수
로딩된 Class 개수
163.
163
참고) Shallow Heap/ Deep Heep / Retained Heap 크기
Shallow Heap
해당 객체의 메모리 크기
Deep Heap
해당 객체의 메모리 크기 + 참조하고 있는 모든 객체의 크기
Retained Heap
해당 객체의 메모리 + 직접/간접적으로 참조하는 다른 객체들을 포함한 메
모리
해당객체가 참조하는 객체를 다른 객체도 함께 참조하면 그 객체는
Retained Heap에서 제외됨
해당객체의 메모리 크기 + GC될때 함께 GC될수 있는 참조하고 있는 객체
의 메모리 크기
Heap Dump 분석
제이드크로스 : Company
Person p1;
Person p2;
Person p3;
자바학원 : School
Person p1;
Person p2;
정환열 : Person
홍길동 : Person
이수일 : Person
심순애 : Person
164.
164
LAB) Heap Dump분석 : Overview (2/4)
Biggest Objects by Retained Size
가장 많은 Retained Heap을 사용하고 있는
Object 비율 표시
Heap Dump 분석
Pie 차트에 Mouse
Over하면 Inspector 창에
Object 상세정보가 표시됨
165.
165
LAB) Heap Dump분석 : Overview (3/4)
Inspector
다른 뷰에서 특정 오브젝트를 선택하면 Inspector 창에 Object 상세정보가 표시됨
Heap Dump 분석
Object 주소
Class Object 주소
Class를 로딩한 ClassLoader 주소
오브젝트 Shallow size
오브젝트 Retained size
Statice 멤버변수의
이름과 Type, 변수 값
Instance 멤버변수의 이름과 Type, 변수 값
선택한 Class의
상속관계 표시
166.
166
LAB) Heap Dump분석 : Overview (4/4)
객체 상세 분석
Pie 차트에서 분석하고자 하는 객체를 클릭하
여 컨텍스트 메뉴 이용
Heap Dump 분석
Pie 차트에서 분석하고자하는
객체를 클릭하여 컨텍스트
메뉴 이용
167.
167
LAB) Heap Dump분석 : 객체 상세 분석 - List Objects (1/2)
with outgoing reference
해당 객체의 멤버변수로 사용되어 참조하고 있는 외부객체들의 상세정보 표시
Heap Dump 분석
MAT
해당객체의 멤버변수
목록과 사이즈 확인 가능
멤버변수가 배열인 경우
Attributes창에서 배열값 확인 가능
ArrayList 타입의 list 멤버변수 인스턴스 1개가
약 488m 힙메모리 점유
168.
168
LAB) Heap Dump분석 : 객체 상세 분석 - List Objects (2/2)
with incoming reference
해당 객체를 참조하고 있는 객체들의 목록을 표시
어떤 객체에서 해당 객체를 사용하고 있는지 파악할 때 용이함
Heap Dump 분석
MAT
169.
169
LAB) Heap Dump분석 : 객체 상세 분석 - Show objects by class
참조하는 클래스 타입별로 상세 목록 표시하고, 어떤 Class가 메모리 문제를 야기하는지 찾을때 사용
by outgoing reference
멤버변수의 Class 타입 기준으로 객체의 개수와 사용량 표시
by incoming reference
해당 클래스를 멤버변수로 가지고 있는 클래스의 목록 표시
Heap Dump 분석
MAT
Calculate Retained size
해당 Class의 Object들이 사용하는 Retained 힙사이즈 계산
170.
170
참고) GC Roots
Garbage 란?
Heap 과 Method Area 에서 현재 사용되지 않는 Object
Heap Dump 분석
Root Set과의 관계로 판단
Root Set에서 어떤식으로든 Reference 관계가 있다면 Reachable Object라고 한다
Reachable Object 종류
① Stack의 Object 참조 정보
② Method Area에 Loading 된 Class,
그 중에서도 Constant Pool 에 있는 Reference 정보
③ Native Method 로 넘겨진 Object Reference
로딩된 Class의 Constant
Pool내의 Reference
UnReleased Native Method로
넘겨진 Object Reference
Local Variable, Operand
Stack의 참조 정보
Runtime Data Area
Permanent Area
Heap
Object
Object
Object
Object
Object
Stack
Stack
Stack
Stack
Stack
Stack Frame
Stack Frame
Stack Frame
JNI ...
Method Area
or
Class Object
Method Area
or
Class Object
Method Area
or
Class Object
1 2
3
UnReachable !!!
171.
171
Path toGC Roots
Find out who is keeping alive a set of objects.
Motivation
Having found an expensive object it is then important to find all the reasons it is kept alive.
Arguments
Argument Description
object One object for which the paths to GC roots should be found.
-excludes Fields of certain classes which should be ignored when finding paths.
For example this allows paths through Weak or Soft Reference referents
to be ignored.
-numberofpaths The number of different paths to be displayed.
LAB) Heap Dump 분석 : 객체 상세 분석 - Path To GC Roots
Path To GC Roots
어떤 객체가 해당 객체를 사용하고 있어서 GC가 안되는지에
대한 정보를 파악할 수 있음
GC Roots로 거슬러 올라가면서 해당 객체를 사용(참조)하는 객
체들의 목록 표시
Heap Dump 분석
MAT
172.
172
LAB) Heap Dump분석 : 객체 상세 분석 - Merge Shortest Paths to GC Roots
Merge Shortest Paths to GC Roots
1개 인스턴스에 대한 GC Roots를 찾는 것이 아니라 특정 클래스의 여러 인스턴스들에 대한 GC Roots를 찾아 준다.
객체가 아니라 특정 클래스명으로 생성된 객체들의 종합적인 메모리 누수가 의심될 때, 특정 객체에 대한 문제 분석아 아니라 클래스별로 문
제 분석을 접근할 수 있다.
Heap Dump 분석
MAT
Unlike the Path to GC roots query, this query can
operate on multiple objects. However, it only finds the
shortest path to GC roots; there may be other paths,
but this query does not show them. As it operates on
multiple objects there are multiple paths, and the query
has the option to merge objects on a path by class.
Seeing a common path can be useful in understanding
why a set of objects is being kept alive.
173.
173
LAB) Heap Dump분석 : 객체 상세 분석 - Java Basics
Class Loading 현황 분석
선택한 객체가 어떤 Class Loader에 의해 로딩되었는지 확인
해당 Class Loader에 의해 로딩된 Class 목록과 인스턴스 수를 확인
Heap Dump 분석
MAT
175
Class Loader
ClassLoader
Class는 참조되는 순간 동적으로 Load 및 Link가 이루어짐
Dynamic Loading + Dynamic Linking
JVM내에서 Dynamic Loading을 담당하는 주체가 Class Loader임
Class Loader
Java Application
(Real-Time) Operating System
Native
Method
Libraries
Class
Libraries Class Loader System
Execution
Engine
Run-time
Data Area
Garbage
Collector
Java
Threads
Native
Threads
JVM내로 Class를 Load하고
Link를 통해 적절히 배치하는
일련의 작업을 수행하는 모듈
LoadTime Dynamic Loading RunTime Dynamic Loading
Loading
시점
하나의 Class를 로딩하는 과정에서 관련된 Class들을 한꺼번에 로딩 Code를 실행하는 순간에 동적으로 로딩
샘플
public class Hello {
public static void main(String[] args) {
System.out.println(Hello World);
}
}
public class Hello {
public static void main(String[] args) throws ClassNotFoundException {
Class cl = Class.forName(args[0]);
}
}
설명
Hello class가 로딩되는 과정에서
Java.lang.String, java.lang.System Class가
동시에 로딩됨
Class.forName(args[0])를 호출하는 순간 args[0]에 해당하는 Class가 로딩
참고 Reflection의 기반이 되는 기술
Dynamic Loading 분류
Class의 Loading 시점에 따른 분류
176.
176
Namespace
Namespace
ClassLoader는namespace를 하나씩 각각 가지고 있고, 자신이 Load한 Class의 Full Qualified Name 목록을 관리하고 있어서, 동일한 Class
를 중복해서 Loading 하지 않음
JVM내에서 동일한 Class란?
Full Qualified Name이 같아야 한다.
ClassLoader가 같아야 한다.
“ClassLoader Name + Package Name + Class Name” 까지 동일해야 같은 Class라고 인식
Class Loader
Full Qualified Name
= Package명 + Class 명
각 ClassLoader마다 Namespace를 따로 가지고 있음
ClassLoader가 Class를 Load할 때 JVM에 있는 모든 Class를 찾아다니며 Class 이름을 확인하는 대신 Namespace를 사용
Load한 Class의 Full Qualified Name을 Namespace에 저장
Symbolic Reference(객체의 이름으로 참조하는 방식)를 수행할 때 ClassLoader는 자신의 Namespace를 검색
참조되는 Class를 로딩한 ClassLoader가 참조하는 Class를 로딩 하도록 함
Namespace
Classloader 1
Classloader 1
com.jadecross.Person
com.jadecross.Person
com.jadecross.Person
com.jadecross.Person
public class Hello {
public static void main(String[] args) {
Class cl = Class.forName(com.jadecross.CodeVaccine);
}
}
* 같은 JVM내에서 같은 Class라도 ClassLoader만 다르다면 중복해서 Loading이 가능함
Namespace
Classloader 2
Classloader 2
com.jadecross.CodeVaccine
com.jadecross.CodeVaccine
Hello
Hello
177.
177
ClassLoader 구분
ClassLoader계층구조
Class Loader
Bootstrap
Class Loader
Extension
Class Loader
System
Class Loader
User-Defined
Class Loader
User-Defined
Class Loader
User-Defined
Class Loader
Class Loader Loading Class 설명
BootStarp $JAVA_HOME/jre/lib/rt.jar
부모를 가지지 않는 최상위 ClassLoader
JVM 기동시 가장 먼저 생성
Java가 아닌 Native Code로 구현되어 있음
Extension
$JAVA_HOME/jre/lib/ext/*.jar
또는
java.ext.dirs 시스템 프로퍼티
Appication
System
$CLASSPATH
또는
java.class.path 시스템 프로퍼티
java -cp or -classpath
Application User를 위한 Class Loader
User-Defined
Application에서 직접 생성 가능
보통 WAS나 Framework에서 생성해서 사용
$JAVA_HOME/jre/lib/ext/*.jar
$JAVA_HOME/jre/lib/rt.jar
$CLASSPATH
178.
178
ClassLoader Delegation Model
위임 모델(Deletaion Model)
모든 ClassLoader는 Bootstrap을 제외하고는 모두 Parent를 가지게 됨
Class를 찾는 순서는 Cache → Parent → Self의 순서
Class를 Loading할 때 부모에게 위임(Delegation)
Class를 Load할때 ClassLoader는 자신이 Load를 수행하는 것보다 Parent ClassLoader에게 위임하는 것을 우선한다
새로운 ClassLoader를 만들 때 default는 System ClassLoader임
별도의 Parent를 지정하지 않으면 System ClassLoader의 Child가 됨
자신을 포함한 상위의 정보는 확인이 가능하지만, 하위의 것은 확인이 불가능
Class의 Loading
Classloader의 loadClass()를 수행
Class가 이미 로딩되어 있으면 이를 반환
Load가 되어 있지 않으면 parent에게 위임
Parent가 찾지 못하면 findClass()를 call
Classloader의 findClass()
Current Classloader에서 Class를 찾음
Delegation시 Class를 찾는 순서도 동일
bootstrap → extension → system → user-defined임
그러므로 사용자 정의 Class의 경우
bootstap이나 extension이 사용하는 class path는 피하는 것이 좋음
Class Loader
Bootstrap
Class Loader
Extension
Class Loader
System
Class Loader
User-Defined
Class Loader
User-Defined
Class Loader
User-Defined
Class Loader
179.
179
ClassLoader 관련 Options
ClassLoader
옵션 설명 Hotspot IBM default 비고
-Xbootclasspath:path(s) or file(s) Bootstrap ClassLoader 의 검색 경로 또는 Load할 파일 설정 O O
-Xbootclasspath/a:path(s) or file(s) 경로나 파일을 Boot Classpath 의 뒤에 추가한다 O O
-Xbootclasspath/p:path(s) or file(s)
경로나 파일을 Boot Classpath 의 앞에 추가
Jenninfer 4버전에서 lwst.jdk.jar 파일을 Prepend하기 때문에 rt.jar안의 Class대신 Loading됨
O O
-Djava.ext.dirs=path(s) or file(s) Extension ClassLoader 의 검색 경로 또는 Load할 파일 설정 O X
-cp, -classpathpath(s) or file(s)
System ClassLoader 의 검색 경로 또는 Load할 파일 설정
$CLASSPATH 환경 변수를 사용해도 동일하게 설정됨
O O
-Djava.class.path=path(s) or file(s) System ClassLoader 의 검색 경로 또는 Load할 파일 설정 O X
-XX:+TraceClassLoading Load된 모든 Class를 보여준다 O X
-XX:+TraceClassLoadingPreorder Load된 모든 Class를 참조 순서로 보여준다. O X 1.4.2+
-XX:+TraceClassResolution Constant Pool Resoultion 정보를 보여준다 (보통 debugging 용도) O X 1.4.2+
-XX:+TraceClassUnloading Class가 Unloading 될 때의 정보를 보여 준다. O X
-XX:+TraceLoaderConstraints ClassLoader의 제약조건에 대한 기록을 보여 준다. O X java 6+
-XX:+LazyBootClassLoader Bootstrap ClassLoader 의 Classpath 에 있는 파일들을 Lazy 방식으로 Load한다 O X true java 6+
-XX:+ClassUnloading ClassUnloading 하지 않는다. O X
-noverify
바이트코드 검증기를 사용하지 않는다
국내 Jboss 환경에서 대부분 사용하고 있음 → 과연 좋을것일까 생각해보자!!!!
180.
180
ClassLoader Work
파일형태로 존재하던 Class를 Runtime Memory에 Type으로 만드는 작업
Type은 Class가 JVM 내에서 Runtime Memory의 일부가 된 형태
Class는 ClassLoader Work 가 완료되면 Type이 되어 Instance를 생성하는 틀로 사용
Class Loader
Class Loader Work
(Real-Time) Operating System
Native
Method
Libraries
Class
Libraries
Class Loader System
Execution
Engine
Run-time
Data Area
Garbage
Collector
Java
Threads
Native
Threads
Load
Link
Prepare
Resolve
Verify
Java Application
Initialize
181.
181
ClassLoader Work -Loading
Binary형태의 Type을 JVM 안으로 가져오는 과정
Class Loader
Class Loader Work
Loading
Acquistion
파일형태의 Class를 획득하는 단계
java class file format을 파일시스템, 네트워크 등 여러 경로로 획득
↓
Parse
Method Area의 데이터구조에 맞게 분석하는 작업
Method Area내에 특정 Class의 메타정보를 생성하기 위한 준비작업
JVM Crash를 방지하기 위해 다음 단계인 Linking과정의 Verification 작업의 일부를 수행
파일크기를 체크하여 지나치게 큰(?) 파일은 Loading 과정에서 걸러냄
Super Class의 존재여부를 체크하여 JVM내에 없다면 이를 먼저 Load
↓
java.lang.Class
instance의 생성
Application이 특정 Type에 대한 메타정보를 접근하기 위해서는 class인스턴스의 메소드를 수행하게 된다
그러므로 class 인스턴스는 Application과 JVM내부의 Runtime Data 사이를 연결해주는 가교 또는 Interface 역할을 수행
▼
Linking JVM의 Runtime 상태의 Binary type data로 구성하는 과정
▼
Initialization Class변수를 적절한 값으로 초기화
182.
182
ClassLoader Work -Linking
JVM Runtime 상태의 Binary type data로 구성하는 과정
Class Loader
Class Loader Work
Loading Binary형태의 Type을 JVM 안으로 가져오는 과정
▼
Linking
Verification
JVM에서 사용가능한 형태인지 검증
Java language의 문법(semantic)과 정합성을 체크
JVM 스펙에는 Verification이 어떠한 상황에서Exception 또는 Error를 발
생시켜야 하는지 구체적으로 명시되어 있음
우선적으로 검증되는 항목
Final Class가 SuperClass가 아닌지, Override되지는 않았는지 여부
Abstract Class가 아닌 경우, 선언된 모든 method의 구현여부
Type과 SuperClass에 선언된 Method의 이름, 파라메터 등이 중복되거나
적절하지 않은지의 여부
SuperClass를 Load한 후 검증 항목
모든 Constant Pool의 정합성
Constant pool에 포함된 Class, Method명이나 변수,Method의 descriptor
등의 String정보의 확인
Bytecode의 정합성과 완전성(integrity) 체크
↓
Preparation
Type이 필요로 하는 Memory를 할당
클래스에서 정의된 필드, 메소드, 인터페이스들을 나타내는 데이터 구조
를 준비
Class 변수를 위한 메모리 할당과 default 값의 설정
그 밖에도 성능을 위해 Method table과 같은 data 구조를 위한 메모리 공
간을 할당할 수 있음
Primitive Type의 Default Value
↓
Resolution
Type의 constant pool에 있는 class, interface, method, field의 symbolic
reference를 direct reference로 변경하는 과정
First Actual Use 때 하나씩 Loading, Linking (Lazy 방식 → 모든 vendor에서 채택)
Actual Use (=Explict Loading)
Actual Use of class
Class의 new instance를 위한 생성자의 호출
Element type으로 class를 포함하는 array의 생성
상속이 아닌 Class내에서 선언된 method 호출
Final static을 제외한 class내에서 선언된 변수의 할당이나 사용
Actual Use of interface
Interface에서 선언된 변수의 할당 또는 사용
그 밖에 compile 때 상수화되거나 상속된 것을 사용하는 등의 방법은
Passive Use 또는 implicit loading이라 함
▼
Initialization Class변수를 적절한 값으로 초기화
Method table : Superclass의 method를 superclass의 탐색 없이 액세스 가능하도록 하는 장치
Eager 방식 : JVM 기동 시 Application와 관련된 모든 Class를 한꺼번에 Loading, Linking
Variable Type Default Value Variable Type Default Value
int 0 byte (byte)0
long 0L reference null
short (short)0 float 0.0f
char 'u0000' double 0.0d
183.
183
ClassLoader Work -Initialization
Class변수를 적절한 값으로 초기화
Class Loader
Class Loader Work
Loading Binary형태의 Type을 JVM 안으로 가져오는 과정
▼
Linking JVM의 Runtime 상태의 Binary type data로 구성하는 과정
▼
Initialization
Class변수를 적절한 값으로 초기화
적절한 Value는 개발자가 부여한 값을 의미
Class Initialization Step
직계 superclass가 아직 initialized되지 않았다면 superclass를 먼저 initializing
Class의 class initialization method clinit() 을 수행
Interface Initialization Step
Interface는 superinterface의 initialization이 불필요하므로 바로 initialization method를 수행
Loading, Linking에 비해 Initialization time은 엄격히 정의하고 있음
First Active Use때 반드시 Initialization되어야 함
Loading, Linking은 Initialization보다 반드시 선행
Synchronization이 필요함
다수의 Thread가 initialization에 뛰어 들면 오직 한 개의 Thread만 작업을 해야 하고 다른 Thread는 Wait
Initialization이 끝나면 다른 Thread들에 notify
185
Execution Engine
ExecutionEngine
Bytecode를 실행하는 Runtime Module
Bytecode를 실행하는 과정에서 Interpreting이 필요함
Interpreting의 2가지 방법
Interpreter방식
JIT Compile방식
Execution Engine
Java Source
.java
Javac .java
JVM
Runtime
Data Area
Execution
Engine
Execution
Engine
ClassLoader
Bytecode
Stream
Interpreting
Classfile
.class
Instruction의 실행
Bytecode의 흐름 = Instruction의 순서
Bytecode의 연산은 method level로 수행
Method가 return값을 반환하거나 Exception을 발생할 때 까지 수행
Execution Engine은 한번에 한 Instruction을 실행
Instruction = Opcode + Operand
Execution Engine은 opcode를 fetch하여 지정된 작업을 수행한 후 다
음 opcode를 fetch
다음 Instruction을 설정하는 방법
대부분의 경우 현재 수행하는 opcode의 다음 opcode를 수행
Goto나 return의 경우 지정된 곳의 opcode를 수행
Exception이 던져질 경우 적절한 catch절의 opcode를 수행
186.
186
Interpreter -vs- JITCompiler
Execution Engine
.
Interpreter 방식 JIT Compiler 방식
Bytecode를 compile하지 않음
Bytecode를 하나씩 읽고 해석하여 실행하는 방식
Bytecode를 해석하는 시간은 짧아지나 실행하는 시간은 길어짐
초창기 JVM은 모든 Bytecode를 interpreter방식으로 처리
Load된 Class에 대해 Interpreter방식으로 동작을 하다가 반복 수행을 감지하게 되면 적절한 시점(Just In
Time)에 JIT Compiler가 동작하여 실행속도를 향상시키는 방식 → Lazy Fasion
Bytecode로 부터 native code를 생성해낸뒤 실행
Native code로 compile하는 시간이 길어짐
Native Code의 실행시간은 매우 빠르며 기본적으로 Cache가 되기 때문에 반복 호출시 이득이 큼
여러 번 호출이 되지 않는다면 Interpreter보다 성능이 떨어지게 됨
source code byte code native code
int a;
int b;
int c = a + b;
iload_0
iload_1
iadd
ld [$fp-0] , $r0
st $r0, [$sp+0]
ld [$fp-4] , $r1
st $r1, [$sp+4]
ld [$sp+0] , $r0
ld [$sp+0] , $r1
add $r0, $r1, $r2
st $r2, [$sp+0]
class A{
a.f1();
a.f3();
}
Heap
ptr
Object A
f1()
f2()
f3()
f4()
…
Method Table
JIT
byte
code
native
code
f1()
f3()
f1()
f3()
187.
187
Hotspot Compiler
Hotspot유래
Profiling을 통해 Hot Code를 구분하여 집중적으로 Compile하여, 불필요한 Compile을 회피
Hot code에 Optimization 집중화 가능 Compile계획의 현실화
Interpreter와 JIT Compiler의 혼합 모드(Mixed Mode system)으로 구성됨
동작방식
Bytecode는 우선 interpreted
Profiling을 거쳐 Dynamic Compile
이후 recompile 혹은 다시 interpreted
Hotspot은 2개의 VM으로 구분
Execution Engine
Hotspot Compiler
Recompile
Interpreted Again
Dynamic
Compilation
Interpreted
Profiling
Client VM Server VM
Compiler C1 Compiler C2 Compiler 또는 Opto Compiler
특징
및
최적화 방식
빠르고 보다 가벼운 Optimization 과정이 특징
Value Numbering, Inlining, Class analysis등의 Optimization작업을 수행
주로 Static을 가정하고 정형화된 패턴으로 Compile을 시도
Compile대상을 선정할때 Profiling보다는 단순한 Counting을 사용
Advanced Adaptive Compiler를 사용
High optimizing bytecode compiler
‘Intermediate’ optimizing compiler
Interpreter의 Profiling을 통해 Optimization을 수행
Inlining 전략
CHA와 Profiling Data에 기반한 Inline Decision
Loop Optimization
Loop Unrolling
188.
188
Client VM -C1 Compiler Optimizer 방식
Execution Engine
Hotspot Compiler
Optimization 설명 예제
Value Numbering
장황한 Code를 축약하는 기법
Local Variable Section을 변수를 최소화
w := 3
x := 3
y := x + 4
z := w + 4
→
w := 3
x := w
y := w + 4
z := y
189.
189
Server VM -C2 Compiler Optimizer 방식 (1/2)
Execution Engine
Hotspot Compiler
Optimization 설명 예제
CSE
Common Sub-expression Elimination
결과가 같은 공통식 또는 부분식이 있을때 공통된 부분을 줄이는 방식
a = b * c + g;
d = b * c * d;
e = b * c;
→
tmp = b * c;
a = tmp + g;
d = tmp * d;
e = tmp;
Loop Unrolling
Loop를 예측 가능하도록 풀어 놓은것
Loop를 실행하는데 소요되는 비용을 최소화
for (int i; i 3;
i++);
array[i] = i;
→
array[0] = 0;
array[1] = 1;
array[2] = 2;
On Stack Replacement
Hotspot JVM 이 자랑하는 Optimization 기법
보통 Loop 내에서 임계 값 이상의 반복수행이 감지되면 Loop가 완료될 때까지 Code 를
Interpreter 에 맡기고 다음 번 수행 때 Compile 을 수행하게 되는데, OSR최적화는 Loop 도
중 Interpreted code를 Compiled code로 대체
public class OnStackReplace {
public static void main(String[] args) {
long before = System.currentTimeMillis();
int sum = 0;
for (int i = 0; i 10 * 1000 * 1000; i++) {
sum += Math.sqrt(i);
}
long after = System.currentTimeMillis();
System.out.println(Elapsed : + Long.toString(after - before));
System.out.println(Sum : + Integer.toString(sum));
}
}
단점 : OSR을 사용하는 경우, Loop Hoisting, Array-Bounds Check Elimination, Loop
Unrolling 등의 다른 Optimization 이 생략되기 때문에 오히려 최적화의 정도가 감소될 수
있음
main method는 1회만 수행
그러나 main내에 천만 회의 loop가 수행
10,000회 부터 compile
그러나 main은 여전히 interpreting
14,000회 부터 OSR 동작
loop중에도 Compile code사용
190.
190
Server VM -C2 Compiler Optimizer 방식 (2/2)
Execution Engine
Hotspot Compiler
Optimization 설명
Array-bounds Check
Elimination
Array를 접근할 때마다 Range Check를 하지 않음
Automatic Bounds Checking
Array 인덱스가 경계범위 (Array-Bounds)를 벗어나게 되면 ArrayOutOfBound Exception 을 발생시키는데, Heap의 Array Object Header에 있
는 Length 정보를 매번 확인해야 하므로 수행속도가 저하되게 됨
Optimization 단계에서 Array Index를 상수화하여 최소, 최대 사이에 값이 오는지를 연산하여 검증
Dead Code Elimination
수행되지 않는 code는 Compile시 삭제
public class OnStackReplace {
public static void main(String[] args) {
long before = System.currentTimeMillis();
int sum = 0;
for (int i = 0; i 10 * 1000 * 1000; i++) {
sum += Math.sqrt(i);
}
long after = System.currentTimeMillis();
System.out.println(Elapsed : + Long.toString(after - before));
}
}
Code Hoisting Loop 내에서 매번 동일한 값을 내는 Code를 Loop 바깥으로 들어내는(Hoist) 것
for (i = 0; i 1000; i++)
z[i] = cos(x) + i * sin(x);
→
c = cos(x);
s = sin(x);
for (i=O; i 1000 ; i++)
z[i]=c + i*s
Code Hoisting 을 거치게 되면 cos(x) 와 sin(x) 은 Loop가 시작되기도 전에 각각 c와 s라
는 변수로 치환되어 Loop 내에서 상수처럼 사용되므로 효율적인 수행이 가능해진다
Deoptimization
Hotspot에만 있는 기능으로, 사용빈도가 떨어진 Compiled Code를 폐기하고 다시 Interpreter 모드로 수행되도록 하는 최적화
Optimization과 반대되는 이 기능은 자원을 최적화하여 배치한다는 측면에서 시스템 전반의 Optimization 이라고도 할수 있음
191.
191
Hotspot Compiler Option
ExecutionEngine
Hotspot Compiler
옵션 설명
default
비고
Client Server
-Xint Interpreter Mode로만 수행 java 1.3+
-Xcomp 모든 code를 Full Optimization을 사용하여 Compile을 수행하여 최대한 최적화 java 1.3+
-Xbatch
보통 Method compile은 수행이 오래 걸리게 되면 background process로 넘기게 되는 이 옵션을 사
용하면 Background로 작업을 넘기지 않고 Foreground에서 작업을 마무리짓고 이 Compiled Code
를 사용하도록 강제함
java 1.3+
-XX:+AggressiveOpts Compile Optimization을 공격적으로 수행하라는 옵션 java 5.6+
-XX:CompileThreshold=value compile의 임계값 1500 10000 java 1.3+
-XX:+AlwaysCompileLoopMethods Loop가 있는 method는 모두 Compile을 하도록 함 false false
-XX:+BackgroundCompilation
background에서 JIT Compile 여부를 결정
enable의 경우 compile중에도 interpreted code는 수행
java 1.3+
-XX:CICompilerCount=value Maximum concurrent compile Thread를 설정 java 1.3+
-XX:+Cltime JIT Compiler가 사용한 시간을 Print java 1.4+
-XX:+PrintCompilation Method가 Compile될 때의 정보를 출력
192.
Process Synchronization
Enterprise Application(정보시스템)은 거대한 동기화 머신이다
DBMS 시스템도 거대한 동기화 머신이다
Why Process Synchronization?
Semaphore, Mutex
Monitor
http://snui2019.snu.ac.kr/ocw/index.php?mode=listgubun=SNUpage=247
194
Why Process Synchronization?
Processes interact with each other for good
Why permit processes to cooperate?
Want to share resources
One computer, many users
One checking account file, many tellers
Want to do things faster
Read next block while processing current one
Divide jobs into sub-jobs, execute in parallel
Want to construct systems in modular fashion
Properties of interacting processes
Have shared resources and states
Non-deterministic
Outputs may vary depending execution ordering of processes
Their behavior is maybe irreproducible
Can't stop and restart with no bad effects
Process Synchronization
Why Process Synchronization?
Syn
함께 Timely
A B C
Etherenet
195.
195
Uncontrolled Task Interactions(1/3)
Data sharing problem instance
Interrupt routines and task code may share one or more variables that
they can use to communicate with each other
This may cause a data sharing problem - a sort of synchronization
problem
Such a task is referred to as non-reentrant code
Reentrant Code (재진입 가능 코드)
여러 Process들에 의해 동시에 호출되거나, 이전 호출이 완료되기 전에
반복 호출되어도 올바르게 수행되는 코드
Example
nuclear reactor monitoring system
Process Synchronization
Why Process Synchronization?
전역변수
static int iTemperatures[2];
Interrupt Service Routine
void interrupt vReadTemperatures(void){
iTemperatures[0] = !!; // Read in value from H/W
iTemperatures[1] = !!; // Read in value from H/W
}
User Process
void main(void){
int iTemp0, iTemp1;
while(TRUE){
iTemp0 = iTemperatures[0];
iTemp1 = iTemperatures[1];
if(iTemp0 != iTemp1)
!!; // set off howling alarm
}
}
Interrupt 발생
196.
196
Uncontrolled Task Interactions(2/3)
Atomic Operation
더 이상 분리할 수 없는 하나의 단위로 처리해야하는 Operation
Process Synchronization
Why Process Synchronization?
전역변수
static int iTemperatures[2];
Interrupt Service Routine
void interrupt vReadTemperatures(void){
iTemperatures[0] = !!; // Read in value from H/W
iTemperatures[1] = !!; // Read in value from H/W
}
User Process
void main(void){
int iTemp0, iTemp1;
while(TRUE){
iTemp0 = iTemperatures[0];
iTemp1 = iTemperatures[1];
if(iTemp0 != iTemp1)
!!; // set off howling alarm
}
}
User Process
void main(void){
while(TRUE){
if(iTemperatures[0] != iTemperatures[1])
!!; // set off howling alarm
}
} The same bug as in previous page!
The problem is that the statement
that compares iTemperatures[0] with
iTemperatures[1] can be interrupted
197.
197
Uncontrolled Task Interactions(3/3)
Solution
Disable interrupts
Process Synchronization
Why Process Synchronization?
전역변수
static int iTemperatures[2];
Interrupt Service Routine
void interrupt vReadTemperatures(void){
iTemperatures[0] = !!; // Read in value from H/W
iTemperatures[1] = !!; // Read in value from H/W
}
User Process
void main(void){
int iTemp0, iTemp1;
while(TRUE){
iTemp0 = iTemperatures[0];
iTemp1 = iTemperatures[1];
if(iTemp0 != iTemp1)
!!; // set off howling alarm
}
}
User Process
void main(void){
int iTemp0, iTemp1;
while(TRUE){
disable(); // Disable interrupts using array
iTemp0 = iTemperatures[0];
iTemp1 = iTemperatures[1];
enable();
if(iTemp0 != iTemp1)
!!; // set off howling alarm
}
}
non-interruptible
operations
Process와 Interrupt Service Routine간의
Interaction은 해결되었는데,
Process와 Process간의 Interaction의
동기화는 어떻게?
198.
198
if(BufferIsAvail){
BufferIsAvail = FALSE;
UseBuffer();
BufferIsAvail= TRUE;
}
Task Reentrancy (1/3)
To handle cooperating processes, we need the notion of non-interruptible operations
The operation cannot be interrupted in the middle
Examples
int A, B; A = B; // On most systems
On uniprocessors, code between interrupts
TAS(Test-And-Set) instruction in some architectures
To provide non-interruptible operations, we need some hardware support
Synchronization
Using atomic operations to ensure correct operation of interacting processes
Example of interacting processes that need synchronization
2 processes execute the following code
Process Synchronization
Why Process Synchronization?
Time Process 1 Process 2
0 if(BufferIsAvail)
1 if(BufferIsAvail)
2 BufferIsAvail = FALSE;
3 BufferIsAvail = FALSE;
4 UseBuffer();
5 UseBuffer();
Problem : Both processes issue UseBuffer()
Lack of atomicity of “if and “assignment
* BufferIsAvail이 TRUE라고 가정했을때
Process와 Process간의 Interaction의 동기화는 어떻게?
Interrupt Disable ??
하지만 너무 강력해
공유자원은?
199.
199
Task Reentrancy (2/3)
Race Condition (경합조건)
여러 Process들이 동기화 절차를 거치지 않고 동시에 자원을 사용하기 위해 경쟁함으로써 그 수행 결과를 예측할 수 없게 되는 상황
Critical section
A section of code. or collection of operations, in which only one process may be executing at a time
Mutual exclusion
Mechanisms which ensure that only one person or process is doing certain things at one time
Process Synchronization
Why Process Synchronization?
200.
200
Task Reentrancy (3/3)
Requirements for a mutual exclusion mechanism
Only one process is allowed in a critical section at a time
If several requests at once, it must allow one process to proceed
It must not depend on processes outside critical section
Desirable properties for a mutual exclusion mechanism
Don't make a process wait forever
Efficient
Don't use up substantial amounts of resources when waiting
Example: busy waiting
Simple
Should be easy to use
Process Synchronization
Why Process Synchronization?
https://preamtree.tistory.com/26
204
Basics
One ofkey synchronization mechanisms
Synchronization variables that take on integer values
P (Semaphore)
An atomic operation that waits for semaphore to become positive and then decrements it by one
Also called wait()
V (Semaphore)
An atomic operation that increments semaphore by one
Also called signal()
They are simple and elegant
They do a lot more that just mutual exclusion
Process Synchronization
Semaphore
열쇠 줘 열쇠 받아
열쇠가 있을때 lock(S) unlock(S) Synchronization 관점
열쇠가 없을때 wait(S) signal(S) Scheduling 관점
다익스트라 P(S) V(S)
205.
205
Usage
프린터 룸예제
P, V 오퍼레이션 모두 세마포어 변수를 파라미터로 하고
2명이 같은 프린터룸에 들어가고 싶으면, 같은 세마포어 변수를 사용해야 함
Process Synchronization
Semaphore
Task1(){
P(S1);
use printer;
V(S1);
}
Task2(){
P(S1);
use printer;
V(S1);
}
Semaphore S1 = 1;
206.
206
Initialization
Binary semaphore-vs- Counting semaphore
Process Synchronization
Semaphore
Counting Semaphore의 초기값은 어떻게 설정해야 하는가?
가용한 자원(프린터)이 2개 있으므로 Semaphore(열쇠)의 초기값은 2가 되어야 한다.
Task1(){
P(S1);
use printer;
V(S1);
}
Task2(){
P(S1);
use printer;
V(S1);
}
Semaphore S1 = 2;
207.
207
Semaphore Programming Pattern(1/3)
Roles of semaphores
Mutual exclusion
Scheduling
Process Synchronization
Semaphore
if(BufferIsAvail){
BufferIsAvail = FALSE;
UseBuffer();
BufferIsAvail = TRUE;
}
→
P(BufferIsAvail) ;
UseBuffer () ;
V(BufferIsAvail) ;
if 문이 사라진 이유는?
① Mutual exclusion을 제공하는 형태
Buffer example with semaphores
Note: BufferIsAvail must be set to one
What happens if BufferIsAvail is set to two? or zero?
② Scheduling 목적으로 사용되는 형태
P와 V가 각각 다른 엔티티에 존재
semaphore S = 0;
208.
208
Semaphore Programming Pattern(2/3)
③ Mutual exclusion + Scheduling
Producer/Consumer Pattern
What is “correct” for this example?
Constraints
Consumer must wait for producer to fill buffer
Producer must wait for consumer to empty buffers if all buffer space is filled
Note: V() is done when a resource is created and P() when destroyed
A separate semaphore is used for each constraint
emptyBufferAvail- Initialized to numBuffers
fullBufferAvail- Initialized to 0
Process Synchronization
Semaphore
Producer(){
P(buf_avail);
buf = data;
V(data_avail);
}
Consumer(){
P(data_avail);
buf = data;
V(buf_avail);
}
data_avail = 0;
Buf_avail = 1;
209.
209
Semaphore Programming Pattern(3/3)
④ Mutual exclusion + Scheduling + Dead Lock
Dining Philosopers
Process Synchronization
Semaphore
Thinking
Hungry
Eating
https://yeosong1.github.io/Philosophers
철학자의 상태 전이
210.
210
Synchronization Mechanism 비교
Interrupt Disable을 사용한 Synchronization의 문제
Interrupt Disable은 시스템 전체에 영향을 미치기 때문에 상관없는 Process의 수행도 방해받게 됨
Process Synchronization
Semaphore
Task1(){
P(S1);
use pr1;
V(S1);
}
Task2(){
P(S1);
use pr1;
V(S1);
}
서울 본사
Task3(){
P(S2);
use pr2;
V(S2);
}
Task1(){
disable interrupts();
use pr1;
enble interrupts();
}
부산 지사
211.
211
Semaphore의 단점과 Mutex
Semaphore의 단점
UnStructured Programming Construct이기 때문에 컴파일러 등의 도구를
사용한 디버깅이 어려움
Process Synchronization
Semaphore
Producer(){
P(buf_avail);
buf = data;
V(data_avail);
}
Consumer(){
P(data_avail);
buf = data;
V(buf_avail);
}
data_avail = 0;
Buf_avail = 1;
Producer(){
P(S1);
buf = data;
V(S2);
}
Consumer(){
P(S2);
buf = data;
V(S1);
}
Task1(){
P(S1);
buf = data;
V(S1);
}
Task2(){
P(S2);
buf = data;
V(S1);
}
Semaphore naming issue
Is this a race condition or not?
Mutex
Mutual Exclusion을 구현하기 위해 사용하는 Sleeping Lock
동일한 Mutex를 사용할때 mutex_lock()을 호출한 Process와
mutex_unlock()을 호출한 Process가 일치하여야 함 Task1(){
mutex_lock(S1);
buf = data;
mutex_unlock(S1);
}
Task2(){
mutex_lock(S2);
buf = data;
mutex_unlock(S1);
}
This is surely a race condition
열쇠 줘 열쇠 받아
열쇠가 있을때 lock(S) unlock(S) → Mutual Exclusion 관점
열쇠가 없을때 wait(S) signal(S) → Scheduling 관점
다익스트라 P(S) V(S)
간단히 해결
(API로 약속)
잘못된 사용
212.
212
Semaphore Implementation :Uni-Processor solution
세마포어는 Synchronization을 제공해주는 integer 변수 + α
세마포어는 C 구조체로 구현
+ α
Waiting Queue
Key idea
Use disable interrupt primitive to get mutual exclusion
Process Synchronization
Semaphore
struct Semaphore {
int cnt;
Queue queue;
}
P(S) {
disableInterrupts();
if(S.cnt-- 0)
enableInterrupts();
else
sleep(S.queue);
}
V(S) {
disableInterrupts();
if(S.cnt++ = 0)
enableInterrupts();
else
wakeup(S.queue);
}
sleep(Q) {
// cur_p is the current process
enqueue(cur_p, Q);
enableInterrupts();
yield_cpu();
}
wakeup(Q) {
p = dequeue(Q);
enableInterrupts();
// execute p immediately
reschedule(p);
}
Semaphore에서 Count의 의미
cnt = 0 남아있는 열쇠(자원)의 개수
cnt 0
절대값이 Queue에서
대기중인 Process의 개수
213.
213
Semaphore Implementation :Multi-Processor solution
Mutual exclusion is harder
Possibilities
Turn off all other processors
Use atomic hardware support
Read-Modify-Write memory operations
Example: Test And Set (TAS) instruction
Process Synchronization
Semaphore
Multiprocessor 에서 Atomic Operation을 구현하는 방법
Atomic Operation을 수행하는 동안 Bus를 장악하여 다른 Process의 Bus Transaction을 차단
TAS(Test-and-Set) Instruction
메모리의 Boolean 변수를 읽어서 확인한 후 1로 쓰는 작업을 Atomic하게 수행하는 명령어
Busy Waiting (또는 Spinning)
특정조건의 만족여부를 루프를 돌면서 반복해서 확인하는 기법
Multiprocessors solution does some busy-waiting Spin Lock
Common solution
Single-Processor용 세마포어 구현에서 disable Interrupt 대신에 이것(while TAS~~) 사용
while(TAS(lock_var) != 0)
use shared_resource;
lock_var = 0; // 공유자원 릴리즈
Single-Processor
Multi-Processor
disableInterrupt(); while(TAS(lockMem) != 0) continue;
enableInterrupt();
lockMem = 0;
enableInterrupt();
Lock Holder Preemption Problem
215
java.lang.Object 다시 살펴보기
ProcessSynchronization
Monitor
Wakes up a single thread that is waiting on this object's monitor.
이 객체의 모니터(object's monitor)에서 대기중인 단일 스레드를 깨웁니다. 이 오브젝트에서 스레드가 대기중인 경우 스레드 중 하나가 활성화 되도록 선택
됩니다. 선택은 임의적이며, 어떻게 구현하느냐에 따라 다름니다. 스레드는 wait method 중 하나를 호출하여 오브젝트의 모니터에서 대기합니다.
깨어난 스레드는 현재 스레드가 이 객체에 대한 Lock을 해제할때까지 진행할 수 없습니다. 깨어난 스레드는 일반적인 방식으로 이 객체에서 동기화하기 위
해 경쟁하는 다른 스레드와 경쟁합니다. 예를 들어, 깨어난 스레드는이 객체를 잠그는 다음 스레드가 될 때 신뢰할 수 있는 특권이나 단점이 없습니다.
이 메소드는이 오브젝트 모니터의 소유자인 스레드에 의해서만 호출되어야합니다. 스레드는 다음 세 가지 방법 중 하나로 객체 모니터의 소유자가됩니다.
By executing a synchronized instance method of that object.
By executing the body of a synchronized statement that synchronizes on the object.
For objects of type Class, by executing a synchronized static method of that class.
한 번에 하나의 스레드 만 객체의 모니터를 소유 할 수 있습니다.
Causes the current thread to wait until another thread invokes the notify() method or the notifyAll() method for this object.
다른 스레드가이 객체에 대해 notify() 메소드 또는 notifyAll() 메소드를 호출하거나 지정된 시간이 경과 할 때까지 현재 스레드가 대기하도록합니다.
현재 스레드는이 객체의 모니터를 소유해야합니다.
이 메소드는 현재 스레드 (T라고 함)가 이 오브젝트에 대한 대기 세트에 자신을 배치 한 다음 이 오브젝트에 대한 모든 동기화 청구(synchronization claims)
를 포기합니다. 스레드 T는 스레드 스케줄링 목적으로 사용 불가능하게 되고 다음 4 가지 중 하나가 발생할 때까지 휴면 상태가됩니다.
Some other thread invokes the notify method for this object and thread T happens to be arbitrarily chosen as the thread to be awakened.
Some other thread invokes the notifyAll method for this object.
Some other thread interrupts thread T.
The specified amount of real time has elapsed, more or less. If timeout is zero, however, then real time is not taken into consideration and
the thread simply waits until notified.
그런 다음 스레드 T가이 오브젝트의 대기 세트에서 제거되고 스레드 스케줄링을 위해 다시 사용 가능합니다.
그런 다음 일반적인 방식으로 다른 스레드와 경쟁하여 개체에서 동기화 할 수 있습니다. 일단 객체의 제어권을 얻은 후에는 객체에 대한 모든 동기화 클레
임이 현재 상태 즉, 대기 메소드가 호출 된 시점의 상황으로 복원됩니다. 그런 다음 스레드 T는 wait 메소드 호출에서 리턴합니다. 따라서 wait 메소드에서
리턴 할 때 오브젝트와 스레드 T의 동기화 상태는 wait 메소드가 호출되었을 때와 정확히 같습니다.
스레드는 소위 spurious wakeup이라고 알리거나 중단하거나 시간 초과하지 않고 웨이크 업할 수 있습니다. 실제로는 거의 발생하지 않지만 응용 프로그램
은 스레드를 깨우 게해야하는 조건을 테스트하고 조건이 충족되지 않으면 계속 기다려야합니다.
즉, 대기는 항상 다음과 같이 루프에서 발생해야합니다.
이 메소드는이 오브젝트 모니터의 소유자 인 스레드에 의해서만 호출되어야합니다. 스레드가 모니터의 소유자가 될 수있는 방법에 대한 설명은 notify 메소
드를 참조하십시오.
216.
216
Monitor Overview
Monitor
High-Ievel data abstraction tool that combines three features
Shared data
Operations on the data
Synchronization, scheduling
One binary semaphore is associated with each monitor
Implicit mutual excluslon
Can be embedded in programming languages
Example: Mesa/Cedar from Xerox and Java
Easier to use and safer than semaphores
Complier can check usage
Process Synchronization
Monitor
Example monitor in C style
monitor QueueHandler{
struct { ... } queue; // shared data
void addToQueue(val) {
// code to add to shared queue
}
int removeFromQueue() {
// code to remove
}
}
Operation Description
wait (condition)
Release monitor Iock, put process to sleep
Reacquire lock when waken
signal (condition)
Wake up one process waiting on the condition variable
If nobody waiting, do nothing
Note: No history in condition variables
broadcast (condition) Wake up all processes waiting on the condition variable
Condilion variables: things to wait on
217.
217
Usage
Monitor Condition변수
어떤 조건이 충족되기를 기다리고 있는 Process들의 Waitign Queue
Process Synchronization
Monitor
Monitor 내의 공유 변수들을 따로 보호하지 않는 이유
Monitor는 한번에 하나의 Process만 내부의 Method를 수행할 수 있도록 허용하기 때문
Hoare Style Monitor (Signal and Urgent-Wait Monitor)
Wait Queue에서 깨어난 Process가 바로 Monitor 내부로 진입하는 방식의 Monitor
Brinch-Hansen Style Monitor
Wait Queue에 Signal을 보내 Process가 수행을 계속하는 방식의 Monitor
type resource_manager is monitor
var busy: bloolean;
x: condition
procedure entry acquire(){
if (busy) x.wait;
busy = true;
}
procedure entry release(){
busy = false;
x.signal
}
{ /* Initialization */
busy = false;
}
218.
218
Hoare style monitorMesa style monitor Java style monitor
A Hoare style monitor with two condition variables a
and b
A Mesa style monitor with two condition variables a
and b
참고) 모니터 종류
Process Synchronization
Monitor
219.
219
Monitor Implementation
SignalerQueue
Hoare Style Monitor에서 Signal을 보낸 Process가 Monitor 밖에서 대기하기 위한 Queue
Process Synchronization
Monitor
P(monitor_lock);
// Body of the Function;
if (sig_lock_cnt 0) {
V(sig_lock);
} else {
V(monitor_lock);
}
/* x.wait */
x_cnt++;
if (sig_lock_cnt 0) {
V(sig_lock);
} else {
V(monitor_lock);
}
P(x_lock);
x_cnt--;
/* x.signal */
if (x_cnt 0) {
sig_lock_cnt++;
V(x_lock);
P(sig_lock);
sig_lock_cnt--;
}
monitor_lock Semaphore for the monitor
sig_lock Semaphore for the signalers
x_lock Semaphore for the condition x
221
Execution Time ≒Response Time
Thread Synchronization
서비스 로직을 수행하는 동안 CPU 연산에 걸린 시간
“자원”을 얻기 위해 대기하는 시간
자원 경합으로 인한 응답시간 지연 예시
자원 응답지연 예 개선 방안
CPU
시스템 요청이 많아 부하량이 증가하여 프로세스가 증가하여 CPU 할당을
늦게 받아 응답시간 지연
비효율적인 코드 개선
CPU 증설
Memory
대용량 조회 후 엑셀 파일 다운로드 시 대용량 메모리 요청으로 메모리가 부
족하게 되면 스와핑을 하게 되고, JVM의 경우 GC Time 증가로 응답 지연
대용량 메모리를 요청하는 코드 개선(주기적인 Flush)
메모리 증설
DBMS
동일 Row에 대한 DML 수행으로 인한 DB Lock 발생 또는 트랜잭션 구간이
길어서 응답시간이 지연
DB Lock 발생 구간 최소화
트랜잭션 구간 최소화
222.
222
Java의 Thread
GreenThread
JVM에 의해 Created, Scheduling되는 Thread
1.1 버전까지는 JVM의 유일한 Thread model
OS Thread와 n : 1
소수의 OS Thread를 시계열로 나누어 사용
CPU 사용의 제한 및 병목에 취약하여 성능 문제 야기
Thread Synchronization
Monitor
Java의 Synchronization Mechanism
Object 또는 특정 Code Block에 걸리는 일종의 Lock
Monitor의 2가지 목적
① Mutual Exclusion
공유 데이터를 보호하기 위해 동기화를 사용
② Cooperation (=Scheduling)
Class object의 wait(), notify()로 구현
Thread간의 공동 작업을 위해 동기화를 사용
Native Thread
OS Kernel이 관리하는 Thread
1.3 버전부터 Default
223.
223
LAB) Thread Synchronization데모
Visualizing the Java Concurrent API
Thread Synchronization
javaConcurrentAnimated.bat 파일 실행
파일 위치 : C:jadeedu_jvmswlabmonitorjavaConcurrentAnimated.bat
224.
224
Java Synchronization 용어정리
Mutual Exclusion
공유 데이터(Shared Data)를 다수의 Thread 가 동시에 접근해서
작업을 하게 되면 Memory Corruption이 발생할 수 있음
누군가가 공유 데이터를 사용할 때 다른 Thread 들이 사용하지
못하도록 하는 것
Shared Data
Runtime Data Area의 Data중 모든 Thread가 공유하는 것이 있음
Heap → Instance Variables
Method Area → Class Variables
JVM은 각 Object와 Class를 Object Lock으로 보호
Object Lock
한번에 한 Thread만 Object를 사용할 수 있게끔 하는 것
Mutex와 같은 것을 활용하여 Object Lock을 구현
Class file을 로딩할 때 java.lang.Class instance를 생성
Object lock은 이Class Object의 instance에 대해 동기화 작업을 수행
한 Thread는 동일 object에 여러 번 locking가능
각 object에는 lock counter가 있음
Lock을 획득하면 count는 증가
Lock을 놓으면 count는 감소
Count = 0이면 다른 thread가 lock을 획득할 수 있음
Thread가 Critical Section에 들어가면 lock을 요청
Thread Synchronization
Critical Section
Critical Section의 두 종류
Synchronized statement
Synchronized method
Critical section은 object reference로 수행
Critical section의 첫 instruction을 수행할 때 thread는 참조되는
object의 lock을 획득해야만 함
Critical section을 떠나면 lock은 자동으로 release
Object Lock에 대한 명시적인 작업 없이 critical section을 통해
JVM 내부적으로 동기화 작업
Mutual Exclusion의 대상
Enter Critical Section
코드 진입시 동기화 처리 필요(acquire lock)
Enter Critical Section
코드 진입시 동기화 처리 필요(acquire lock)
Exit Critical Section
코드 진출시 동기화 처리 필요(release lock)
Exit Critical Section
코드 진출시 동기화 처리 필요(release lock)
Critical Section
공유 데이터 처리
Critical Section
공유 데이터 처리
Thread-1 Thread-2 Thread-3
Thread-1
Shared
Data
javaConcurrentAnimated.jar.zip
228
Monitor의 기능 -① Mutual Exclusion (2/3)
Mutual Exclusion of Critical Section
Thread Synchronization
Monitor
https://www.logicbig.com/tutorials/core-java-tutorial/java-multi-threading/java-intrinsic-locks.html
229.
229
Monitor의 기능 -① Mutual Exclusion (3/3)
Vector, HashTable (JDK 1.2 이전) 을 더이상 안 쓰는 이유?
자체적으로 동기화 처리가 되어 있는데, 멀티쓰레드 프로그래밍이 아닌 경우에는 불필요한 기능이 되어 성능을 떨어트린다.
그래서 새로 추가된 ArrayList와 HashMap과 같은 컬렉션은 동기화를 자체적으로 처리하지 않고 필요한 경우에만 java.util.Collections 클래
스(Companion Class)의 동기화 메서드를 이용하여 동기화 처리를 하면 성능이 향상됨
Thread Synchronization
Monitor
package java.util;
public class HashtableK,V extends DictionaryK,V
implements MapK,V, Cloneable, java.io.Serializable {
...
public synchronized V put(K key, V value) {
if (value == null) throw new NullPointerException();
...
}
public synchronized V get(Object key) {
...
}
} ▶ 동기화가 필요한 Collection을 사용하고 싶을 때는 java.util.Collections 컴패니언 클래스를 이용
package java.util;
public class HashMapK,V extends AbstractMapK,V
implements MapK,V, Cloneable, Serializable
{
public V put(K key, V value) {
if (key == null) return putForNullKey(value);
...
modCount++; addEntry(hash, key, value, i);
return null;
}
public V get(Object key) {
if (key == null) return getForNullKey();
int hash = hash(key.hashCode());
...
return null;
}
...
}
package java.util;
public class Collections {
...
public static T CollectionT synchronizedCollection(CollectionT c) { ... }
public static T ListT synchronizedList(ListT list) { ... }
public static K,V MapK,V synchronizedMap(MapK,V m) { ... }
public static T SetT synchronizedSet(SetT s) { ... }
public static K,V SortedMapK,V synchronizedSortedMap(SortedMapK,V m) { ... }
public static T SortedSetT synchronizedSortedSet(SortedSetT s) { ... }
}
// 동기화가 필요한 List를 사용하고 싶을때
List list = Collections.synchronizedList(new ArrayList());
230.
230
java.lang.Object 다시 살펴보기
ThreadSynchronization
Monitor
Wakes up a single thread that is waiting on this object's monitor.
이 객체의 모니터(object's monitor)에서 대기중인 단일 스레드를 깨웁니다. 이 오브젝트에서 스레드가 대기중인 경우 스레드 중 하나가 활성화 되도록 선택
됩니다. 선택은 임의적이며, 어떻게 구현하느냐에 따라 다름니다. 스레드는 wait method 중 하나를 호출하여 오브젝트의 모니터에서 대기합니다.
깨어난 스레드는 현재 스레드가 이 객체에 대한 Lock을 해제할때까지 진행할 수 없습니다. 깨어난 스레드는 일반적인 방식으로 이 객체에서 동기화하기 위
해 경쟁하는 다른 스레드와 경쟁합니다. 예를 들어, 깨어난 스레드는이 객체를 잠그는 다음 스레드가 될 때 신뢰할 수 있는 특권이나 단점이 없습니다.
이 메소드는이 오브젝트 모니터의 소유자인 스레드에 의해서만 호출되어야합니다. 스레드는 다음 세 가지 방법 중 하나로 객체 모니터의 소유자가됩니다.
By executing a synchronized instance method of that object.
By executing the body of a synchronized statement that synchronizes on the object.
For objects of type Class, by executing a synchronized static method of that class.
한 번에 하나의 스레드 만 객체의 모니터를 소유 할 수 있습니다.
Causes the current thread to wait until another thread invokes the notify() method or the notifyAll() method for this object.
다른 스레드가이 객체에 대해 notify() 메소드 또는 notifyAll() 메소드를 호출하거나 지정된 시간이 경과 할 때까지 현재 스레드가 대기하도록합니다.
현재 스레드는이 객체의 모니터를 소유해야합니다.
이 메소드는 현재 스레드 (T라고 함)가 이 오브젝트에 대한 대기 세트에 자신을 배치 한 다음 이 오브젝트에 대한 모든 동기화 청구(synchronization claims)
를 포기합니다. 스레드 T는 스레드 스케줄링 목적으로 사용 불가능하게 되고 다음 4 가지 중 하나가 발생할 때까지 휴면 상태가됩니다.
Some other thread invokes the notify method for this object and thread T happens to be arbitrarily chosen as the thread to be awakened.
Some other thread invokes the notifyAll method for this object.
Some other thread interrupts thread T.
The specified amount of real time has elapsed, more or less. If timeout is zero, however, then real time is not taken into consideration and
the thread simply waits until notified.
그런 다음 스레드 T가이 오브젝트의 대기 세트에서 제거되고 스레드 스케줄링을 위해 다시 사용 가능합니다.
그런 다음 일반적인 방식으로 다른 스레드와 경쟁하여 개체에서 동기화 할 수 있습니다. 일단 객체의 제어권을 얻은 후에는 객체에 대한 모든 동기화 클레
임이 현재 상태 즉, 대기 메소드가 호출 된 시점의 상황으로 복원됩니다. 그런 다음 스레드 T는 wait 메소드 호출에서 리턴합니다. 따라서 wait 메소드에서
리턴 할 때 오브젝트와 스레드 T의 동기화 상태는 wait 메소드가 호출되었을 때와 정확히 같습니다.
스레드는 소위 spurious wakeup이라고 알리거나 중단하거나 시간 초과하지 않고 웨이크 업할 수 있습니다. 실제로는 거의 발생하지 않지만 응용 프로그램
은 스레드를 깨우 게해야하는 조건을 테스트하고 조건이 충족되지 않으면 계속 기다려야합니다.
즉, 대기는 항상 다음과 같이 루프에서 발생해야합니다.
이 메소드는이 오브젝트 모니터의 소유자 인 스레드에 의해서만 호출되어야합니다. 스레드가 모니터의 소유자가 될 수있는 방법에 대한 설명은 notify 메소
드를 참조하십시오.
231.
231
Monitor의 기능 -② Cooperation(=Scheduling) (1/2)
wait() 과 notify()
synchronized 메소드 안에서만 사용이 가능
Thread Synchronization
Monitor
232.
232
Monitor의 기능 -② Cooperation(=Scheduling) (2/2)
Cooperation의 상황 (Producer - Consumer)
카톡 메신저 클라이언트
Thread Synchronization
Monitor
Reader
Thread
Listen
Thread
Buffer full
Buffer empty
notify()
wait()
Reader Thread
Buffer가 찰 때까지 대기하다가, 꽉 차면 메시지를 화면에 보여주고
Buffer를 비운 다음에 다시 대기 상태로 빠진다.
wait()
Listener Thread
Buffer에 메시지를 기록하고
Buffer가 꽉 차면 Reader Thread에게 메시지를 읽어가라고 통지
Monitor의 동작 과정
233.
233
JVM 벤더의 Lock구현
JVM 벤더의 Lock 구현
Heavy-Weight Lock
Java Monitor Lock OS의 Mutex(Semaphore) 로 구현
Light-Weight Lock
Atomic Operation을 이용한 아주 가벼운 Lock Mutex와 같은 OS자원을 이용하지 않고 내부의 Operation만으로 동기화 처리
성능상의 이유로 Monitor Lock보다는 Light-Weight Lock을 사용하는 추세
대부분의 Object의 경우 Thread간의 경합이 발생하지 않는다는 것에 착안하여 구현
JVM 벤더마다 구현방식이 다름
Thread Synchronization
Hotspot JVM Synchronization
Thread
경합
Light-Weight Lock
(Atomic Operation)
Heavy-Weight OS Lock
(Monitor Lock)
NO
YES
Thread간의 경합이 발생하면 Heavy-Wait Lock으로 회귀
Thread간의 경합이 없이 자신이 Lock을 소유한 채로 다시 Object의
Critical Section에 진입 할 경우 Light-Weight Lock을 사용하여
Monitor Enter/Exit를 수행한다
234.
234
Hotspot JVM의 ObjectLayout
Mark Word
Garbage Collection과 Synchronization 작업에 사용
Thread Synchronization
Hotspot JVM Synchronization
Mark
Word
Class
Address
Object Data
31 9 8 2 1 0
Hash Code (Biased bit가 0일때)
Thread ID (Biased bit가 1일때)
Age
Biased
Tag
Hash Code 저장값
0 0 0 Light-Weight Locked Lock Record Address
0 0 1 Unlocked
0 1 0 Heavy-Weight Locked Monitor Address
0 1 1 Marked for GC Forwarding Address등등
1 - - Biased/Biasable
Thread ID
Based bit가 1일때 Biased Lock을 획득한 Thread ID를 기록
Hash Code
Biased bit가 0이고, 이전 Synchronization 작업 때 산출된 Hash Code가 있다면 Tag 값
에 따라 각각 다른값이 저장됨
Young Generation의 Object가
Eden과 Survivor를 넘나든 횟수
Biased Lock
Biased bit가 1이면 Biased Lock을 사용
Synchronization 작업을 수행할 때 Lock을 획
득하기 위한 연산을 수행하지 않고 가볍게
Lock을 획득함을 의미
Synchronization을 수행 하는지에 대한 상태
값만이 존재하므로 빠른 수행이 가능
Method Area의 Class 정보를
가리키는 Reference 정보가 저장
235.
235
Light-Weight Lock
Light-WeightLock의 구현
Compare-And-Swap(CAS) 이라고 하는 Atomic Operation을 사용하여
Light-Weight Lock을 구현
Stack Lock을 획득하면 Thread의 Stack Frame에 Mark Word가 이동
Displaced Mark
Thread Synchronization
Hotspot JVM Synchronization
Enter Critical Section
Enter Critical Section
Thread-1
CAS
수행
Stack Lock 획득
성공
Monitor Lock 획득 시도
실패
Light-Weight Locking의 경험적 지식
Atomic Operation조차 Multi-Processor 환경에서는 성능 저하가능성
대부분의 Lock은 경합이 없고 같은 Thread에서 반복적으로 Locking
한 Thread가 Lock을 재 획득 하는 것을 더욱더 가볍게 하자는 아이디어가 나타남
그러나 다른 Thread가 lock을 획득하는 것은 상대적으로 무거운 작업이 됨
그렇지만 상당히 드물기 때문에 전반적인 비용은 내려감
236.
236
Biased Lock
BiasedLocking
Java 6에서 default 기능으로 탑재
Java 5 update 6에서 처음 소개
Light Weight Lock의 성능문제의 문제
대부분의 Object는 lock을 소유한 thread가 다시 lock을 획득
이 경우에도 반복적으로 CAS를 수행
Biased Lock
처음 lock을 획득할 때만 CAS를 수행
이후부터는 그 Thread에 편향(biased)되어 lock에 대한 어떠한 CAS도 수행하지 않음
Biased Lock 관련 JVM 옵션
Thread Synchronization
Hotspot JVM Synchronization
옵션 설명 디폴트 비고
-XX:+UseBiasedLocking
biased lock의 사용여부를 설정
java 6부터 default
5.6+
-XX:BiasedLockingStartupDelay=0 JVM기동시 Delay second를 지정 6+
-XX:+TraceBiasedLocking Biased Lock을 Debugging 할 때 사용 6+
237.
237
sync_method.jsp
%@ page language=javacontentType=text/html; charset=UTF-8
pageEncoding=UTF-8%
%!
public static synchronized void sleep(long sleepMillisec) throws Exception {
if (sleepMillisec = 1000) {
Thread.sleep(sleepMillisec);
}
}
%
%
long sleepMillisec = Long.parseLong(request.getParameter(sleepMillisec));
sleep(sleepMillisec);
%
LAB) Thread Dump 생성 (1/4)
LAB 개요
synchronized 메소드를 동시에 여러 사용자가 호출할 때, JVM 내부적으로 수행되는 monitor 동작 방식을 관찰
Thread Synchronization
sync_method.jsp?sleepMillisec=100
sync_method.jsp?sleepMillisec=600000
238.
238
LAB) Thread Dump생성 (2/4)
Thread Synchronization
① STS 실행후 Tomcat v7.0 서버 실행
[root@jvmedu ~]# sts
② visualvm을 실행하고 visualgc 플러그인 설치
Applications 뷰에서 Local Tomcat 더블 클릭 Threads 탭 클릭
[root@jvmedu ~]# visualvm
239.
239
LAB) Thread Dump생성 (3/4)
Thread Synchronization
③ jadeedu_jvmswjava_toolapache-jmeter-5.4.1bin 폴더 하위의 jmeter.bat 파일 실행
④ 부하스크립트 파일 오픈 후 “UTG09, UTG10” Thread Group을 Enable한 후 부하를 발생시키고 Thread 모니터링 및 관찰
스크립트 파일 : jadeedu_jvmswjava_toolapache-jmeter-5.4.1jmxJvmTroubleshoot.jmx
Enable Thread Group : UTG05_Heap OOM
• UTG09_Synchronization 0.01초 미만
• UTG10_Synchronization 60초
부하 발생
240.
240
LAB) Thread Dump생성 (4/4)
Thread Synchronization
⑤ Tomcat 서버의 PID(Process ID)를 확인 후 jstack 명령을 이용하여 Thread Stack Trace 확인
[root@jvmedu ~]# jps -v | grep catalina
2128 Bootstrap -Dcatalina.base=/root/.workspace/.metadata/.plugins/org.eclipse.wst.server.core/tmp0 -Dcatalina.home=/root/tomcat7 -
Dwtp.deploy=/root/.workspace/.metadata/.plugins/org.eclipse.wst.server.core/tmp0/wtpwebapps -Djava.endorsed.dirs=/root/tomcat7/endorsed -
javaagent:/root/scouter/agent.java_6_7/scouter.agent.jar -Dscouter.config=/root/scouter/agent.java_6_7/conf/tomcat7.conf -
Djava.library.path=/root/lab/jni/ex02 -Xms512m -Xmx512m -Dfile.encoding=UTF-8
[root@jvmedu ~]# jstack 2128
2021-10-25 11:34:46
Full thread dump Java HotSpot(TM) 64-Bit Server VM (24.80-b11 mixed mode):
RMI TCP Connection(4)-192.168.56.96 daemon prio=10 tid=0x00007f6e24005000 nid=0x89e runnable [0x00007f6e4e49a000]
java.lang.Thread.State: RUNNABLE
at java.net.SocketInputStream.socketRead0(Native Method)
at java.net.SocketInputStream.read(SocketInputStream.java:152)
at java.net.SocketInputStream.read(SocketInputStream.java:122)
at java.io.BufferedInputStream.fill(BufferedInputStream.java:235)
at java.io.BufferedInputStream.read(BufferedInputStream.java:254)
- locked 0x00000000fd47b808 (a java.io.BufferedInputStream)
at java.io.FilterInputStream.read(FilterInputStream.java:83)
at sun.rmi.transport.tcp.TCPTransport.handleMessages(TCPTransport.java:549)
at sun.rmi.transport.tcp.TCPTransport$ConnectionHandler.run0(TCPTransport.java:828)
at sun.rmi.transport.tcp.TCPTransport$ConnectionHandler.access$400(TCPTransport.java:619)
at sun.rmi.transport.tcp.TCPTransport$ConnectionHandler$1.run(TCPTransport.java:684)
at sun.rmi.transport.tcp.TCPTransport$ConnectionHandler$1.run(TCPTransport.java:681)
at java.security.AccessController.doPrivileged(Native Method)
at sun.rmi.transport.tcp.TCPTransport$ConnectionHandler.run(TCPTransport.java:681)
at java.util.concurrent.ThreadPoolExecutor.runWorker(ThreadPoolExecutor.java:1145)
at java.util.concurrent.ThreadPoolExecutor$Worker.run(ThreadPoolExecutor.java:615)
at java.lang.Thread.run(Thread.java:745)
~~~
⑥ jstack 명령을 이용하여 Thread Dump 2개 생성
[root@jvmedu ~]# jstack 2128 thread_dump01.txt; sleep 10; jstack 2128 thread_dump02.txt
241.
241
Thread State Transition
ThreadSynchronization
Thread.start()
WAITING
Object.wait()
LockSupport.park()
Object.notify()
Object.notifyAll()
TIMED_WAITING
BLOCKED
Regain monitor lock,
Spurious wake-up
TERMINATED
RUNNABLE
Thread finishes execution,
Exception occured
Exception occurred
NEW
Time elapsed,
Regain monitor lock,
Spurious wake-up
상태 설명
NEW Thread state for a thread which has not yet started.
RUNNABLE
Thread state for a runnable thread.
A thread in the runnable state is executing in the
Java virtual machine but it may be waiting for other
resources from the operating system such as
processor.
BLOCKED
Thread state for a thread blocked waiting for a
monitor lock.
A thread in the blocked state is waiting for a monitor
lock to enter a synchronized block/method or
reenter a synchronized block/method after calling
Object.wait.
WAITING
A thread in the waiting state is waiting for another
thread to perform a particular action.
For example, a thread that has called Object.wait() on
an object is waiting for another thread to call
Object.notify() or Object.notifyAll() on that object.
A thread that has called Thread.join() is waiting for a
specified thread to terminate.
TIMED_WAITING
Thread state for a waiting thread with a specified
waiting time. A thread is in the timed waiting state
due to calling one of the following methods with a
specified positive waiting time:
• Thread.sleep
• Object.wait with timeout
• Thread.join with timeout
• LockSupport.parkNanos
• LockSupport.parkUntil
TERMINATED
Thread state for a terminated thread. The thread has
completed execution.
java.lang.Thread.State Enumeration
A thread can be in one of the following states:
A thread can be in only one state at a given point in time.
These states are virtual machine states which do not reflect any
operating system thread states.
Presentation
242.
242
Thread Dump 정보
ThreadSynchronization
http-bio-7080-exec-19 daemon prio=10 tid=0x00007f4e3800b800 nid=0x866 waiting for monitor entry [0x00007f4e844f7000]
java.lang.Thread.State: BLOCKED (on object monitor)
at org.apache.jsp.sync.sync_005fmethod_jsp.sleep(sync_005fmethod_jsp.java:20)
- waiting to lock 0x00000000e48a3a98 (a java.lang.Class for org.apache.jsp.sync.sync_005fmethod_jsp)
at org.apache.jsp.sync.sync_005fmethod_jsp._jspService(sync_005fmethod_jsp.java:96)
at org.apache.jasper.runtime.HttpJspBase.service(HttpJspBase.java:71)
at javax.servlet.http.HttpServlet.service(HttpServlet.java:728)
...
at org.apache.tomcat.util.threads.TaskThread$WrappingRunnable.run(TaskThread.java:61)
at java.lang.Thread.run(Thread.java:745)
http-bio-7080-exec-21 daemon prio=10 tid=0x00007f4e64009800 nid=0x868 waiting on condition [0x00007f4e842f5000]
java.lang.Thread.State: TIMED_WAITING (sleeping)
at java.lang.Thread.sleep(Native Method)
at org.apache.jsp.sync.sync_005fmethod_jsp.sleep(sync_005fmethod_jsp.java:21)
- locked 0x00000000e48a3a98 (a java.lang.Class for org.apache.jsp.sync.sync_005fmethod_jsp)
at org.apache.jsp.sync.sync_005fmethod_jsp._jspService(sync_005fmethod_jsp.java:96)
at org.apache.jasper.runtime.HttpJspBase.service(HttpJspBase.java:71)
at javax.servlet.http.HttpServlet.service(HttpServlet.java:728)
...
at org.apache.tomcat.util.threads.TaskThread$WrappingRunnable.run(TaskThread.java:61)
at java.lang.Thread.run(Thread.java:745)
VM Thread prio=10 tid=0x00007f4e98132000 nid=0x807 runnable
JNI global references: 426
쓰레드 이름
쓰레드 타입
우선순위 쓰레드 ID 쓰레드 상태
main thread
(Non-Daemon Thread)
243.
243
Thread Dump 분석도구
IBM Thread and Monitor Dump Analyzer for java
https://www.ibm.com/support/pages/ibm-thread-and-monitor-dump-analyzer-java-tmda
IBM + Hotspot JVM 모두 분석 가능
Thread Synchronization
ThreadLogic
https://github.com/sparameswaran/threadlogic/releases
244.
244
LAB) IBM TMDA를이용한 Thread Dump 분석
java -jar jca469.jar
Thread Synchronization
IBM TMDA 실행 후 샘플 Thread Dump 오픈
파일 위치 : C:jadeedu_jvmswjava_toolthread_dump_samplesync_method_thread_dump.txt
245.
245
Thread Dump 유형별패턴 #1
BLOCKED - 락을 획득하지 못하는 경우
한 스레드가 락을 소유하고 있어 다른 스레드가 락을 획득하지 못해 애플리케이션의 전체적인 성능이 느려지는 경우
Thread Synchronization
http-bio-7080-exec-19 daemon prio=10 tid=0x00007f4e3800b800 nid=0x866 waiting for monitor entry [0x00007f4e844f7000]
java.lang.Thread.State: BLOCKED (on object monitor)
at org.apache.jsp.sync.sync_005fmethod_jsp.sleep(sync_005fmethod_jsp.java:20)
- waiting to lock 0x00000000e48a3a98 (a java.lang.Class for org.apache.jsp.sync.sync_005fmethod_jsp)
at org.apache.jsp.sync.sync_005fmethod_jsp._jspService(sync_005fmethod_jsp.java:96)
at org.apache.jasper.runtime.HttpJspBase.service(HttpJspBase.java:71)
at javax.servlet.http.HttpServlet.service(HttpServlet.java:728)
...
at org.apache.tomcat.util.threads.TaskThread$WrappingRunnable.run(TaskThread.java:61)
at java.lang.Thread.run(Thread.java:745)
http-bio-7080-exec-21 daemon prio=10 tid=0x00007f4e64009800 nid=0x868 waiting on condition [0x00007f4e842f5000]
java.lang.Thread.State: TIMED_WAITING (sleeping)
at java.lang.Thread.sleep(Native Method)
at org.apache.jsp.sync.sync_005fmethod_jsp.sleep(sync_005fmethod_jsp.java:21)
- locked 0x00000000e48a3a98 (a java.lang.Class for org.apache.jsp.sync.sync_005fmethod_jsp)
at org.apache.jsp.sync.sync_005fmethod_jsp._jspService(sync_005fmethod_jsp.java:96)
at org.apache.jasper.runtime.HttpJspBase.service(HttpJspBase.java:71)
at javax.servlet.http.HttpServlet.service(HttpServlet.java:728)
...
at org.apache.tomcat.util.threads.TaskThread$WrappingRunnable.run(TaskThread.java:61)
at java.lang.Thread.run(Thread.java:745)
246.
246
Thread Dump 유형별패턴 #2
RUNNABLE - 원격 서버로부터 메시지 수신을 받기 위해 계속 대기하는 경우
쓰레드 상태는 RUNNABLE이지만 원격서버에 소켓통신시 응답 지연으로 Worker Thread가 부족해지는 경우
대부분 Top Stack이 “at java.net.SocketInputStream.socketRead0(Native Method)” 프레임이다.
Thread Synchronization
http-bio-7080-exec-24 daemon prio=10 tid=0x00007f71c0002000 nid=0x706 runnable [0x00007f716afec000]
java.lang.Thread.State: RUNNABLE
at java.net.SocketInputStream.socketRead0(Native Method)
at java.net.SocketInputStream.read(SocketInputStream.java:152)
at java.net.SocketInputStream.read(SocketInputStream.java:122)
at com.mysql.jdbc.util.ReadAheadInputStream.fill(ReadAheadInputStream.java:101)
at com.mysql.jdbc.util.ReadAheadInputStream.readFromUnderlyingStreamIfNecessary(ReadAheadInputStream.java:144)
at com.mysql.jdbc.util.ReadAheadInputStream.read(ReadAheadInputStream.java:174)
- locked 0x00000000fa627c18 (a com.mysql.jdbc.util.ReadAheadInputStream)
at com.mysql.jdbc.MysqlIO.readFully(MysqlIO.java:2966)
at com.mysql.jdbc.MysqlIO.reuseAndReadPacket(MysqlIO.java:3427)
at com.mysql.jdbc.MysqlIO.reuseAndReadPacket(MysqlIO.java:3417)
at com.mysql.jdbc.MysqlIO.checkErrorPacket(MysqlIO.java:3860)
at com.mysql.jdbc.MysqlIO.sendCommand(MysqlIO.java:2524)
at com.mysql.jdbc.MysqlIO.sqlQueryDirect(MysqlIO.java:2675)
at com.mysql.jdbc.ConnectionImpl.execSQL(ConnectionImpl.java:2465)
- locked 0x00000000fada1050 (a com.mysql.jdbc.JDBC4Connection)
at com.mysql.jdbc.PreparedStatement.executeInternal(PreparedStatement.java:1915)
- locked 0x00000000fada1050 (a com.mysql.jdbc.JDBC4Connection)
at com.mysql.jdbc.PreparedStatement.executeQuery(PreparedStatement.java:2023)
- locked 0x00000000fada1050 (a com.mysql.jdbc.JDBC4Connection)
at org.apache.tomcat.dbcp.dbcp.DelegatingPreparedStatement.executeQuery(DelegatingPreparedStatement.java:99)
at org.apache.tomcat.dbcp.dbcp.DelegatingPreparedStatement.executeQuery(DelegatingPreparedStatement.java:99)
at org.apache.jsp.sleep.db_005fsleep_jsp._jspService(db_005fsleep_jsp.java:116)
at org.apache.jasper.runtime.HttpJspBase.service(HttpJspBase.java:71)
at javax.servlet.http.HttpServlet.service(HttpServlet.java:728)
...
at org.apache.tomcat.util.threads.TaskThread$WrappingRunnable.run(TaskThread.java:61)
at java.lang.Thread.run(Thread.java:745)
247.
247
Thread Dump 유형별패턴 #3
WAITING - 공유리소스를 Pool로 관리할때 Pool 안의 객체가 부족할 때 대기하는 경우
DBCP(DataBase Connection Pool) 사용중 여유 DB Connection이 부족하면 Connection을 얻기 위해 대기하게 됨
대부분 Top Stack이 “at java.lang.Object.wait(Native Method)” 프레임
Thread Synchronization
http-bio-7080-exec-26 daemon prio=10 tid=0x00007f7190009000 nid=0x708 in Object.wait() [0x00007f716adeb000]
java.lang.Thread.State: WAITING (on object monitor)
at java.lang.Object.wait(Native Method)
- waiting on 0x00000000f705e740 (a org.apache.tomcat.dbcp.pool.impl.GenericObjectPool$Latch)
at java.lang.Object.wait(Object.java:503)
at org.apache.tomcat.dbcp.pool.impl.GenericObjectPool.borrowObject(GenericObjectPool.java:1128)
- locked 0x00000000f705e740 (a org.apache.tomcat.dbcp.pool.impl.GenericObjectPool$Latch)
at org.apache.tomcat.dbcp.dbcp.PoolingDataSource.getConnection(PoolingDataSource.java:115)
at org.apache.tomcat.dbcp.dbcp.BasicDataSource.getConnection(BasicDataSource.java:1103)
at org.apache.jsp.sleep.db_005fsleep_jsp._jspService(db_005fsleep_jsp.java:111)
at org.apache.jasper.runtime.HttpJspBase.service(HttpJspBase.java:71)
at javax.servlet.http.HttpServlet.service(HttpServlet.java:728)
...
at java.util.concurrent.ThreadPoolExecutor$Worker.run(ThreadPoolExecutor.java:615)
at org.apache.tomcat.util.threads.TaskThread$WrappingRunnable.run(TaskThread.java:61)
at java.lang.Thread.run(Thread.java:745)
248.
248
대표적인 병목 패턴및 진단 사례
공유자원에 대한 요청 시 발생하는 병목 패턴
Thread Synchronization
Presentation
250
JAVA 성능분석 도구비교
JAVA 성능분석 도구
JDK 내장 여부 도구
JMX
지원
Thread 분석 Heap 메모리 분석
용도/특징
Thread
Dump
Thread
분석
DeadLock
감지
Heap
Dump
Dump
분석
JDK 내장
JDK 7+
jcmd X O O O X 스크립트 기반 통합 기능
JMC O O O O O X
강력한 통합 분석 도구, JFR 기능
운영환경에서 라이선스 필요
JDK 6+ VisualVM O O O X O O OpenJDK 에는 내장되어 있지 않고, 추가 설치 필요
JDK 5+ Jconsole O O O O X X
3rd Party
TDA X X O O X X
MAT X X X X X O
IBM HA X X X X X O
251.
251
jcmd 명령 개요
jcmd
JDK 7+ 이상에 포함되어 있으며 $JAVA_HOME/bin 하위에 실행파일로 존재함
java 프로세스에 대한 기본적인 클래스 정보, 스레드 정보, VM 정보등을 제공
스크립트 방식으로 사용
이전 JDK에 흩어져 있는 여러 도구들을 통합한 기능을 제공
JAVA 성능분석 도구
jcmd
jcmd -h
Usage
jcmd pid | main class command ...|PerfCounter.print|-f file
or: jcmd -l
or: jcmd -h
Description
command must be a valid jcmd command for the selected jvm.
Use the command help to see which commands are available.
If the pid is 0, commands will be sent to all Java processes.
The main class argument will be used to match (either partially or fully) the class used to start Java.
If no options are given, lists Java processes (same as -p).
Option
PerfCounter.print display the counters exposed by this process
-f read and execute commands from the file
-l list JVM processes on the local machine
-h this help
252.
252
jcmd 에서 사용가능한하위 명령어
Java 프로세스 정보 확인하기
jcmd를 아무 매개변수 없이 사용하면 로컬에 실행되고 있는 Java PID와 실행중인 Main Class(또는 jar) 가 표시됨 → jcmd -l 과 같은 명령
JAVA 성능분석 도구
jcmd
윈도우10에서 Tomcat 8.5 실행 후 java 프로세스 목록 확인
C:jadeedu_jvmswjava_toolapache-tomcat-8.5.72bin 경로에서 startup.bat 실행
C: jcmd
212 sun.tools.jcmd.JCmd
2260 org.apache.catalina.startup.Bootstrap start → Tomcat 8.5 수행중임
특정 java 프로세스에 대해 수행가능한 명령어를 보기 위해 jcmd PID help 명령 수행
C: jcmd 2260 help
2260:
The following commands are available:
JFR.stop
JFR.start
JFR.dump
JFR.check
JFR : Java Flight Recorder 기능을 사용하여 JVM 상태를 녹화하는 기능
JFR은 개발단계에서는 무료지만, 운영 시스템에서는 라이선스 구입해야 함
VM.native_memory
VM.check_commercial_features
VM.unlock_commercial_features
VM.uptime
VM.dynlibs
VM.flags
VM.system_properties
VM.command_line
VM.version
VM.classloader_stats
JVM 인스턴스에 대한 기본 정보
GC.rotate_log
GC.class_stats
GC.class_histogram
GC.heap_dump
GC.finalizer_info
GC.heap_info
GC.run_finalization
GC.run
GC에 대한 기본 정보 및 GC 명령 수행
Thread.print
ManagementAgent.stop
ManagementAgent.start_local
ManagementAgent.start
기타 명령
help For more information about a specific command use 'help command'.
지원되는 명령은 실행중인 java
프로세스이 옵션에 따라 다름
253.
253
jcmd 하위 명령어도움말 보기
jcmd pid help sub-command
JAVA 성능분석 도구
jcmd
VM.uptime 명령어의 도움말을 출력해보고 사용방법을 숙지한 후 명령을 수행하여 java 프로세스의 수행시간을 확인해 보자
C:jcmd 2260 help VM.uptime
2260:
VM.uptime
Print VM uptime.
Impact: Low
Syntax : VM.uptime [options]
Options: (options must be specified using the key or key=value syntax)
-date : [optional] Add a prefix with current date (BOOLEAN, false)
C:jcmd 2260 VM.uptime
2260:
1699.678 s
254.
254
Java 프로세스 VM정보 확인 (1/3)
JAVA 성능분석 도구
jcmd
jcmd 명령을 이용하여 수행중인 java 프로세스의 VM 정보를 확인
명령어 설명
VM.version
JVM 버전 출력
C: jcmd 2260 VM.version
2260:
Java HotSpot(TM) 64-Bit Server VM version 25.231-b11
JDK 8.0_231
VM.command_line
java 프로세스 실행시 사용된 옵션 출력
C: jcmd 2260 VM.command_line
2260:
VM Arguments:
jvm_args: -Djava.util.logging.config.file=C:jadeedu_jvmswjava_toolapache-tomcat-8.5.72conflogging.properties -
Djava.util.logging.manager=org.apache.juli.ClassLoaderLogManager -Djdk.tls.ephemeralDHKeySize=2048 -
Djava.protocol.handler.pkgs=org.apache.catalina.webresources -Dignore.endorsed.dirs= -
Dcatalina.base=C:jadeedu_jvmswjava_toolapache-tomcat-8.5.72 -Dcatalina.home=C:jadeedu_jvmswjava_toolapache-
tomcat-8.5.72 -Djava.io.tmpdir=C:jadeedu_jvmswjava_toolapache-tomcat-8.5.72temp
java_command: org.apache.catalina.startup.Bootstrap start
java_class_path (initial): C:jadeedu_jvmswjava_toolapache-tomcat-
8.5.72binbootstrap.jar;C:jadeedu_jvmswjava_toolapache-tomcat-8.5.72bintomcat-juli.jar
Launcher Type: SUN_STANDARD
VM.flags
Print VM flag options and their current values.
C: jcmd 2260 VM.flags
2260:
-XX:CICompilerCount=3 -XX:InitialHeapSize=503316480 -XX:MaxHeapSize=8040480768 -XX:MaxNewSize=2680160256 -
XX:MinHeapDeltaBytes=524288 -XX:NewSize=167772160 -XX:OldSize=335544320 -XX:+UseCompressedClassPointers -
XX:+UseCompressedOops -XX:+UseFastUnorderedTimeStamps -XX:-UseLargePagesIndividualAllocation -XX:+UseParallelGC
모든 JVM flag정보(default값 포함)를 확인하려면 -all 옵션을 사용
C: jcmd 2260 VM.flags -all
255.
255
Java 프로세스 VM정보 확인 (2/3)
JAVA 성능분석 도구
jcmd
jcmd 명령을 이용하여 수행중인 java 프로세스의 VM 정보를 확인
명령어 설명
VM.system_properties
Print system properties.
C: jcmd 2260 VM.system_properties
2260:
#Fri Nov 29 17:44:51 KST 2019
java.vendor=Oracle Corporation
sun.java.launcher=SUN_STANDARD
catalina.base=C:jadeedu_jvmswjava_toolapache-tomcat-8.5.72
sun.management.compiler=HotSpot 64-Bit Tiered Compilers
catalina.useNaming=true
os.name=Windows 10
...
VM.unlock_commercial_features
JVM 상용기능인 JFR, Resource Management 기능을 사용할 수 있게 한다
C: jcmd 2260 VM.unlock_commercial_features
2260:
Commercial Features now unlocked.
VM.check_commercial_features
JVM 상용기능 목록 표시
C: jcmd 2260 VM.check_commercial_features
2260:
Commercial Features are unlocked.
Status of individual features:
Java Flight Recorder has not been used.
Resource Management is disabled.
Current Memory Restriction: None (0)
256.
256
Java 프로세스 VM정보 확인 (3/3)
JAVA 성능분석 도구
jcmd
jcmd 명령을 이용하여 수행중인 java 프로세스의 VM 정보를 확인
명령어 설명
VM.dynlibs
Print loaded dynamic libraries
C: jcmd 2260 VM.dynlibs
2260:
Dynamic libraries:
0x00007ff7173f0000 - 0x00007ff717427000 C:jadeedu_jvmswjava_tooljdk1.8.0_281binjava.exe
0x00007ffe18f60000 - 0x00007ffe19150000 C:WINDOWSSYSTEM32ntdll.dll
0x00007ffe17010000 - 0x00007ffe170c2000 C:WINDOWSSystem32KERNEL32.DLL
0x00007ffe16670000 - 0x00007ffe16913000 C:WINDOWSSystem32KERNELBASE.dll
...
VM.native_memory
Print native memory usage
C: jcmd 2260 help VM.native_memory
2260:
VM.native_memory
Print native memory usage
Impact: Medium
Permission: java.lang.management.ManagementPermission(monitor)
Syntax : VM.native_memory [options]
Options: (options must be specified using the key or key=value syntax)
summary : [optional] request runtime to report current memory summary, which includes total reserved and committed memory, along
with memory usage summary by each subsytem. (BOOLEAN, false)
detail : [optional] request runtime to report memory allocation = 1K by each callsite. (BOOLEAN, false)
baseline : [optional] request runtime to baseline current memory usage, so it can be compared against in later time. (BOOLEAN,
false)
summary.diff : [optional] request runtime to report memory summary comparison against previous baseline. (BOOLEAN, false)
detail.diff : [optional] request runtime to report memory detail comparison against previous baseline, which shows the memory
allocation activities at different callsites. (BOOLEAN, false)
shutdown : [optional] request runtime to shutdown itself and free the memory used by runtime. (BOOLEAN, false)
statistics : [optional] print tracker statistics for tuning purpose. (BOOLEAN, false)
scale : [optional] Memory usage in which scale, KB, MB or GB (STRING, KB)
257.
257
Java 프로세스 Thread정보 확인
JAVA 성능분석 도구
jcmd
jcmd 명령을 이용하여 수행중인 java 프로세스의 Thread 정보를 확인 → Thread Dump 내용 출력
명령어 설명
Thread.print
Print all threads with stacktraces.
C: jcmd 2260 Thread.print
2260:
2019-11-29 18:15:00
Full thread dump Java HotSpot(TM) 64-Bit Server VM (25.201-b09 mixed mode):
ajp-nio-8009-AsyncTimeout #47 daemon prio=5 os_prio=0 tid=0x000000002cf58800 nid=0x1320 waiting on condition [0x000000003253f000]
java.lang.Thread.State: TIMED_WAITING (sleeping)
at java.lang.Thread.sleep(Native Method)
at org.apache.coyote.AbstractProtocol$AsyncTimeout.run(AbstractProtocol.java:1154)
at java.lang.Thread.run(Thread.java:748)
ajp-nio-8009-Acceptor-0 #46 daemon prio=5 os_prio=0 tid=0x000000002cf54800 nid=0xbcc runnable [0x000000003243f000]
java.lang.Thread.State: RUNNABLE
at sun.nio.ch.ServerSocketChannelImpl.accept0(Native Method)
at sun.nio.ch.ServerSocketChannelImpl.accept(ServerSocketChannelImpl.java:422)
at sun.nio.ch.ServerSocketChannelImpl.accept(ServerSocketChannelImpl.java:250)
- locked 0x00000005c1cc6640 (a java.lang.Object)
at org.apache.tomcat.util.net.NioEndpoint$Acceptor.run(NioEndpoint.java:482)
at java.lang.Thread.run(Thread.java:748)
...
258.
258
JFR(Java Flight Recording)기능 사용하기 (1/4)
Java Flight Recording
실행중인 Java 애플리케이션의 진단 및 프로파일링 도구
운영중인 시스템에 부하를 거의 주지 않음
JVM에서 발생하는 event 데이터를 수집하여 분석정보로 활용 → “비행중인 비행기의 현재상태를 사진 찍듯이 기록”
JFR 이벤트
이벤트 정보
이벤트 종류
JAVA 성능분석 도구
jcmd
event 종류 설명 로깅 시점
instance event 즉시 발생하고, 발생 즉시 로깅됨 발생 즉시 로깅
duration event 시작시간과 종료시간 event 끝난 시점에 로깅
timed event duration event에 부가적으로 사용자가 정의한 임계값(threshold) 이상 지속된 event만 기록됨
sample event
(requestable event)
일정한 시간 간격으로 시스템 활동정보를 수집 설정 가능
event 이름 발생시간 event 정보(payload)
– event 전후의 CPU 사용량
– Java Heap 크기
– Lock Holder의 Thread ID
– event 지속시간
– event가 발생한 쓰레드의 stack trace 정보
259.
259
JFR(Java Flight Recording)기능 사용하기 (2/4)
jcmd 에서 JFR 개요
JAVA 성능분석 도구
jcmd
jcmd에서 사용가능한 JFR 하위 명령어 목록을 확인
명령 설명
JFR.start Starts a new JFR recording
JFR.stop Stops a JFR recording
JFR.check Checks running JFR recording(s)
JFR.dump Copies contents of a JFR recording to file. Either the name or the recording id must be specified.
JFR은 라이선스가 필요한 기능이라서 jcmd PID VM.unlock_commercial_features 명령을 이용하여 사용가능하도록 한다
C: jcmd 6224 VM.unlock_commercial_features
6224:
Commercial Features now unlocked.
→ JVM 시작시 JFR 레코딩 기능을 사용하려면 아래와 같은 옵션을 추가하여 JAVA 프로세스를 시작해야 함
-XX:+UnlockCommercialFeatures -XX:+FlightRecorder
260.
260
JFR(Java Flight Recording)기능 사용하기 (3/4)
jcmd를 이용하여 JFR 레코딩 수행 (1/2)
JFR.start
JAVA 성능분석 도구
jcmd
JFR.start 명령의 도움말 확인
C: jcmd 6224 help JFR.start
6224:
JFR.start
Starts a new JFR recording
Impact Medium: Depending on the settings for a recording, the impact can range from low to high.
Permission java.lang.management.ManagementPermission(monitor)
Syntax JFR.start [options]
Options
(options must be specified using the key or key=value syntax)
name : [optional] Name that can be used to identify recording, e.g. My Recording (STRING, no default value)
defaultrecording : [optional] Starts the default recording, can only be combined with settings. (BOOLEAN, false)
dumponexit : [optional] Dump running recording when JVM shuts down (BOOLEAN, no default value)
settings : [optional] Settings file(s), e.g. profile or default. See JRE_HOME/lib/jfr (STRING SET, no default value)
delay : [optional] Delay recording start with (s)econds, (m)inutes), (h)ours), or (d)ays, e.g. 5h. (NANOTIME, 0)
duration : [optional] Duration of recording in (s)econds, (m)inutes, (h)ours, or (d)ays, e.g. 300s. (NANOTIME, 0)
filename : [optional] Resulting recording filename, e.g. C:UsersuserMy Recording.jfr (STRING, no default value)
compress : [optional] GZip-compress the resulting recording file (BOOLEAN, false)
maxage : [optional] Maximum time to keep recorded data (on disk) in (s)econds, (m)inutes, (h)ours, or (d)ays, e.g. 60m, or 0 for no
limit (NANOTIME, 0)
maxsize : [optional] Maximum amount of bytes to keep (on disk) in (k)B, (M)B or (G)B, e.g. 500M, or 0 for no limit (MEMORY SIZE, 0)
jpetstore 웹어플리션을 수행중인 Tomcat8.5 WAS를 60초 동안 레코딩을 수행
C: jcmd 6224 JFR.start duration=60s filename=rec01.jfr
6224:
Started recording 1. The result will be written to:
D:javaapacheapache-tomcat-8.5.46binrec01.jfr
261.
261
JFR(Java Flight Recording)기능 사용하기 (3/4)
jcmd를 이용하여 JFR 레코딩 수행 (2/2)
JFR.check
JAVA 성능분석 도구
jcmd
JFR.check 명령의 도움말 확인
C: jcmd 6224 help JFR.check
6224:
JFR.check
Checks running JFR recording(s)
Impact Low
Permission java.lang.management.ManagementPermission(monitor)
Syntax JFR.check [options]
Options
(options must be specified using the key or key=value syntax)
name : [optional] Recording name, e.g. My Recording or omit to see all recordings (STRING, no default value)
recording : [optional] Recording number, or omit to see all recordings (JLONG, -1)
verbose : [optional] Print event settings for the recording(s) (BOOLEAN, false)
JFR 레코딩중인 Tomcat8.5 WAS에 대해서, 실행중인 JFR 레코딩의 상태를 확인
C: jcmd 6224 JFR.check
6224:
Recording: recording=1 name=rec01.jfr duration=1m filename=rec01.jfr compress=false (running)
C: jcmd 6224 JFR.check
6224:
No available recordings.
Use JFR.start to start a recording.
JFR 레코딩이
종료되었음
262.
262
JFR(Java Flight Recording)기능 사용하기 (4/4)
JFR 레코딩 분석
JMC(Java Mission Control)를 사용하여 JFR 레코딩 분석
실행위치 : C:jadeedu_jvmswjava_tooljdk1.7.0_80binjmc.exe
JAVA 성능분석 도구
jcmd
JMC를 실행한 후 rec01.jfr 파일을 열고 분석 부하상황에서 JFR파일 사이즈는
514 KB
rec01.zip
263.
263
jcmd GC 기능사용하기 (1/3)
jcmd에서 사용가능한 GC 하위 명령어
JAVA 성능분석 도구
jcmd
jcmd에서 사용가능한 GC 하위 명령어 목록과 간략한 설명
명령 설명
GC.rotate_log Force the GC log file to be rotated.
GC.class_stats Provide statistics about Java class meta data. Requires -XX:+UnlockDiagnosticVMOptions
GC.class_histogram Provide statistics about the Java heap usage
GC.heap_dump Generate a HPROF format dump of the Java heap
GC.finalizer_info Provide information about Java finalization queue
GC.heap_info Provide generic Java heap information
GC.run_finalization Call java.lang.System.runFinalization()
GC.run Call java.lang.System.gc()
264.
264
jcmd GC 기능사용하기 (2/3)
GC.class_histogram
클래스별 메모리 사용량을 조회하고 class histogram을 출력
Heap Dump보다는 세밀하지 않지만, 신속하게 대략적인 정보를 파악하는데 유용함
어떤 객체 타입이 메모리를 많이 사용하는지 빠르게 파악
JAVA 성능분석 도구
jcmd
GC.class_histogram 명령의 도움말 확인
C: jcmd 6224 help GC.class_histogram → Full GC를 수행한후 Live Object에 대해서 Heap 메모리 점유율 출력
6224:
GC.class_histogram
Provide statistics about the Java heap usage.
Impact High: Depends on Java heap size and content
Permission java.lang.management.ManagementPermission(monitor)
Syntax GC.class_histogram [options]
Options
(options must be specified using the key or key=value syntax)
-all : [optional] Inspect all objects, including unreachable objects (BOOLEAN, false)
jpetstore 웹어플리션을 수행중인 Tomcat8.5 WAS의 class histogram을 확인
C: jcmd 6224 GC.class_histogram class_histogram.txt
6224:
num #instances #bytes class name
----------------------------------------------
1: 75443 7634952 [C
2: 74025 1776600 java.lang.String
3: 3865 1666968 [B
4: 12061 1061368 java.lang.reflect.Method
5: 8152 1021144 [I
6: 7819 892608 java.lang.Class
7: 13148 866016 [Ljava.lang.Object;
8: 24056 769792 java.util.HashMap$Node
9: 16511 528352 java.util.concurrent.ConcurrentHashMap$Node
...
배열 시그니처 설명
[Z boolean 배열
[B byte 배열
[S short 배열
[I int 배열
[J long 배열
[F float 배열
[D double 배열
[C char 배열
[L 객체 배열
265.
265
jcmd GC 기능사용하기 (3/3)
GC.heap_dump
jmap 명령으로도 Heap Dump 생성이 가능하지만, jmap은 객체를 생성한 Stack Trace정보를 포함하지 않음
jmap -dump:format=b,file=file PID
jcmd PID GC.heap_dump 명령은 jmap보다 더 최신이며, 부하도 더 적으므로 jmap보다는 jcmd를 사용하자!!!
JAVA 성능분석 도구
jcmd
GC.heap_dump 명령의 도움말 확인
C: jcmd 6224 help GC.heap_dump
6224:
GC.heap_dump
Generate a HPROF format dump of the Java heap
Impact High: Depends on Java heap size and content. Request a full GC unless the '-all' option is specified
Permission java.lang.management.ManagementPermission(monitor)
Syntax GC.heap_dump [options] filename
Arguments Name of the dump file (STRING, no default value)
Options
Options: (options must be specified using the key or key=value syntax)
-all : [optional] Dump all objects, including unreachable objects (BOOLEAN, false)
jpetstore 웹어플리션을 수행중인 Tomcat8.5 WAS의 Heap Dump를 생성해 보자
C: jcmd 6224 GC.heap_dump jpetstoreHeapDump
6224:
Heap dump file created 절대경로를 생략하면 java 프로세스의
Working Directory 하위에 파일 생성됨
266.
266
Management Agent(Java ManagementExtention)기능 사용하기 (1/3)
jcmd에서 사용가능한 ManagementAgent 하위 명령어
JAVA 성능분석 도구
jcmd
jcmd에서 사용가능한 ManagementAgent 하위 명령어 목록과 간략한 설명
명령 설명
ManagementAgent.start
원격 JMX 모니터링을 위한 JMX 켜기
-Dcom.sun.management.jmxremote 자바옵션을 Java Process를 실행한것과 동일한 기능
ManagementAgent.start_local
로컬 JMX 모니터링을 위한 JMX 켜기
C: jcmd 6224 help ManagementAgent.start_local
6224:
ManagementAgent.start_local
Start local management agent.
Impact: Low: No impact
Syntax: ManagementAgent.start_local
ManagementAgent.stop
Stop remote management agent
C: jcmd 6224 help ManagementAgent.stop
6224:
ManagementAgent.stop
Stop remote management agent.
Impact: Low: No impact
Syntax: ManagementAgent.stop
267.
267
Management Agent(Java ManagementExtention)기능 사용하기 (2/3)
ManagementAgent.start (1/2)
원격 JMX 모니터링을 위해 JMX 기능 켜기
JAVA 성능분석 도구
jcmd
ManagementAgent.start 명령의 도움말 확인
C: jcmd 6224 help ManagementAgent.start
6224:
ManagementAgent.start
Start remote management agent.
Impact Low: No impact
Permission java.lang.management.ManagementPermission(monitor)
Syntax ManagementAgent.start [options]
Options
(options must be specified using the key or key=value syntax)
config.file : [optional] set com.sun.management.config.file (STRING, no default value)
jmxremote.host : [optional] set com.sun.management.jmxremote.host (STRING, no default value)
jmxremote.port : [optional] set com.sun.management.jmxremote.port (STRING, no default value)
jmxremote.rmi.port : [optional] set com.sun.management.jmxremote.rmi.port (STRING, no default value)
jmxremote.ssl : [optional] set com.sun.management.jmxremote.ssl (STRING, no default value)
jmxremote.registry.ssl : [optional] set com.sun.management.jmxremote.registry.ssl (STRING, no default value)
jmxremote.authenticate : [optional] set com.sun.management.jmxremote.authenticate (STRING, no default value)
jmxremote.password.file : [optional] set com.sun.management.jmxremote.password.file (STRING, no default value)
jmxremote.access.file : [optional] set com.sun.management.jmxremote.access.file (STRING, no default value)
jmxremote.login.config : [optional] set com.sun.management.jmxremote.login.config (STRING, no default value)
jmxremote.ssl.enabled.cipher.suites : [optional] set com.sun.management.jmxremote.ssl.enabled.cipher.suite (STRING, no default value)
jmxremote.ssl.enabled.protocols : [optional] set com.sun.management.jmxremote.ssl.enabled.protocols (STRING, no default value)
jmxremote.ssl.need.client.auth : [optional] set com.sun.management.jmxremote.need.client.auth (STRING, no default value)
jmxremote.ssl.config.file : [optional] set com.sun.management.jmxremote.ssl_config_file (STRING, no default value)
jmxremote.autodiscovery : [optional] set com.sun.management.jmxremote.autodiscovery (STRING, no default value)
jdp.port : [optional] set com.sun.management.jdp.port (INT, no default value)
jdp.address : [optional] set com.sun.management.jdp.address (STRING, no default value)
jdp.source_addr : [optional] set com.sun.management.jdp.source_addr (STRING, no default value)
jdp.ttl : [optional] set com.sun.management.jdp.ttl (INT, no default value)
jdp.pause : [optional] set com.sun.management.jdp.pause (INT, no default value)
jdp.name : [optional] set com.sun.management.jdp.name (STRING, no default value)
268.
268
Management Agent(Java ManagementExtention)기능 사용하기 (3/3)
ManagementAgent.start (2/2)
원격 JMX 모니터링을 위해 JMX 기능 켜기
JAVA 성능분석 도구
jcmd
jpetstore 웹어플리션을 수행중인 Tomcat8.5 WAS를 대상으로 JMX를 켜고, 원격 JMX 모니터링 정보를 제공하기 위해 17901 포트를 Open
C: jcmd 6224 ManagementAgent.start jmxremote.ssl=false jmxremote.port=17901 jmxremote.authenticate=false
jmxremote.autodiscovery=true
6224:
Command executed successfully
→ 아래 명령은 jcmd 명령과 동일한 JVM 옵션
-Dcom.sun.management.jmxremote
-Dcom.sun.management.jmxremote.port=17091
-Dcom.sun.management.jmxremote.ssl=false
-Dcom.sun.management.jmxremote.authenticate=false
-Dcom.oracle.management.autodiscovery=true
-Dcom.oracle.management.jmxremote.rmiserver.port=17091
jvisualvm을 이용하여 JMX 연결하고 모니터링 수행
269.
269
jcmd -vs- 다른도구 비교
jcmd
JDK7 이전의 여러 명령어를 통합하여 하나로 사용할 수 있도록 JDK7+에서 새로 만들어진 명령어
JAVA 성능분석 도구
jcmd
기능 jcmd 동일 기능 명령어
Java Process 목록 보기 jcmd jps -lm
Heap Dump jcmd PID GC.heap_dump jmap -dump PID
Heap Histogram jcmd PID GC.class_histogram jmap -histo PID
스레드 Dump jcmd Pid Thread.print jstack PID
시스템 설정정보 보기 jcmd PID VM.system_properties jinfo -sysprops PID
VM Flag 보기 jcmd PID VM.flags jinfo -flags PID
270.
270
JMC - 개요
Java Mission Control
JDK 6 기반의 JRockit JVM에 포함되어 있다가 JDK 7(7u40)에 포함되었음
운영에서 사용시는 상용 라이선스를 구매하여야 함
JMX를 이용한 실시간 모니터링 + JFR을 이용한 사후분석 기능 제공
JMX를 이용하여 JVM 프로세스 실행중에 동적으로 리소스 관리 가능
https://www.oracle.com/java/technologies/jdk-mission-control.html
JAVA 성능분석 도구
JMC
271.
271
JMC - 실시간모니터링 (1/2)
로컬 JVM을 JMX에 연결하기
JAVA 성능분석 도구
JMC
윈도우10에서 Tomcat 8.5 실행 후 java 프로세스 목록 확인
C:jadeedu_jvmswjava_toolapache-tomcat-8.5.72bin 경로에서 startup.bat 실행
JMC 실행 후 로컬에 실행중인 Java 프로세스를 확인하고 Context Menu에서 Start JMX Console을 클릭하여 모니터링 수행
C:jadeedu_jvmswjava_tooljdk1.7.0_80binjmc.exe
272.
272
JMC - 실시간모니터링 (2/2)
원격 JVM을 JMX에 연결하기
JAVA 성능분석 도구
JMC
jpetstore 웹어플리션을 수행중인 Tomcat8.5 WAS를 대상으로 JMX를 켜고, 원격 JMX 모니터링 정보를 제공하기 위해 17901 포트를 Open
C: jcmd 9076 ManagementAgent.start jmxremote.ssl=false jmxremote.port=17901 jmxremote.authenticate=false
jmxremote.autodiscovery=true
9076:
Command executed successfully
JMC 실행후 File → Connect → Create a new connection 선택
C:jadeedu_jvmswjava_tooljdk1.7.0_80binjmc.exe
273.
273
VisualVM
다운로드
https://visualvm.github.io/
최신버전
2.1.1 (2021.11.06 현재)
또는 Oracle JDK /bin폴더 하위에 jvisualvm.exe 존재
JAVA 성능분석 도구
VisualVM
전제조건 및 환경설정
JAVA8 이상 필요
/etc/visualvm.conf 파일에 JDK 경로 설정
설치
visualvm_211.zip 압축해제
디렉토리 구조
Linux용 실행파일
Windows용 실행파일
JDK8 이상 경로 설정
274.
274
VisualVM을 이용하여 원격JVM 모니터링 (1/7)
2가지 방법
JAVA 성능분석 도구
VisualVM
지원 기능
방법 장/단점 Overview Monitor Threads Sampler Profiler Visual GC
JMX 이용
장점 대부분의 기능지원
O O O O O X
단점 JVM 옵션 변경후 재시작 필요
jstatd 이용
장점
JVM 옵션을 사용하지 않으므로 재시작하지 않아도 됨
jstatd를 수행한 계정이 소유한 여러 JVM 모니터링 가능
O △ X X X O
단점 지원안되는 기능이 많음
275.
275
VisualVM을 이용하여 원격JVM 모니터링 (2/7)
① JMX 이용 (1/3)
JMX(Java Management Extension)를 이용하는 방법으로 JVM 시작 시 추가 옵션을 지정하여야 하며 JVM 재시작이 필요함
Tomcat v8.5 에 Remote JMX 연결하는 샘플
JAVA 성능분석 도구
VisualVM
톰캣 실행시 jmx 관련 JVM 옵션적용
-Dcom.sun.management.jmxremote.port=7091
-Dcom.sun.management.jmxremote.authenticate=false
-Dcom.sun.management.jmxremote.ssl=false
Tomcat 재시작후 JVM에서 JXM 포트를 LISTEN 하고 있는지 확인
[root@jvmedu ~]# netstat -napt | grep LISTEN | grep java
(Not all processes could be identified, non-owned process info
will not be shown, you would have to be root to see it all.)
tcp 0 0 172.21.111.42:4000 0.0.0.0:* LISTEN 7042/java
tcp 0 0 0.0.0.0:32896 0.0.0.0:* LISTEN 7042/java
tcp 0 0 127.0.0.1:8005 0.0.0.0:* LISTEN 7042/java
tcp 0 0 0.0.0.0:8009 0.0.0.0:* LISTEN 7042/java
tcp 0 0 0.0.0.0:8080 0.0.0.0:* LISTEN 7042/java
tcp 0 0 0.0.0.0:7091 0.0.0.0:* LISTEN 7042/java
tcp 0 0 0.0.0.0:45496 0.0.0.0:* LISTEN 7042/java
Visual VM 시작
STS Tomcat 실행
옵션에 적용
276.
276
VisualVM을 이용하여 원격JVM 모니터링 (3/7)
① JMX 이용 (2/3)
JAVA 성능분석 도구
VisualVM
Remote Add Remote Host
Add JMX Connection
-Dcom.sun.management.jmxremote.port=7091
원격 HOST 등록
192.168.56.96
192.168.56.96
192.168.56.96
277.
277
VisualVM을 이용하여 원격JVM 모니터링 (4/7)
① JMX 이용 (3/3)
JAVA 성능분석 도구
VisualVM
모니터링이 적용된 모습
278.
278
참고) jstatd
JAVA 성능분석도구
VisualVM
https://docs.oracle.com/javase/8/docs/technotes/tools/unix/jstatd.html
JVM 모니터링시 모든 자원에 접근할수 있도록 policy 파일을 생성한다.
[root@jvmedu ~]$ vi jstatd.all.policy
grant codebase
file:${java.home}/../lib/tools.jar{
permission java.security.AllPermission;
};
1099(default)포트를 사용하여 jstatd 를 실행
[root@jvmedu bin]$ jstatd -J-Djava.security.policy=./jstatd.all.policy -p 1099
-- 백그라운드로 실행하고 싶을때
nohup jstatd -J-Djava.security.policy=./jstatd.all.policy -p 1099 /dev/null 21
jstatd 와 rmiregistry
원칙적으로는 rmiregistry 1099 포트를 이용하여 먼저 실행한 뒤에 jstatd를 실행해야 하지만
jstatd가 스스로 RMI Registry가 없으면 생성한다.
279.
279
VisualVM을 이용하여 원격JVM 모니터링 (5/7)
② jstatd 이용 (1/3)
jstatd 데몬을 이용하여 JVM을 수행한 계정에 종속된 여러 JVM을 한꺼번에 모니터링 가능
JAVA 성능분석 도구
VisualVM
JVM 모니터링시 모든 자원에 접근할수 있도록 policy 파일을 생성한다.
[tomcat6adm@was1 ~]$ vi jstatd.all.policy
grant codebase
file:${java.home}/../lib/tools.jar{
permission java.security.AllPermission;
};
1099(default)포트를 사용하여 jstatd 를 실행
[tomcat6adm@was1 bin]$ jstatd -J-Djava.security.policy=./jstatd.all.policy -p 1099
-- 백그라운드로 실행하고 싶을때
nohup jstatd -J-Djava.security.policy=./jstatd.all.policy -p 1099 /dev/null 21
280.
280
VisualVM을 이용하여 원격JVM 모니터링 (6/7)
② jstatd 이용 (2/3)
JAVA 성능분석 도구
VisualVM
Remote Add Remote Host
Add jstatd Connection
디폴트 포트인 1099 사용시 원격호스트를 연결하면 바로 모니터링 시작
원격 HOST 등록
jstatd -J-Djava.security.policy=./jstatd.all.policy -p 1099
192.168.56.96
192.168.56.96
192.168.56.96
281.
281
VisualVM을 이용하여 원격JVM 모니터링 (7/7)
② jstatd 이용 (3/3)
JAVA 성능분석 도구
VisualVM
CPU 모니터링 안됨
192.168.56.96
모니터링이 적용된 모습
286
Garbage Collection
GarbageCollection
JVM의 heap은 new, newarray, anewarray, multianewarray instruction을 통해 메모리의 할당이 가능하나 해제하는 instruction은 없음
더 이상 사용하지 않는 Un-Referenced Memory에 대해, Garbage Collector가 자동으로 메모리를 해제하여, 메모리의 재사용과
Fragmentation 방지하는 작업
Garbage Collection을 통해 자동으로 메모리 해제
메모리의 해제란 Heap 이나 Method Area에 있는 특정한 Object를 Memory에서 삭제하는 행위
JVM의 Spec에는 공식적인 Garbage Collection Algorithm은 없음
Garbage Collector 정의 (JAVA 8 Spec, section 2.5.3)
Heap은 Object를 위한 메모리 공간이고 Garbage Collector 라고 하는 자동화된 시스템에 의해 Heap은 재사용될 수 있다. 그리고 Object 는
절대로 명시적으로 해제 되지 않는다. (Heap storage for objects is reclaimed by an automatic storage management system (known as a
garbage collector); objects are never explicitly deallocated.)
The Java Virtual Machine assumes no particular type of automatic storage management system, and the storage management
technique may be chosen according to the implementor's system requirements.
The heap may be of a fixed size or may be expanded as required by the computation and may be contracted if a larger heap becomes
unnecessary. The memory for the heap does not need to be contiguous.
Garbage Collection
저는 더 이상 참조가 되지 않는 object를 제거하여 Heap memory를 재사용할 수 있도록 하는 일을 하고 있습니다.
이런 일을 Garbage Collection 이라 하는데 이는 Memory Recycling은 물론 Heap Fragmentation을 방지하는 효과도 있답니다.
저로 인해 개발시 Memory 관련 문제에서 해방되어 생산성이 향상되었다고도 하구요, Memory 문제로 인해 System이 Crash되는
일도 많이 줄었다고들 합니다.
그런데 제가 가끔 일을 하는 동안 Program의 성능이 저하되기도 하고 제가 예기치않게 나타나 CPU Time의 Scheduling에
어려움을 호소하는 경우도 있기는 합니다.
287.
287
Garbage Collection의 대상
Garbage 란?
Heap 과 Method Area 에서 현재 사용되지 않는 Object
Garbage Collection
Root Set과의 관계로 판단
Root Set에서 어떤식으로든 Reference 관계가 있다면 Reachable Object라고 한다
Reachable Object 종류
① Stack의 Object 참조 정보
② Method Area에 Loading 된 Class, 그 중에서도 Constant Pol 에 있는
Reference 정보
③ Native Method 로 넘겨진 Object Reference 로딩된 Class의 Constant
Pool내의 Reference
Unreleased Native Method로
넘겨진 Object Reference
Local Variable, Operand
Stack의 참조 정보
288.
288
Reachable Object
① Stack의Object Referenc
② Method Area에 Loading 된 Class, 그 중에서도 Constant Pool 에 있는 Reference 정보
③ Native Method 로 넘겨진 Object Reference
Garbage Collection
Runtime Data Area
Permanent Area
Heap
Object
Object
Object
Object
Object
Stack
Stack
Stack
Stack
Stack
Stack
Stack
Stack Frame
Stack Frame
Stack Frame
JNI ...
Method Area
or
Class Object
Method Area
or
Class Object
Method Area
or
Class Object
1 2
3
UnReachable !!!
289.
289
Garbage Collection과 Fragmentation
Fragmentation
Garbage 메모리 회수 후 Heap Memory가 듬성 듬성 HOLE이 생기는 현상
이러한 경우, 메모리의 개별 Free Space 의 크기 보다 큰 Object 에게 공간을 할당할수 있을까?
JVM은 Fragmentation을 방지하기 위해 Compaction 알고리즘을 사용함
Garbage Collection
Live
Garbage
Live
Live
Garbage
LIve
Garbage
Live
Live
Free (1K)
Live
Live
Free (3K)
LIve
Free (2K)
Live
Garbage
Collection
Total Free Space (6K)
Object (5K)
5K Object
할당이 가능한가?
290.
290
Garbage Collection의 동작원리를 이해하기 위한 6가지 알고리즘
1) Reference Counting Algorithm
2) Mark-and-Sweep Algorithm
3) Mark-and-Compacting Algorithm
4) Copying Algorithm
5) Generational Algorithm
6) Train Algorithm
7) Adaptive Algorithm
Garbage Collection
알고리즘의 기본 구성
Garbage Object의 Detection
Reachable Object가 아닌 Object
Garbage Object 제거
291.
291
① Reference CountingAlgorithm (1/2)
알고리즘 개요
초기의 대표적인 GC전략 -- Detection에 초점
각 Object의 Reference Count를 관리
Reference Count가 0이면 GC의 대상이 됨
특정 Object가 GC되고 이 Object에 참조되는 Object
가 있다면 참조되는 Object의 Count도 감소하여 연쇄
적으로 Count의 변동을 줌
장점
Garbage Object의 인지가 쉬움
Garbage를 확인하기 위해 멈출 필요가 없음
Garbage Collector가 구동하는 시점에 제약이 없음
(실시간가능)
단점
Reference Count의 관리 비용이 너무 큼
Linked List와 같은 형태의 순환 참조의 경우 각각의
Reference Count가 0이 되지 않기 때문에 Memory
Leak의 위험이 상존
Garbage Collection
시뮬레이션
① 참조 카운트가 2로 증가하는 경우
② 참조 카운트가 0이 되어 GC 대상이 되는 경우
1
Ref Count 1
Object a = new Ingeter(1);
Object b = a;
a
b 1
2
③ 연쇄적인 참조 카운트 갱신으로 인한 오버헤드 발생
2
Ref Count
1
Ref Count
Object a = new Ingeter(1);
Object b = new Ingeter(2);
a
b
1
1
a = b;
0
2
GC
GC
ref
Ref Count 1
Object a = new TwoIngeter(new Integer(1), new Integer(2));
a = null;
a
1
TwoInteger
2
Ref Count
1
Ref Count 1
1
0
GC
GC
0
0
GC
GC
GC
GC
292.
292
① Reference CountingAlgorithm (2/2)
Memory Leak 가능성이 높음
Linked List와 같은 형태의 순환 참조의 경우 각각의 Reference Count가 0이 되지 않기 때문에 Memory Leak의 위험이 상존
Garbage Collection
next ref
Ref Count
Linked List
2
a
next ref
Ref Count
Linked List
1
next ref
Ref Count
Linked List
1
1
293.
293
② Mark Sweep Algorithm
알고리즘 개요
Tracing Algorithm이라고도 하며, Reference Counting Algorithm의 단점을 개선
Root Set에서 시작하여 Reference 관계를 추적
Garbage Detection에 우수한 성능을 보여 이후의 GC방식의 Detection은 대부분 이 알고리즘을 사용
Mark 단계와 Sweep단계로 나뉨
Mark 단계
Root Set에서 Reference관계가 있는 Object에 Marking -- Live Object를 찾아 Mark
Object Header내의 flag 또는 별도의 bitmap table등을 이용
Sweep 단계
Heap내의 Marking되지 않은 Object를 제거
Sweep이 완료된 이후에는 모든 Object 의 Marking 정 보를 초기화
장점
Reference 관계를 정확하게 파악
Reference 관계를 맺을 때 부가적인 Overhead가 전혀 없음
단점
Suspend 현상
Mark 작업의 정확성 과 Memory Corruption을 방지하기 위해 “Stop the World” 발생
Fragmentation의 문제
충분한 Memory의 총량이 있음에도 할당이 불가능한 사태가 발생 가능
Garbage Collection
Root Set
ref
flag
ref
flag
ref
flag
ref
flag
ref
flag
ref
flag
ref
flag
ref
flag
ref
flag
Mark Phase
Sweep Phase
294.
294
③ Mark Compacting Algorithm (1/2)
알고리즘 개요
Mark Sweep Algorithm 의 Fragmentation 단점을 극복하고자 Sweep 단계 대신 Compaction(Sweep 포함)을 추가로 포함한 알고리즘
Fragmentation과 Memory 공간의 효율화를 위한 Algorithm
Mark 단계와 Compaction단계로 구분
Mark 단계
Live Object를 Mark
Compaction 단계
Live Object를 연속된 Memory장소에 차곡차곡 적재
보통 하위 Address 로 Compaction 을 수행
Compaction의 종류
Garbage Collection
Compaction 전
Compaction 방식 특징 Compaction 후
Arbitrary
(임의적인)
Compaction이 무작위로 진행 되어 순서가 보장되지 않는 방식
Linear
Reference 의 순서 대로 정렬하는 Compaction 방식
Compaction을 위해 Reference 순서를 따지는데서 Overhead 발생
메모리 상에 근접해 있어도 포인터로 참조되기 때문에 장점이 되지 못함
Sliding
할당된 순서로 정렬되는 방식
Heap 은 보통 하위 Address 부터 할당을 시 작하기 때문에 할당 순서는
Address 순서가 되는 경우가 많다 -- 가장 효율 좋은 방식
1 2 3 4
할당 순서 : 1 → 2 → 3 → 4
참조 순서 : 1 → 3 → 4 → 2
1 3 4 2
1 2 3 4
4 1 2 3
295.
295
③ Mark Compacting Algorithm (2/2)
Handle 자료구조
Compaction을 원할하게 하기 위해 사용
장점
Fragmentation 방지
Memory공간의 효율성을 기할 수 있음
단점
Reference 업데이트 시 Object를 Access
에 따른 Overhead가 존재
Suspend 현상
Garbage Collection
T11 T12
T21 T22
T31 T32
T22
T11
T12
T21
T31
Handle
0
1
2
3
4
5
6
7
8
9 T32
Root Set
2
2
C
3
Q
7
W
1
Z
5
A
9
B
Mark Phase
Compation Phase
flag
flag
flag
flag
flag
flag
flag
flag
flag
flag
T12
T21
296.
296
④ Copying Algorithm
알고리즘 개요
Stop-the-Copy Algorithm이라고도 함
Heap을 Active영역과 Inactive영역으로 나누어 사용
Active영역에만 Object가 생성
Active영역이 다 차면 Live Object만 Inactive로 Copy
Object 를 Copy 할 때 각각의 Reference 정보도같이 변경
Copy 할때 한쪽 방향에서부터 차곡차곡 적재를 하므로 Compaction 효과
Scavenge
장점
Fragmentation 방지
Inactive 영역으로 Copy할 때 연속된 메모리 공간을 할당
단점
GC중 Suspend현상
Copy에 대한 Overhead
공간 활용 측면에서 비효율
Garbage Collection
Root Set
A
B
c
Active Area
A' B' C'
Inactive Area
297.
297
⑤ Generational Algorithm
알고리즘 개요
Copying Algorithm에서 경험을 체득
Copy의 부하가 큼
대부분의 프로그램에서 생성되는 대다수의 Object는 매우 수명이 짧음
대부분의 프로그램은 수명이 매우 긴 몇 개의 Object를 가지고 있음
Long Lived Object를 계속해서 복사함
Heap을 age별로 몇 개의 sub heap으로 나누어 Youngest
Generation Sub heap을 자주 GC
Object가 성숙되면 다음 Generation으로 이동 ―▶ Promotion
특징
각 Sub Heap에서 Mark-and-Sweep 이나 Copying 등의
Algorithm을 가미하여 사용이 가능
Fragmentation, Memory 자원 활용, Copy부하 등의 각 부분의 단
점을 극복할 여지가 많음
현재 여러 JVM 벤더에서 채택하고 있는 추세
Garbage Collection
Youngest Generation Sub Heap
Dead
Dead
Dead
Dead
Dead
Dead
Dead
Matured
Matured
Matured
Matured
Matured
Matured
Live
Live
Live Live
Live
Oldest Generation Sub Heap GC
GC
298.
298
⑥ Train Algorithm(1/2)
알고리즘 개요
“Heap Memory를 작은 조각인 Train으로 나누어 각각 따로 Mark-and-Copy GC를 수행” ―▶ Incremental Algorithm
GC로 인한 Suspend 시간을 줄여 실시간에서의 부담을 줄이자는 Idea
GC를 수행하는 단위가 Single Block 인 만큼 전체 Heap 의 Suspend 가 아닌 GC중인 Memory Block 만 Suspend 가 발생
Suspend 를 분산시켜 전체적인 PauseTime 을 줄이자는 아이디어
Garbage Collection
RememberSet
A B C
RememberSet
A' B' C'
Train
Car
개별 Memory Block이며, Fixed Size임
Car(객차)로 구성되며 필요한 경우 Car의 추가가 가능
외부 Car 또는 Root-Set
에서의 참조 정보를 저장
장점
Suspend를 분산하여 장시간 동안의 대기 현상을 피할 수 있음
단점
전체적인 Suspend시간은 더 길어질 수도 있음
Fragmentation의 가능성이 있음
299.
299
⑥ Train Algorithm(2/2)
Garbage Collection
D E F
R1 Car 1-1 Car 1-2
{R2, B}
G
R2 Car 2-1
A B
Car 3-1
A B
{R1}
C
Car 1-3
C
{R1,E}
Free Car Free Car Free Car
{C}
Free Train
300.
300
⑦ Adaptive Algorithm
Algorithm마다 항상 Trade Off관계가 존재
상황에 맞는 적절한 Algorithm의 선택이 중요
Adaptive Algorithm은 특정 Algorithm을 지칭하는 것은 아님
Heap의 현재 상황을 모니터링 하여 적절한
Algorithm을 선택 적용
Hotspot의 Ergonomic기능, IBM의 Tilt기능 등이 좋은 예
수행중 변경이나 Application특성에 맞게끔 선택하는 것은 아직 요원
Garbage Collection
301.
301
Hotspot JVM 의Garbage Collection
Garbage Collection
1) Garbage Collection of Hotspot JVM
2) Heap of Hotspot JVM
3) Garbage Collector의 종류
4) Serial Collector
5) Incremental Collector
6) Parallel Collector
7) Parallel Compacting Collector
8) CMS Collector
9) Garbage First Collector
302.
302
Hotspot JVM의 GarbageCollection
가장 큰 특징은 Generation Collection 방식을 사용
Heap 을 Young Generation 과 Old Generation 의 두 영역으로 나누어 사용
Generation별로 Garbage Collection을 수행
Garbage Collection
HotSpot JVM GC
Speed를 강조 : Fast Allocation TLAB 효율성을 강조 – Card Table Write Barrier
Young Generation Old Generation
Eden
Survivor
Virtual
Tenured
Virtual
From To
-Xmn(Young Generation Size)
-Xms(Initial Heap Size)
-Xmx(Maximum Heap Size)
Name 설명 비고
Young Generation object가 생성되면 이 영역에 저장되었다가 시간이 지남에 따라 해제되지 않는 object들은 Old Generation으로 옮겨짐(Promotion)
Minor
GC
Eden Object가 최로 할당되는 곳
Survivor GC후 Alive객체가 Copy 되는곳, Old Generation 으로 가기 위한 대기 장소
Old Generation
성숙된 Object들이 Promotion 되는 장소
Object Size에 따라 Young에 할당되지 않고 Old에 할당될수도 있음
Major
GC
303.
303
Weak Generational Hypothesis(약한 세대 가설)
① 높은 유아 사망률(High Infant Mortality)
Object 는 대부분 새로 생 겨 난 후 얼마 되 지 않아 Garbage 가 된다
그렇기 때문에 새로 할당되는 Object가 모여 있는 곳에서는 Fragmentation 의 발생 확률이
아주 높다
Sweep이나 Compaction은 아주 비싼 작업이므로, 할당만은 위한 Eden공간을 마련하고
Fragmentation으로 Copy 알고리즘으로 해결하기 위해서 Live Object를 이동하는 영역으로
Survivor 공간을 마련
오랫동안 지속되는 Older Object를 위해 Old Generation을 구분하여 Garbage가 될 확률이
적은 Object를 따로 관리
Garbage Collection
HotSpot JVM GC
② Few References from Older to Younger Objects Exists
Older Object 가 Younger Object 를 참조하는 일은 상당히 드물지만, 가능한 시나리오이기 때문에 존재 여부를 체크해야 함
존재 여부를 체크하기 위해 Old Generation처럼 큰 Heap을 모두 조사하게 되면 Suspend 시간이 길어지게 된다.
이러한 존재여부를 효율적으로 체크하기 위해 Hotspot JVM은 Card Table과 Write Barrier라는 장치를 마련
Young Generation
Old Generation
Card Table
Card Table
1 Byte Card / 512 Byte of Old Generation
Young Object를 참조하는 Old Object가 있다면, 그 Old Ojbect의
시작주소에 해당하는 Card를 Dirty로 표시
Reference의 존재 여부를 빠르게 파악 가능
Write Barrier
Execution Engine(Bytecode Interpreter)내에 포함된 Code로 Old
Ojbect가 Young Obect로 Reference관계가 맺어지면 수행되는
Code로 Card에 Dirty로 표시하는 Atomic Operation
JVM내에서는 2개의 native instruction만으로 처리 가능
304.
304
Bump-the-Pointer 와 TLAB
Bump-the-Pointer
메모리 할당의 효율성을 높이기 위해 할당된 메모리의 바로 뒤에 메모리를 할당하여, Free List를 검색하는 등의 부가적인 작업 없이 신속하
게 할당하는 방식의 장점이 있으나, 동기화 이슈가 발생하는 단점 존재
Multi-Thread 환경에서 여러 Thread가 가장 최근 할당된 Object 뒤의 공간을 동시에 요청하면, 순간적인 메모리 변경을 위한 Heap Lock이 발생
Garbage Collection
HotSpot JVM GC
T2
T1
Allocation
T3 T4 T5
Synchronization
Wait
TLAB (Thread Local Allocation Buffer)
Bump-the-Pointer 방식의 단점을 보완하기 위해서, Thread 마다 할당을 위한 주소의 범위를 부여하여 그 범위 내에서는 아무런 동기화 작업
없이 할당을 가능하게 하는 방법
TLAB내에서는 동기화 이슈 없음
Allocation code내에 약 10개의 native instruction으로 구현 가능
T2
T1
Allocation
T3 T4 T5
Allocation Allocation Allocation Allocation
TLAB
305.
305
Hotspot JVM의 HeapSizing 관련 Option
Garbage Collection
HotSpot JVM GC
구분 옵션 설명 디폴트 비고
Standard
-server Server Hotspot VM 으로 구동
-client Cient Hotspot VM 으로 구동
Non-
standard
-Xmssize Heap 의 초기 크기를 지정
-Xmxsize Heap 의 최대 크기를 지정
-Xmnsize Young Generation 의 크기 를 지정 1.4.0 버전에서 추가됨
-XX
option
-XX:MinHeapFreeRatio=percent
전체 Heap 대비 Free Space 가 지정된 수치 이하면 Heap을 확장
한계는 -Xmx 에 지정된 수치까지
40
-XX:MaxHeapFreeRatio=percent
전체 Heap 대비 Free Space 가 지정된 수치 이상면 Heap을 축소
한계는 -Xms 에 지정된 수치까지
70
-XX:NewRatio=value
Young/Old Generation 크기의 비율
값이 n 이 라면 Young:Tenured의 비 율은 1:n 이 다.
Sever class : 2
Client class
• = 1.3 : 4
• = 1.3.1 : 8
• Intel 계열 CPU : 12
-XX:NewSize=size Young Generation 의 초기 크기를 지정
Intel 계열 : 640 Kbytes
그외 : 2.125 Mbytes
-XX:MaxNewSize=size Young Generation 의 최대 크기를 지정
1.4 버전부터 NewRatio 값에 따라
자동으로 계산됨
-XX:SurvivorRatio=value
Eden/Survivor 공간의 비율을 지정
값이 n 이 라고 가정 하면 Eden:Survivor1:Survivor2 의 비율은 n:1:1 이 된다
8
-XX:TargetSurvivorRatio=value
Survivor Area 가 MinorGC 를 유발하는 비율
Default는 50 이고, 이는 Survivor Area 가 50%만 차도 Full 이라고 인식하고
MinorGC 가 발생하게 된다
50
-XX:PermSize=size Permanent Area 의 초기 크기를 지정
-XX:MaxPerSize=size Permanent Area 의 최대 크기를 지정 64 Mbytes
306.
306
Automatic Selection
Java5부터자동으로 Garbage Collector, Heap Size등을 자동으로 선택
Hardware Resource와 OS정보가 기준
Sever Class와 Client Class의 구분
관련 option
-server
-client
Garbage Collection
HotSpot JVM GC
Server Class Client Class
기준
2개 이상의 CPU
2G 이상의 RAM
Default Garbage
Collector
Parallel Collector Serial Collector
Initial Heap Size 32 Mbyte 4 Mbytes
Max Heap Size ? 64 Mbytes
Runtime Compiler Server Runtime Compiler Client Runtime Compiler
307.
307
Hotspot JVM GarbageCollector
Garbage Collection
HotSpot JVM GC
종류 Option
Collection Algorithm
Young Old
Serial Collector -XX:+UseSerialGC Generational Mark Compacting
Parallel Collector -XX:+UseParallelGC Parallel Copy Mark Compacting
Parallel Compacting Collector -XX:+UseParallelOldGC Parallel Copy Parallel Compacting
CMS Collector -XX:+UseConMarkSweepGC Parallel Copy Concurrent Mark-Sweep
G1 Collector -XX:+UseG1GC Snapshot-At-The-Beginning (SATB)
308.
308
Serial Collector
1개의Thread를 가지고 GC를 수행
Young / Old Generation 모두 Serial로 Single CPU를 사용
Client-class의 기본 Collector
현재는 거의 사용되지 않는 Collector
Heap의 크기가 점점 커지면서 Suspend 시간이 점점 커지는 단점
Garbage Collection
HotSpot JVM GC
GC와 Logic을 Concurrent 하게 수행
Low Pause Collector
309.
309
Parallel Collector (1/2)
여러 개의 Multi-Thread가 GC를 수행
Server Class의 Default Collector
Young Generation을 병렬 처리하여 처리량을 늘리자!!!
Young Generation은 Parallel Copy로 성능이 개선됨
Old Generation은 기존 Serial 과 동일
Parallel Copy Algorithm
Eden과 Survivor 영역의 Live Object의 Copy작업을 Multi-Thread로 수행
리소스를 투입한만큼 Suspend 시간이 단축됨
Multi-Thread로 인해 Promotion시 메모리 동기화 이슈 발생
Promotion Buffer
Parallel Local Allocation Buffer (PLAB)
GC Thread가 Promotion 시에 배타적으로 사용하기 위해, Thread마다 Old
Generation의 일정부분(보통 1024 bytes)을 할당해 놓는 것.
Old Generation의 Fragmentation문제 발생 가능
GC Thread를 감소시키거나, Old Generation Size를 증가시켜 개선 가능
Garbage Collection
HotSpot JVM GC
종류 Option
Collection Algorithm
Young Old
Serial Collector -XX:+UseSerialGC Generational Mark Compacting
Parallel Collector -XX:+UseParallelGC Parallel Copy Mark Compacting
Parallel Compacting Collector -XX:+UseParallelOldGC Parallel Copy Parallel Compacting
CMS Collector -XX:+UseConMarkSweepGC Parallel Copy Concurrent Mark-Sweep
G1 Collector -XX:+UseG1GC Snapshot-At-The-Beginning (SATB)
Serial Collector Parallel Collector
Stop Copy
T1 T2 T1 T2
promotion
buffer
promotion
buffer
310.
310
Parallel Collector (2/2)- options
Garbage Collection
HotSpot JVM GC
옵션 설명 디폴트 비고
-XX:+UseParallelGC Parallel Collector 사용 옵션 1.4.1+
-XX:ParallelGCThreads=value Parallel GC Thread 개수 CPU 개수 1.4.1+
-XX:+AlwaysTenure
Eden Area의 Reachable Object는 바로 Old Area로 Promotion 됨
-XX:MaxTenuringThreshold=0 과 같음 -- age를 0으로 해서 바로 승격
1.4.1+
-XX:+NeverTenure
Survivor Area가 Full되는 경우를 제외하고 Object를 가능한 Promotion 안되게 설정하
는 옵션으로 age 자체를 없애서 promotion이 안되게 한다
1.4.1+
Ergonomics Options
1.4.1 버전부터 Throughput Collector를 제공함과 동시에 Intelligent 자동화 기술인 Ergonomics 기능을 제공하기 시작
옵션 설명 디폴트 비고
-XX:MaxGCPauseMillis=value 설정값 이하로 GC Pause Time을 유지하라는 설정 1.5+
-XX:GCTimeRatio=value
애플리케이션 수행시간 대비 전재 GC 의 시간비율
예를 들어 19로 설정하면 1/(1+19)=5%
99
(1%의 GC Time Ratio)
1.5+
- XX:+UseAdaptiveSizePolicy
GC 횟수, Generation의 각 Area 비율, free heap size 등을
통계정보를 바탕으로 Young, Old Generation의 크기를 자동 설정
1.4.1+
-XX:YoungGenerationSizeIncrement=value Young Generation 의 확장 비율 설정 20 (20% 씩 증가) 1.5+
-XX:TenuredGenerationSizeIncrement=value Old Generation 의 확장 비율 설정 20 (20% 씩 증가) 1.5+
-XX:AdaptiveSizeDecrementScaleFactor=value
Heap의 Growing Percent 대비 Shrink를 수행할 비율
디폴트는 4이고 Heap Growing Percent 가 20이면 20/4=5% 가 된다
4
(Shrink ratio = 5%)
1.5+
-XX:GCHeapFreeLimit=value
GC로 확보해야 하는 최소 Free Space의 비율 설정
Default는 5%로 OOME 방지에 도웅이 되는 옵션
5 1.4.1+
-XX:MaxHeapFreeRatio=value 전체 Heap 대비 Free Space가 지정 수치 이상이면 -Xms까지 축소하능 옵션 70
-XX:GCTimeLimit=value
GC에 사용할 수 있는 시간의 상한선을 설정
전체 수행 시간에 대한 비율로 Default 는 90(%)
90 1.4.1+
311.
311
Parallel Compaction Collector(1/3)
Young Generation 에서 재미를 본 Parallel
Algorithm 을 Old Generation 에도 적용
Young Generation 은 Parallel Copy Algorithm 을 사용
Old Generation 은 Parallel Compaction Algorithm 을 사용
java 1.5.6에서 도입되었으며, 향후 Parallel Collector 대체 예정
Multi CPU에서 유리
힙메모리 영역의 크기가 클 때 적합
Parallel Compaction Algorithm
① Mark Phase
② Summary Phase
③ Compaction Phase
Garbage Collection
HotSpot JVM GC
종류 Option
Collection Algorithm
Young Old
Serial Collector -XX:+UseSerialGC Generational Mark Compacting
Parallel Collector -XX:+UseParallelGC Parallel Copy Mark Compacting
Parallel Compacting Collector -XX:+UseParallelOldGC Parallel Copy Parallel Compacting
CMS Collector -XX:+UseConMarkSweepGC Parallel Copy Concurrent Mark-Sweep
G1 Collector -XX:+UseG1GC Snapshot-At-The-Beginning (SATB)
Parallel Compacting Collector
Mark Phase
Summary Phase
Compaction Phase
312.
312
Parallel Compaction Collector(2/3)
① Mark Phase
Old Generation을 Region이라는 균일한 단위(2 kbytes)로 나누고, Collection Thread들이 동시에(Parallel) Region 별려 Live Object를 Marking
Mark작업시 Live Object의 size와 위치정보(주소)등의 Region 정보를 갱신 -- 향후 Region 별 통계작업에 사용
② Summary Phase
하나의 Thread가 Mark단계의 결과를 바탕으로 Garbage Collection 을 수행하고 나머지는 Application을 수행
Collection Thread 는 Region 의 통계 정보를 바탕으로 각 Region 의 Density(각 Region의 Reachable Object 의 밀도) 를 평가하여 Dense Prefix를 설정
Dense Prefix 는 Reachable Object 의 대부분을 차지 한다고 판단되는 Region이 어디까지 인지를 구분 짓는 지점으로, Dense Prefix 왼편은
GC대상에서 제외하여 Compction의 범위를 줄여주어 GC 소요시간을 줄여주는 효과를 갖는다.
Dense Prefix 설정 후 Compaction 의 대상이 되는 Region의 First Live Object 주소를 찾아 저장
③ Compaction Phase
Heap을 잠시 Suspend 상태로 만들고 모든 GC Thread 들이 각 Region을 할당 받아 Compaction(Sweep - Live Object를 왼편으로 이동)을 수행
Source, Destination을 구분하여 Live Object를 Destination으로 넘기면서 Compaction을 수행
Garbage Collection
HotSpot JVM GC
Destination Source
Dense
Prefix
T1
T1 T2
T2
T1
T1
313.
313
Parallel Compaction Collector(3/3) - options
Garbage Collection
HotSpot JVM GC
옵션 설명 디폴트 비고
-XX:+UseParallelOldGC Parallel Compaction Collector 선택 java6+
-XX:+UseParallelOldGCCompacting Parallel Compaction Collector 를 사용할 때 Parallel Compaction 의 사용여부 true java6+
-XX:+UseParallelDensePrefixUpdate Summary Phase 에 서 Dense Prefix 를 매번 갱신 true java6+
314.
314
CMS Collector (1/6)
CMS Collector
GC시 수반되는 Suspend Time을 분산하여 응답시간을 개선
자원의 여유가 있는 상태에서 GC Pause Time을 줄이고자 할때
Young Generation의 Collection은 Parallel Collector와 동일
No Compaction!!!
Concurrent Mark-Sweep Algorithm
Garbage Collection
HotSpot JVM GC
종류 Option
Collection Algorithm
Young Old
Serial Collector -XX:+UseSerialGC Generational Mark Compacting
Parallel Collector -XX:+UseParallelGC Parallel Copy Mark Compacting
Parallel Compacting Collector -XX:+UseParallelOldGC Parallel Copy Parallel Compacting
CMS Collector -XX:+UseConMarkSweepGC Parallel Copy Concurrent Mark-Sweep
G1 Collector -XX:+UseG1GC Snapshot-At-The-Beginning (SATB)
단계
GC
Thread
HEAP
Suspend
설명
Initial Mark Phase Single O
Direct Referenced(RootSet에 1단계 관계) Live Object를 빠르게 구별
Direct Referenced Object 만을 대상으로 하기 때문에 Suspend 시간은 최소화 됨
Concurrent Mark Phase Single X
Initial Mark Phase 에서 선별된 Live Object를 대상으로 Reference 하고 있는 Object를 추적하
여 Live Object를 식별, Application Worker Thread는 Concurrent하게 수행됨
Remark Phase Multi O
Concurrent 작업으로 인해 발생한 변경사항을 반영하기 위해서 Marking된 것들을 재방문하
여 Live 여부를 확인하고 Marking 작업을 확정
Concurrent Sweep Phase Single X
Worker Thread와 GC Thread의 동시(Concurrent) 작업이 가능
Dead Object 를 지우는 Sweep 작업만 할 뿐 Compaction 작업은 수행하지 않는다
Heap Fragmentation이 발생할수 있으며 Free-List를 사용하여 단편화를 줄이려는 추가적인
작업을 고려한다
315.
315
CMS Collector (2/6)
No Compaction!!!
시간 절약의 효과, But 연속된 Free Space는 감소
FreeList를 사용하여 적절한 크기의 공간 탐색
Fast Allocation의 이점이 사라짐
Promotion과정에서 Young 의 부담이 커짐
Garbage Collection
HotSpot JVM GC
Fragmentation의 가능성
이를 방지하기 위해 Object Size를 Tracking, 미래의 요구량을 추정
요구량에 맞게 Free Block을 붙이고 쪼개는 작업 수반
316.
316
CMS Collector (3/6)
Floating Garbage
CMS Collector 는 Fragmentation 뿐만 아니라 Floating Garbage 라는 문제 도 발생 할 수 있다
Floating Garbage 는 말 그대 로 Garbage 이면서 수거 되지 않은, 붕 떠 있는 Garbage 를 의미
Float Garbage 는 다음번 Garbage Collection 에서 사라지게 된다
Garbage Collection
HotSpot JVM GC
Concurrent Mark때 새로 들어왔다가
Garbage
Next GC때 사라짐
Memory 요구량이 많아짐
317.
317
CMS Collector (4/6)
Scheduling Collection
Old Generation이 Full이 되기 전에 작동
Old Generation이 Full이 되기 까지 남은 시간이 GC가 필요한 시간에 근접하면 작동
Minor GC와 연달아 수행되지 않도록 Remark를 Minor GC사이에 스케줄링
또한 Current Heap의 점유율을 판단하여 임계값을 넘으면 작동
임계값 : 전체 Heap의 68%
Garbage Collection
HotSpot JVM GC
318.
318
CMS Collector (5/6)- options
Garbage Collection
HotSpot JVM GC
옵션 설명 디폴트 비고
-XX:+UseConcMarkSweepGC CMS Collector의 선택 1.4.0+
-XX:+UseParNewGC Young 에서의 Parallel Option적용여부 1.4.1+
-XX:CMSInitiatingOccupancyFraction 현재 점유한 Current Old Generation의 비율 68 % 1.4.1+
319.
319
CMS Collector (6/6)
Incremental Mode
Concurrent phase의 충격을 완화하자는 목적
Concurrent Phase를 작은 시간단위로 쪼개어 수행
서로 다른 Minor GC의 사이에 Concurrent Phase가 완료되도록
스케줄링
Duty Cycle로 Concurrent Collector의 일량을 조정
Duty Cycle
1개의 CPU를 점유할 수 있는 최대 시간
Minor GC사이의 시간의 비율
I-CMS는 이를 자동으로 계산(추천) or 설정 가능
Incremental Mode 관련 옵션
Garbage Collection
HotSpot JVM GC
Initial Mark Phase
Concurrent Mark Phase
Remark Phase
Concurrent Sweep Phase
두 개의 CPU중
하나를 GC내내
점유하고 있음
옵션 설명 디폴트 비고
-XX:+CMSIncrementalMode
Incremental Mode사용여부
반드시 CMS가 선택된 상태에서 적용해야하며, CMSInitiatingOccpancyFraction과 배치
false 1.4.2+
-XX:+CMSIncrementalPacing Duty Cycle을 자동으로 설정 false 1.4.2+
-XX:CMSIncrementalDutyCycle=value
Duty Cycle의 수동 조정
Minor GC사이의 시간 비율 (0~100)
자동 설정이 사용되면 50으로 자동 설정
50 1.4.2+
-XX:CMSIncrementalDutyCycleMin=value 자동설정일때 Duty Cycle의 하한선 (0~100) 10 1.4.2+
-XX:CMSIncrementalSafetyFactor=value Duty Cycle의 계산을 보수적으로 함 10 1.4.2+
-XX:CMSIncrementalOffset=value Duty Cycle을 두 Minor GC 사이의 오른쪽으로 이동 (0~100) 10 1.4.2+
-XX:CMSExpAvgFactor=value 현재 통계값에 지수 평균을 낼때의 가중치 % (0~100) 25
320.
320
G1 Collector (1/5)
Garbage First Collector
Java SE 6 update 14에서 처음 소개
Realtime에 가깝게 하기 위한 목적
Y ms interval내에 X ms미만으로 GC를 끝내자는 것
Single Generation
Generation의 물리적인 구분을 하지 않음
Heap을 region으로 나눔
– 1MB로 시작하여 Best Region의 크기를 찾아감
Young Generation : a Set of Regions
– Allocation Region을 Young Generation으로 인식
Old Generation : a Set of Regions
– Promotion 되는 Region
Garbage First
Garbage 로만 꽉 차있는 Region 부터 Collection 을 시작한다고해서 붙여진 이름
Garbage Region 은 발견 되자 마자 즉각적으로 Collection 수행
Garbage Object 가 대부분인 Region 의 경우 Live Object 는 Old Region 에서
다른 Old Region으로 Compaction 수행
Concurrent Marker가 각 Heap Region내의 live data양을 계산
Live Data가 적고 Garbage가 많은 Region에 최적
Garbage Region에게 최고
Garbage Collection
HotSpot JVM GC
종류 Option
Collection Algorithm
Young Old
Serial Collector -XX:+UseSerialGC Generational Mark Compacting
Parallel Collector -XX:+UseParallelGC Parallel Copy Mark Compacting
Parallel Compacting Collector -XX:+UseParallelOldGC Parallel Copy Parallel Compacting
CMS Collector -XX:+UseConMarkSweepGC Parallel Copy Concurrent Mark-Sweep
G1 Collector -XX:+UseG1GC Snapshot-At-The-Beginning (SATB)
Young GC(Evacuation Pause)
Concurrent Mark - Marking
Concurrent Mark - Remarking
Old Region Reclaim - Remark
Old Region Reclaim(Evacuation Pause)
Compaction
321.
321
G1 Collector (2/5)
Young GC (Evacuation Pause)
Garbage Collection
HotSpot JVM GC
Old Generation Region
Young Generation Region
Young Generation 에서 방금 Copy 된 Survivor Region
방금 Promotion 되어 새로 Old Generation이 된 Region
Young Generation의 Region들을 대상으로 Reachable Object를 찾아낸후
Age가 되지 않은 Obect는 Survivor Region으로 Copy
Promotion 대상이 되는 Object는 Old Generation으로 Copy
기존의 Young Genreation Region은 Garbage로 간주하여 Region 단위로 할당을 해지
Young GC(Evacuation Pause)
Concurrent Mark - Marking
Concurrent Mark - Remarking
Old Region Reclaim - Remark
Old Region Reclaim(Evacuation Pause)
Compaction
Multi-Thread
Suspend-time 존재
322.
322
G1 Collector (3/5)
Concurrent Mark
Marking
Evacuation Pause때 넘어온 정보로 Initial Mark를 빠르게 수행
Remarking
Region 마다 Reachable Object 의 Density 를 계산
Garbage Region은 다음 단계로 넘어가지 않고 바로 해지
Garbage Collection
HotSpot JVM GC
Old Generation Region
Young Generation Region
Young Generation 에서 방금 Copy 된 Survivor Region
방금 Promotion 되어 새로 Old Generation이 된 Region
Young GC(Evacuation Pause)
Concurrent Mark - Marking
Concurrent Mark - Remarking
Old Region Reclaim - Remark
Old Region Reclaim(Evacuation Pause)
Compaction
STAB(SnapshoT At the Begging) Marking Algorithm
Garbage Collection 이 시작할 당시의 Reference 를 기준으로 모든 Live Object 의
Reference 를 추적 하는 방식
Mark 작업은 Concurrent 이기 때문에 Reference가 계속해서 변경됨
G1 Collector는 Write Barrier를 이용하여 각 Reference의 생성과 분리를 기록
이 기록들은 Garbage Collection이 시작할 때 만들어진 Snapshot 과 비교되어
Marking 작업을 빠르게 수행
323.
323
G1 Collector (4/5)
Old Region Reclaim
Remark 단계
Concurrent 작업을 수행하기는 하지만 Multi-Thread 방식으로 동작
Garbage Collection을 위해 Live Object의 비율이 낮은 Region중에서 몇 개의 Region을 선택
Evacuatin 단계
Young Region에 대한 Garbage Collection을 포함
Remark 단계에서 골라낸 Old Region은 Young Region과 같은식으로 Evacuation과정에 동참함
Garbage Collection
HotSpot JVM GC
Old Generation Region
Young Generation Region
Young Generation 에서 방금 Copy 된 Survivor Region
방금 Promotion 되어 새로 Old Generation이 된 Region
Young GC(Evacuation Pause)
Concurrent Mark - Marking
Concurrent Mark - Remarking
Old Region Reclaim - Remark
Old Region Reclaim(Evacuation Pause)
Compaction
324.
324
G1 Collector (5/5)
Compaction
다른 Worker Thread와 함께 GC Thread가 Concurrent하게 수행
Compaction의 주된 목적은 Large Chunk로 Free Space를 병합하여 Fragmentation을
방지하는 것
Garbage Collection
HotSpot JVM GC
Young GC(Evacuation Pause)
Concurrent Mark - Marking
Concurrent Mark - Remarking
Old Region Reclaim - Remark
Old Region Reclaim(Evacuation Pause)
Compaction
옵션 설명 디폴트 비고
-XX:+UseG1GC G1 Collector의 선택 1.6.14+
-XX:+UnlockExperimentalVMOptions Java 1.6에서는 해당 옵션을 같이 사용해 주어야 한다 1.6.14+
G1 Collector 옵션
325.
325
Garbage Collection Log
GC Log
다양한 플랫폼 JVM의 Working 상태를 분석하고, 메모리 사용패턴을 진단하여
효율적인 Garbage Collector의 정책을 확인하는 역할
Garbage Collection
옵션 디폴트 설명 예제
-verbose:gc
Displays information about each garbage collection (GC)
event.
-XX:+PrintGCDateStamps ✖ Enables printing of a date stamp at every GC.
-XX:+PrintGCDetails ✖ Enables printing of detailed messages at every GC.
-Xloggc:filename
Sets the file to which verbose GC events information
should be redirected for logging.
The information written to this file is similar to the output
of -verbose:gc with the time elapsed since the first GC
event preceding each logged event.
The -Xloggc option overrides -verbose:gc if both are given
with the same java command.
-Xloggc:/logs/garbage-collection.log
GC
Log
Rotation
-XX:+UseGCLogFileRotation GC Log 파일의 로테이션 설정
-XX:NumberOfGCLogFiles=count
Log Rotation 설정이 되어 있을 때 GC Log 파일을 몇 개 유
지할 것인지 설정
-XX:NumberOfGCLogFiles=9
-XX:GCLogFileSize=size
Log Rotation 설정이 되어 있을 때 GC Log 파일의 최대 사이
즈 설정
-XX:GCLogFileSize=20m
329
LAB) GC LogOptions (4/6)
-Xloggc:filepath
Sets the file to which verbose GC events information should be redirected for logging.
The information written to this file is similar to the output of -verbose:gc with the time elapsed since the first GC event preceding each logged event.
The -Xloggc option overrides -verbose:gc if both are given with the same java command.
filename 에 %t 를 추가하면 파일명에 현재날짜가 추가됨
Garbage Collection
GC Log Options
Tomcat v8.5 서버 실행 옵션에 아래 GC 옵션을 추가하고 서버를 실행하여
정상기동 된것을 확인하고 서버 종료
-XX:+PrintGCDetails
-XX:+PrintGCDateStamps
-Xloggc:/root/lab/gclog/gc01_%t.log
GC 로그 파일 내용 확인
[root@jvmedu ~]# ls -l ~/lab/gclog/
-rw-r--r-- 1 root root 3504 Nov 4 12:18 gc01_2021-11-04_12-16-59.log
[root@jvmedu gclog]# cat ~/lab/gclog/c01_2021-11-04_12-16-59.log
OpenJDK 64-Bit Server VM (25.302-b08) for linux-amd64 JRE (1.8.0_302-b08), built on Jul 20 2021 21:30:31 by jenkins with gcc 7.5.0
Memory: 4k page, physical 4044812k(1694060k free), swap 4064252k(4064252k free)
CommandLine flags: -XX:InitialHeapSize=536870912 -XX:MaxHeapSize=536870912 -XX:+PrintGC -XX:+PrintGCDateStamps -XX:+PrintGCDetails -XX:+PrintGCTimeStamps -XX:+UseCompressedClassPointers -
XX:+UseCompressedOops -XX:+UseParallelGC
2021-11-04T12:17:09.746+0900: 10.191: [GC (Allocation Failure) [PSYoungGen: 131584K-9066K(153088K)] 131584K-9146K(502784K), 0.1489668 secs] [Times: user=0.00 sys=0.48, real=0.15 secs]
2021-11-04T12:17:11.702+0900: 12.146: [GC (Allocation Failure) [PSYoungGen: 140650K-21482K(153088K)] 140730K-26263K(502784K), 0.2348150 secs] [Times: user=0.00 sys=0.57, real=0.23 secs]
2021-11-04T12:17:12.648+0900: 13.093: [GC (Allocation Failure) [PSYoungGen: 153066K-21474K(153088K)] 157847K-35892K(502784K), 0.1946861 secs] [Times: user=0.03 sys=0.42, real=0.19 secs]
2021-11-04T12:17:14.185+0900: 14.630: [Full GC (Metadata GC Threshold) [PSYoungGen: 12805K-0K(101888K)] [ParOldGen: 38941K-13174K(349696K)] 51747K-13174K(451584K), [Metaspace: 20531K-
20531K(1069056K)], 0.1761207 secs] [Times: user=0.29 sys=0.30, real=0.18 secs]
2021-11-04T12:17:15.664+0900: 16.109: [GC (Allocation Failure) [PSYoungGen: 80384K-6670K(87552K)] 93558K-19852K(437248K), 0.0196809 secs] [Times: user=0.04 sys=0.00, real=0.02 secs]
~~~
Heap
PSYoungGen total 126464K, used 25320K [0x00000000f5580000, 0x0000000100000000, 0x0000000100000000)
eden space 78336K, 31% used [0x00000000f5580000,0x00000000f6df21f8,0x00000000fa200000)
from space 48128K, 0% used [0x00000000fa200000,0x00000000fa248000,0x00000000fd100000)
to space 47616K, 0% used [0x00000000fd180000,0x00000000fd180000,0x0000000100000000)
ParOldGen total 349696K, used 17116K [0x00000000e0000000, 0x00000000f5580000, 0x00000000f5580000)
object space 349696K, 4% used [0x00000000e0000000,0x00000000e10b73f0,0x00000000f5580000)
Metaspace used 31323K, capacity 32012K, committed 32256K, reserved 1077248K
class space used 3660K, capacity 3825K, committed 3840K, reserved 1048576K
330.
330
LAB) GC LogOptions (5/6)
GC LogFile Rotation (1/2)
-XX:+UseGCLogFileRotation
GC 로그파일 로테이션 여부, 이 옵션을 활성화 해야 로테이션을 수행
-XX:GCLogFileSize=10m
지정된 용량 마다 로그 파일을 분리
-XX:NumberOfGCLogFiles=5
최대 몇 개까지 분리할지 지정
Garbage Collection
GC Log Options
① Tomcat v8.5 서버 실행 옵션에 아래 GC 옵션을 추가하고 서버를 실행
-XX:+PrintGCDetails
-XX:+PrintGCDateStamps
-Xloggc:/root/lab/gclog/gcrotate_%t.log
-XX:+UseGCLogFileRotation
-XX:GCLogFileSize=10k
-XX:NumberOfGCLogFiles=5
331.
331
LAB) GC LogOptions (6/6)
GC LogFile Rotation (2/2)
Garbage Collection
GC Log Options
② jadeedu_jvmswjava_toolapache-jmeter-5.4.1bin 폴더 하위의 jmeter.bat 파일 실행
③ 부하스크립트 파일 오픈 후 “UTG05_Heap OOM” Thread Group을 Enable한 후 부하를 발생시키고 로그파일 로테이션 관찰
스크립트 파일 : jadeedu_jvmswjava_toolapache-jmeter-5.4.1jmxJvmTroubleshoot.jmx
Enable Thread Group : UTG05_Heap OOM
부하 발생 ④ GC 로그파일 로테이션 관찰
[root@jvmedu ~]# watch ls -lh ~/lab/gclog/
333
LAB) GC 로그분석 (1/2)
GCViewer
실행파일 위치 : C:jadeedu_jvmswjava_toolgc
gcviewer-1.36.bat 실행 후 gc log 파일 오픈
gc로그파일 : C:jadeedu_jvmswjava_toolgc_sampleoom_2021-11-04_14-47-31.log
Garbage Collection
334.
334
LAB) GC 로그분석 (2/2)
GCeasy
https://gceasy.io/ 접속 후 gc log 파일 업로드
gc로그파일 : C:jadeedu_jvmswjava_toolgc_sampleoom_2021-11-04_14-47-31.log
결과 분석
Garbage Collection

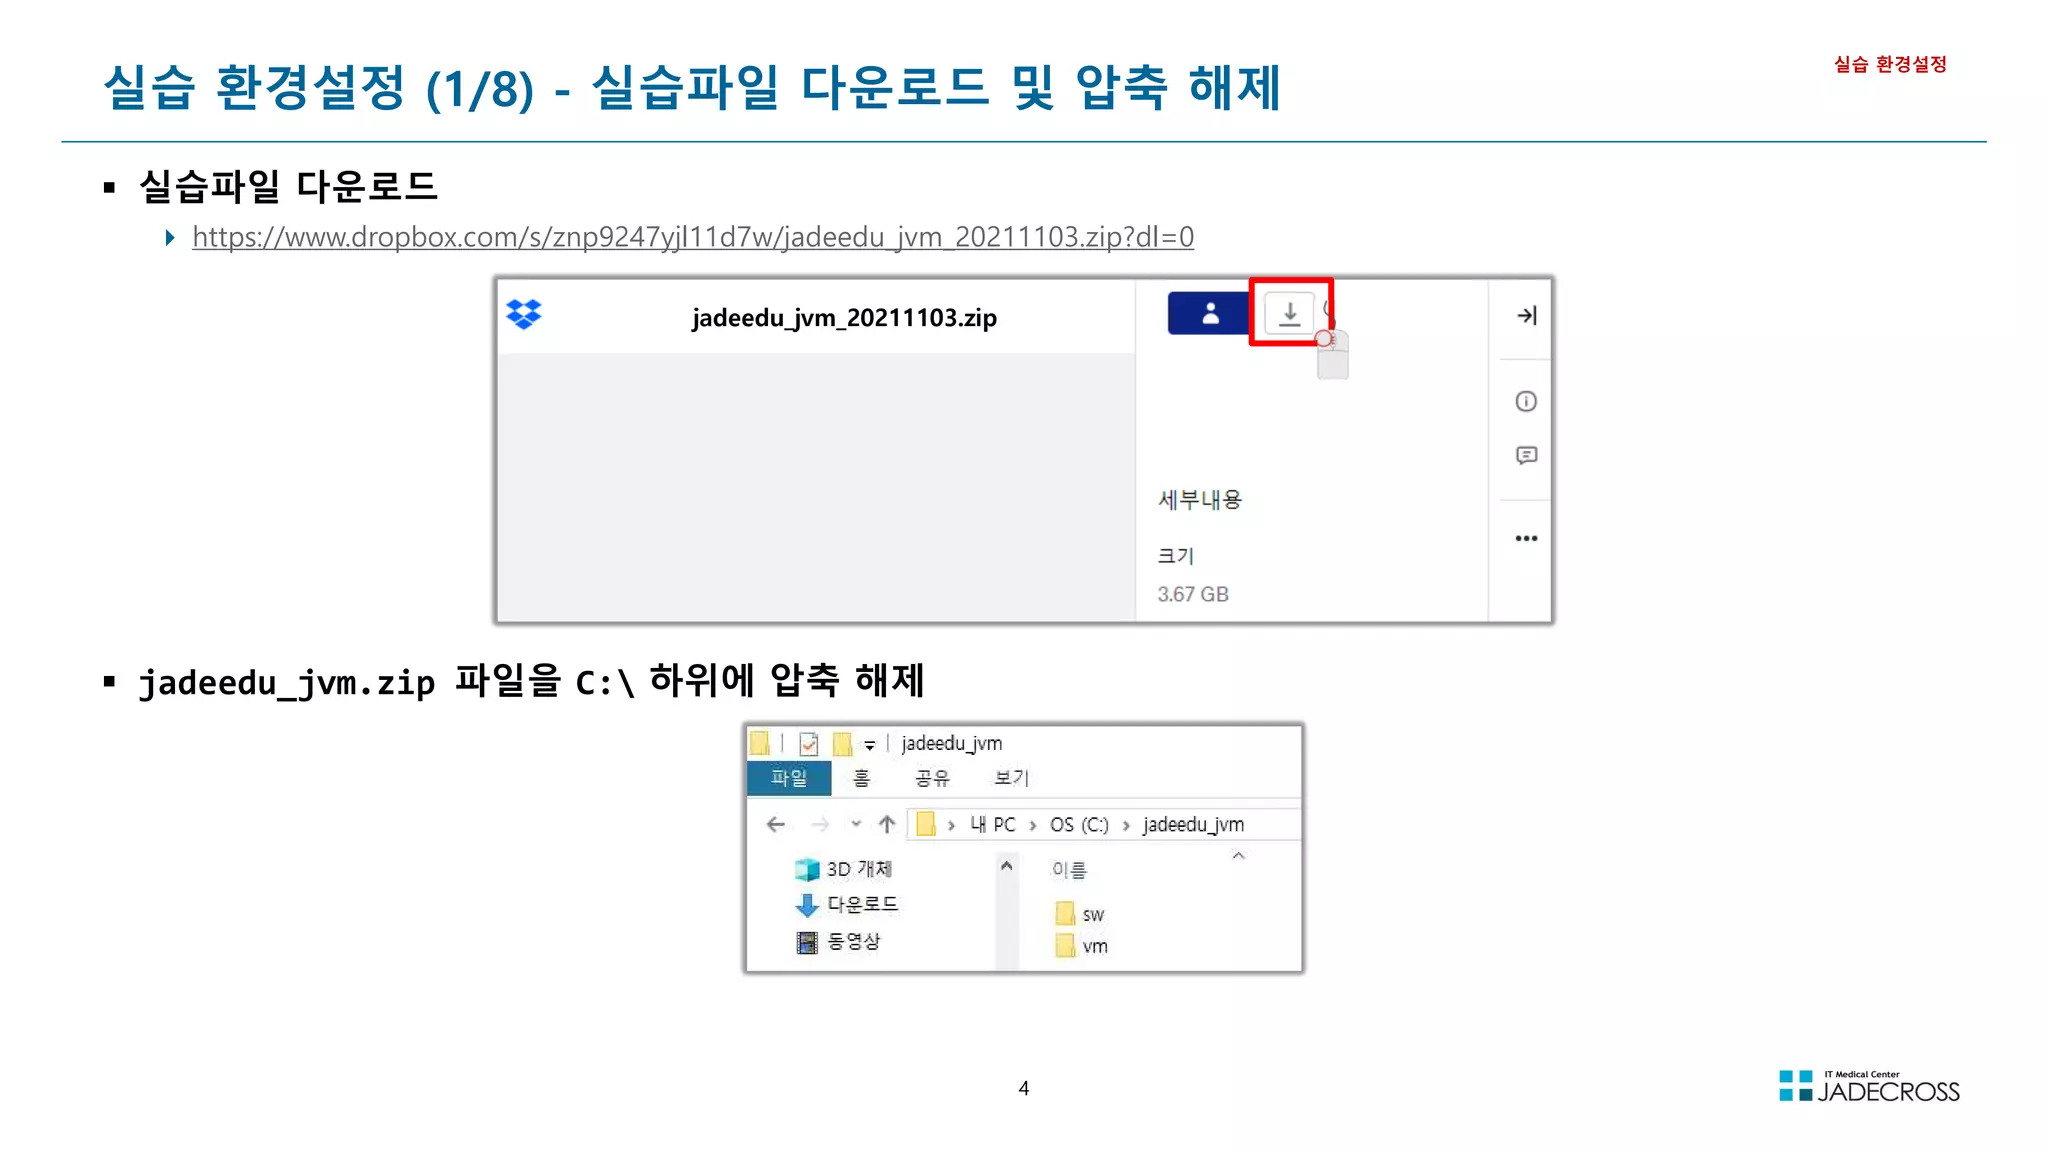
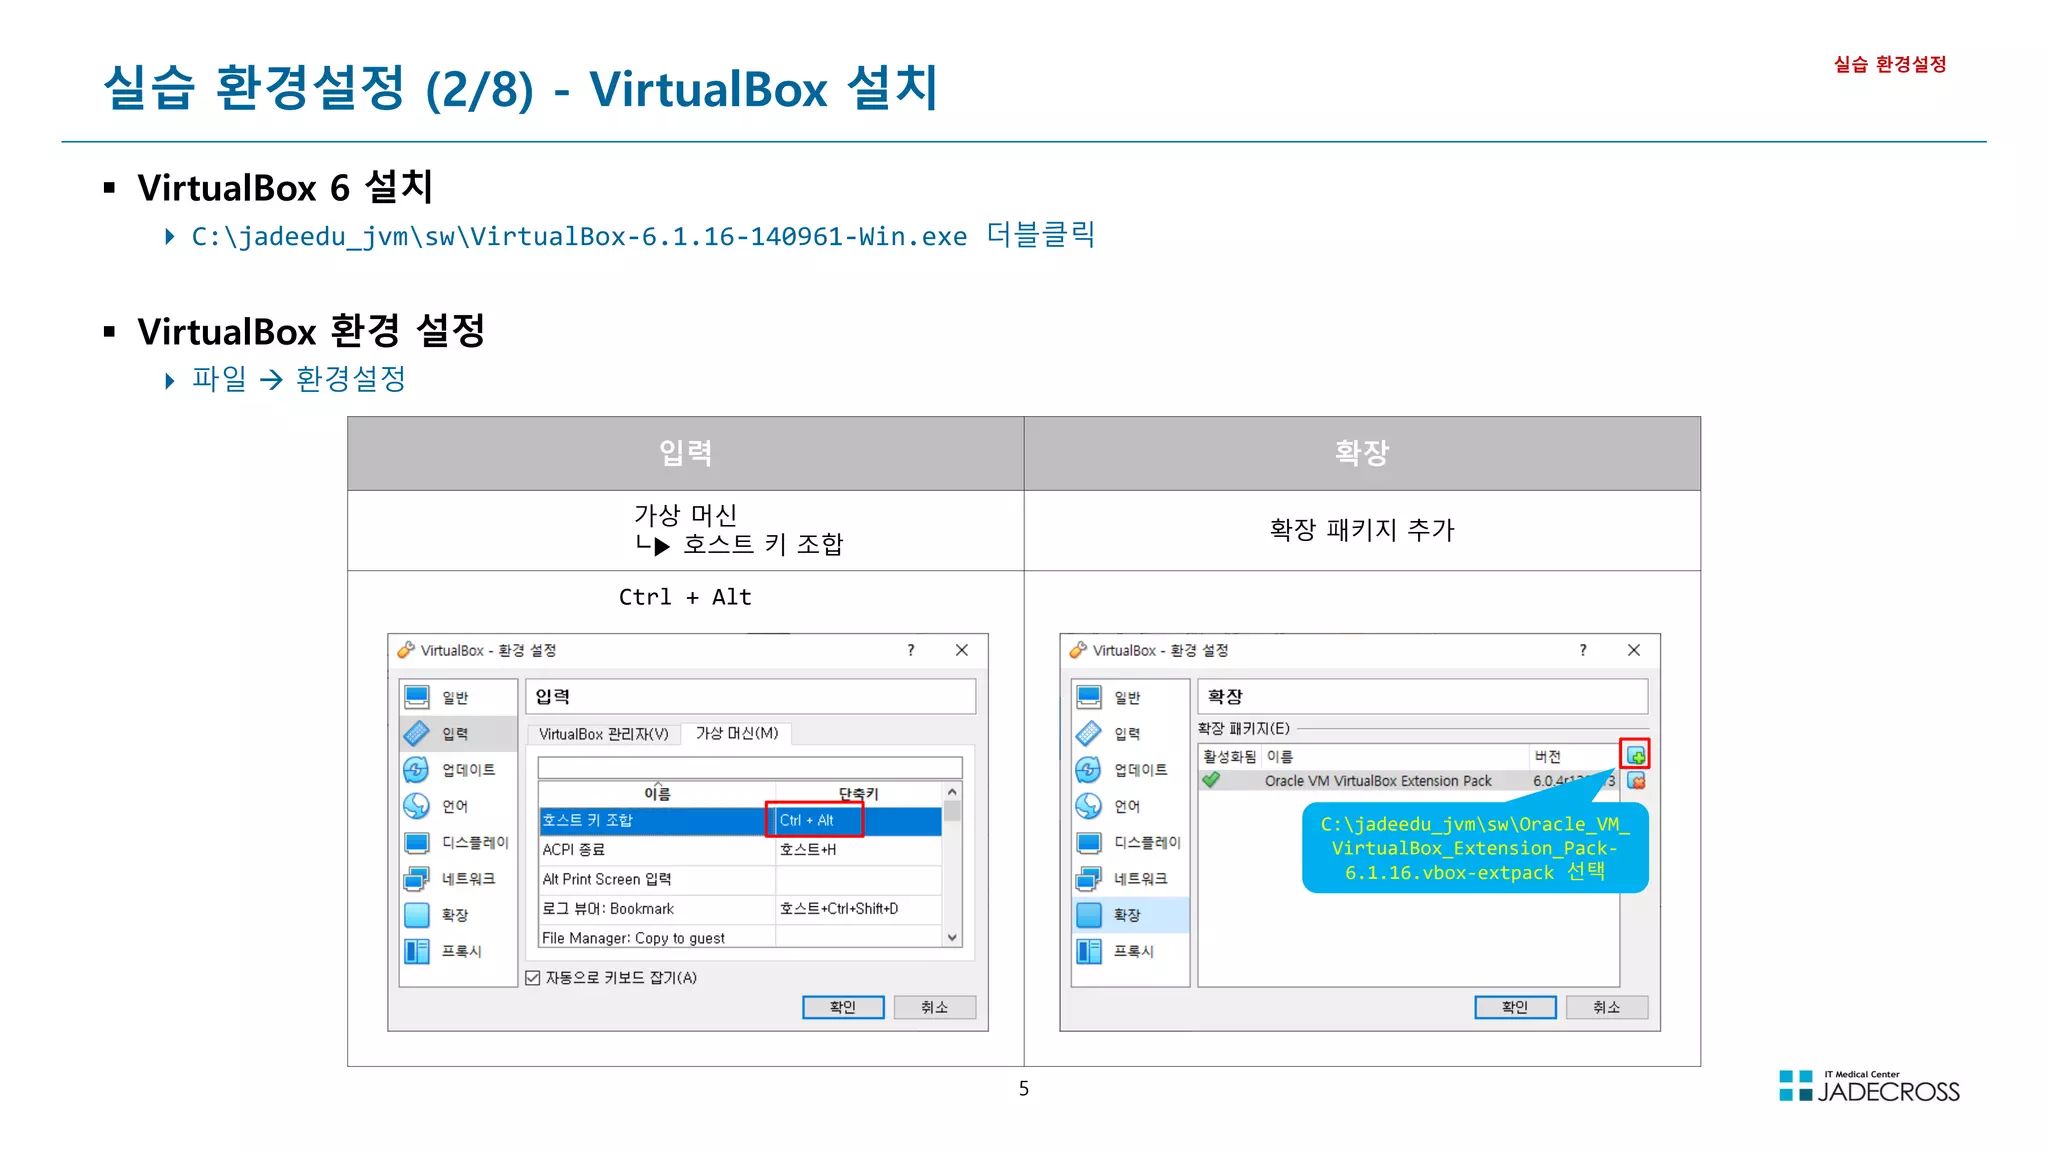
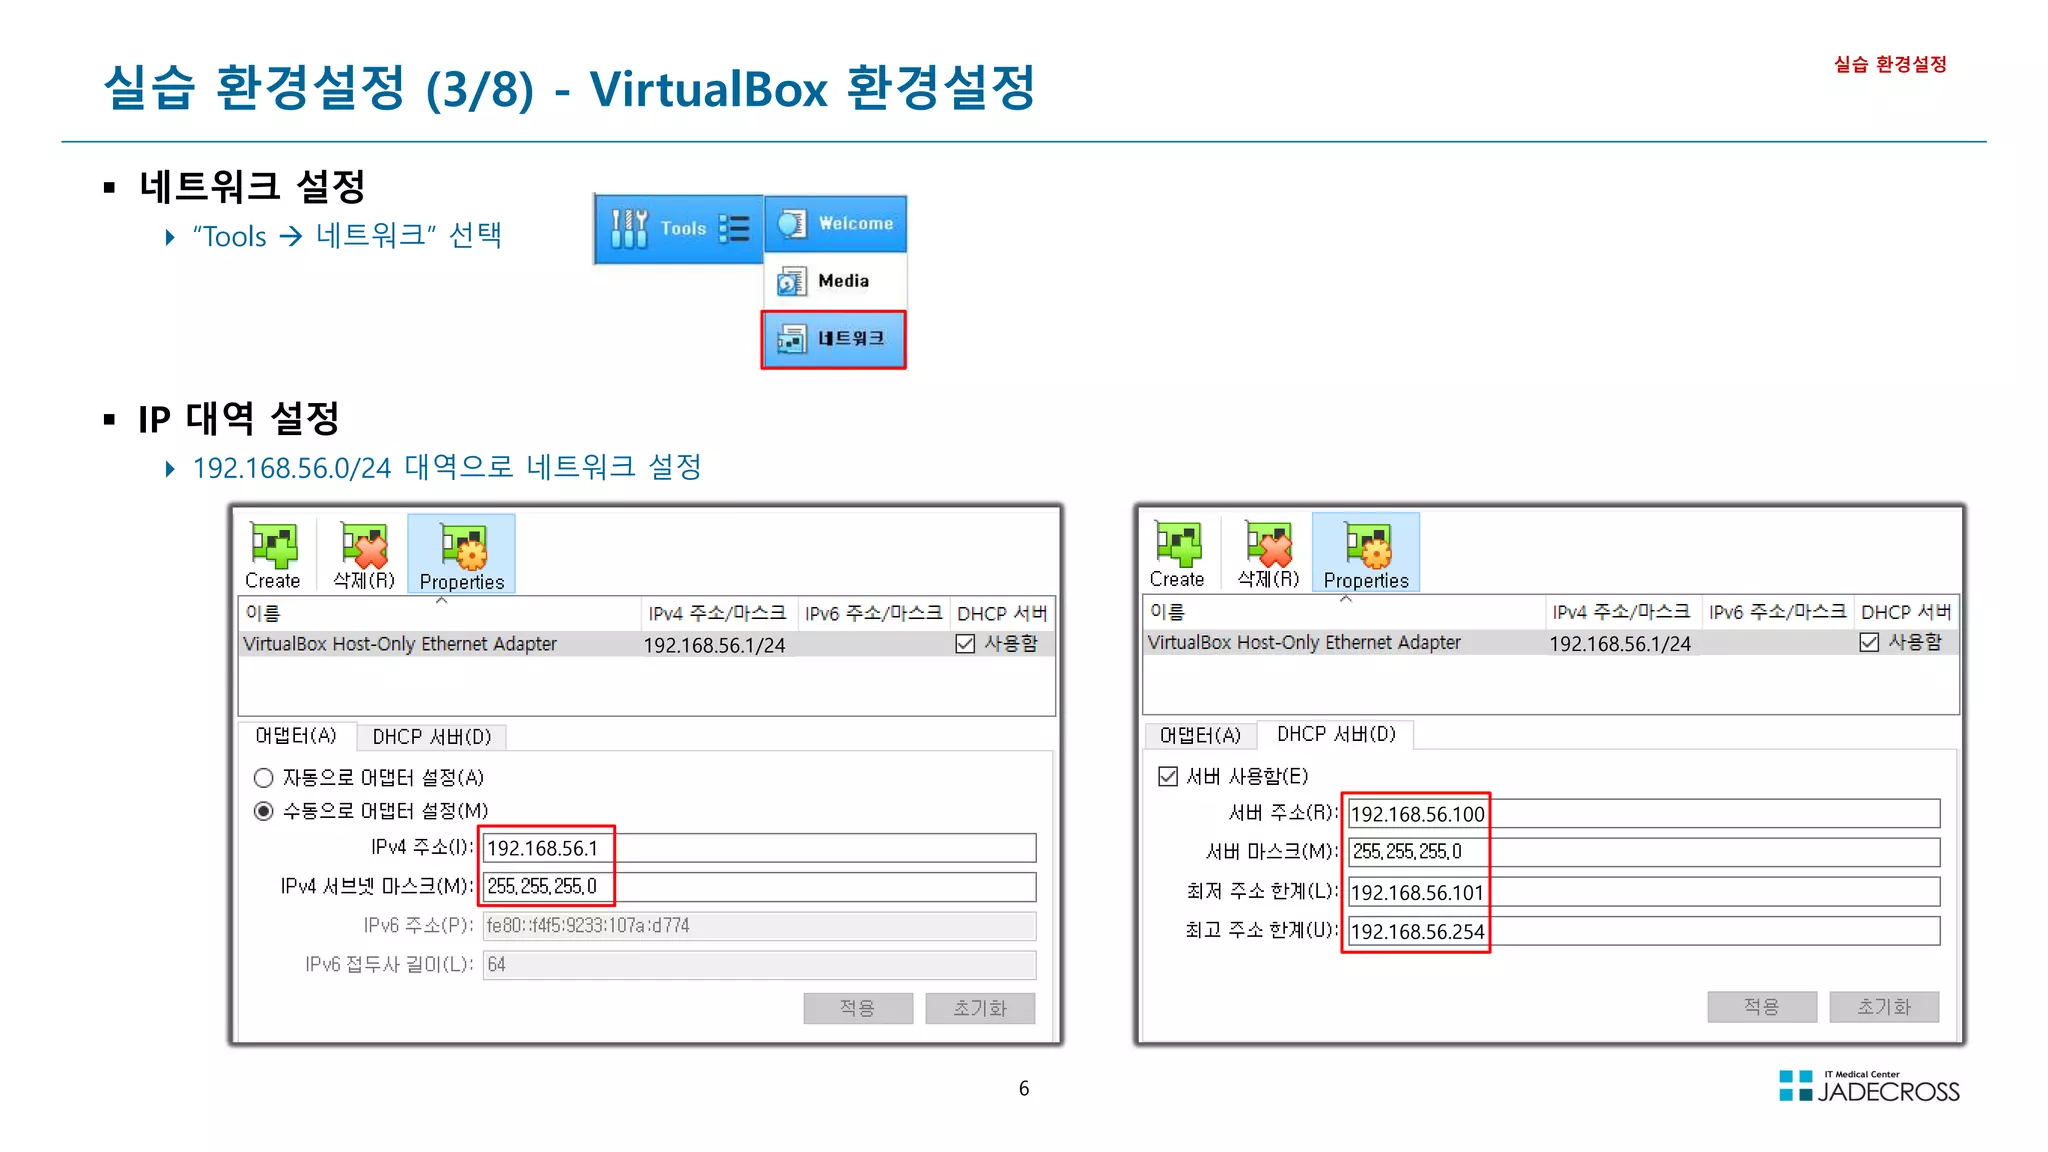
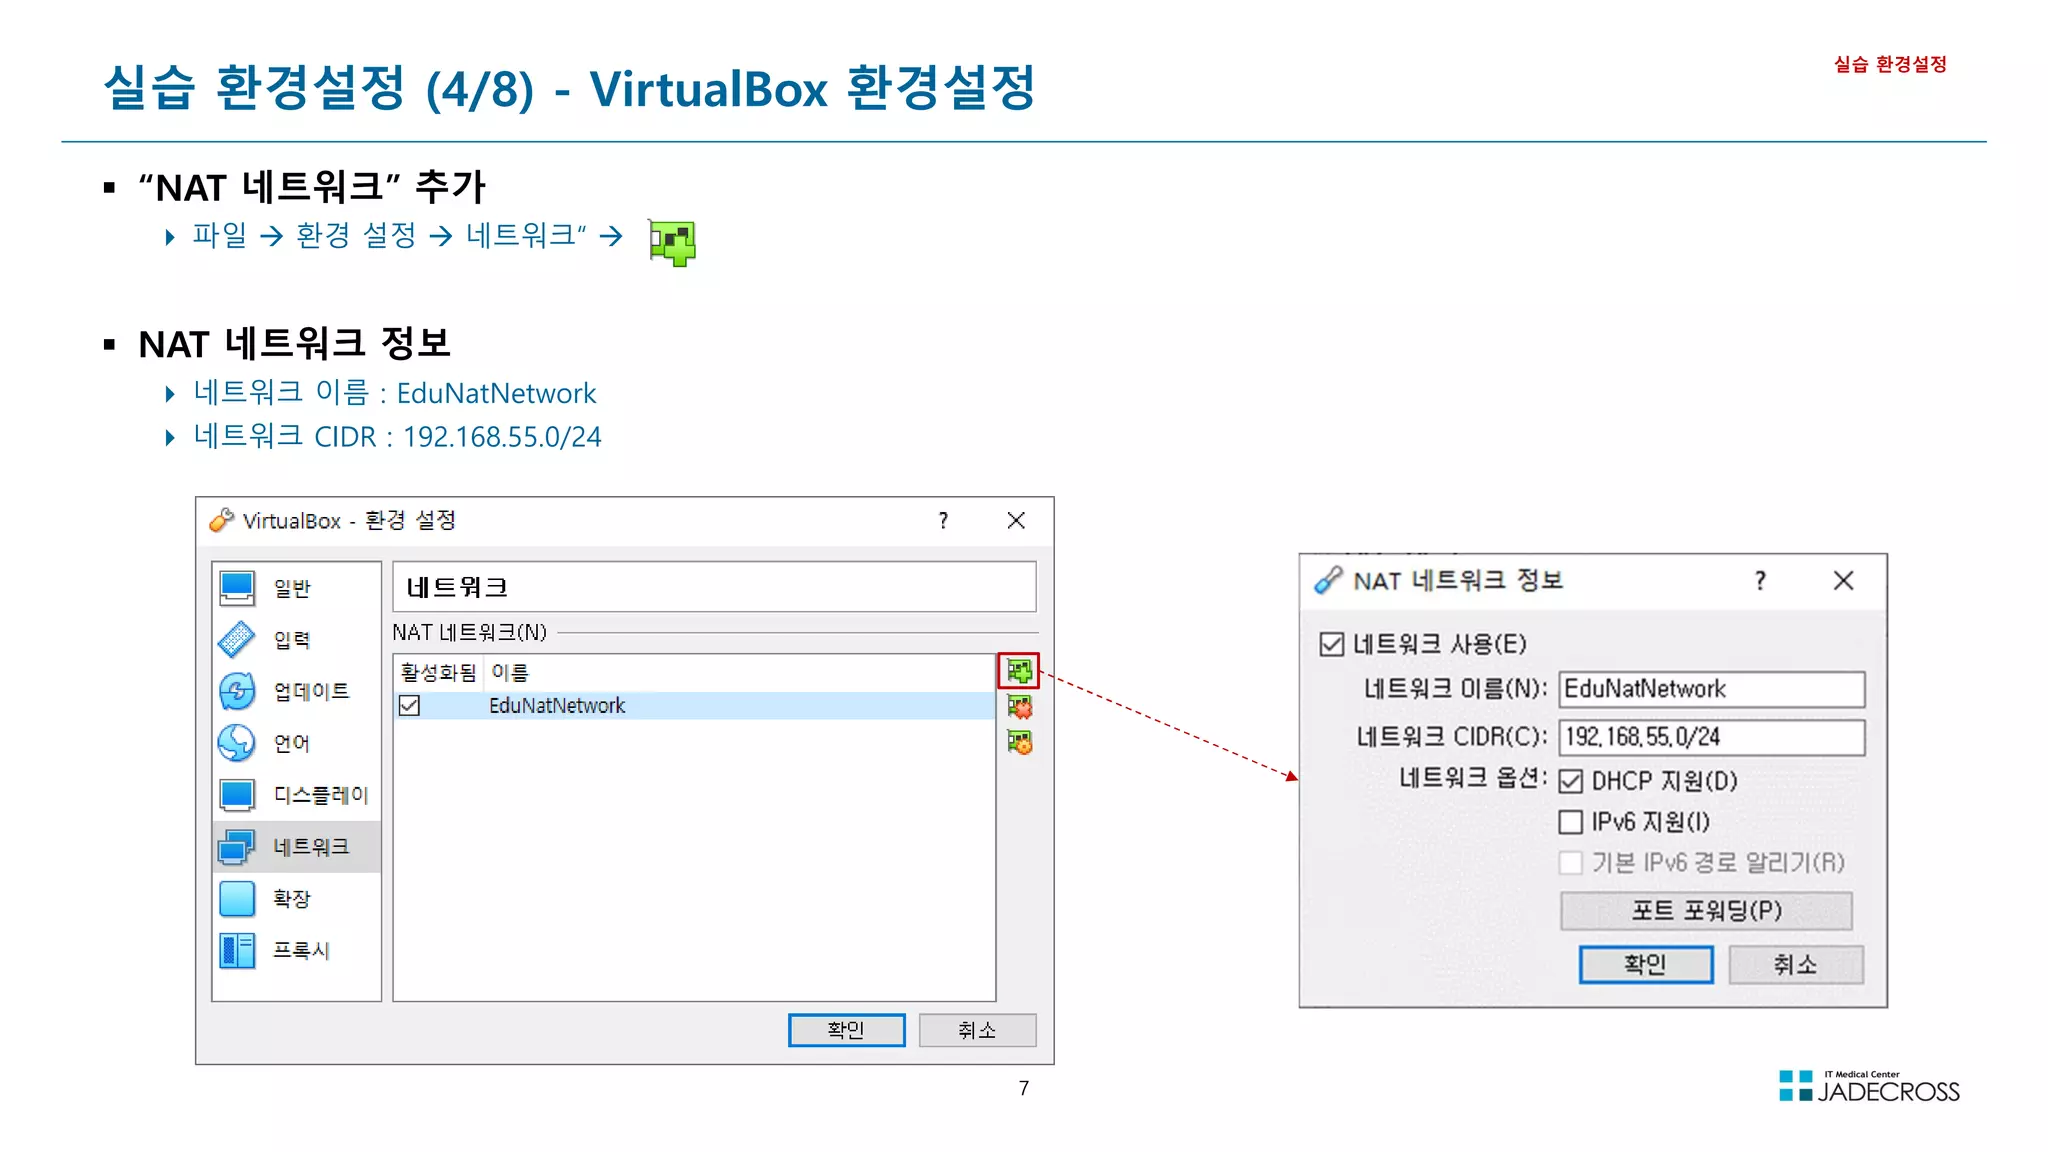
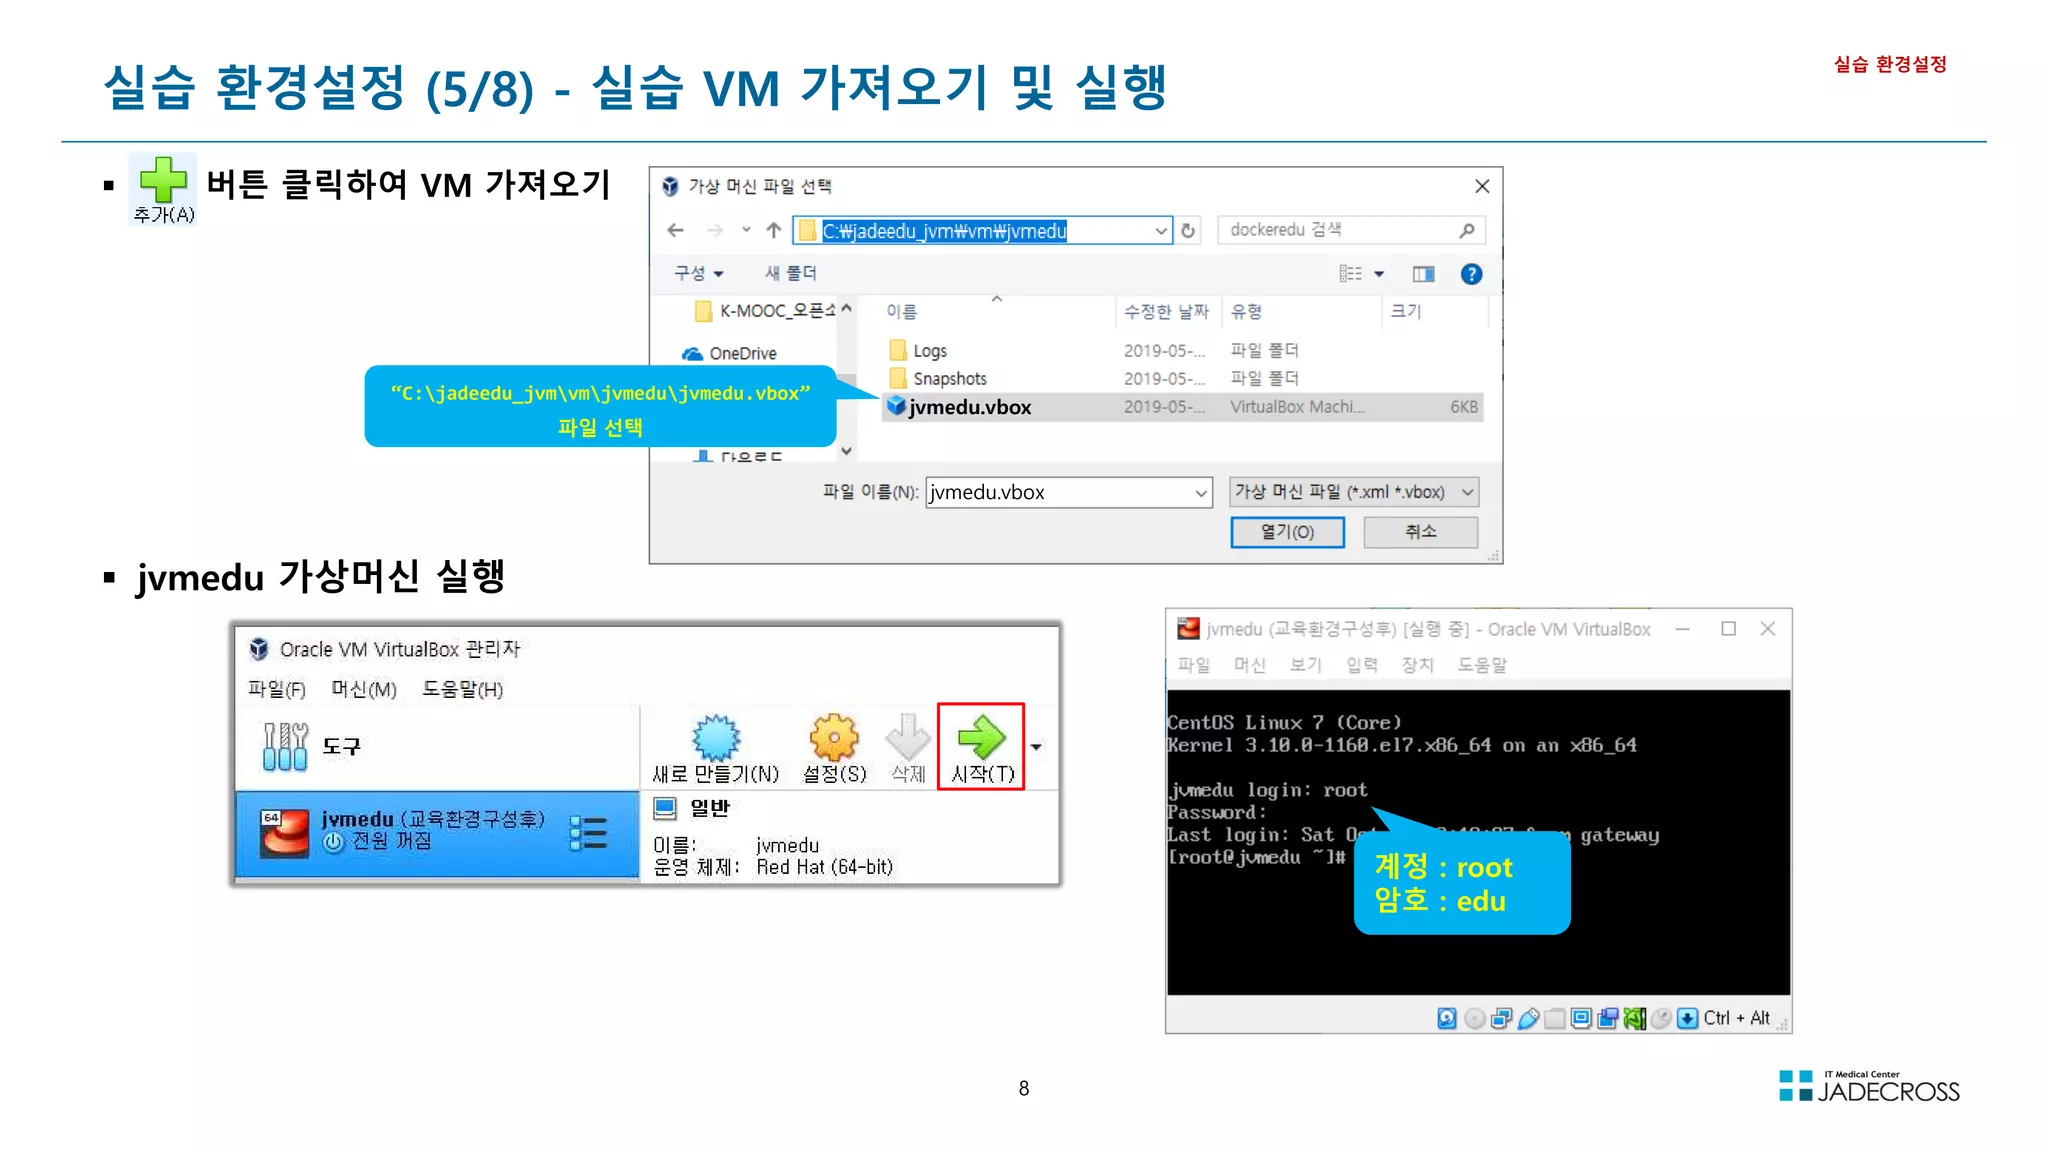
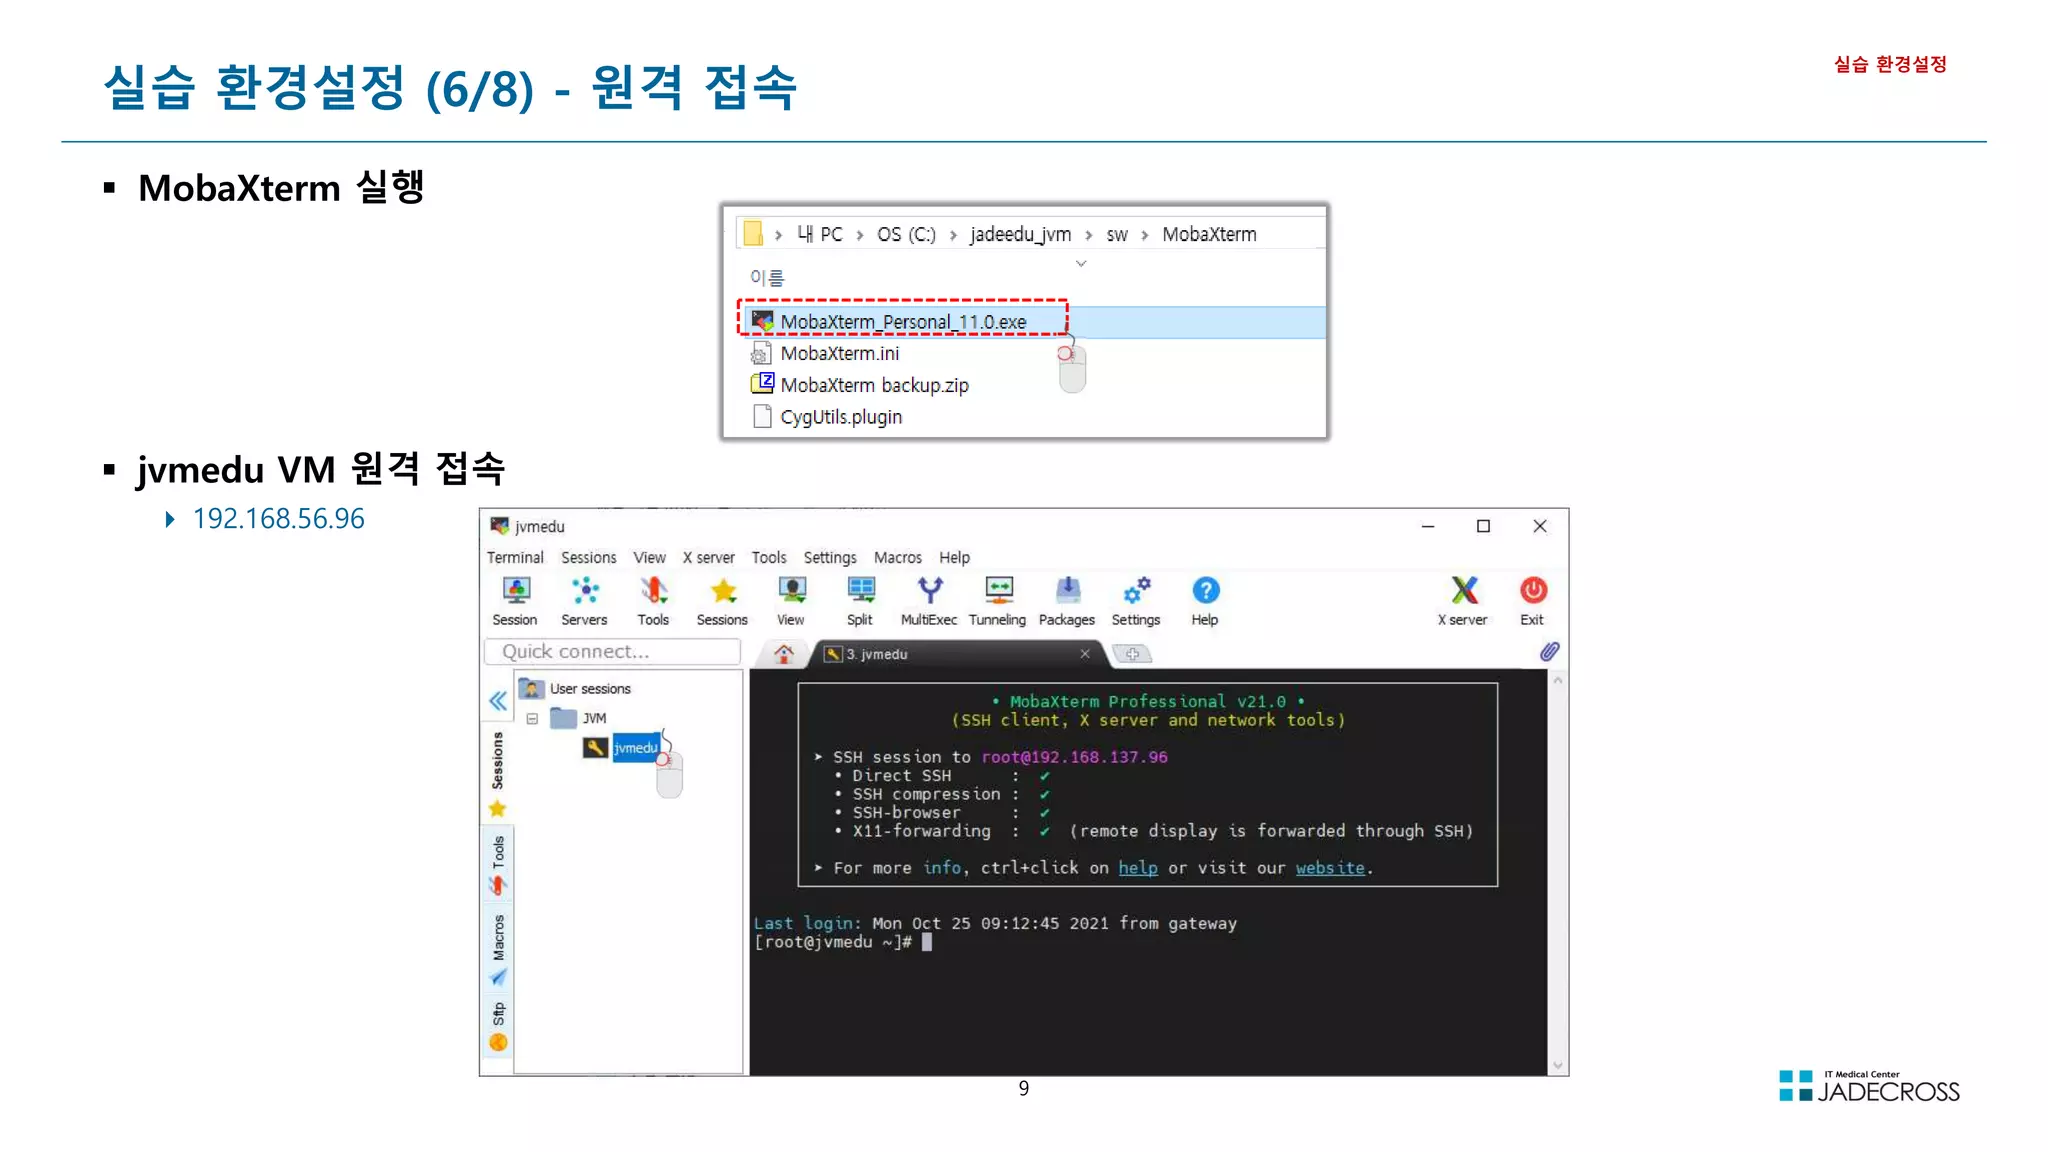
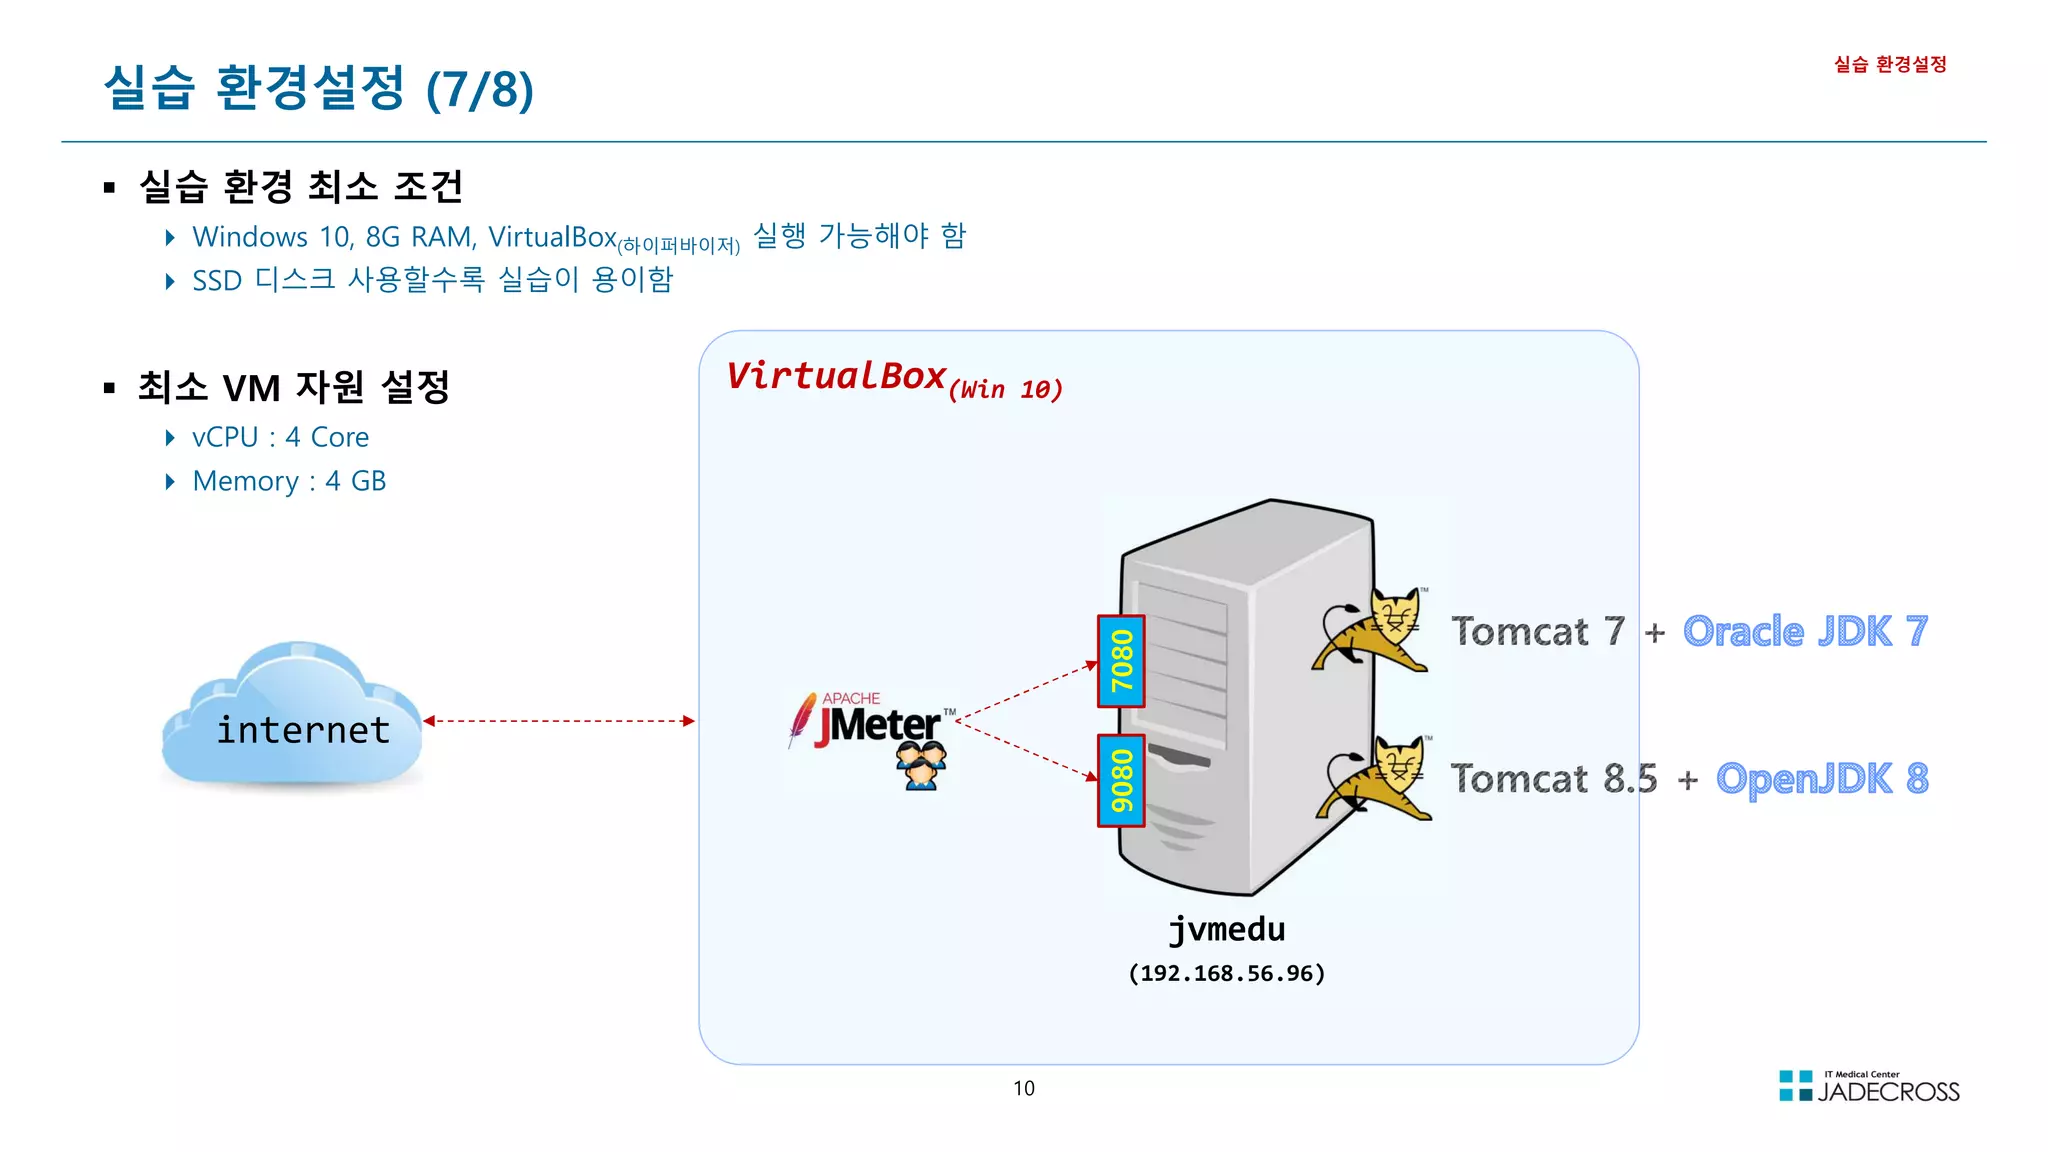
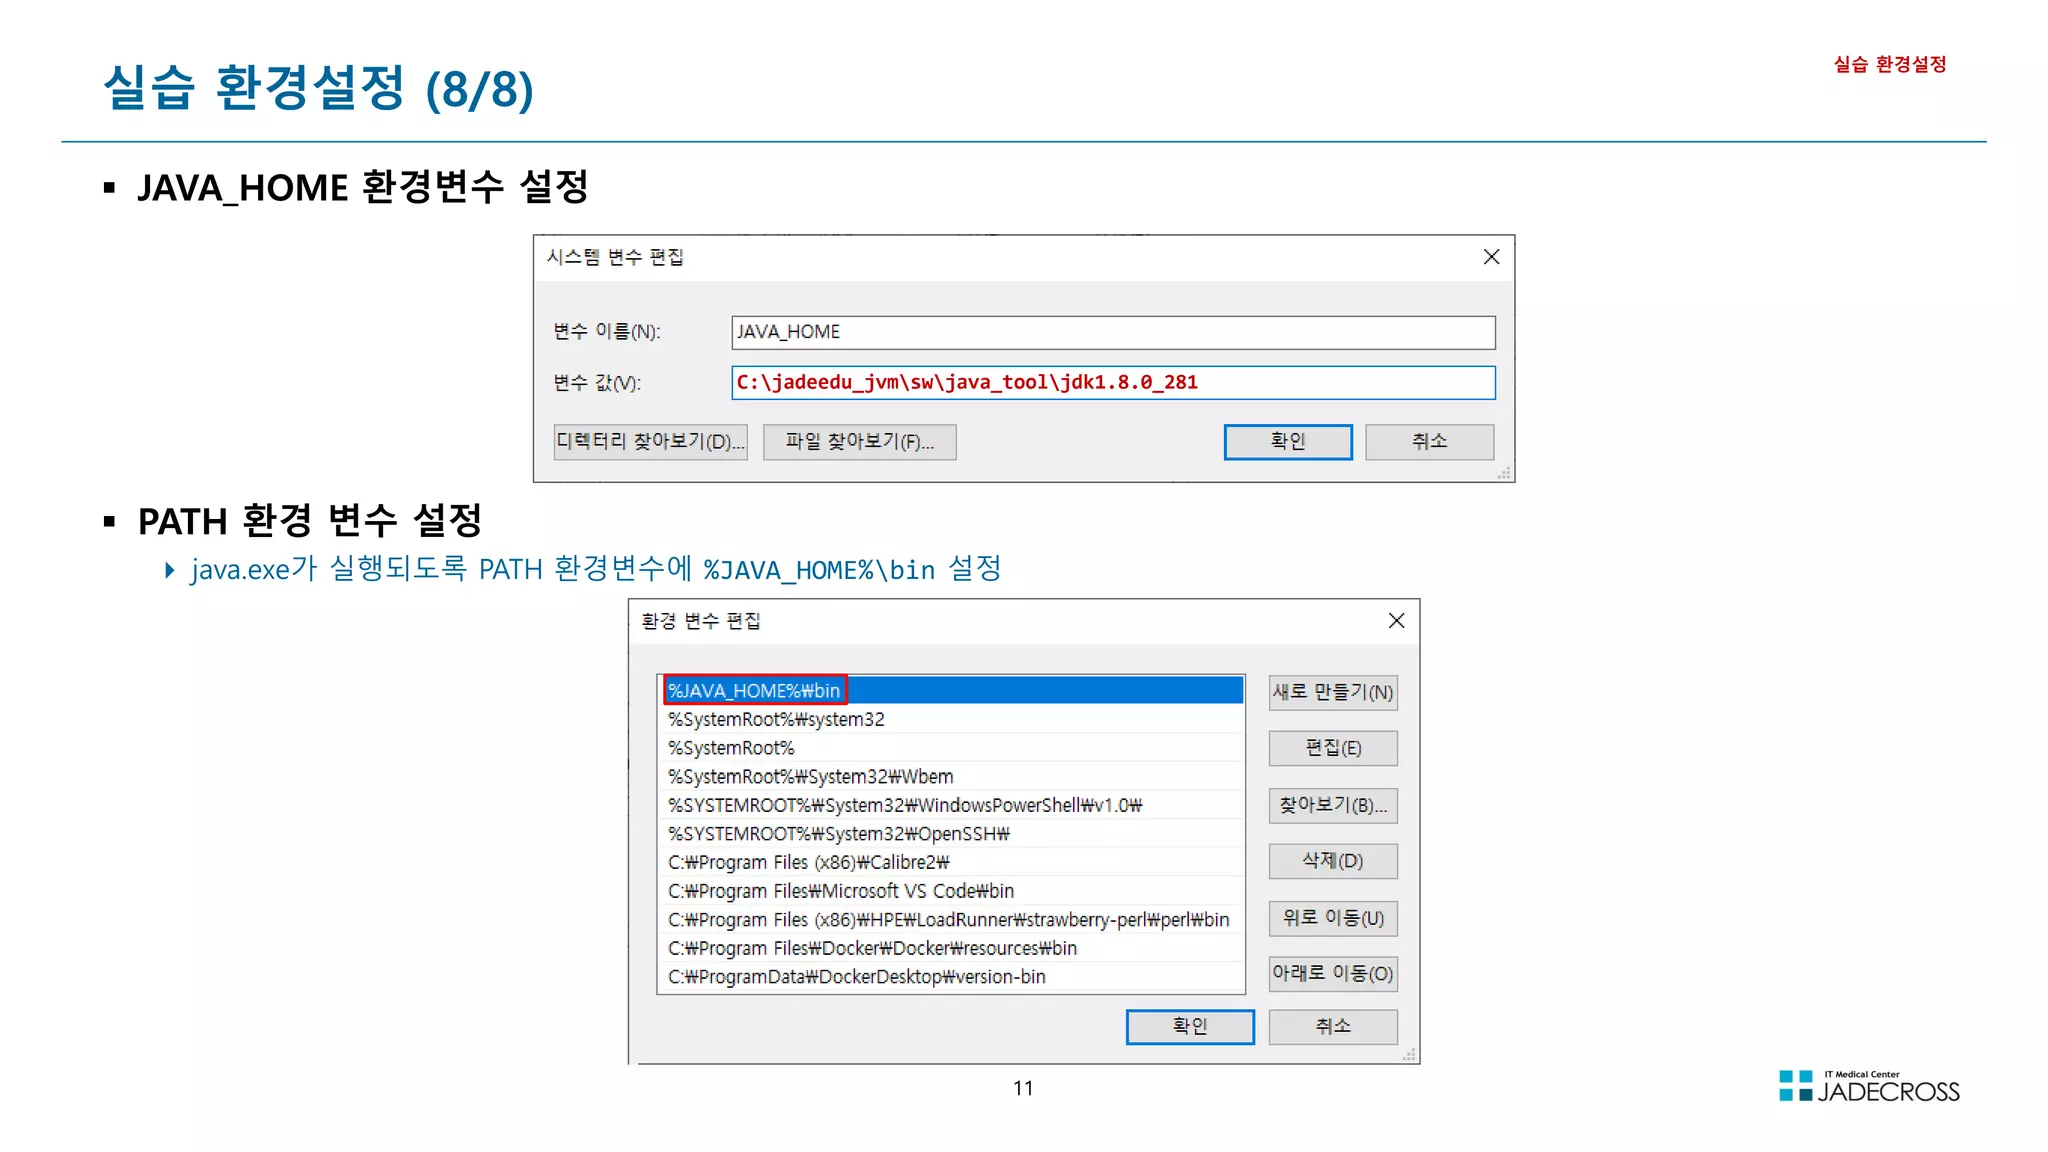

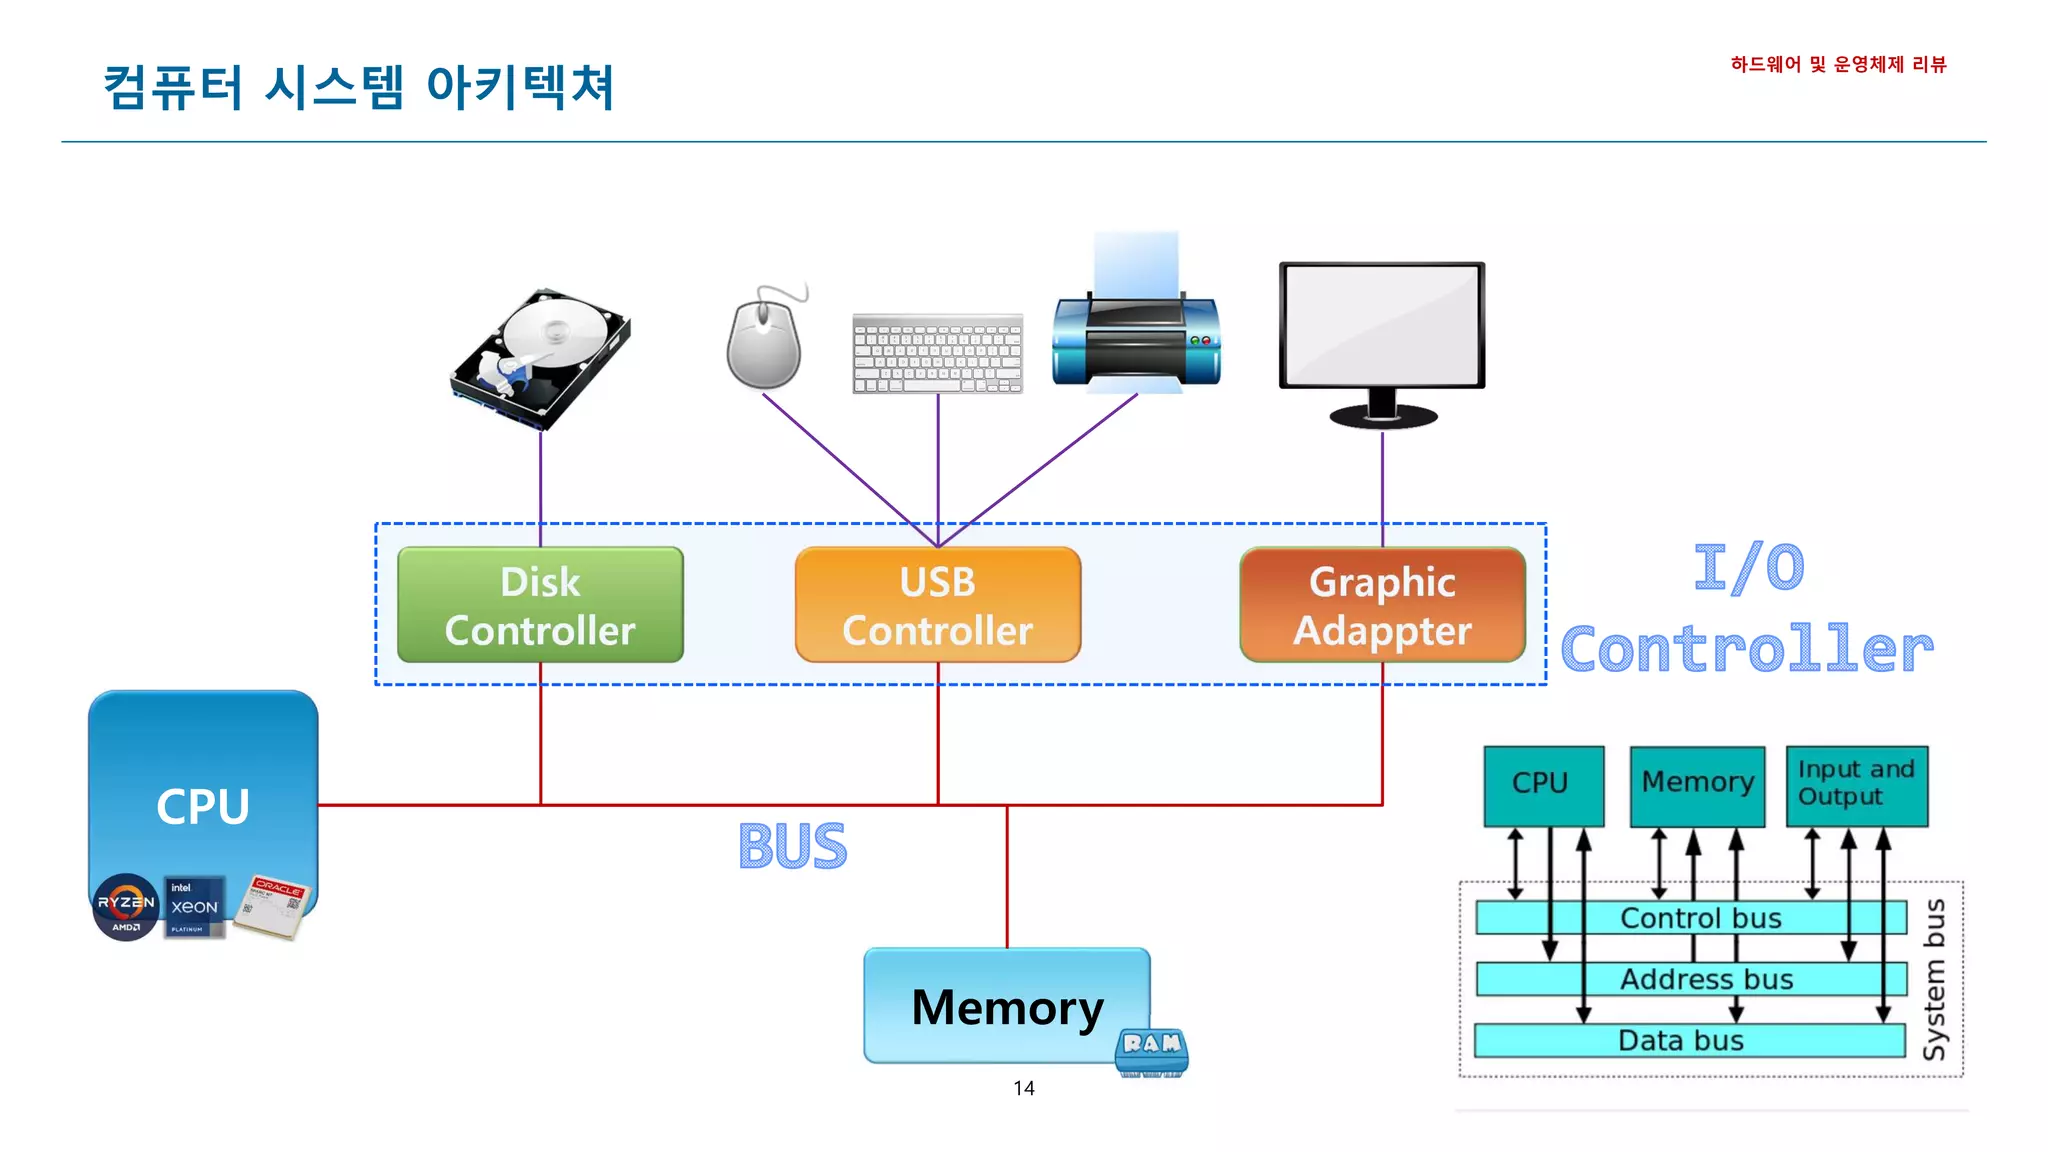
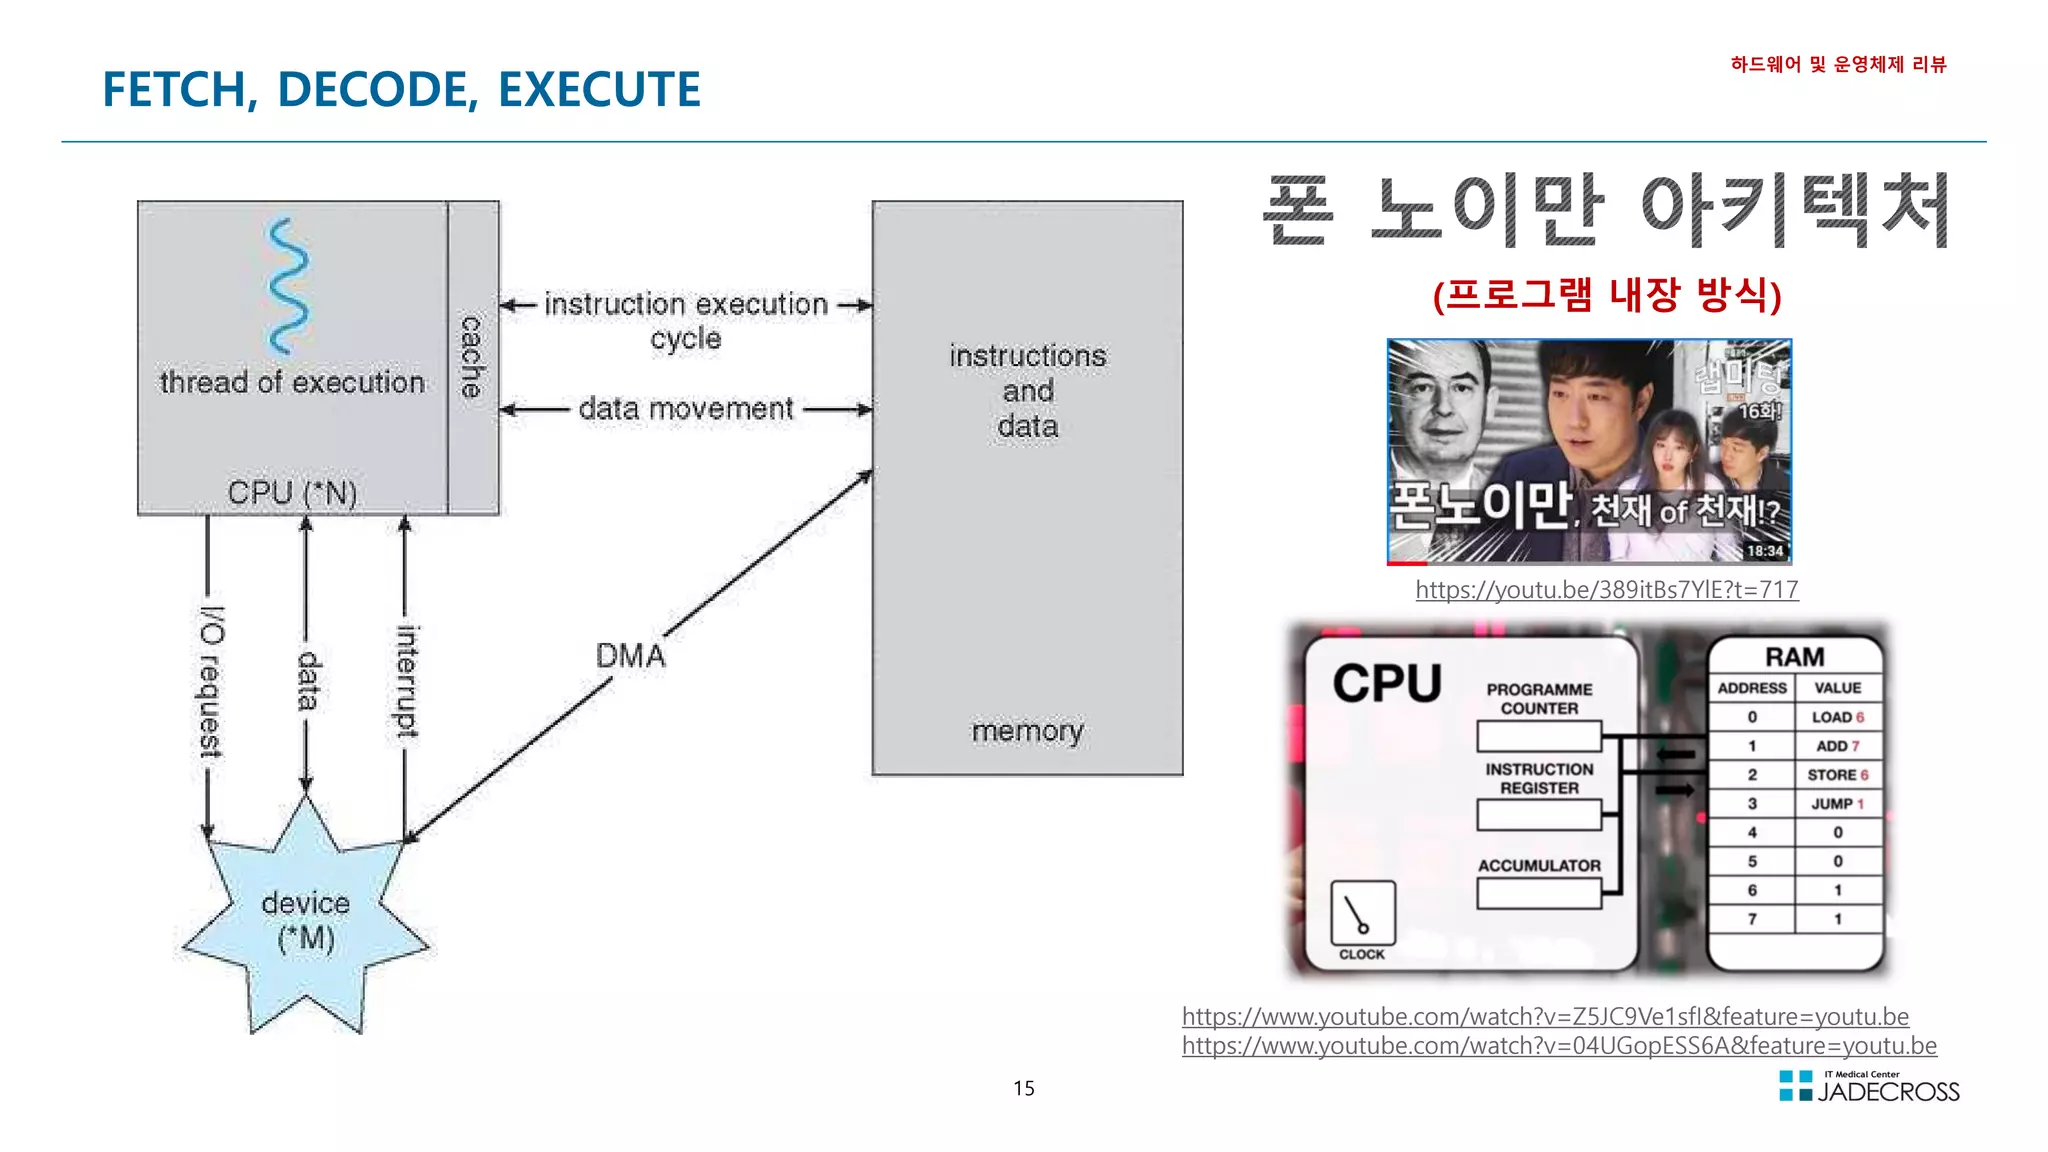
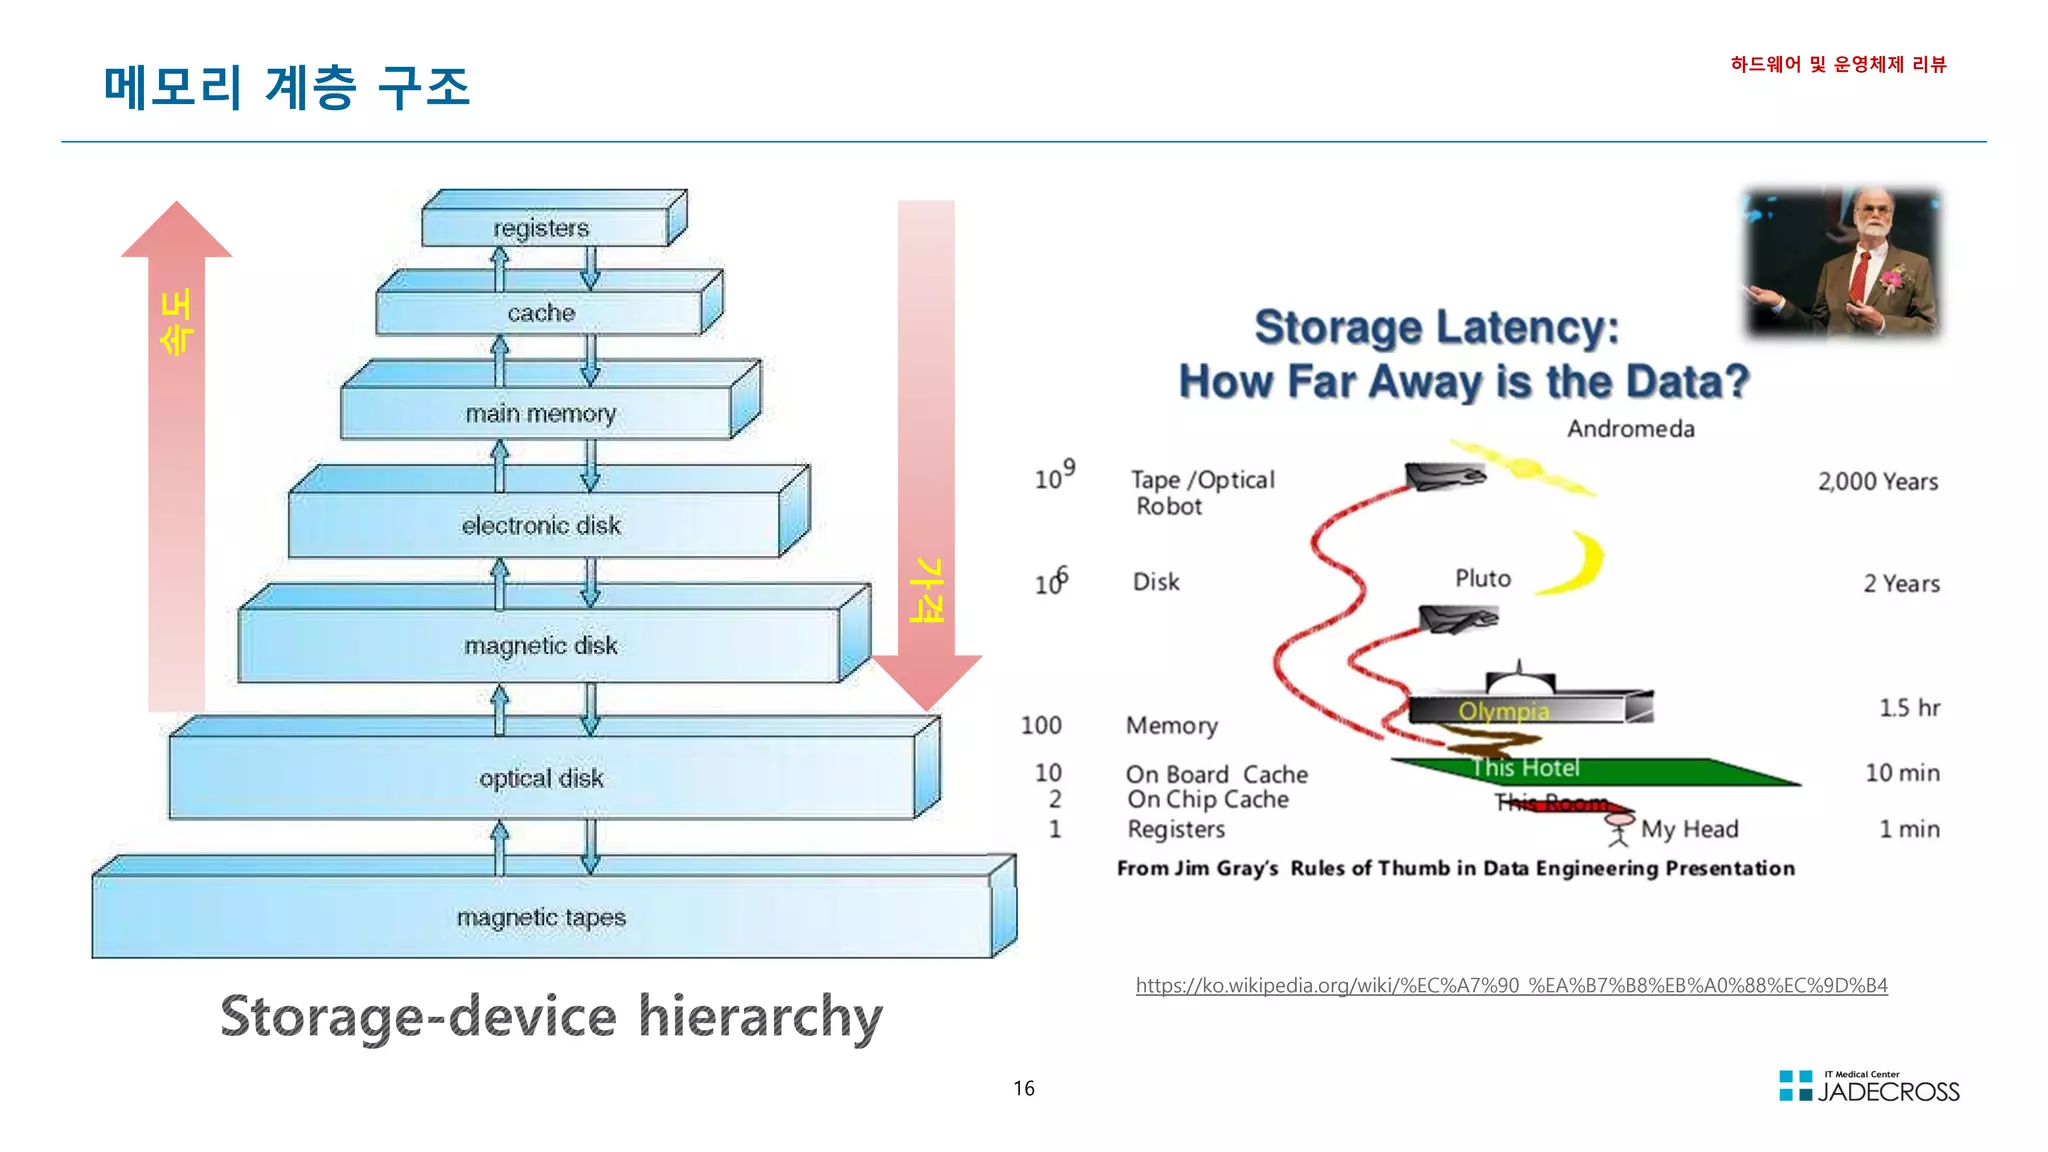
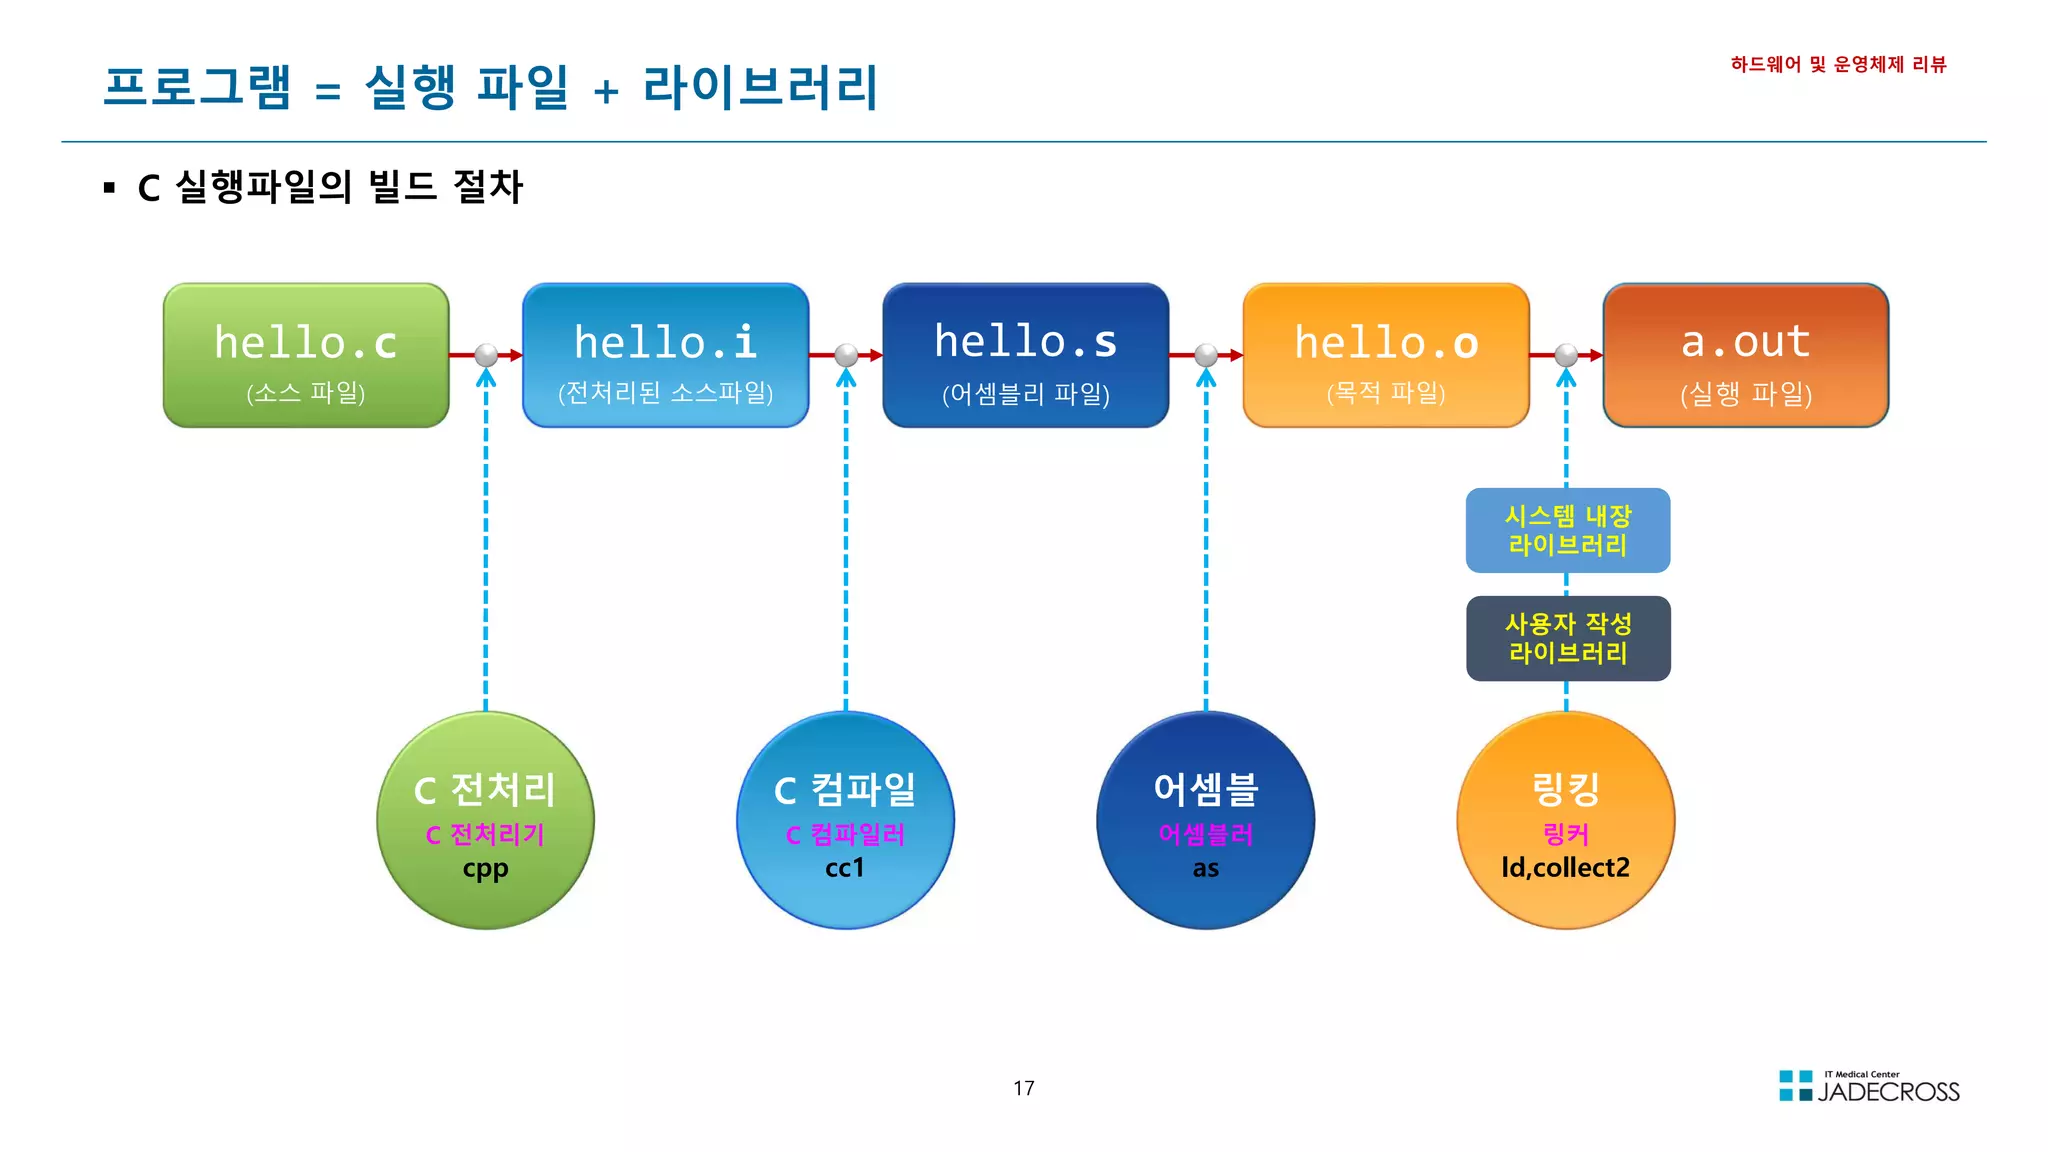
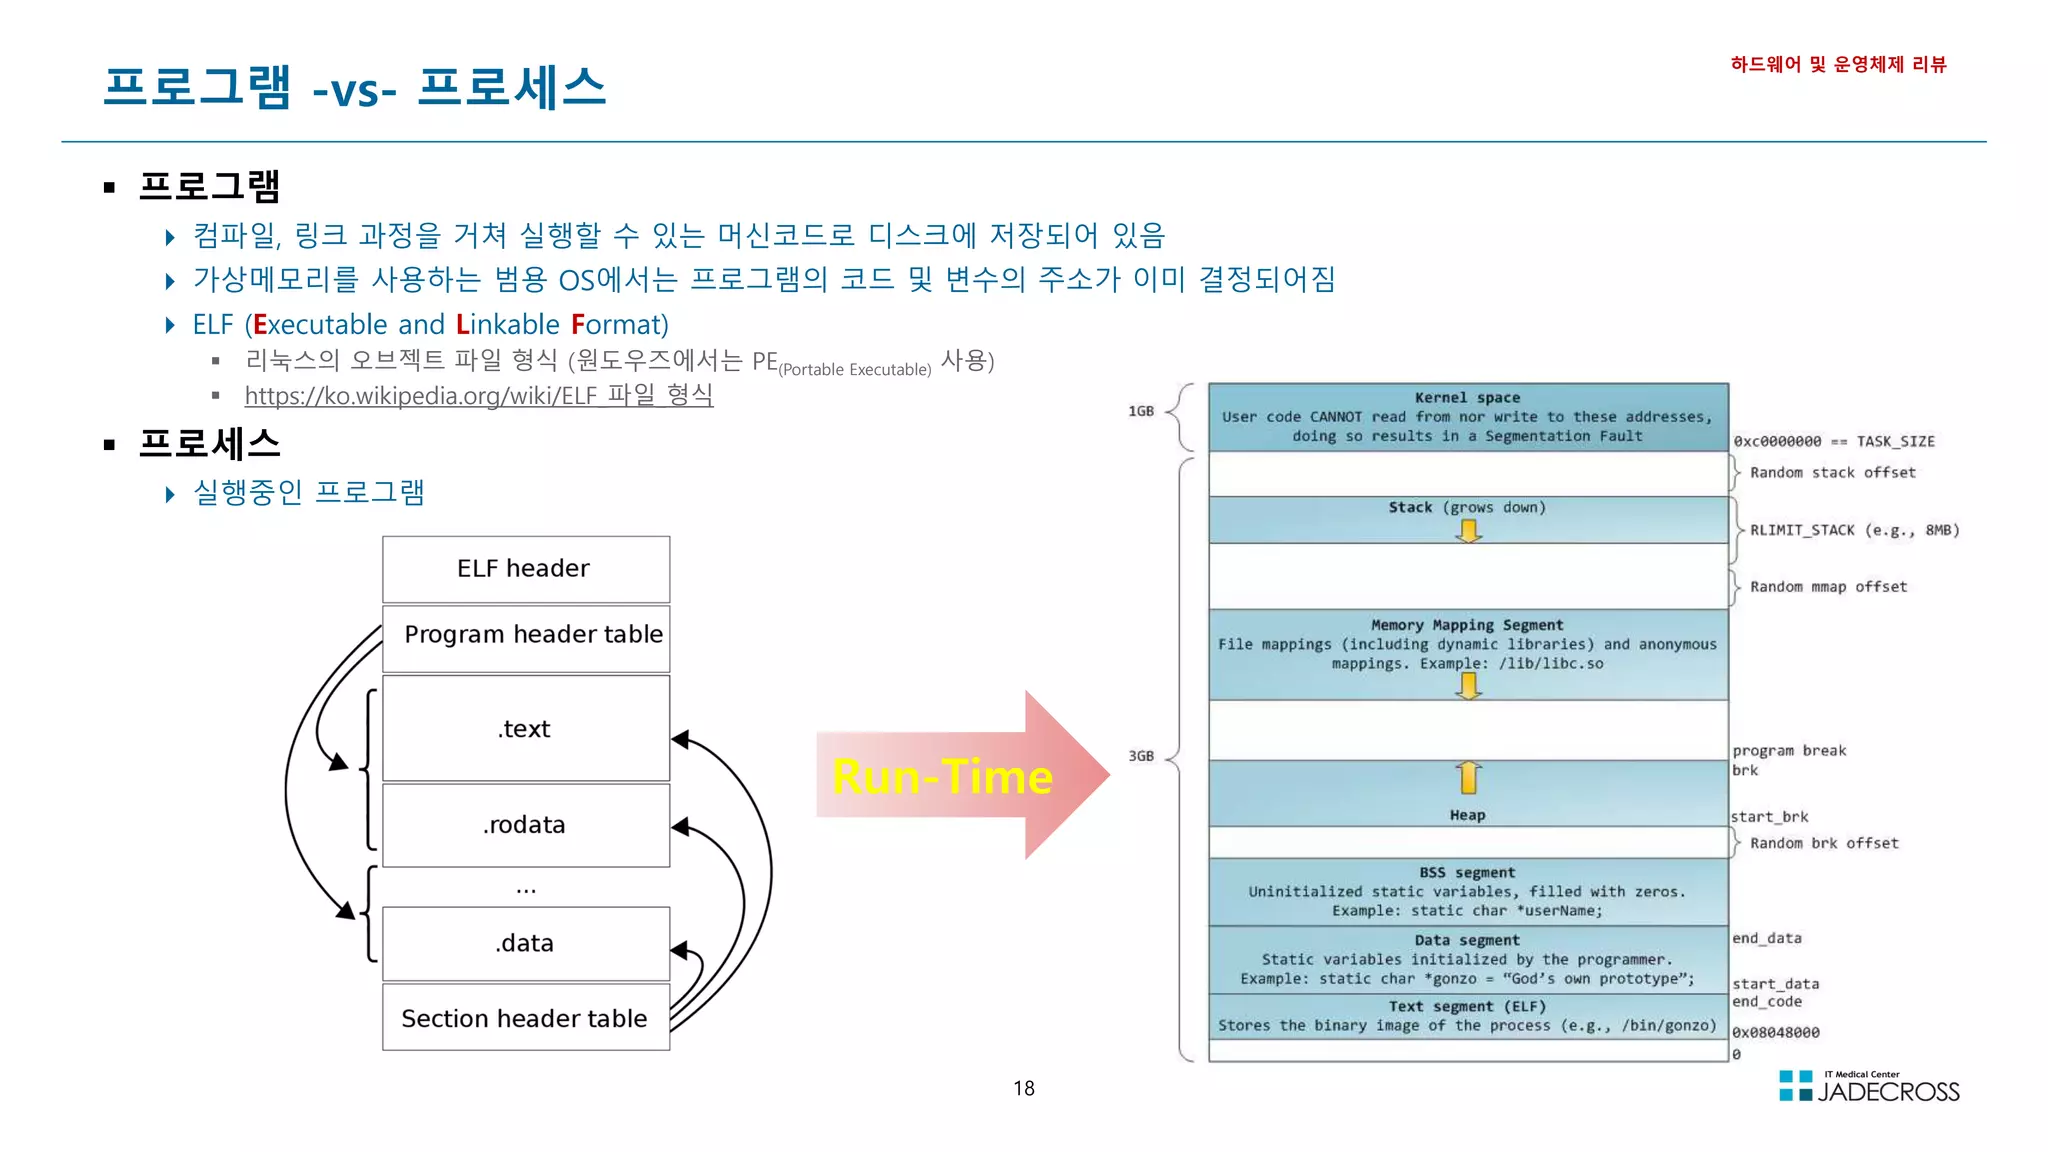
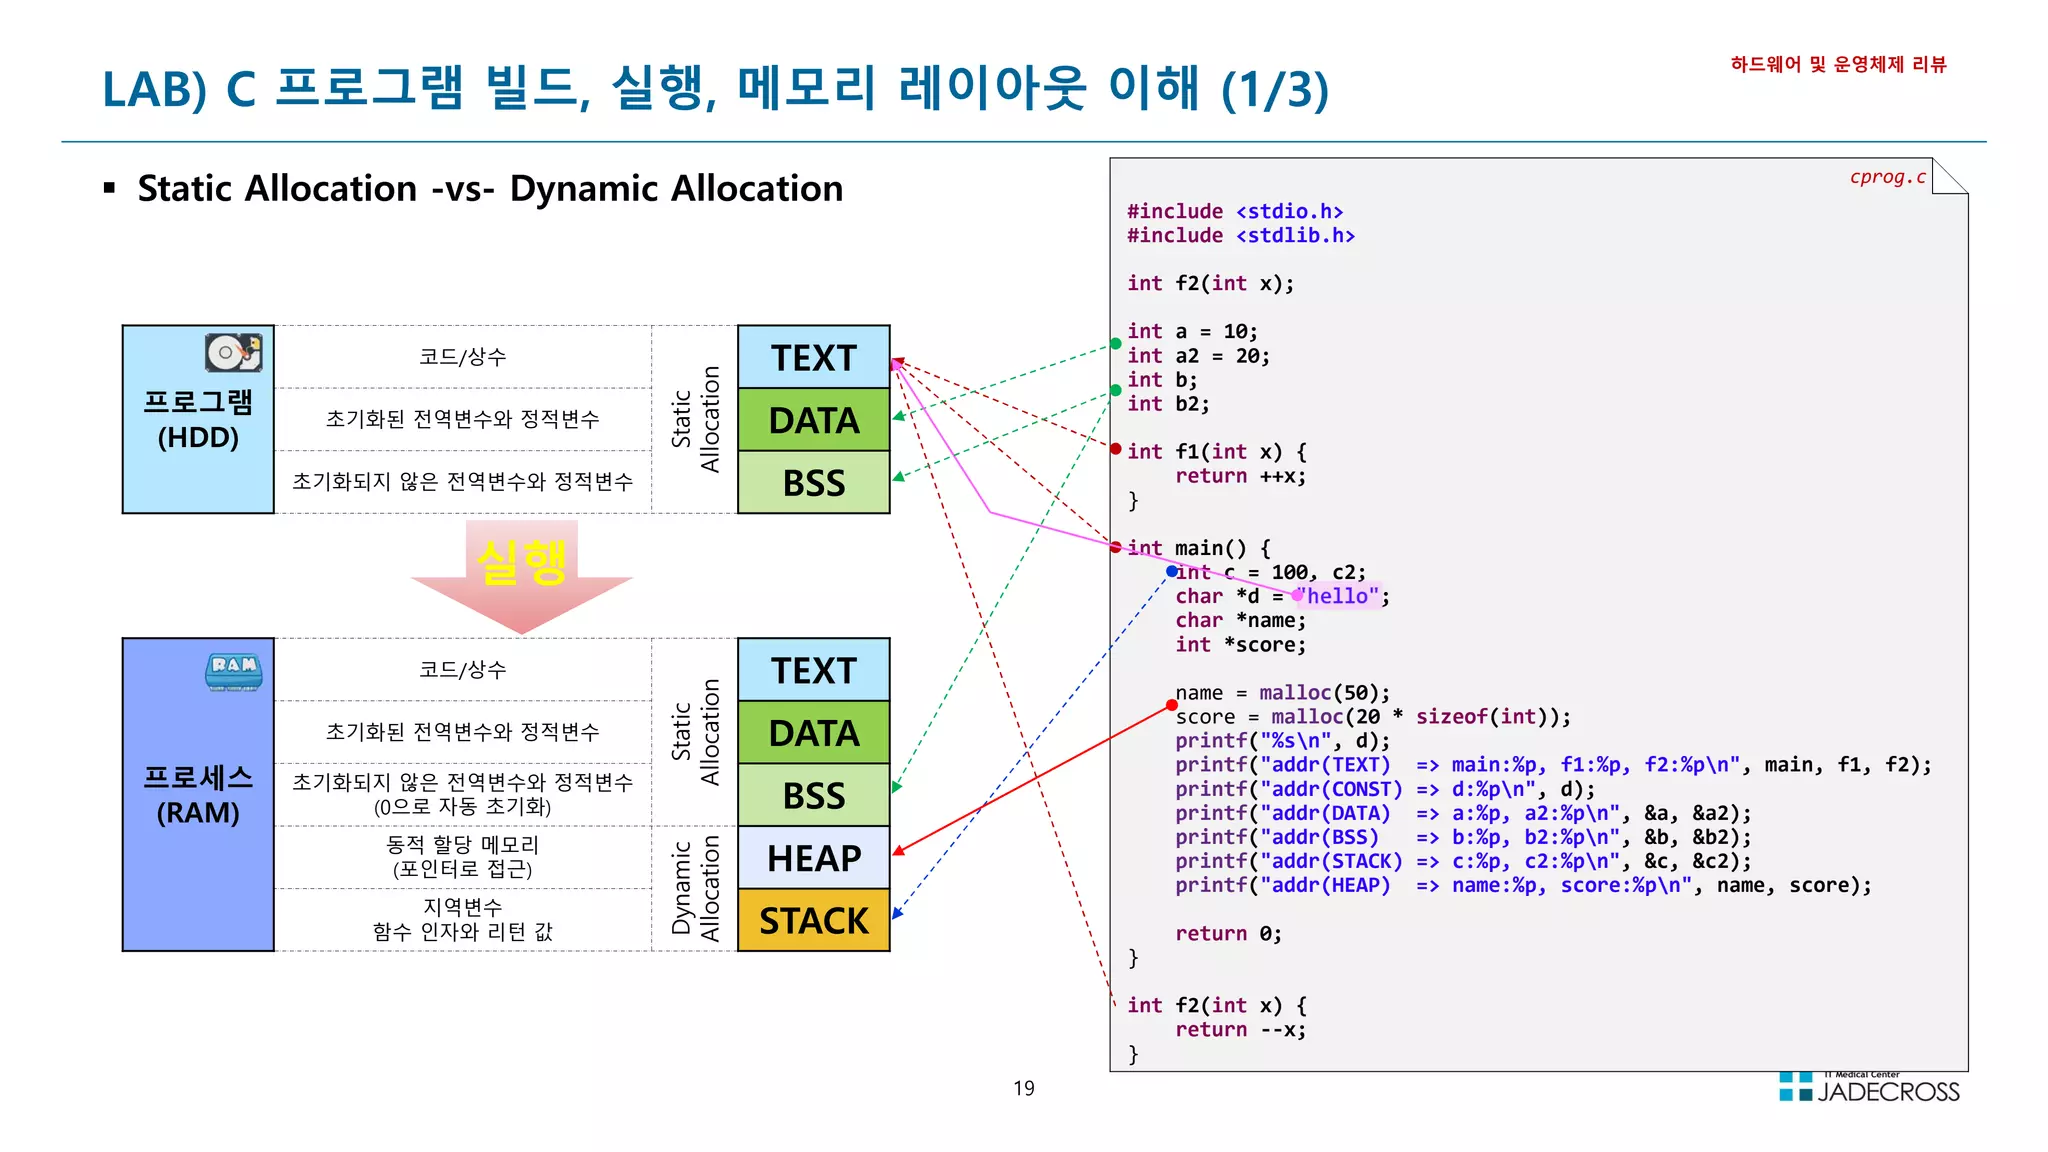
![20
LAB) C 프로그램 빌드, 실행, 메모리 레이아웃 이해 (2/3)
C 프로그램 빌드 및 주소 확인
하드웨어 및 운영체제 리뷰
C 언어 소스를 빌드하여 실행파일 생성
[root@jvmedu ~]# cd ~/lab/cprogram
[root@jvmedu cprogram]# gcc cprog.c
[root@jvmedu cprogram]# ls -l
total 16
-rwxr-xr-x 1 root root 8624 Oct 18 14:12 a.out
-rw-r--r-- 1 root root 689 Oct 18 14:10 cprog.c
빌드된 실행파일의 형식을 확인
[root@jvmedu cprogram]# file a.out
a.out: ELF 64-bit LSB executable, x86-64, version 1 (SYSV), dynamically linked (uses shared libs),
for GNU/Linux 2.6.32, BuildID[sha1]=d97dd1cd5b319eb15e2d7fe252100ad309f8c1b7, not stripped
a.out 실행파일의 변수 및 함수의 주소를 확인
[root@jvmedu cprogram]# readelf -a a.out 또는 nm a.out 으로 주소 확인
Section Headers:
[Nr] Name Type Address Offset Size EntSize Flags Link Info Align
[ 0] NULL 0000000000000000 00000000 0000000000000000 0000000000000000 0 0 0
[ 1] .text PROGBITS 0000000000000000 00000040 0000000000000027 0000000000000000 AX 0 0 1
[ 2] .rela.text RELA 0000000000000000 00000200 0000000000000030 0000000000000018 I 10 1 8
[ 3] .data PROGBITS 0000000000000000 00000067 0000000000000000 0000000000000000 WA 0 0 1
[ 4] .bss NOBITS 0000000000000000 00000067 0000000000000000 0000000000000000 WA 0 0 1
[ 5] .rodata PROGBITS 0000000000000000 00000067 000000000000000a 0000000000000000 A 0 0 1
[ 6] .comment PROGBITS 0000000000000000 00000071 000000000000002e 0000000000000001 MS 0 0 1
[ 7] .note.GNU-stack PROGBITS 0000000000000000 0000009f 0000000000000000 0000000000000000 0 0 1
[ 8] .eh_frame PROGBITS 0000000000000000 000000a0 0000000000000038 0000000000000000 A 0 0 8
[ 9] .rela.eh_frame RELA 0000000000000000 00000230 0000000000000018 0000000000000018 I 10 8 8
[10] .symtab SYMTAB 0000000000000000 000000d8 0000000000000108 0000000000000018 11 9 8
[11] .strtab STRTAB 0000000000000000 000001e0 000000000000001c 0000000000000000 0 0 1
[12] .shstrtab STRTAB 0000000000000000 00000248 0000000000000061 0000000000000000 0 0 1
Key to Flags:
W (write), A (alloc), X (execute), M (merge), S (strings), I (info), L (link order), O (extra OS processing required), G (group), T (TLS),
C (compressed), x (unknown), o (OS specific), E (exclude), l (large), p (processor specific)
...](https://image.slidesharecdn.com/jvm-230511085906-be6f1201/75/JVM_-pdf-20-2048.jpg)
![21
LAB) C 프로그램 빌드, 실행, 메모리 레이아웃 이해 (3/3)
프로그램을 실행하여 프로세스 상태의 메모리 레이아웃 이해
하드웨어 및 운영체제 리뷰
a.out 프로그램을 실행하고 결과를 보고 프로세스의 메모리 레이아웃에 대해 이해
[root@jvmedu cprogram]# ./a.out
hello
addr(TEXT) => main:0x4005cd, f1:0x4005bd, f2:0x4006ad
addr(CONST) => d:0x400750
addr(DATA) => a:0x601044, a2:0x601048
addr(BSS) => b:0x601050, b2:0x601054
addr(STACK) => c:0x7fff55dabff4, c2:0x7fff55dabff0
addr(HEAP) => name:0xbbf010, score:0xbbf050](https://image.slidesharecdn.com/jvm-230511085906-be6f1201/75/JVM_-pdf-21-2048.jpg)
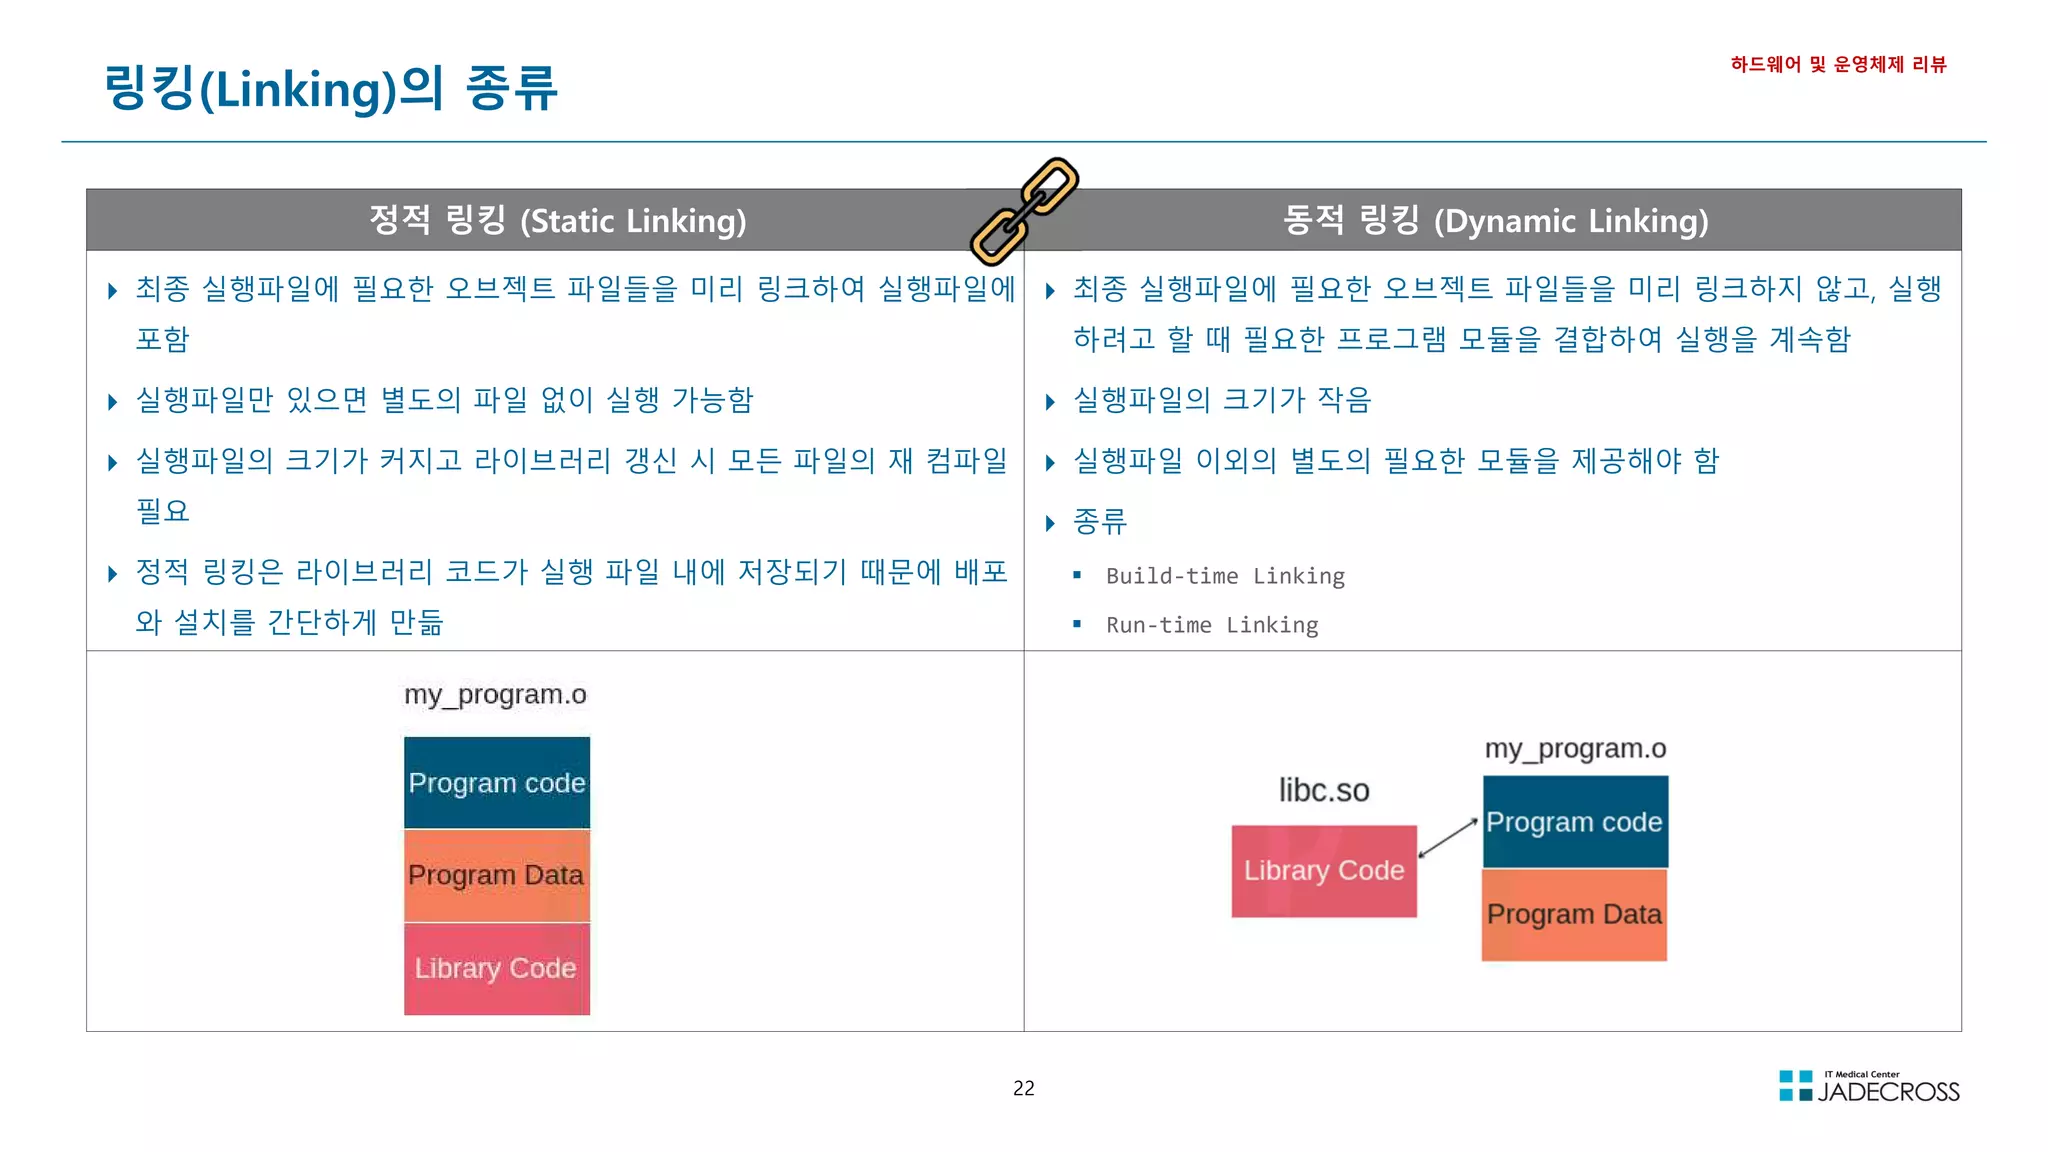
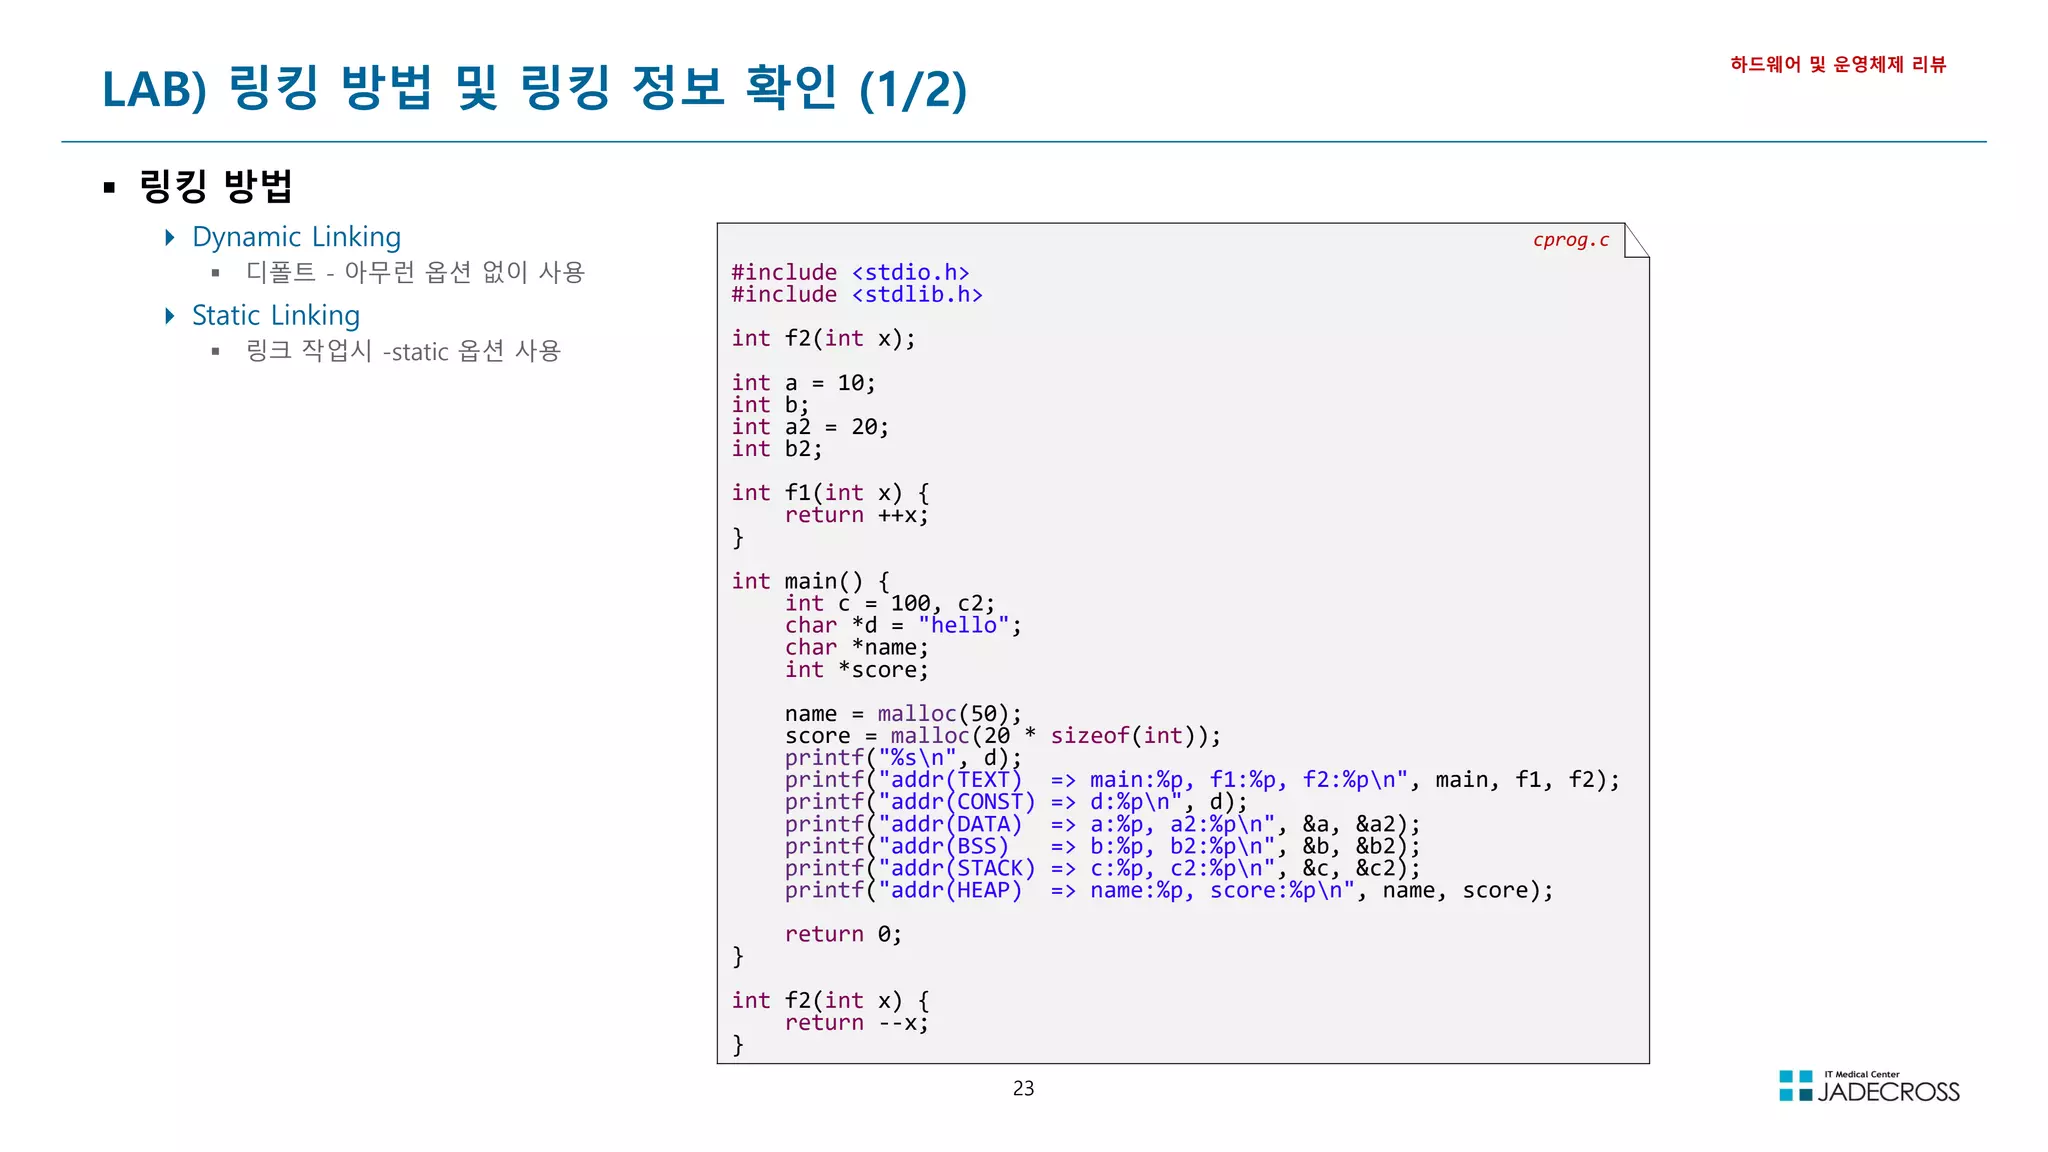
![24
LAB) 링킹 방법 및 링킹 정보 확인 (2/2)
하드웨어 및 운영체제 리뷰
Dynamic Linking Static Linking
cprog.c 소스파일을 Dynamic Linking으로 a.out_dynamic 실행 파일을 빌드 cprog.c 소스파일을 Static Linking으로 a.out_static 실행 파일 빌드
[root@jvmedu ~]# cd ~/lab/cprogram
[root@jvmedu cprogram]# gcc cprog.c -o a.out_dynamic
[root@jvmedu ~]# cd ~/lab/cprogram
[root@jvmedu cprogram]# gcc -static cprog.c -o a.out_static
빌드된 a.out_dynamic 실행파일의 파일 정보 확인 빌드된 a.out_static 실행파일의 파일 정보 확인
[root@jvmedu cprogram]# file a.out_dynamic
a.out_dynamic: ELF 64-bit LSB executable, x86-64, version 1 (SYSV),
dynamically linked (uses shared libs), for GNU/Linux 2.6.32,
BuildID[sha1]=fef585c519097eb7b47761185909d8d20ec47545, not stripped
[root@jvmedu cprogram]# file a.out_static
a.out_static: ELF 64-bit LSB executable, x86-64, version 1 (GNU/Linux),
statically linked, for GNU/Linux 2.6.32,
BuildID[sha1]=c6acb31c946e031cd81c5c9e54fb55ab2ff73675, not stripped
빌드된 a.out_dynamic 실행파일의 SYMBOL 정보 확인 빌드된 a.out_static 실행파일의 SYMBOL 정보 확인
[root@jvmedu 01]# nm a.out_dynamic
000000000060103c D a
0000000000601040 D a2
0000000000601048 B b
000000000060104c B b2
0000000000601044 B __bss_start
0000000000601044 b completed.6355
0000000000601038 D __data_start
0000000000601038 W data_start
00000000004004f0 t deregister_tm_clones
0000000000400560 t __do_global_dtors_aux
0000000000600e18 t __do_global_dtors_aux_fini_array_entry
0000000000400738 R __dso_handle
0000000000600e28 d _DYNAMIC
...
[root@jvmedu 01]# nm a.out_static
00000000006bd084 D a
00000000006bd088 D a2
000000000041ce80 T abort
00000000006bf730 B __abort_msg
000000000043de60 W access
000000000043de60 T __access
0000000000490dd0 t add_fdes
000000000044b700 t add_module.isra.1
0000000000440d90 t add_name_to_object.isra.2
00000000006be708 d adds.8362
000000000041d300 T __add_to_environ
0000000000488690 t add_to_global
00000000006bf4c0 V __after_morecore_hook
...
Dynamic Linking된 바이너리와 Static Linking된 바이너리의 사이즈 비교
[root@jvmedu cprogram]# ls -lh a.out_*
-rwxr-xr-x 1 root root 8.6K Oct 24 14:51 a.out_dynamic
-rwxr-xr-x 1 root root 842K Oct 24 20:05 a.out_static
Static Linking의
사이즈가 97배 더 큼](https://image.slidesharecdn.com/jvm-230511085906-be6f1201/75/JVM_-pdf-24-2048.jpg)
![25
LAB) Shared Library 제작 (1/2)
Shared Library 제작
gcc -c -fPIC max.c
gcc -c -fPIC min.c
gcc -shared -o libtest.so max.o min.o
하드웨어 및 운영체제 리뷰
max.c 와 min.c를 빌드하여 object 파일이 생성되었는지 확인
[root@jvmedu ~]# cd ~/lab/cprogram/libTest1/libSrc
[root@jvmedu libSrc]# gcc -c max.c min.c
[root@jvmedu libSrc]# ls -l *.o
-rw-r--r-- 1 root root 1248 Oct 24 15:37 max.o
-rw-r--r-- 1 root root 1248 Oct 24 15:37 min.o
gcc의 -shared 옵션으로 libtest.o 라는 Shared Library 생성하고 파일 정보를 확인
[root@jvmedu libSrc]# gcc -shared -o libtest.so max.o min.o
[root@jvmedu libSrc]# file libtest.so
libtest.so: ELF 64-bit LSB shared object, x86-64, version 1 (SYSV), dynamically
linked, BuildID[sha1]=f2167ffbae307a30ecde862fd12777949ce917d4, not stripped
[라이브러리 실습 소스]](https://image.slidesharecdn.com/jvm-230511085906-be6f1201/75/JVM_-pdf-25-2048.jpg)
![26
LAB) Shared Library 제작 (2/2)
Shared Library 이용
gcc -c -I<라이브러리헤더파일위치> app.c
gcc app.o -ltest -L<정적라이브러리위치>
하드웨어 및 운영체제 리뷰
[라이브러리 실습 소스]
appSrc 폴더로 이동하여, app.c 소스파일을 빌드하여 object 파일을 생성
[root@jvmedu ~]# cd ~/lab/cprogram/libTest1/appSrc
[root@jvmedu appSrc]# gcc -c -I ../include/ app.c
-L 옵션으로 Library 위치를 명시하고 링크를 수행하고, 실행파일의 파일 정보를 확인
[root@jvmedu appSrc]# gcc app.o -ltest -L ../libSrc/
[root@jvmedu appSrc]# file a.out
a.out: ELF 64-bit LSB executable, x86-64, version 1 (SYSV), dynamically linked
(uses shared libs), for GNU/Linux 2.6.32,
BuildID[sha1]=91e33185650af97a7869a15687fdcaa324efd8bb, not stripped
링크된 실행파일을 실행해보고 정상 수행되는지 확인하고, 실패하는 원인은?
[root@jvmedu appSrc]# ./a.out
./a.out: error while loading shared libraries: libtest.so: cannot open shared
object file: No such file or directory
LD_LIBRARY_PATH 환경변수에 libtest.so 파일경로를 추가하고, a.out 실행
[root@jvmedu appSrc]# export
LD_LIBRARY_PATH=$LD_LIBRARY_PATH:/root/lab/cprogram/libTest1/libSrc
[root@jvmedu appSrc]# ./a.out
max(5, 2) : 5
min(5, 2) : 2
a.out 실행파일에 포함된 동적 라이브러를 확인
[root@jvmedu appSrc]# ldd a.out
linux-vdso.so.1 => (0x00007ffd495e4000)
libtest.so => /root/lab/cprogram/libTest1/libSrc/libtest.so (0x00007fa4615ba000)
libc.so.6 => /lib64/libc.so.6 (0x00007fa4611ec000)
/lib64/ld-linux-x86-64.so.2 (0x00007fa4617bc000)](https://image.slidesharecdn.com/jvm-230511085906-be6f1201/75/JVM_-pdf-26-2048.jpg)
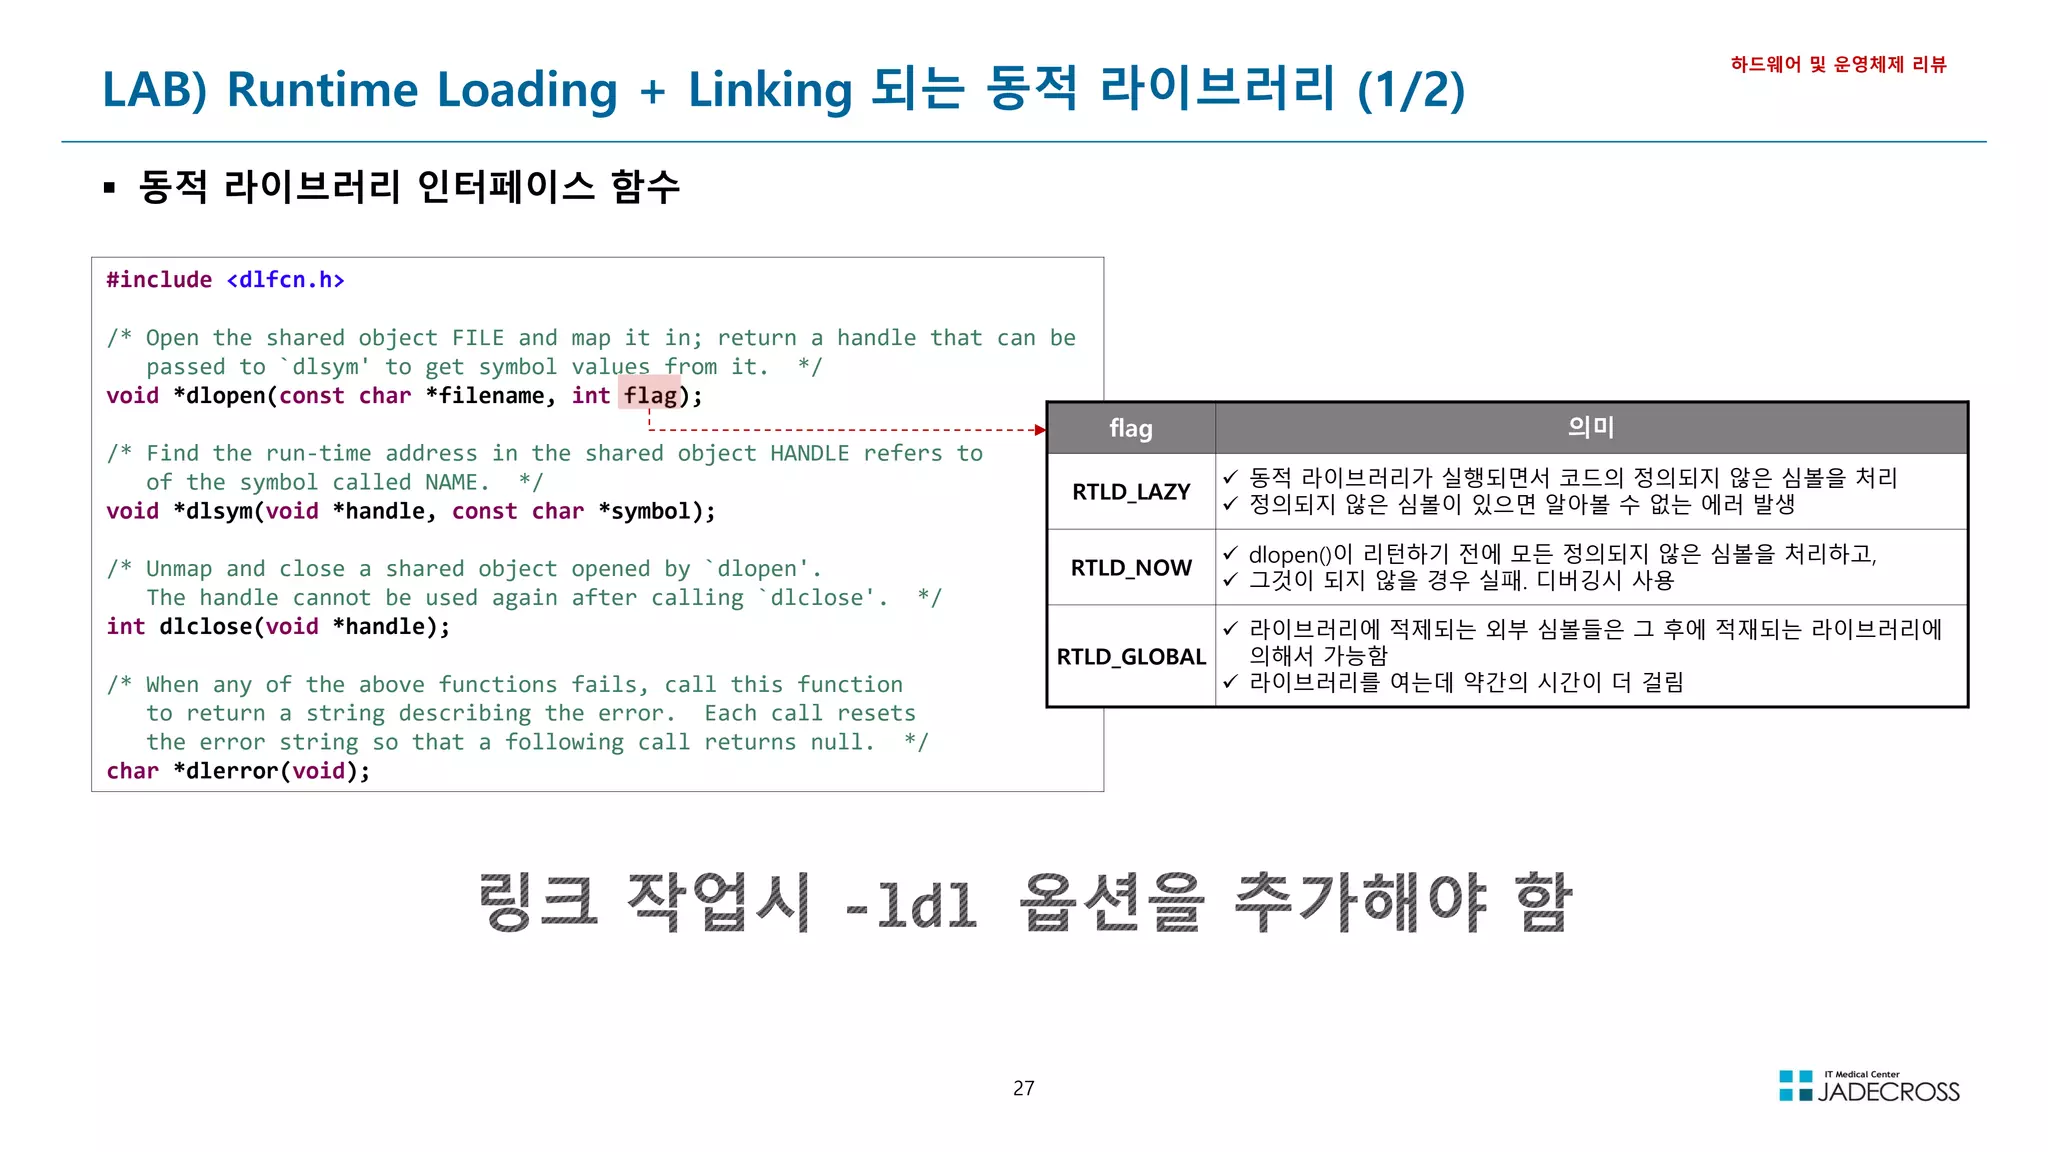
![28
LAB) Runtime Loading + Linking 되는 동적 라이브러리 (2/2)
동적 라이브러리 사용 절차
1) 공유 라이브러리 제작 & LD_LIBRARY_PATH에 등록
2) 동적 라이브러리를 사용하는 응용프로그램 작성 : dltest.c
3) 동적 라이브러리를 이용하는 응용프로그램 컴파일
4) 동적 라이브러리를 사용한 응용프로그램 실행
동적 라이브러리 실습
하드웨어 및 운영체제 리뷰
dltest.c
#include <stdio.h>
#include <stdlib.h>
#include <dlfcn.h>
typedef int (*FP)(int, int);
int main(void) {
void *handle;
FP fp_max, fp_min;
char *error;
handle = dlopen("libtest.so", RTLD_LAZY);
if (!handle) {
fputs(dlerror(), stderr);
exit(1);
}
fp_max = dlsym(handle, "max");
if ((error = dlerror()) != NULL) {
fprintf(stderr, "%s", error);
exit(1);
}
fp_min = dlsym(handle, "min");
if ((error = dlerror()) != NULL) {
fprintf(stderr, "%s", error);
exit(1);
}
printf("max(7, 4) : %dn", fp_max(7, 4));
printf("min(5, 2) : %dn", fp_min(5, 2));
dlclose(handle);
return 0;
}
① 공유 라이브러리 제작 & LD_LIBRARY_PATH에 등록
앞 슬라이드에서 작업 완료
② 동적 라이브러리를 사용하는 응용프로그램 작성 : dltest.c
옆의 소스 참고
③ 동적 라이브러리를 이용하는 응용프로그램 컴파일
[root@jvmedu ~]# cd ~/lab/cprogram
[root@jvmedu cprogram]# gcc dltest.c -ldl
④ 동적 라이브러리를 사용한 응용프로그램 실행
[root@jvmedu cprogram]# ./a.out
max(7, 4) : 7
min(5, 2) : 2
a.out 실행파일에 libtest.so 동적 라이브러리 정보가 링크되지 않았음을 확인
[root@jvmedu cprogram]# ldd a.out
linux-vdso.so.1 => (0x00007ffe25de1000)
libdl.so.2 => /lib64/libdl.so.2 (0x00007fc92e4f2000)
libc.so.6 => /lib64/libc.so.6 (0x00007fc92e124000)
/lib64/ld-linux-x86-64.so.2 (0x00007fc92e6f6000)
Runtime Loading
Runtime
Linking](https://image.slidesharecdn.com/jvm-230511085906-be6f1201/75/JVM_-pdf-28-2048.jpg)
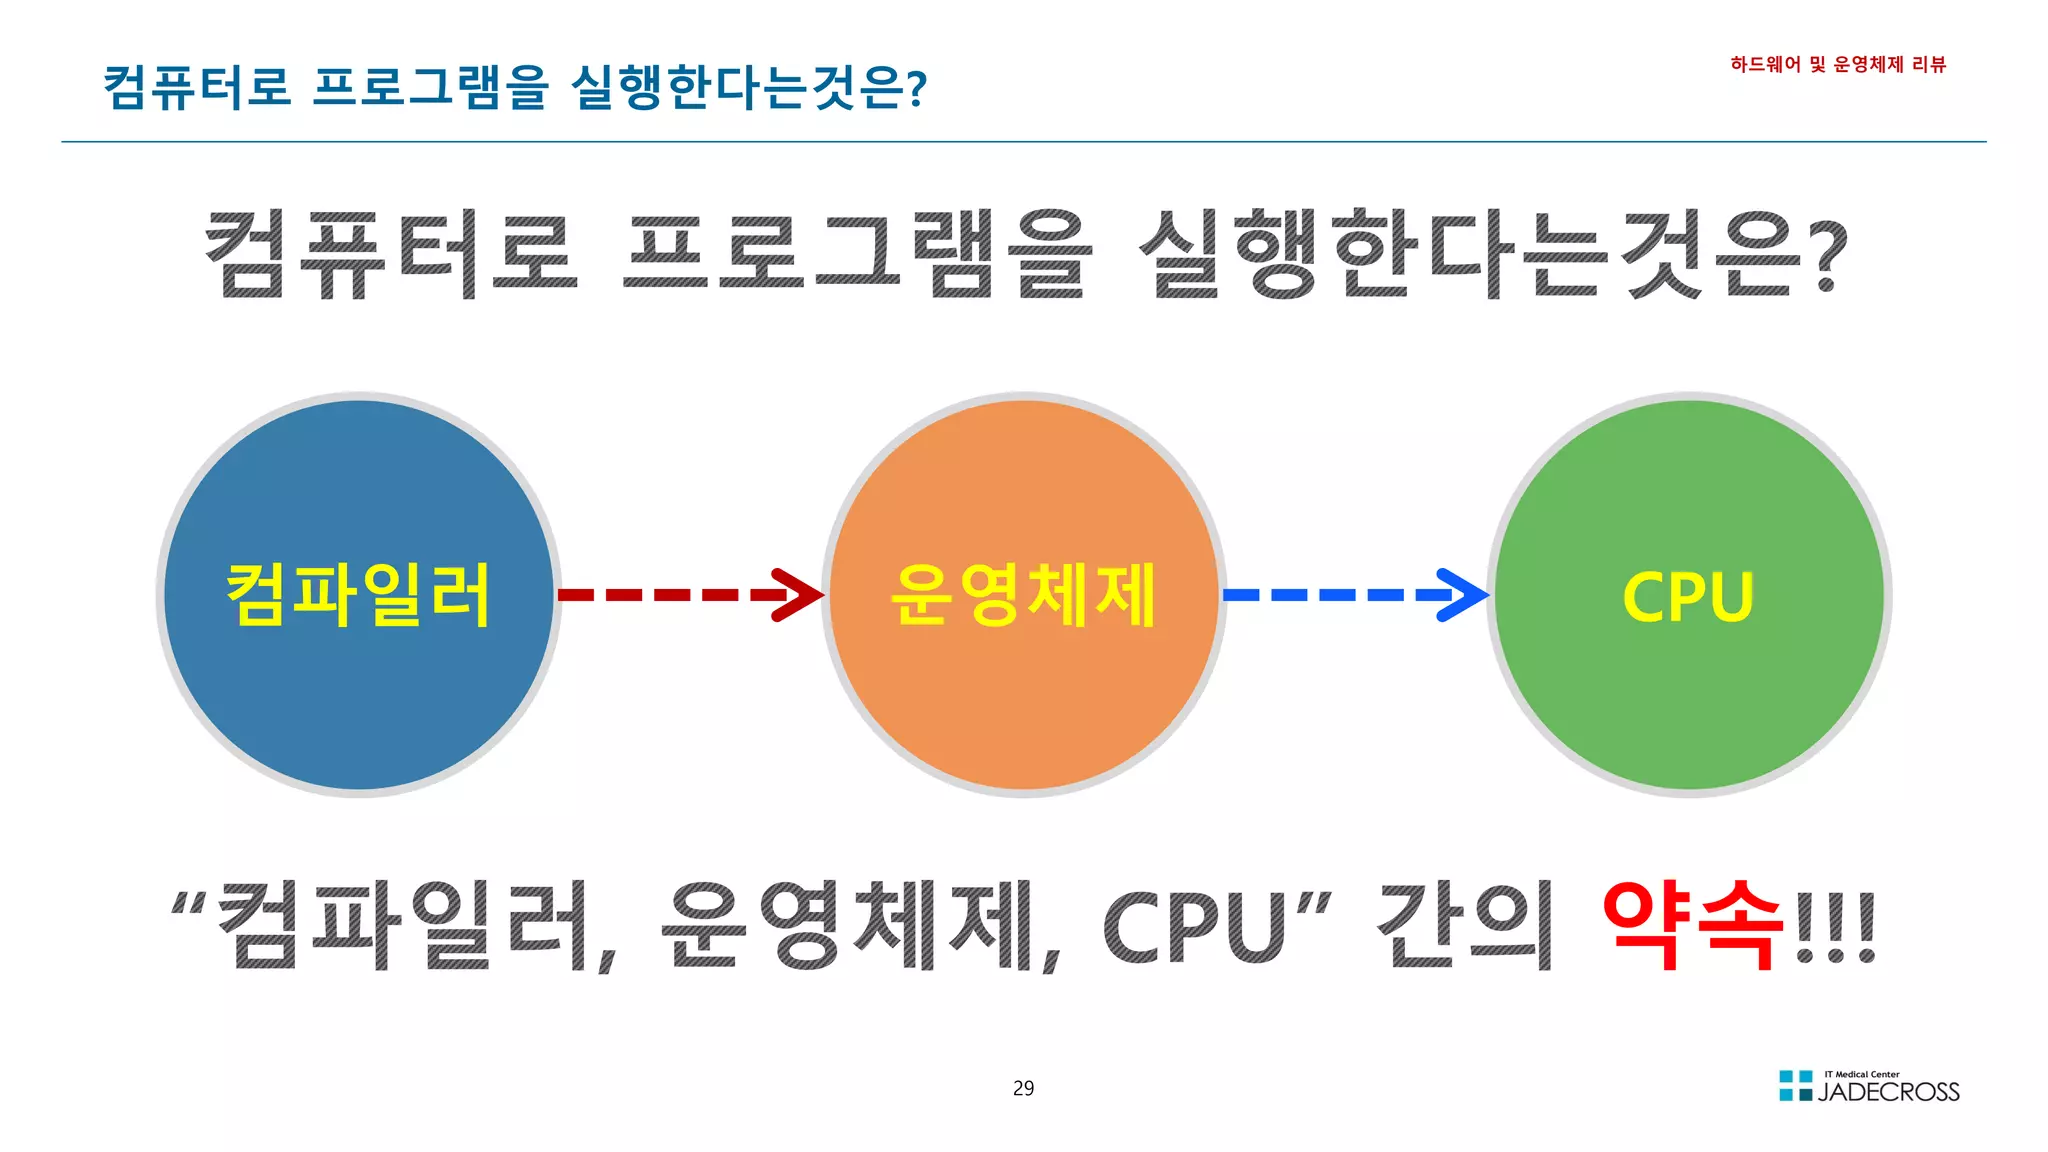
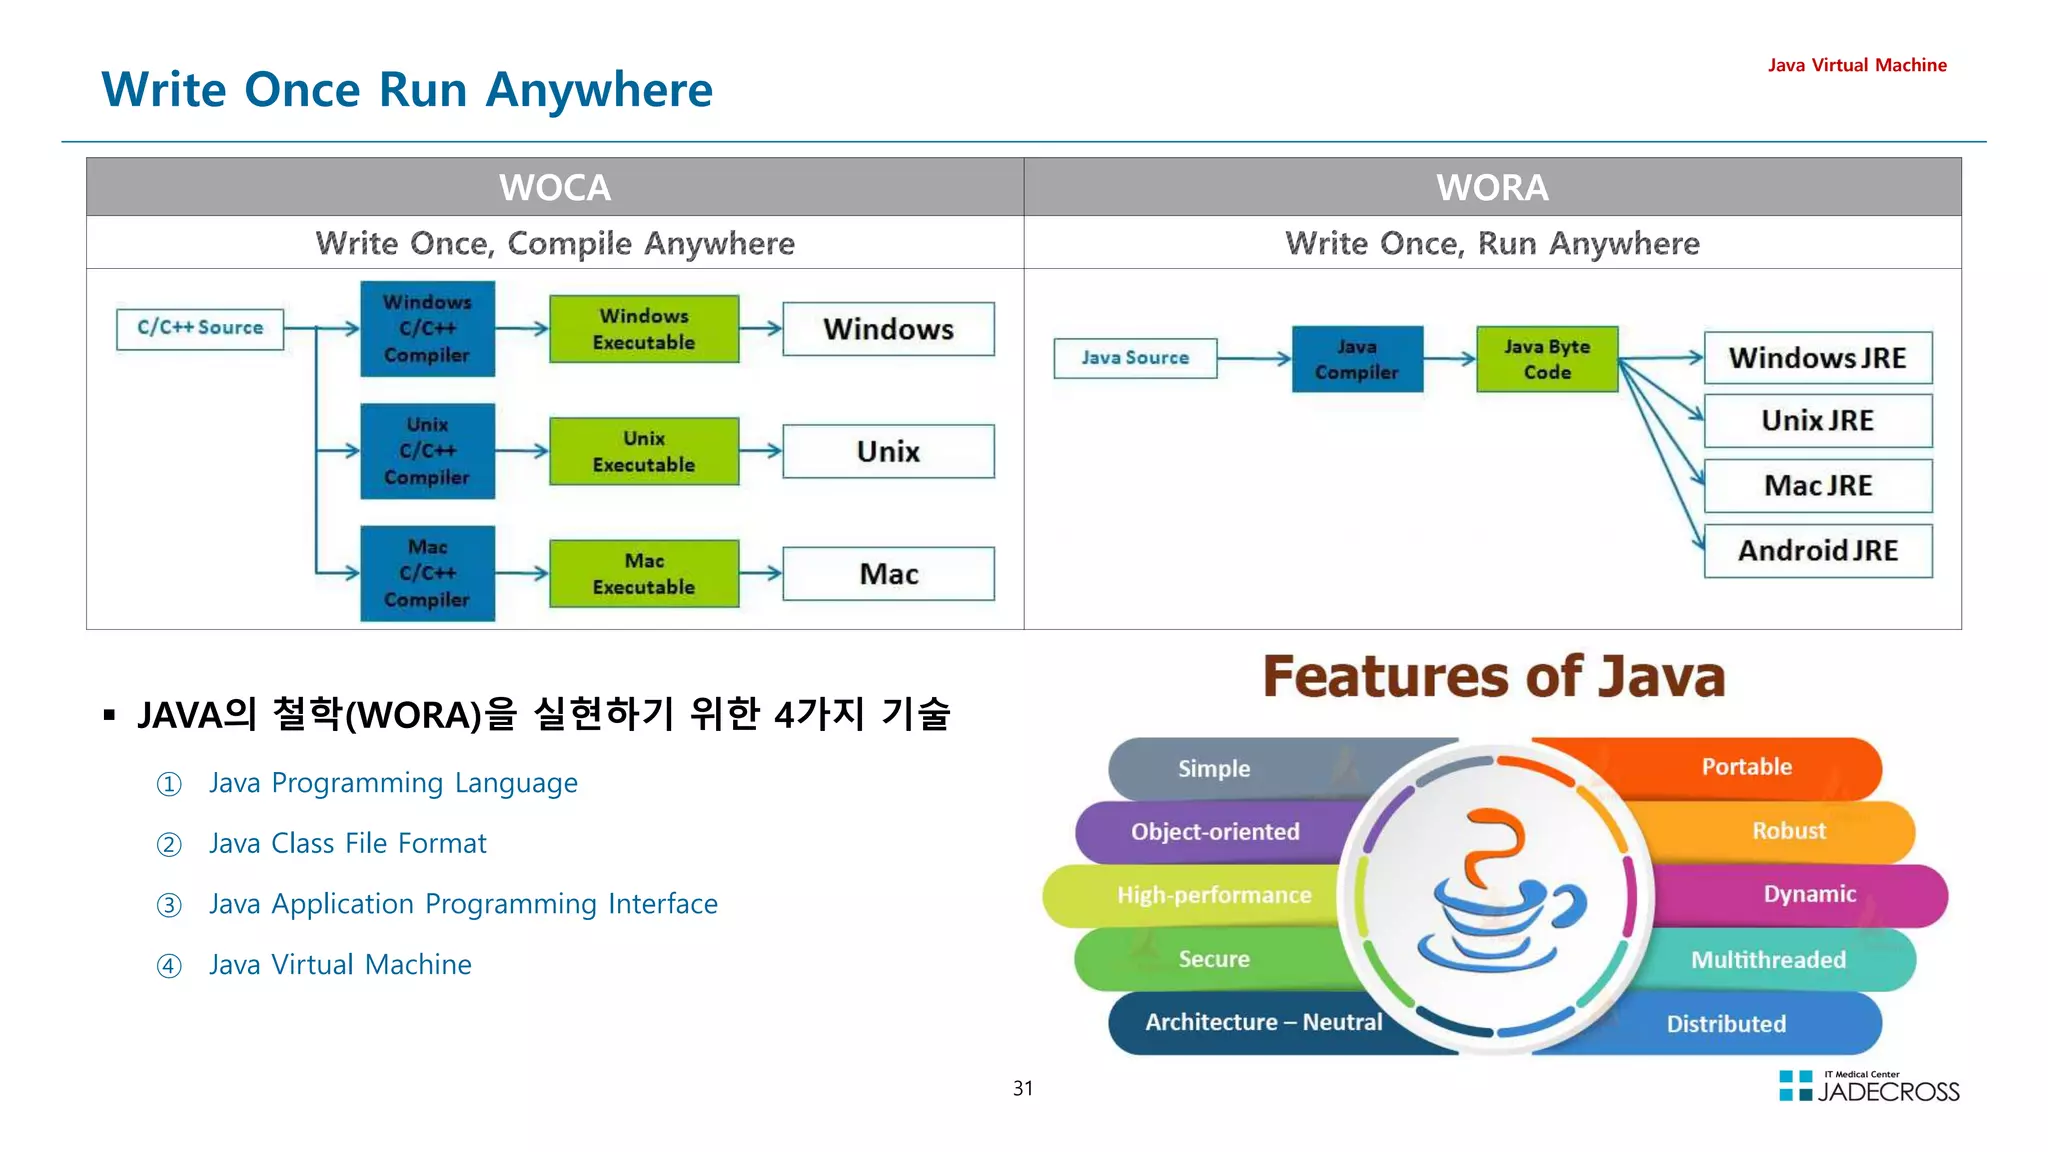
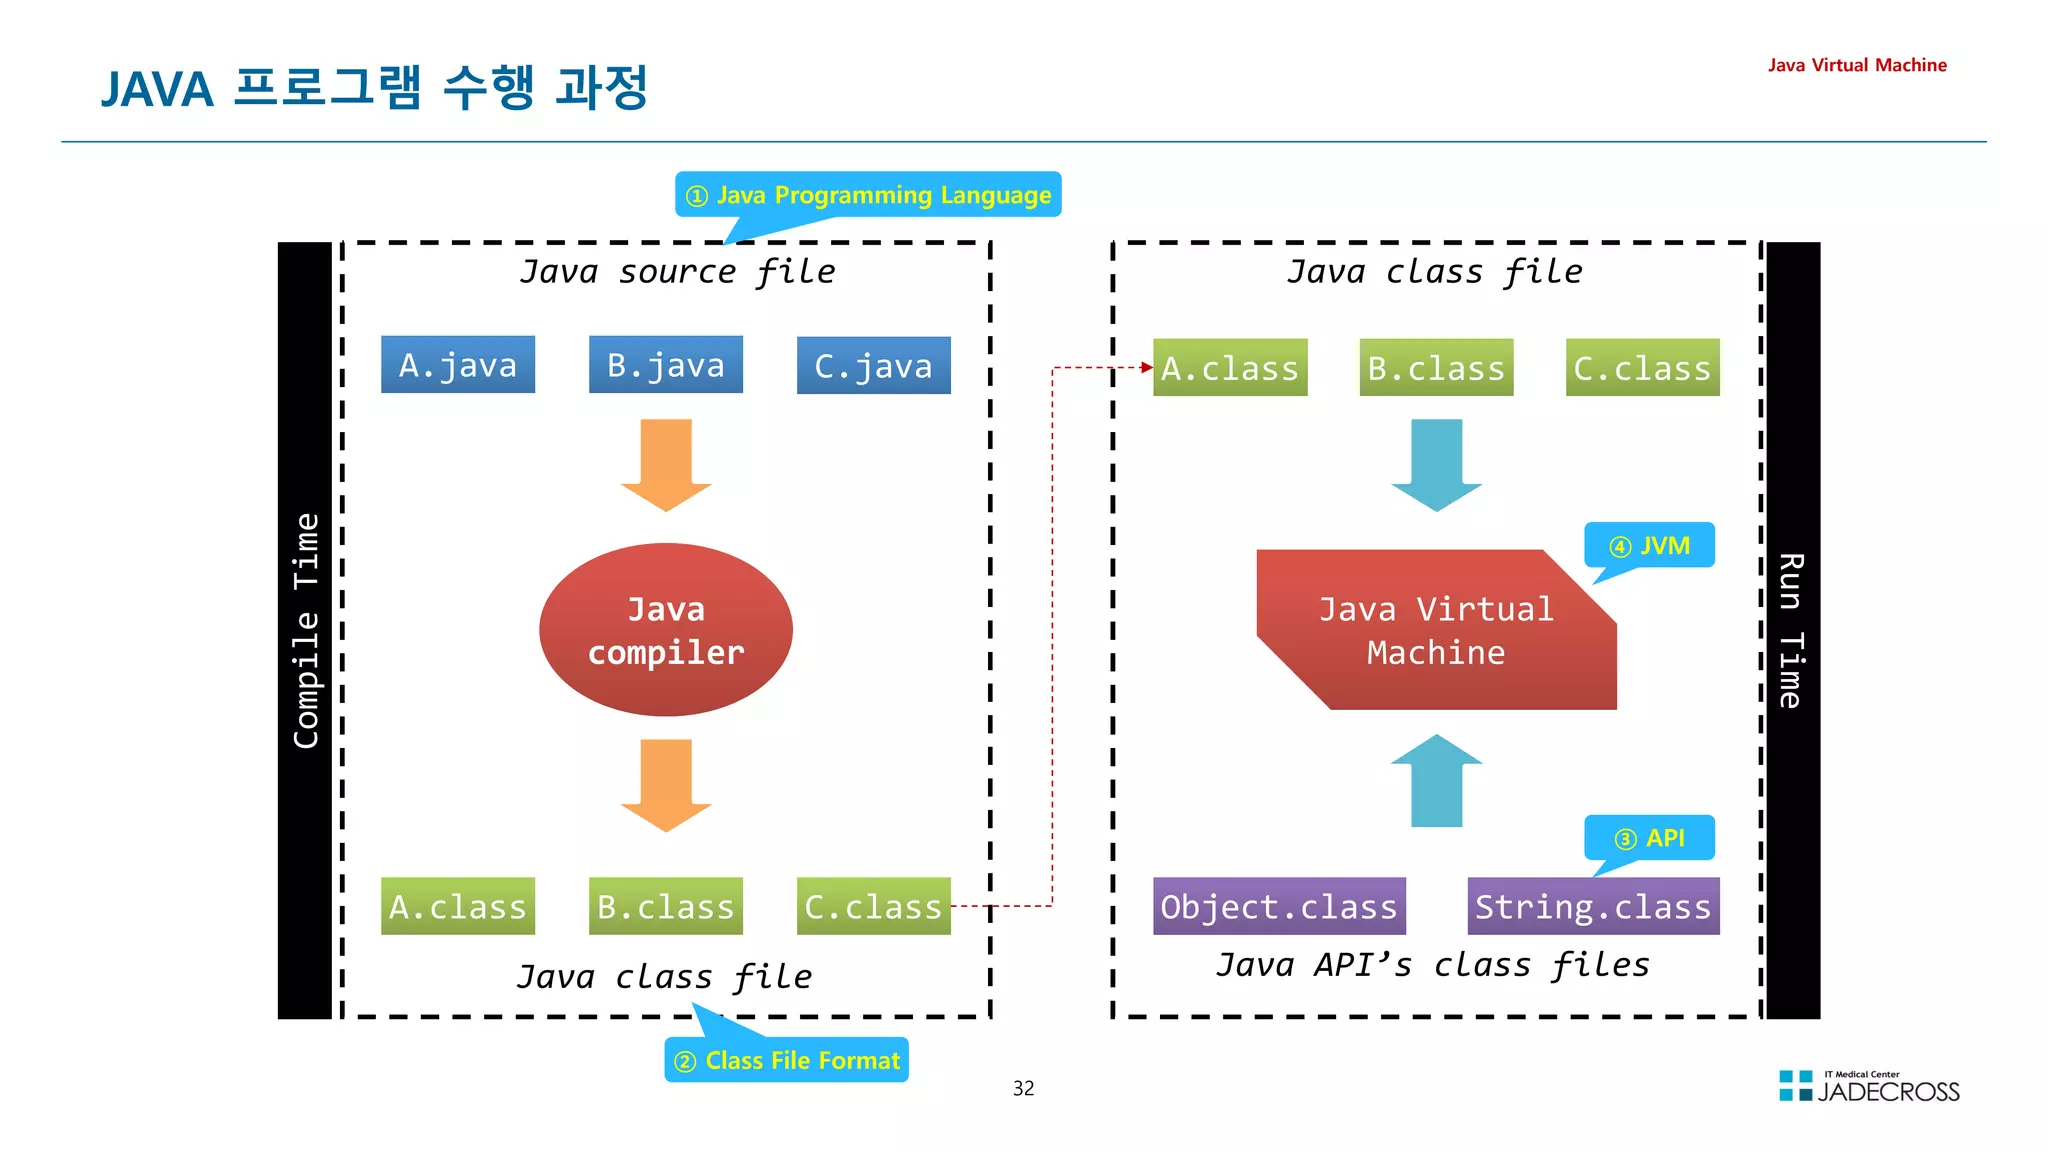
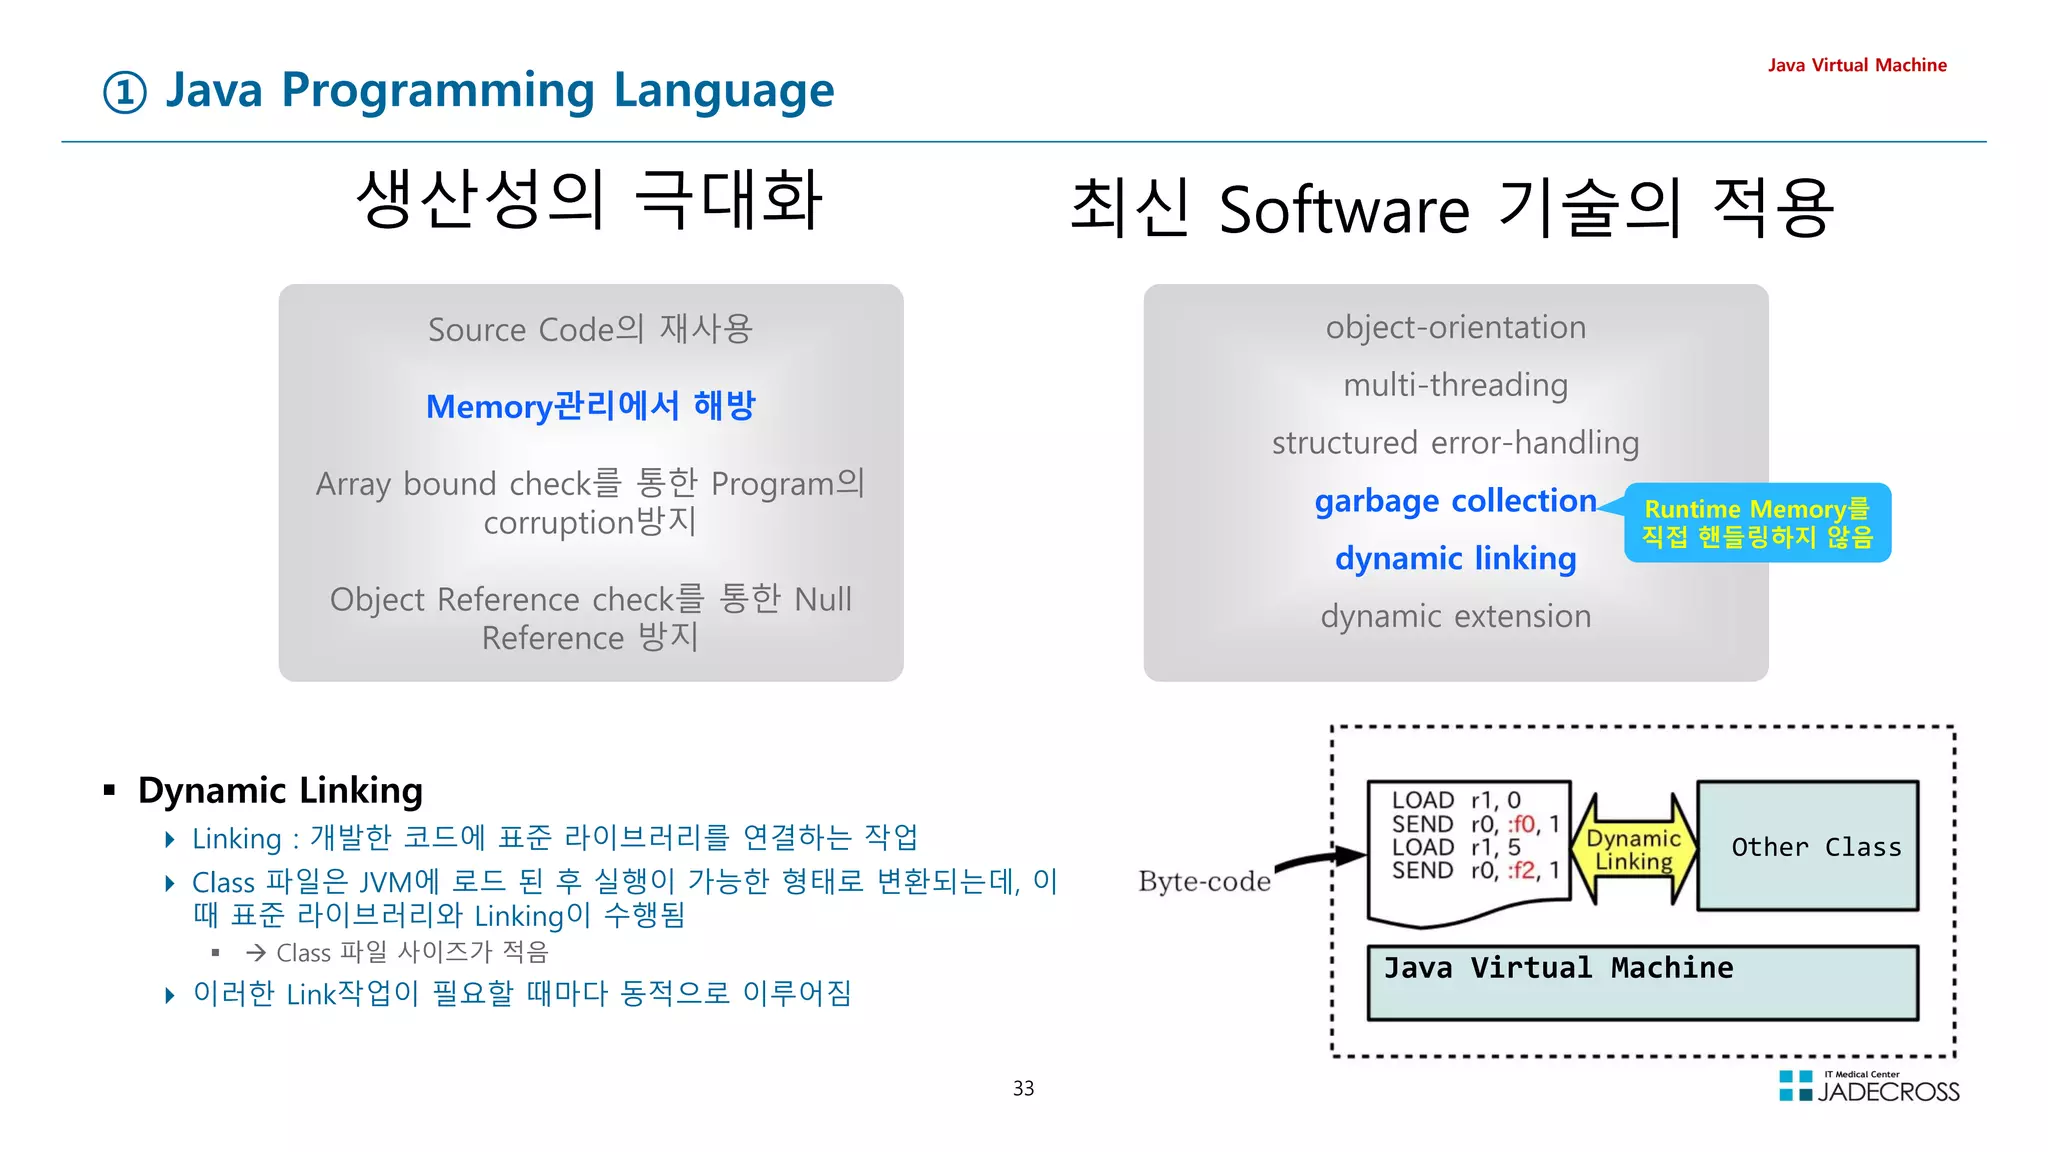
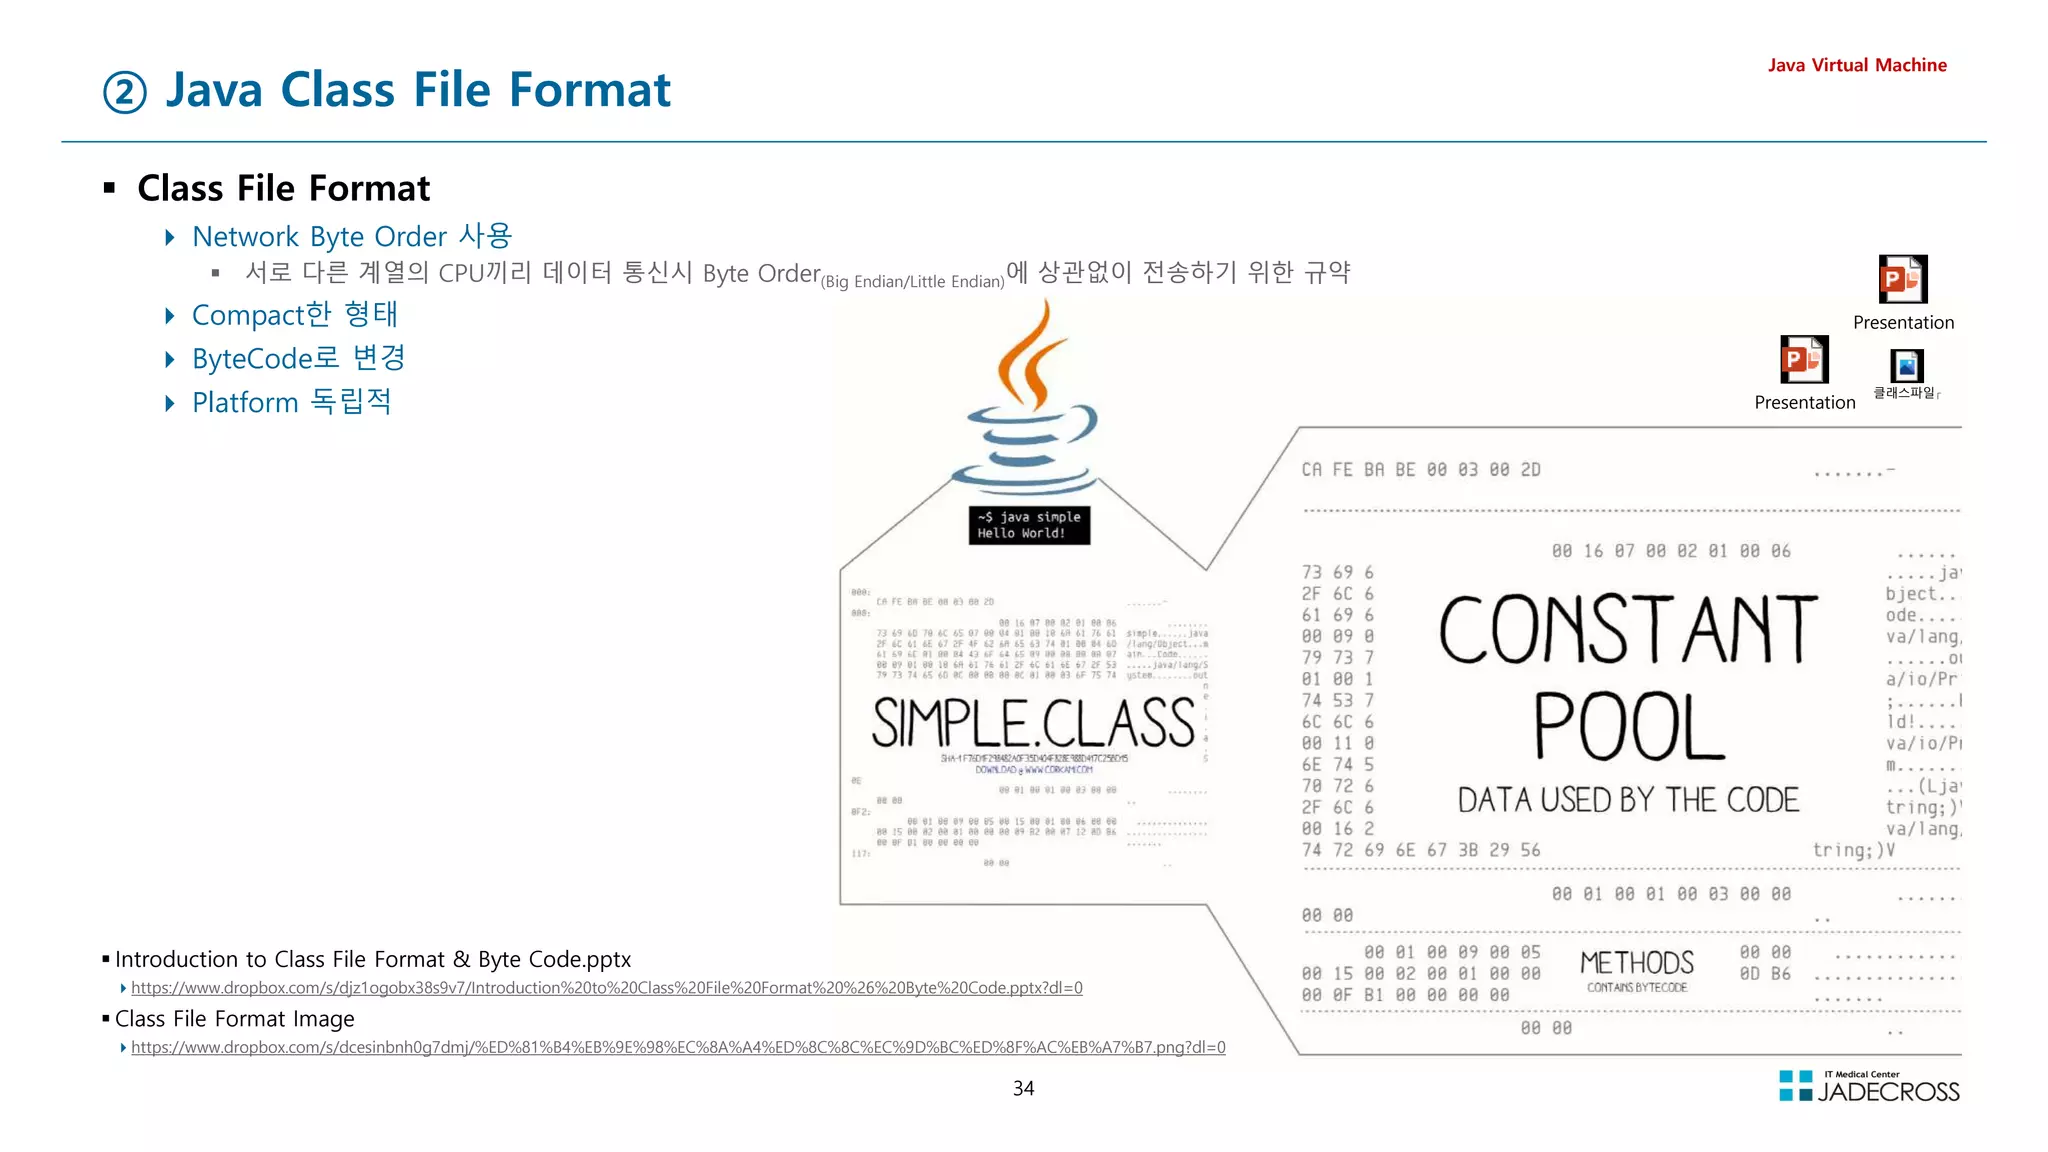
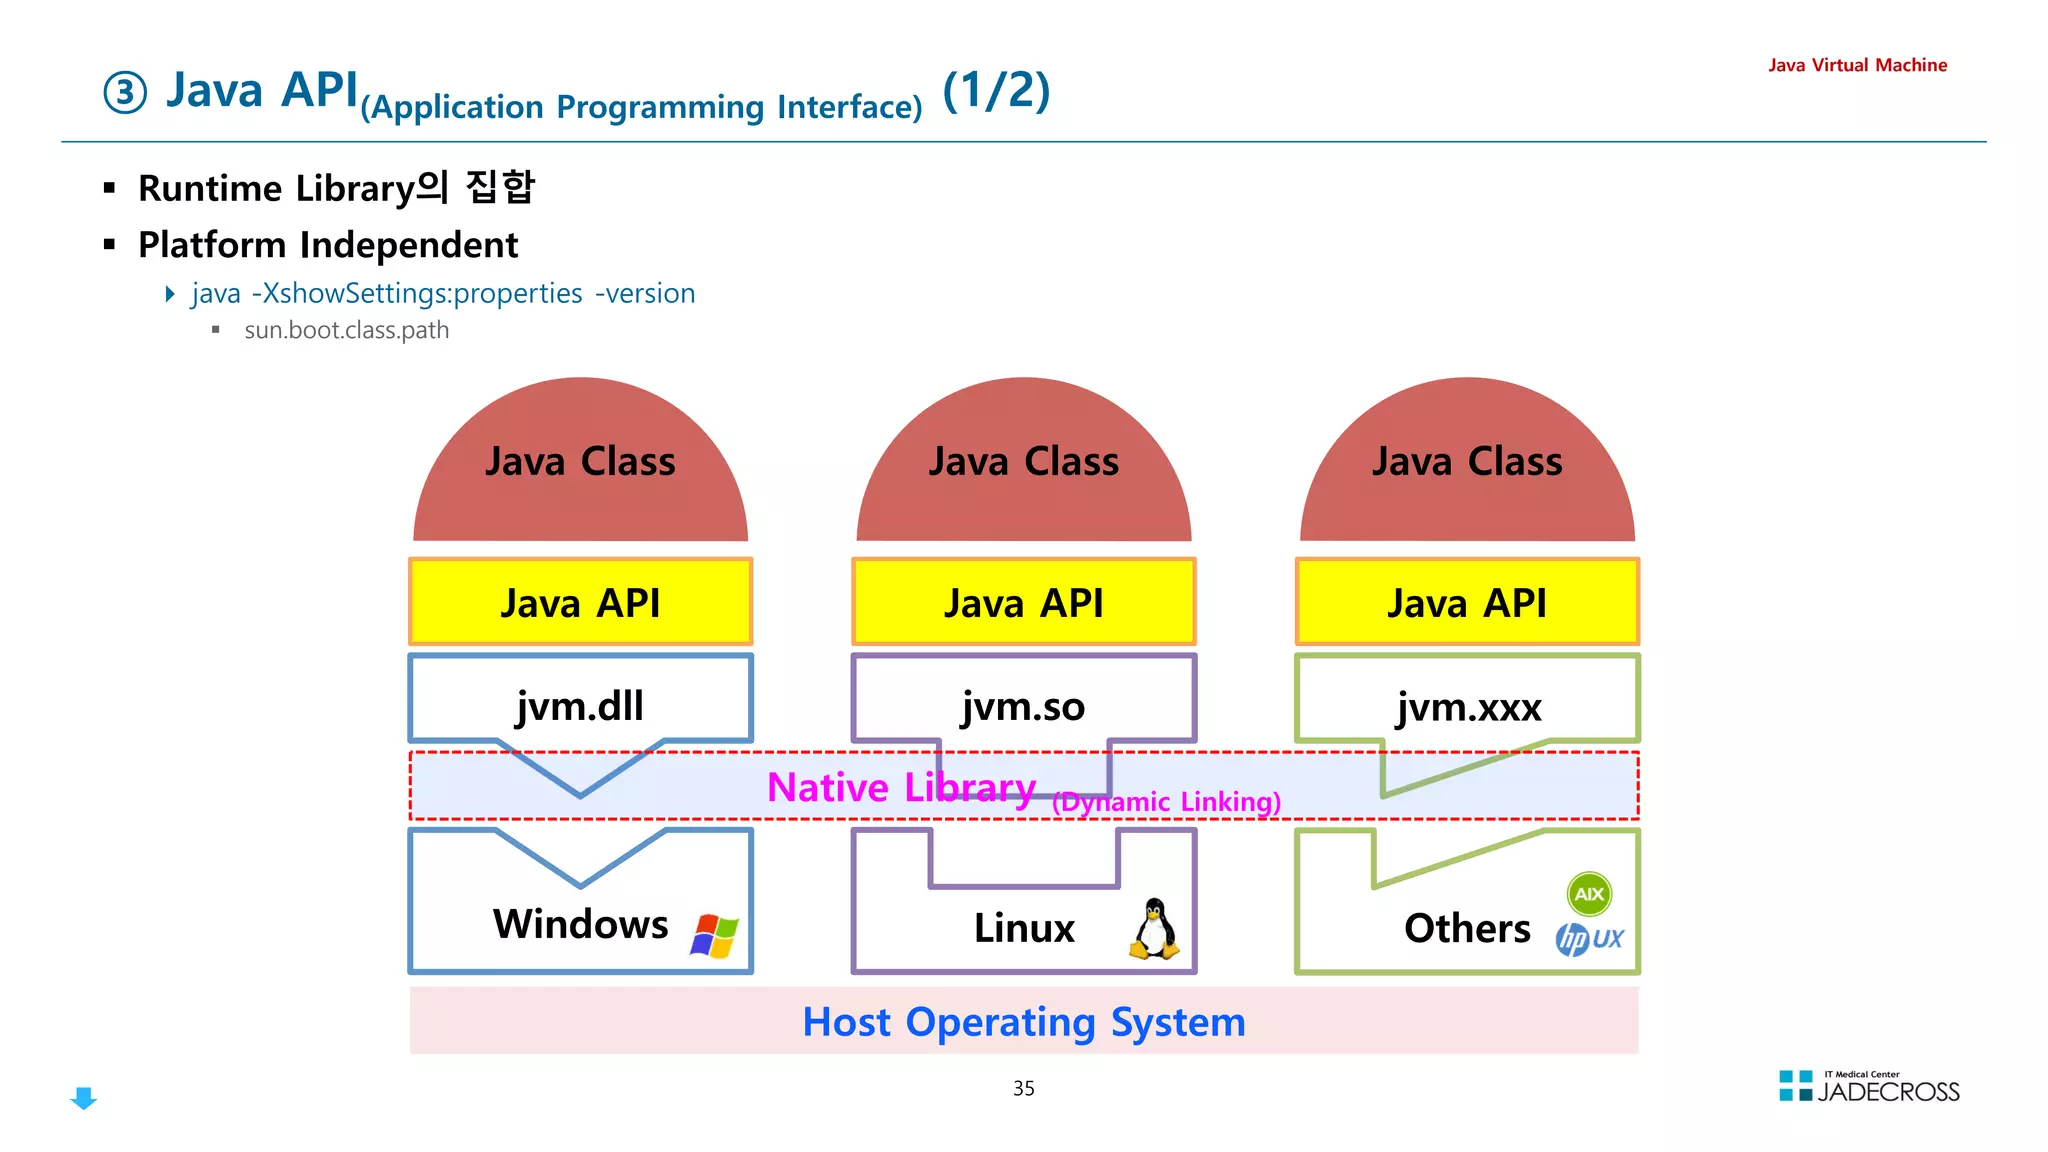
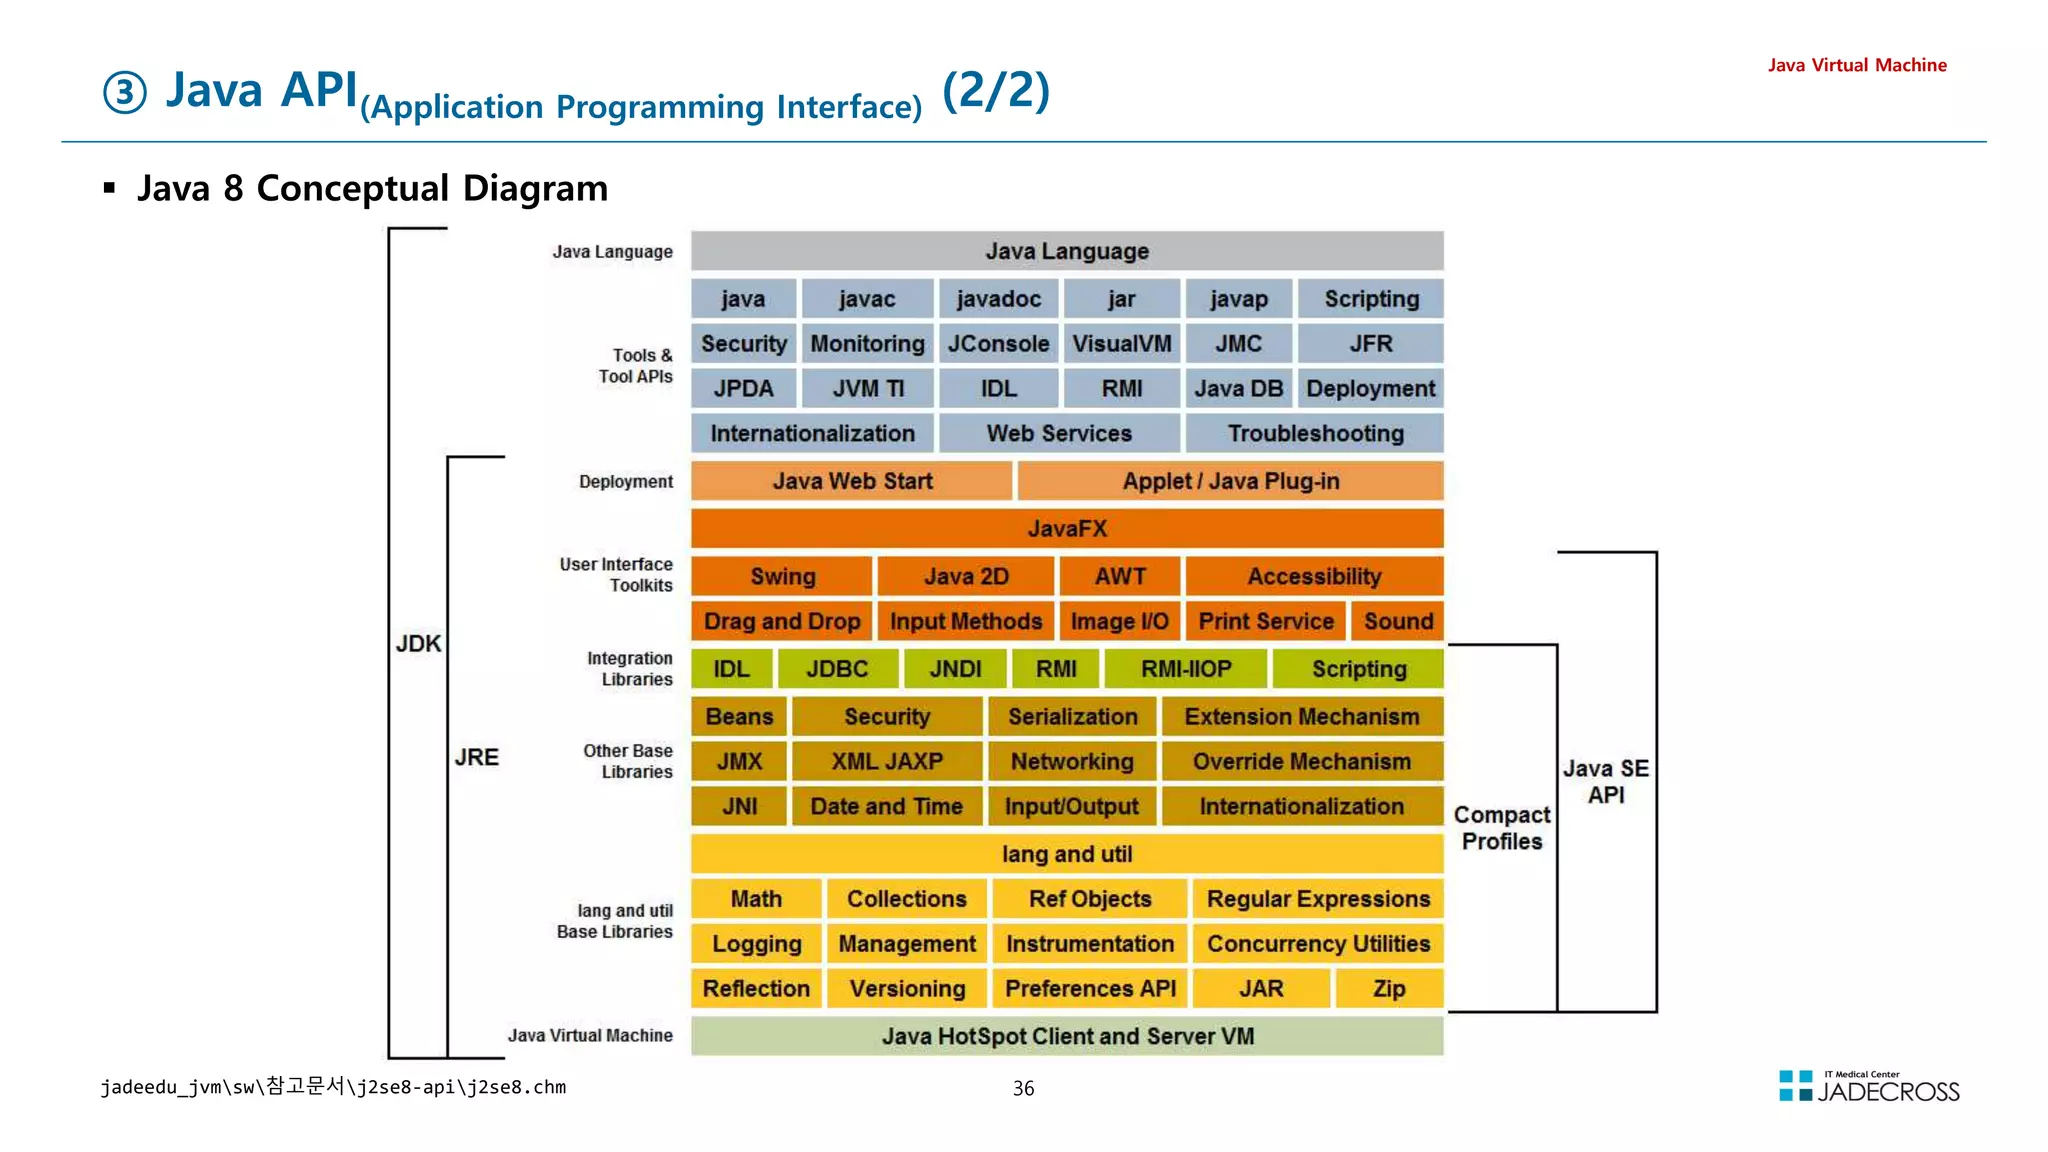
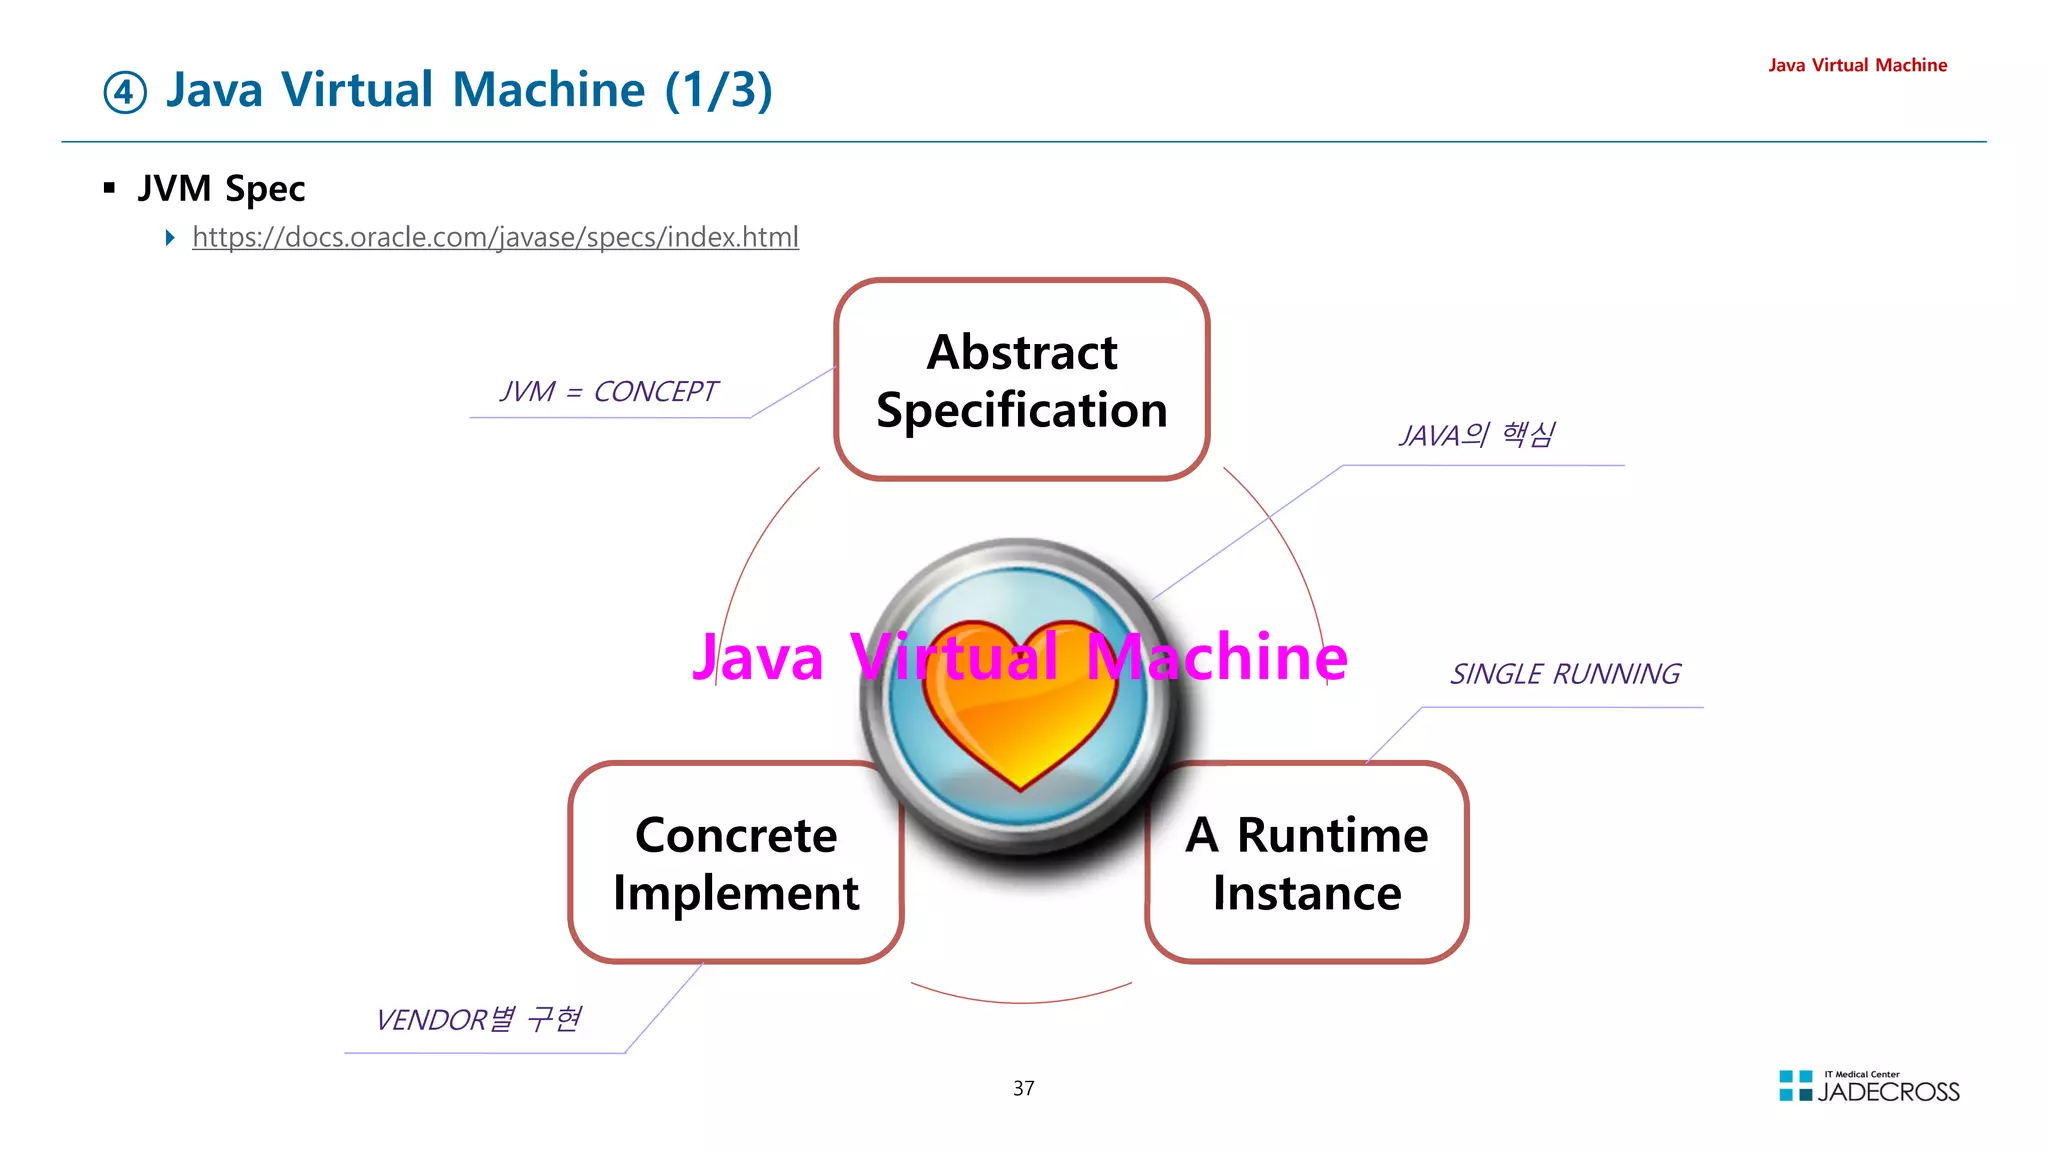
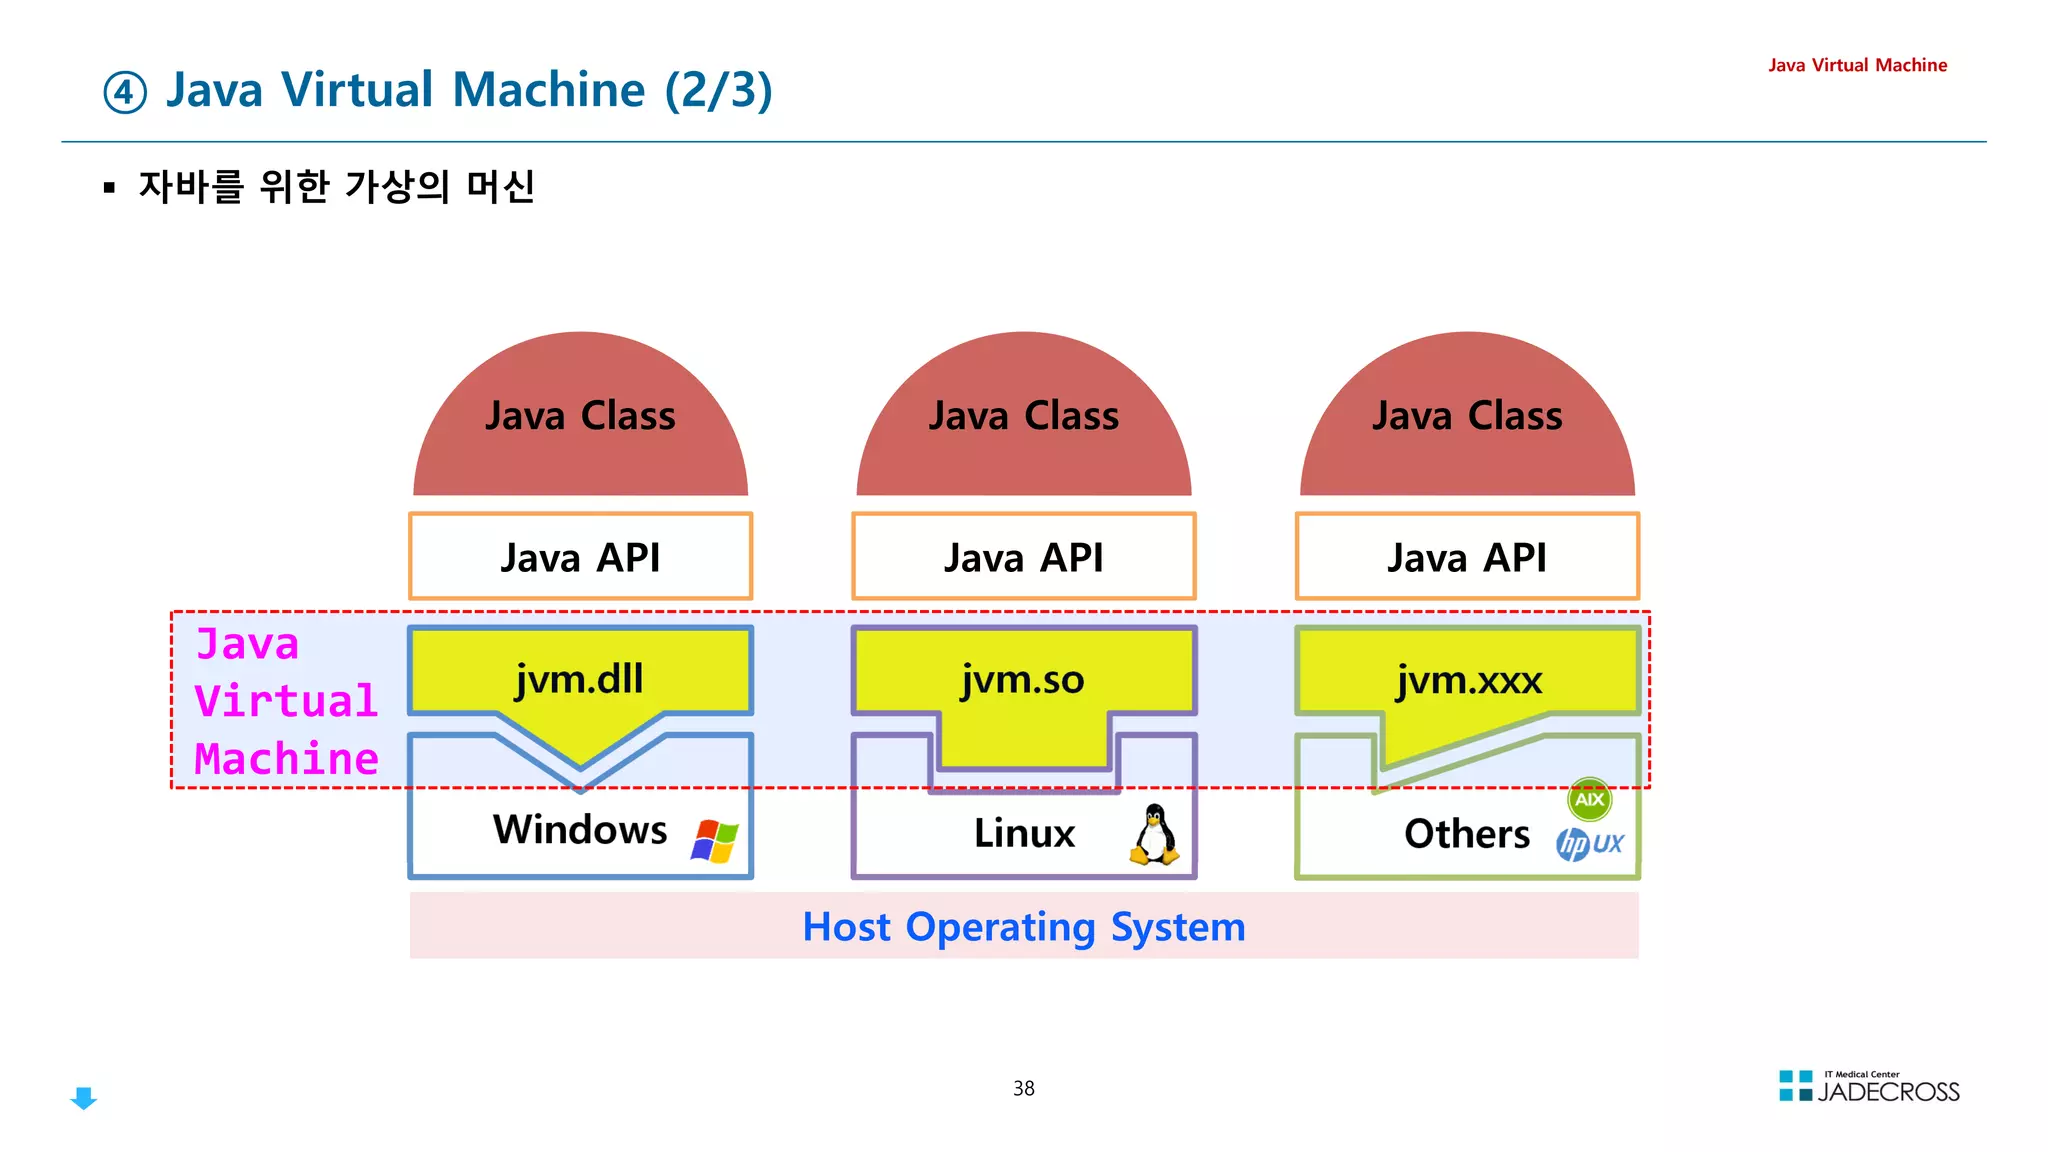
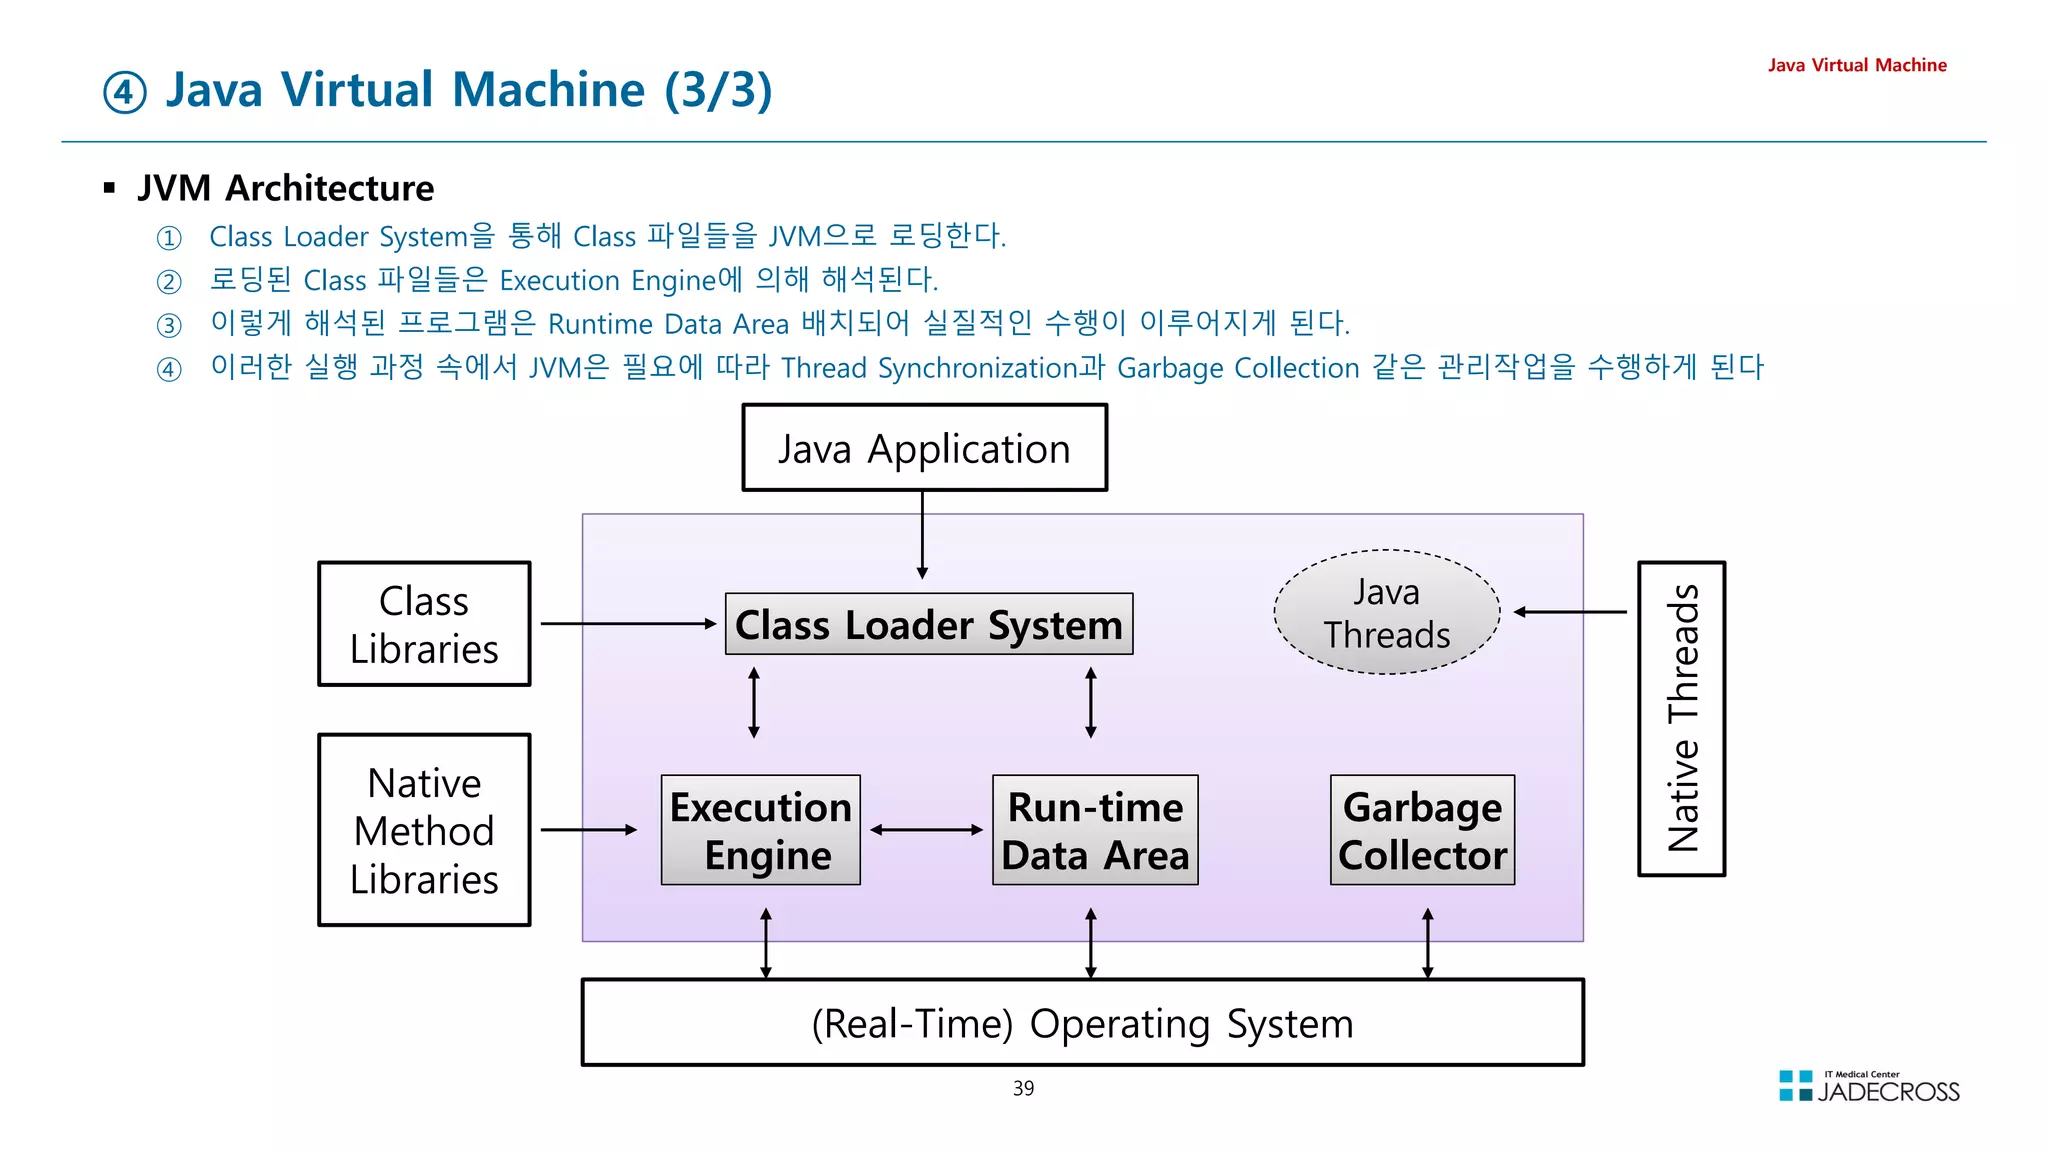
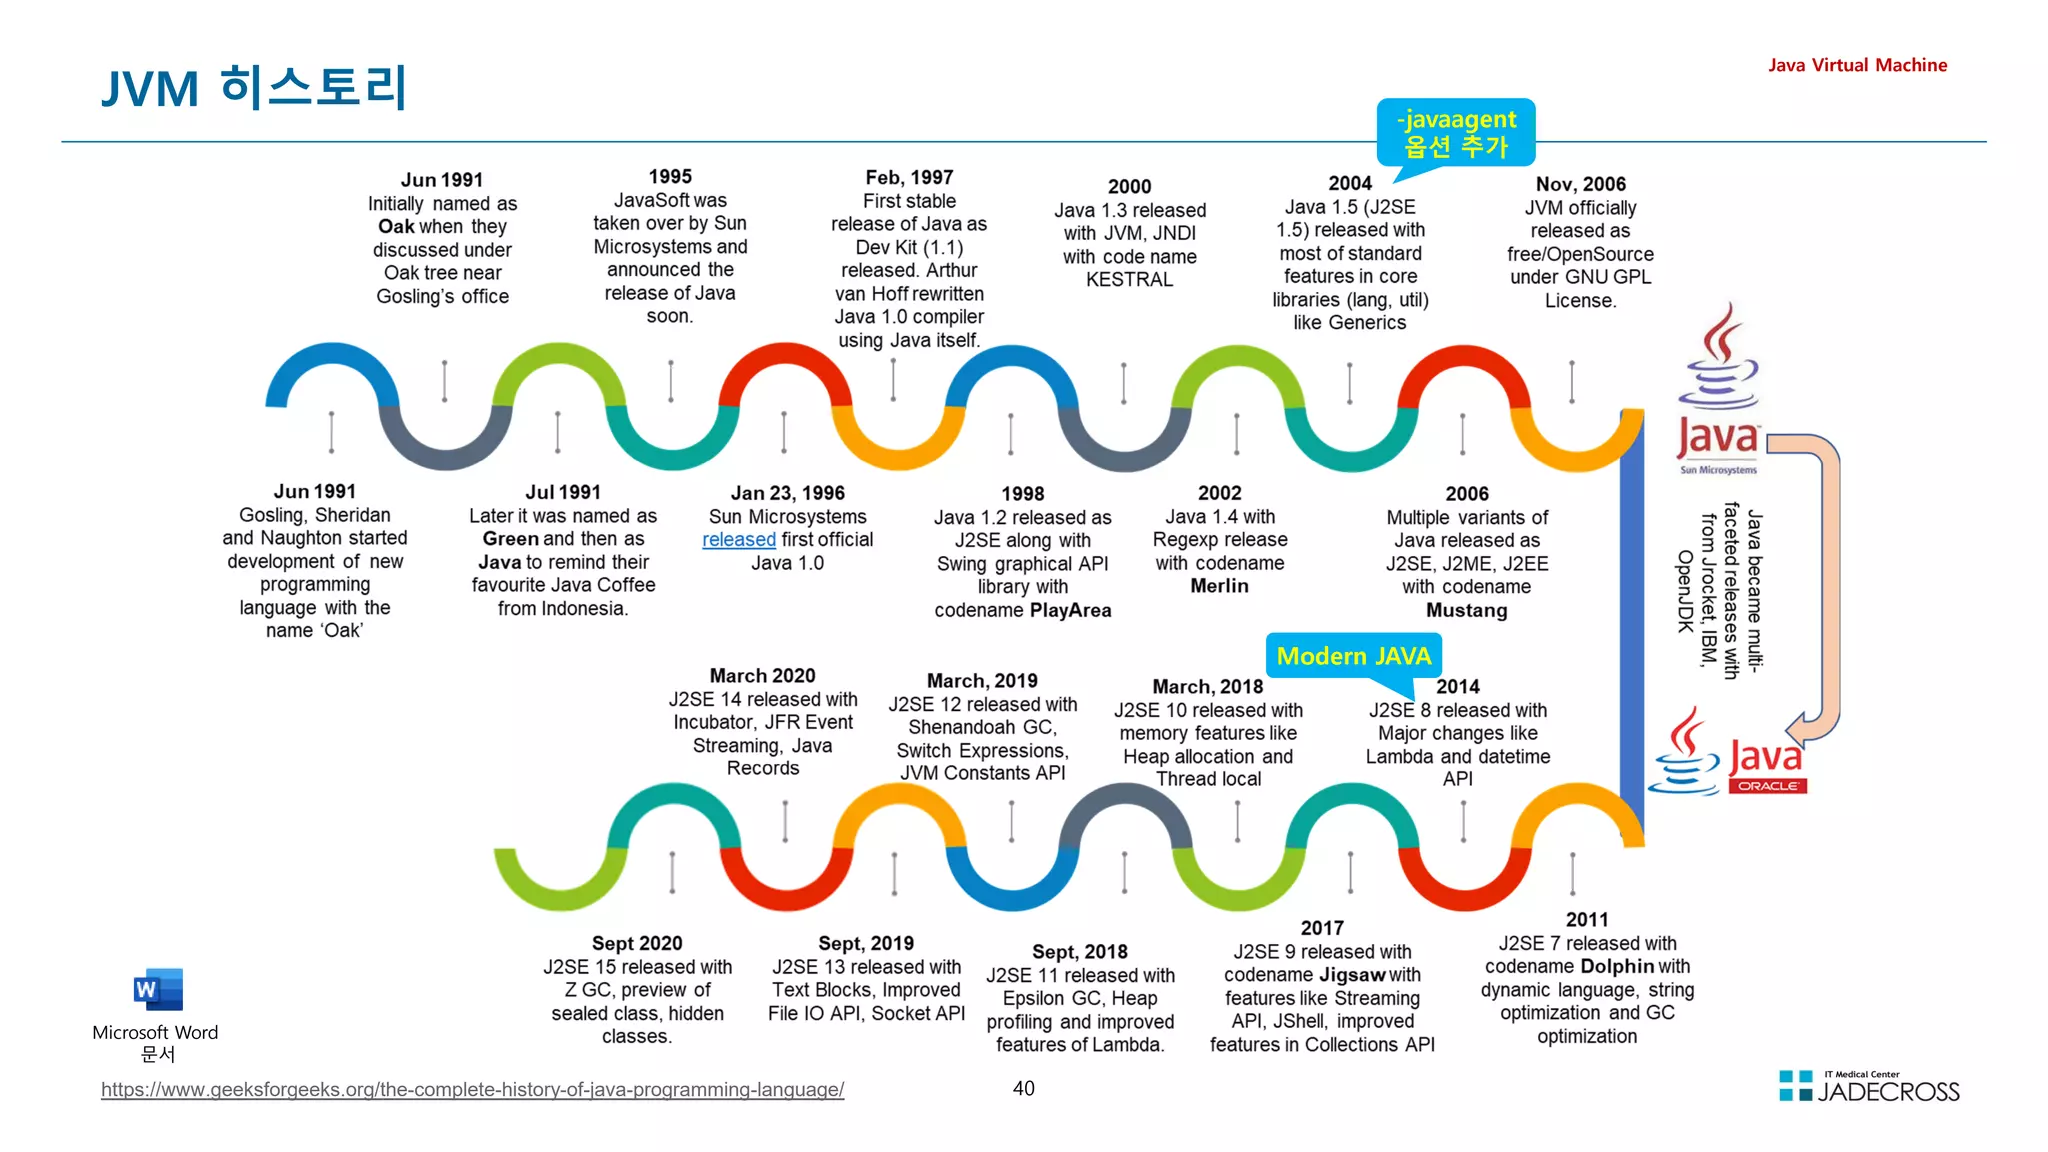
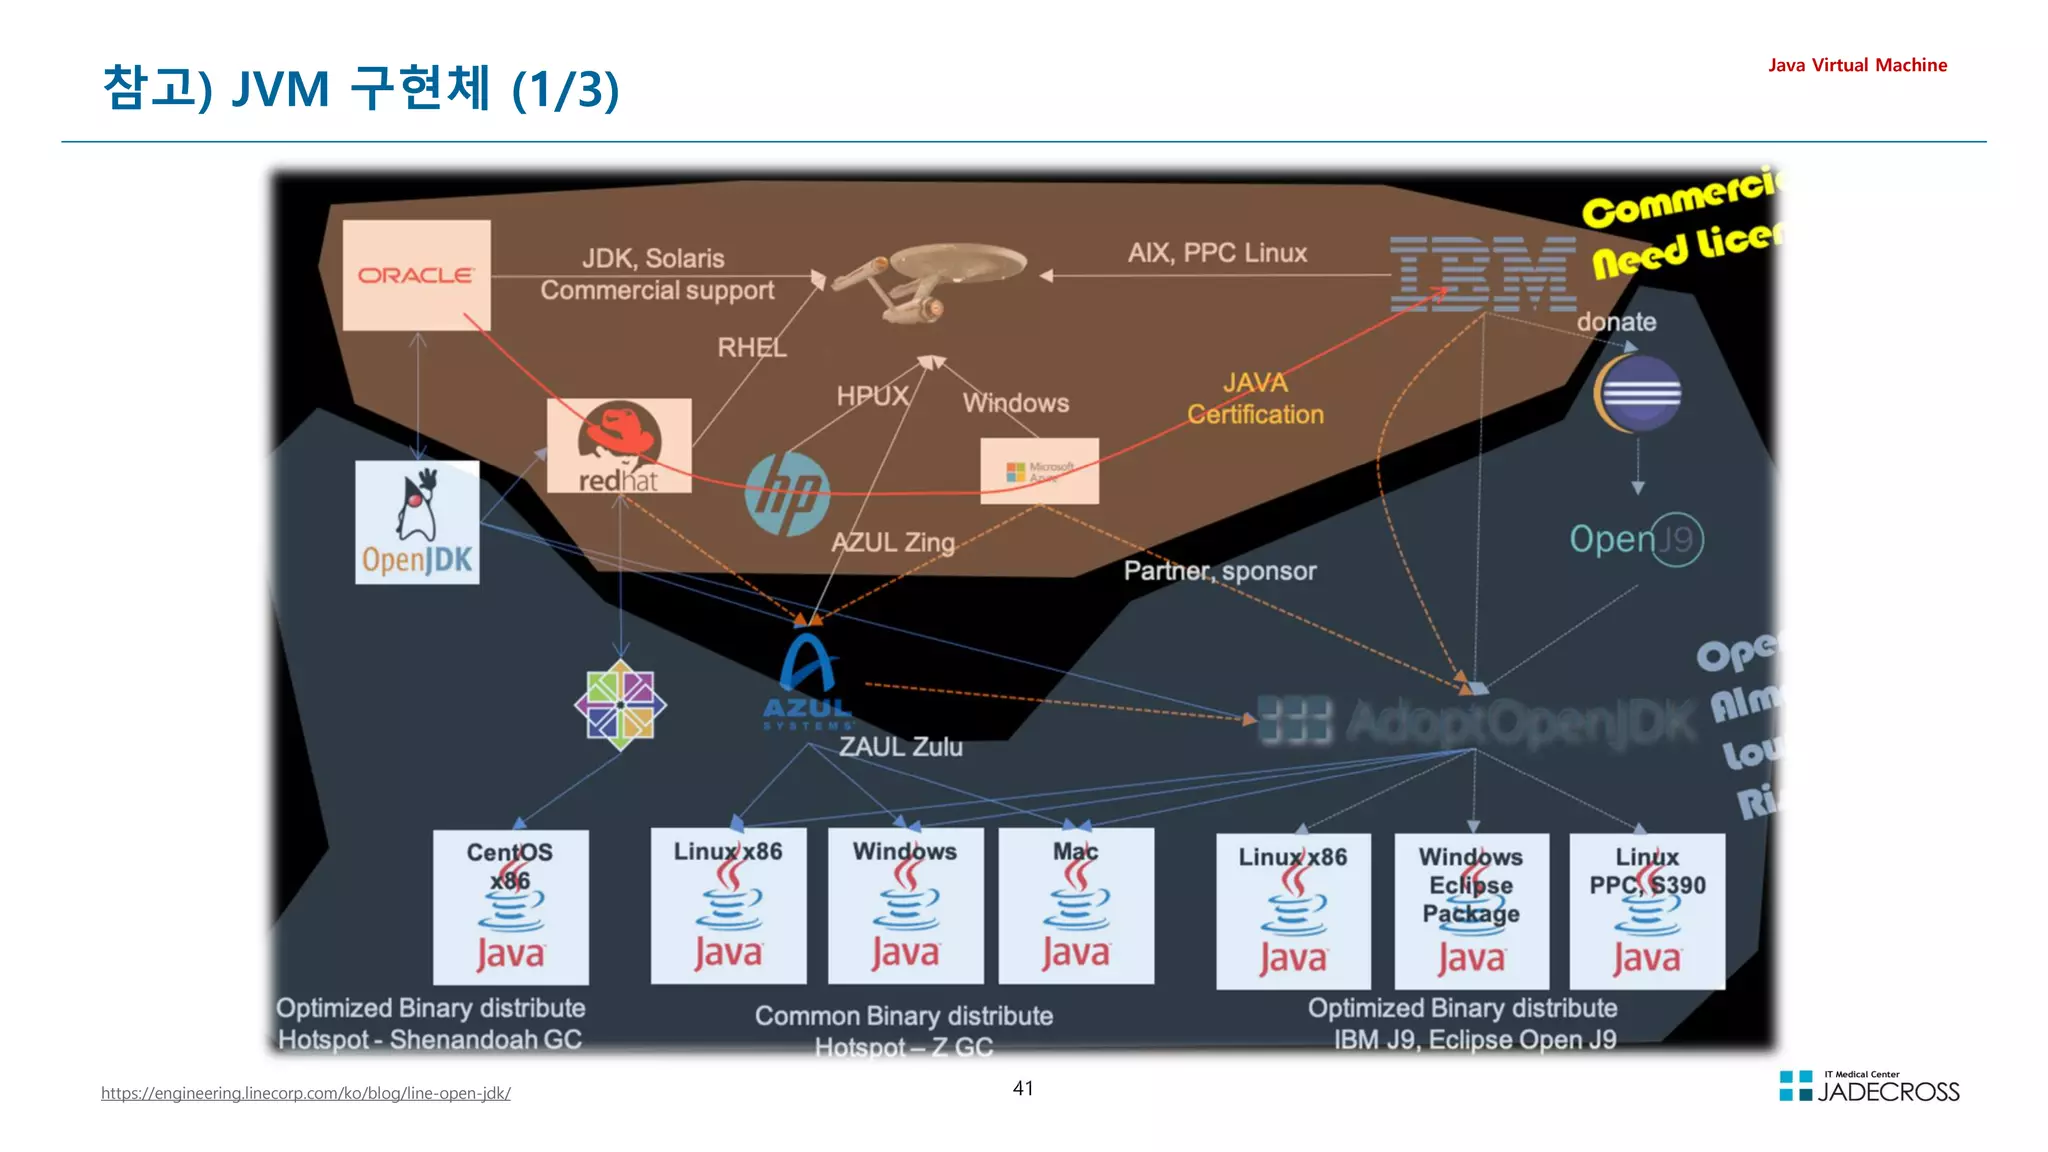
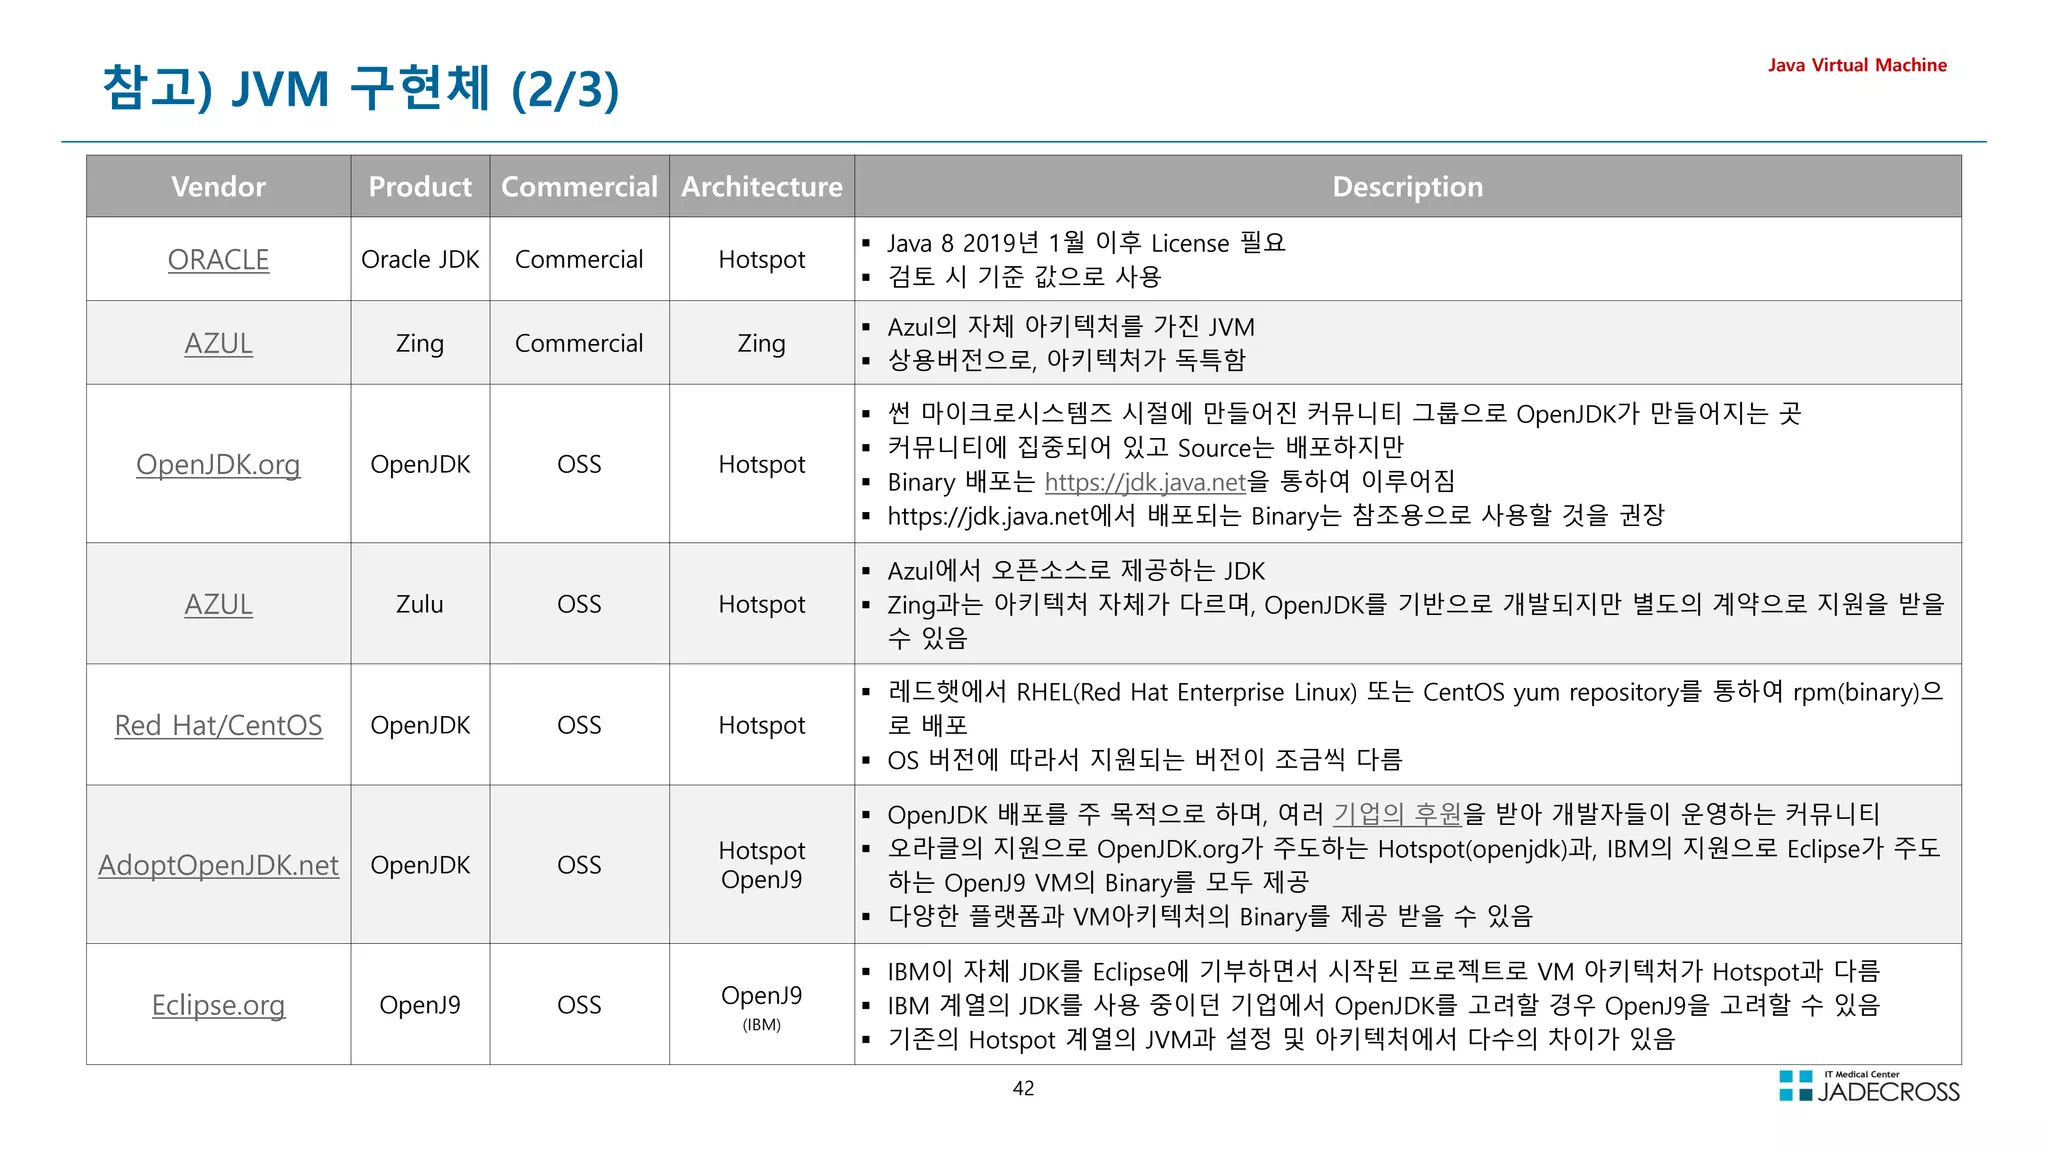
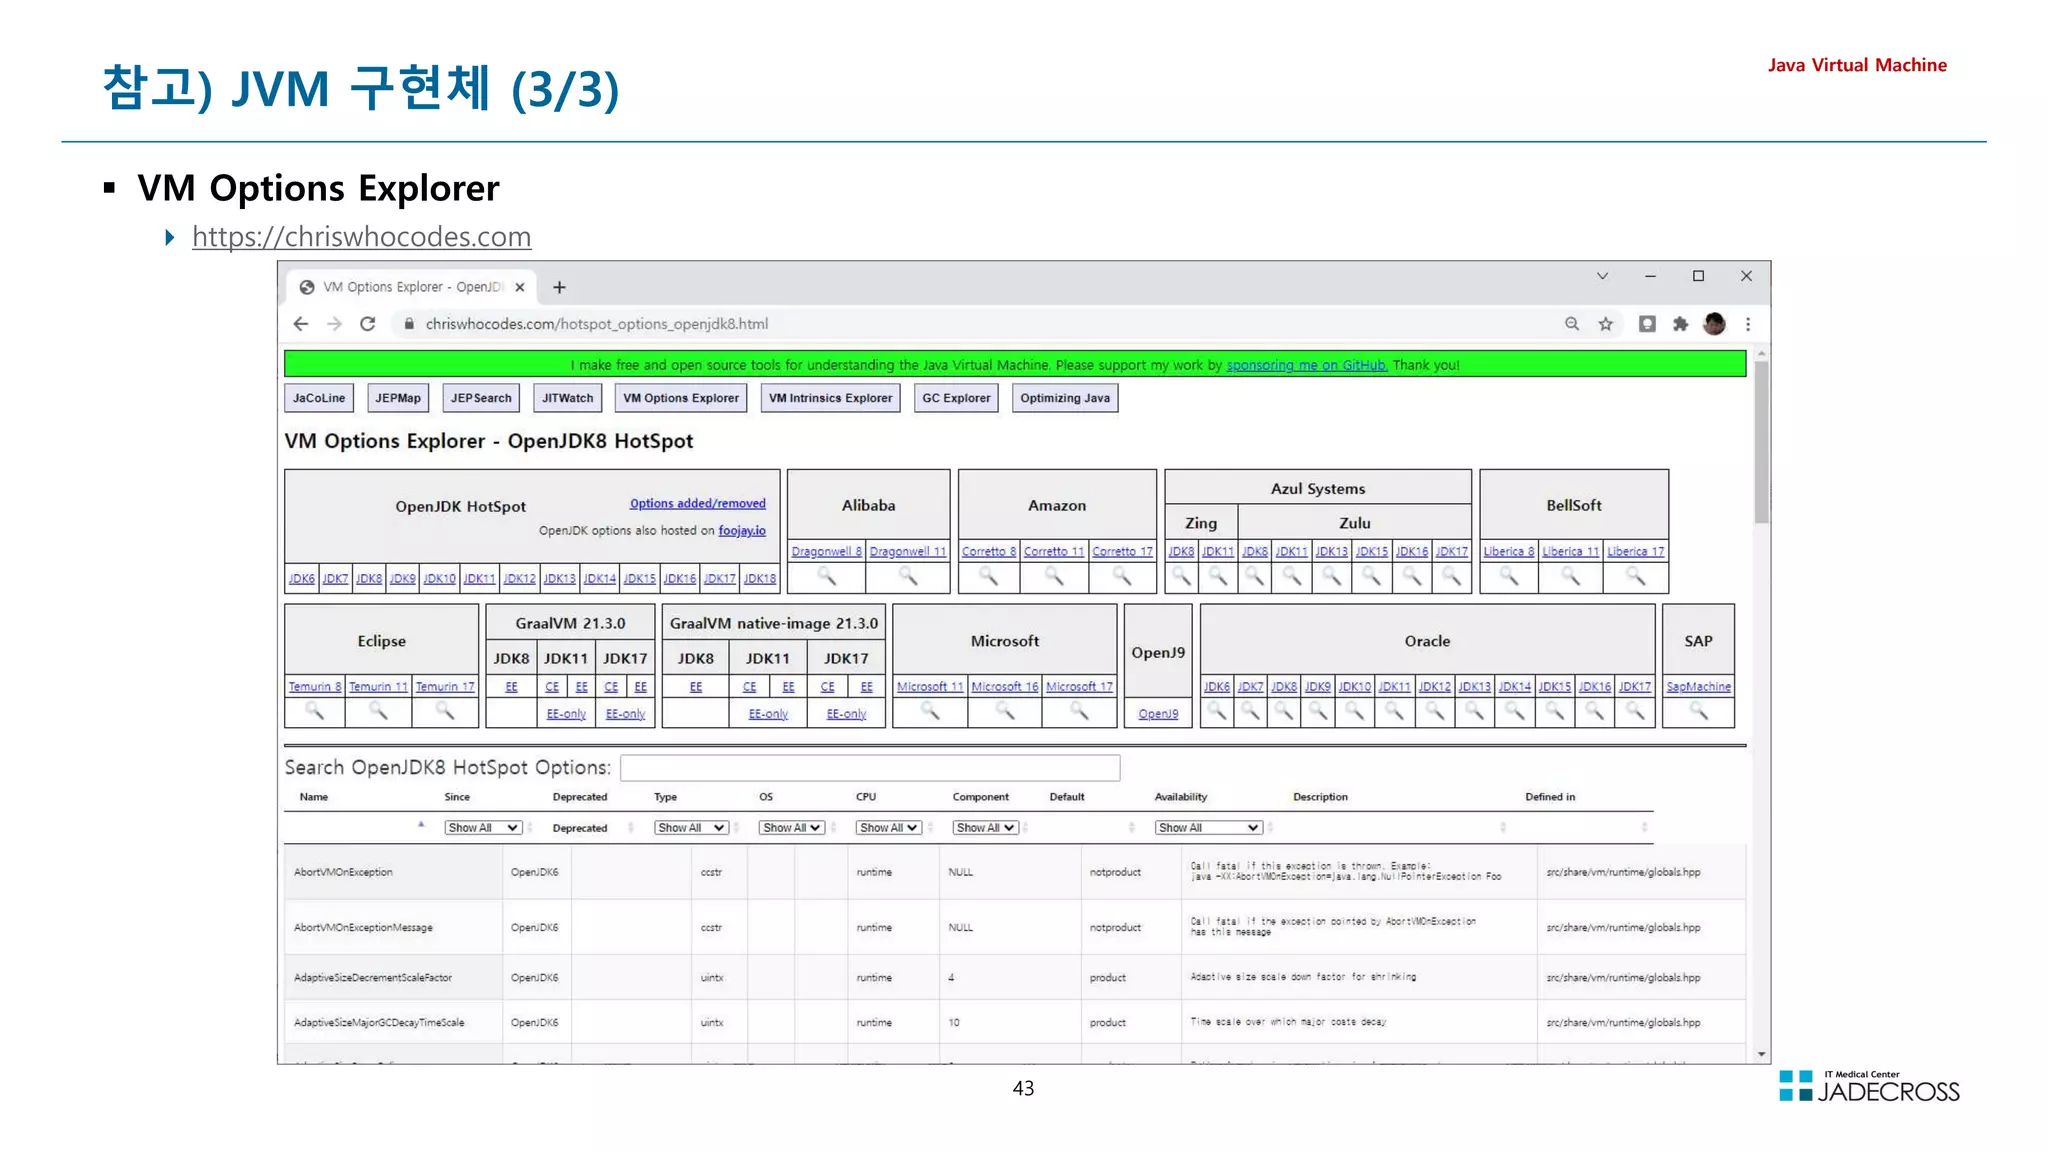
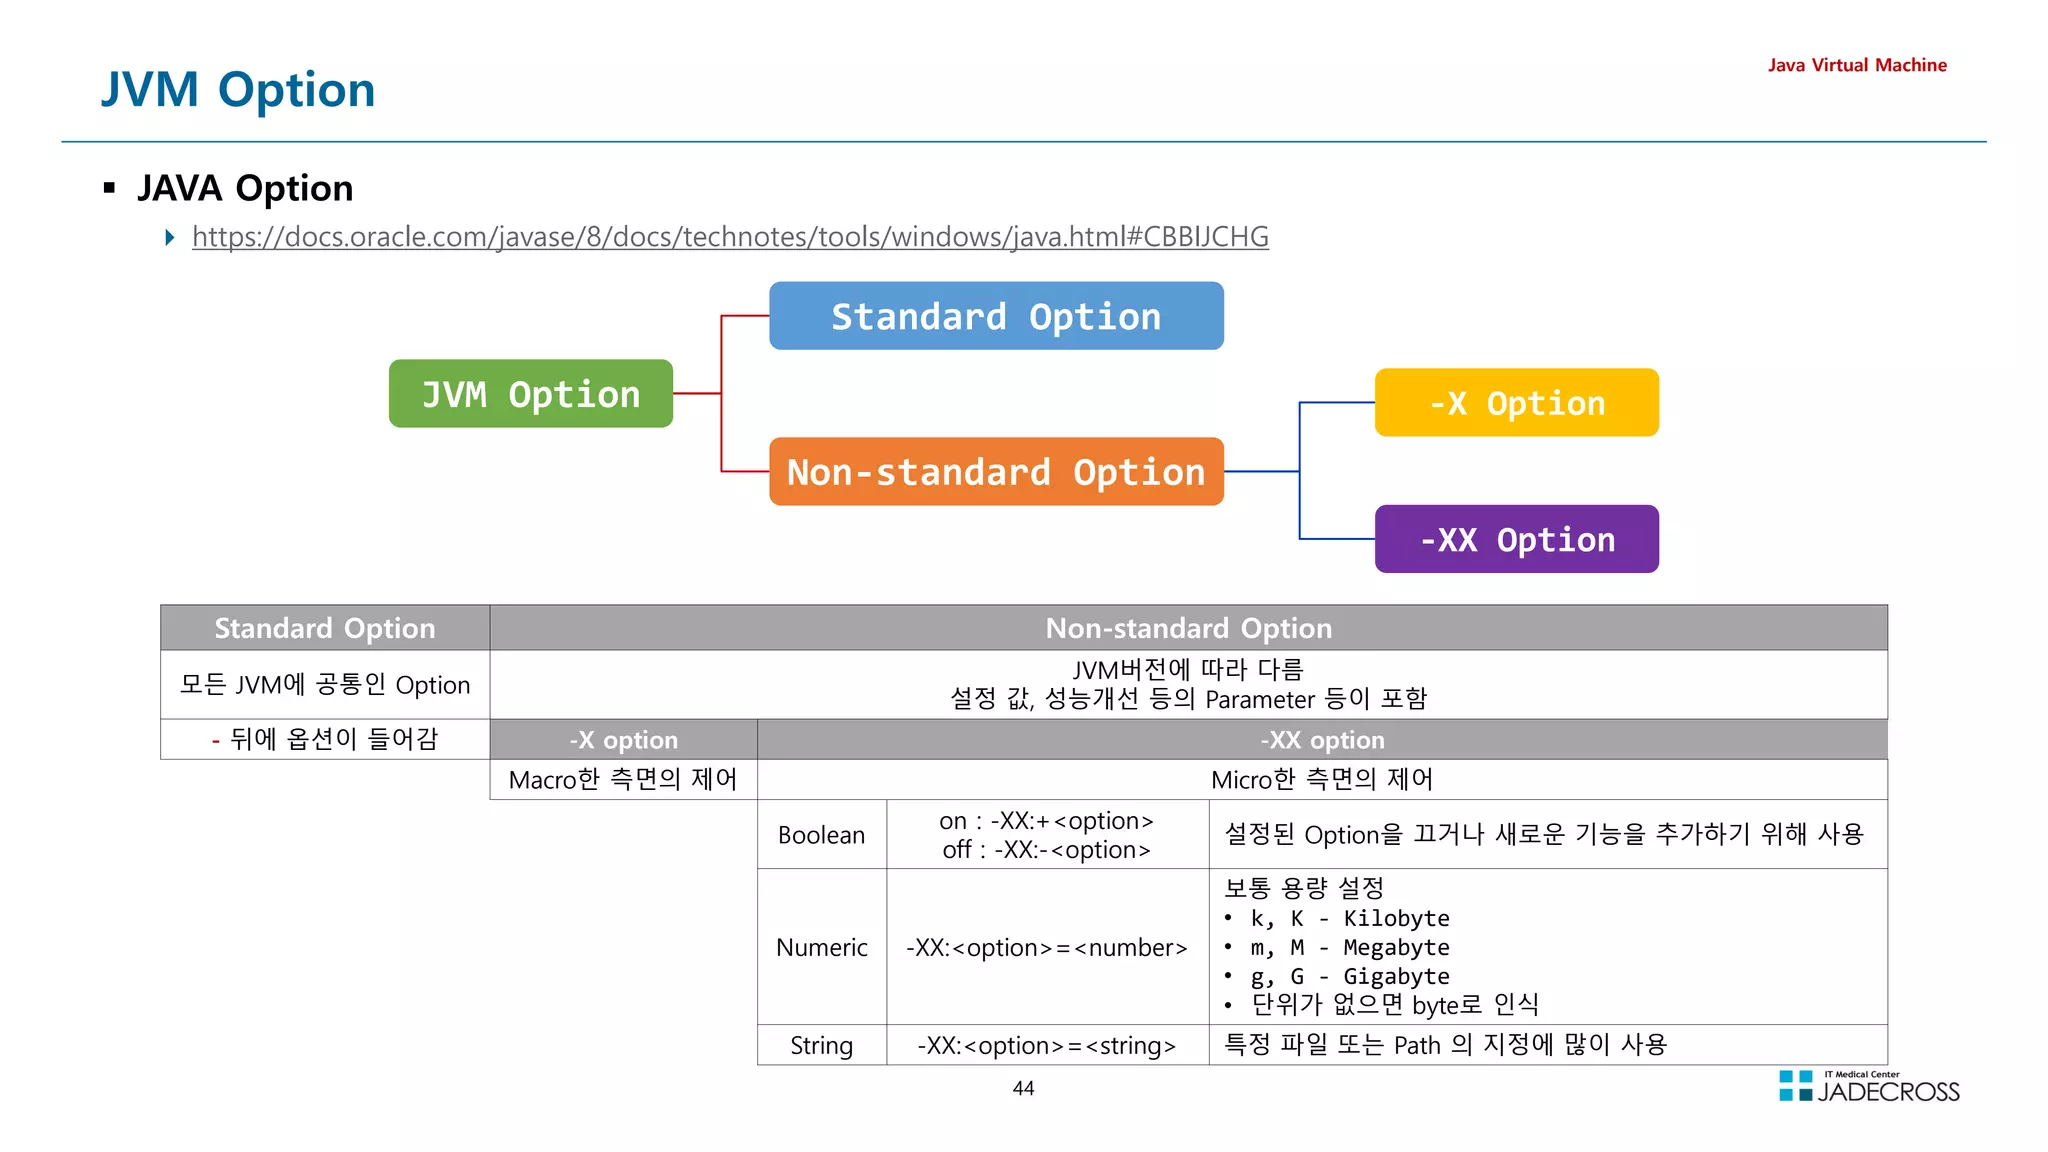
![45
LAB) JVM Standard 옵션 확인
https://docs.oracle.com/javase/8/docs/technotes/tools/unix/java.html
Java Virtual Machine
[root@jvmedu ~]# java -help
Usage: java [-options] class [args...]
(to execute a class)
or java [-options] -jar jarfile [args...]
(to execute a jar file)
where options include:
-d32 use a 32-bit data model if available
-d64 use a 64-bit data model if available
-server to select the server VM
The default VM is server,
because you are running on a server-class machine.
-cp class search path of directories and zip/jar files
-classpath class search path of directories and zip/jar files
A : separated list of directories, JAR archives,
and ZIP archives to search for class files.
-Dname=value
set a system property
-verbose:[class|gc|jni]
enable verbose output
-version print product version and exit
-version:value
Warning: this feature is deprecated and will be removed
in a future release.
require the specified version to run
-showversion print product version and continue
-jre-restrict-search | -no-jre-restrict-search
Warning: this feature is deprecated and will be removed
in a future release.
include/exclude user private JREs in the version search
-? -help print this help message
-X print help on non-standard options
-ea[:packagename...|:classname]
-enableassertions[:packagename...|:classname]
enable assertions with specified granularity
-da[:packagename...|:classname]
-disableassertions[:packagename...|:classname]
disable assertions with specified granularity
-esa | -enablesystemassertions
enable system assertions
-dsa | -disablesystemassertions
disable system assertions
-agentlib:libname[=options]
load native agent library libname, e.g. -agentlib:hprof
see also, -agentlib:jdwp=help and -agentlib:hprof=help
-agentpath:pathname[=options]
load native agent library by full pathname
-javaagent:jarpath[=options]
load Java programming language agent
, see java.lang.instrument
-splash:imagepath
show splash screen with specified image
See http://www.oracle.com/technetwork/java/javase/documentation/index.html
for more details.](https://image.slidesharecdn.com/jvm-230511085906-be6f1201/75/JVM_-pdf-45-2048.jpg)
![46
LAB) JVM Non-Standard -X 옵션 확인
Java Virtual Machine
[root@jvmedu ~]# java -X
-Xmixed mixed mode execution (default)
-Xint interpreted mode execution only
-Xbootclasspath:directories and zip/jar files separated by :
set search path for bootstrap classes and resources
-Xbootclasspath/a:directories and zip/jar files separated by :
append to end of bootstrap class path
-Xbootclasspath/p:directories and zip/jar files separated by :
prepend in front of bootstrap class path
-Xdiag show additional diagnostic messages
-Xnoclassgc disable class garbage collection
-Xincgc enable incremental garbage collection
-Xloggc:file log GC status to a file with time stamps
-Xbatch disable background compilation
-Xmssize set initial Java heap size
-Xmxsize set maximum Java heap size
-Xsssize set java thread stack size
-Xprof output cpu profiling data
-Xfuture enable strictest checks, anticipating future default
-Xrs reduce use of OS signals by Java/VM (see documentation)
-Xcheck:jni perform additional checks for JNI functions
-Xshare:off do not attempt to use shared class data
-Xshare:auto use shared class data if possible (default)
-Xshare:on require using shared class data, otherwise fail.
-XshowSettings show all settings and continue
-XshowSettings:all show all settings and continue
-XshowSettings:vm show all vm related settings and continue
-XshowSettings:system (Linux Only) show host system or container configuration and continue
-XshowSettings:properties show all property settings and continue
-XshowSettings:locale show all locale related settings and continue
The -X options are non-standard and subject to change without notice.](https://image.slidesharecdn.com/jvm-230511085906-be6f1201/75/JVM_-pdf-46-2048.jpg)
![47
LAB) JVM 디폴트 설정 값 확인 (1/2)
Java Virtual Machine
vm 디폴트 설정 값 확인
[root@jvmedu ~]# java -XshowSettings:vm -version
VM settings:
Max. Heap Size (Estimated): 878.50M
Ergonomics Machine Class: server
Using VM: OpenJDK 64-Bit Server VM
Locale 디폴트 설정 값 확인
[root@jvmedu ~]# java -XshowSettings:locale -version
Locale settings:
default locale = English
default display locale = English (United States)
default format locale = English (United States)
available locales = , ar, ar_AE, ar_BH, ar_DZ, ar_EG, ar_IQ, ar_JO,
ar_KW, ar_LB, ar_LY, ar_MA, ar_OM, ar_QA, ar_SA, ar_SD,
ar_SY, ar_TN, ar_YE, be, be_BY, bg, bg_BG, ca,
ca_ES, cs, cs_CZ, da, da_DK, de, de_AT, de_CH,
de_DE, de_GR, de_LU, el, el_CY, el_GR, en, en_AU,
en_CA, en_GB, en_IE, en_IN, en_MT, en_NZ, en_PH, en_SG,
en_US, en_ZA, es, es_AR, es_BO, es_CL, es_CO, es_CR,
es_CU, es_DO, es_EC, es_ES, es_GT, es_HN, es_MX, es_NI,
es_PA, es_PE, es_PR, es_PY, es_SV, es_US, es_UY, es_VE,
et, et_EE, fi, fi_FI, fr, fr_BE, fr_CA, fr_CH,
fr_FR, fr_LU, ga, ga_IE, hi, hi_IN, hr, hr_HR,
hu, hu_HU, in, in_ID, is, is_IS, it, it_CH,
it_IT, iw, iw_IL, ja, ja_JP, ja_JP_JP_#u-ca-japanese, ko, ko_KR,
lt, lt_LT, lv, lv_LV, mk, mk_MK, ms, ms_MY,
mt, mt_MT, nl, nl_BE, nl_NL, no, no_NO, no_NO_NY,
pl, pl_PL, pt, pt_BR, pt_PT, ro, ro_RO, ru,
ru_RU, sk, sk_SK, sl, sl_SI, sq, sq_AL, sr,
sr_BA, sr_BA_#Latn, sr_CS, sr_ME, sr_ME_#Latn, sr_RS, sr_RS_#Latn, sr__#Latn,
sv, sv_SE, th, th_TH, th_TH_TH_#u-nu-thai, tr, tr_TR, uk,
uk_UA, vi, vi_VN, zh, zh_CN, zh_HK, zh_SG, zh_TW
Automatic Selection
Java 5 부터 자동으로 Garbage Collector, Heap Size등을 자동으
로 선택
Hardware Resource와 OS정보가 기준
Sever Class와 Client Class의 구분
java -XX:+PrintCommandLineFlags -version
-XX:InitialHeapSize=64717248
-XX:MaxHeapSize=1035475968
-XX:+PrintCommandLineFlags
-XX:+UseCompressedClassPointers
-XX:+UseCompressedOops
-XX:+UseParallelGC
openjdk version 1.8.0_302
OpenJDK Runtime Environment (Temurin)(build 1.8.0_302-b08)
OpenJDK 64-Bit Server VM (Temurin)(build 25.302-b08, mixed
mode)](https://image.slidesharecdn.com/jvm-230511085906-be6f1201/75/JVM_-pdf-47-2048.jpg)
![48
LAB) JVM 디폴트 설정 값 확인 (2/2)
Java Virtual Machine
Property 디폴트 설정 값 확인
[root@jvmedu ~]# java -XshowSettings:properties -version
Property settings:
awt.toolkit = sun.awt.X11.XToolkit
file.encoding = UTF-8
file.encoding.pkg = sun.io
file.separator = /
java.awt.graphicsenv = sun.awt.X11GraphicsEnvironment
java.awt.printerjob = sun.print.PSPrinterJob
java.class.path = .
java.class.version = 52.0
java.endorsed.dirs = /opt/java/jdk8u302-b08/jre/lib/endorsed
java.ext.dirs = /opt/java/jdk8u302-b08/jre/lib/ext
/usr/java/packages/lib/ext
java.home = /opt/java/jdk8u302-b08/jre
java.io.tmpdir = /tmp
java.library.path =
/root/lab/cprogram/libTest1/libSrc
/usr/java/packages/lib/amd64
/usr/lib64
/lib64
/lib
/usr/lib
java.runtime.name = OpenJDK Runtime Environment
java.runtime.version = 1.8.0_302-b08
java.specification.name = Java Platform API Specification
java.specification.vendor = Oracle Corporation
java.specification.version = 1.8
java.vendor = Temurin
java.vendor.url = https://adoptium.net/
java.vendor.url.bug = https://github.com/adoptium/adoptium-
support/issues
java.version = 1.8.0_302
java.vm.info = mixed mode
java.vm.name = OpenJDK 64-Bit Server VM
java.vm.specification.name = Java Virtual Machine Specification
java.vm.specification.vendor = Oracle Corporation
java.vm.specification.version = 1.8
java.vm.vendor = Temurin
java.vm.version = 25.302-b08
line.separator = n
os.arch = amd64
os.name = Linux
os.version = 3.10.0-1160.el7.x86_64
path.separator = :
sun.arch.data.model = 64
sun.boot.class.path = /opt/java/jdk8u302-b08/jre/lib/resources.jar
/opt/java/jdk8u302-b08/jre/lib/rt.jar
/opt/java/jdk8u302-b08/jre/lib/sunrsasign.jar
/opt/java/jdk8u302-b08/jre/lib/jsse.jar
/opt/java/jdk8u302-b08/jre/lib/jce.jar
/opt/java/jdk8u302-b08/jre/lib/charsets.jar
/opt/java/jdk8u302-b08/jre/lib/jfr.jar
/opt/java/jdk8u302-b08/jre/classes
sun.boot.library.path = /opt/java/jdk8u302-b08/jre/lib/amd64
sun.cpu.endian = little
sun.cpu.isalist =
sun.io.unicode.encoding = UnicodeLittle
sun.java.launcher = SUN_STANDARD
sun.jnu.encoding = UTF-8
sun.management.compiler = HotSpot 64-Bit Tiered Compilers
sun.os.patch.level = unknown
user.country = US
user.dir = /root
user.home = /root
user.language = en
user.name = root
user.timezone =](https://image.slidesharecdn.com/jvm-230511085906-be6f1201/75/JVM_-pdf-48-2048.jpg)
![49
LAB) JVM 디폴트 플래그 값 확인 (2/2)
Java Virtual Machine
java 디폴트 옵션 값 확인
[root@jvmedu ~]# java -XX:+PrintFlagsFinal -version
[Global flags]
intx ActiveProcessorCount = -1 {product}
uintx AdaptiveSizeDecrementScaleFactor = 4 {product}
uintx AdaptiveSizeMajorGCDecayTimeScale = 10 {product}
uintx AdaptiveSizePausePolicy = 0 {product}
....
힙메모리 관련 디폴트 옵션 값 확인
[root@jvmedu ~]# java -XX:+PrintFlagsFinal -version | grep Heap
bool AggressiveHeap = false {product}
uintx ErgoHeapSizeLimit = 0 {product}
uintx G1HeapRegionSize = 0 {product}
uintx G1HeapWastePercent = 5 {product}
uintx GCHeapFreeLimit = 2 {product}
uintx HeapBaseMinAddress = 2147483648 {pd product}
bool HeapDumpAfterFullGC = false {manageable}
bool HeapDumpBeforeFullGC = false {manageable}
bool HeapDumpOnOutOfMemoryError = false {manageable}
ccstr HeapDumpPath = {manageable}
uintx HeapFirstMaximumCompactionCount = 3 {product}
uintx HeapMaximumCompactionInterval = 20 {product}
uintx HeapSizePerGCThread = 87241520 {product}
uintx InitialHeapSize := 65011712 {product}
uintx InitiatingHeapOccupancyPercent = 45 {product}
uintx LargePageHeapSizeThreshold = 134217728 {product}
uintx MaxHeapFreeRatio = 100 {manageable}
uintx MaxHeapSize := 1035993088 {product}
uintx MinHeapDeltaBytes := 524288 {product}
uintx MinHeapFreeRatio = 0 {manageable}
bool PrintHeapAtGC = false {product rw}
bool PrintHeapAtGCExtended = false {product rw}
bool PrintHeapAtSIGBREAK = true {product}](https://image.slidesharecdn.com/jvm-230511085906-be6f1201/75/JVM_-pdf-49-2048.jpg)
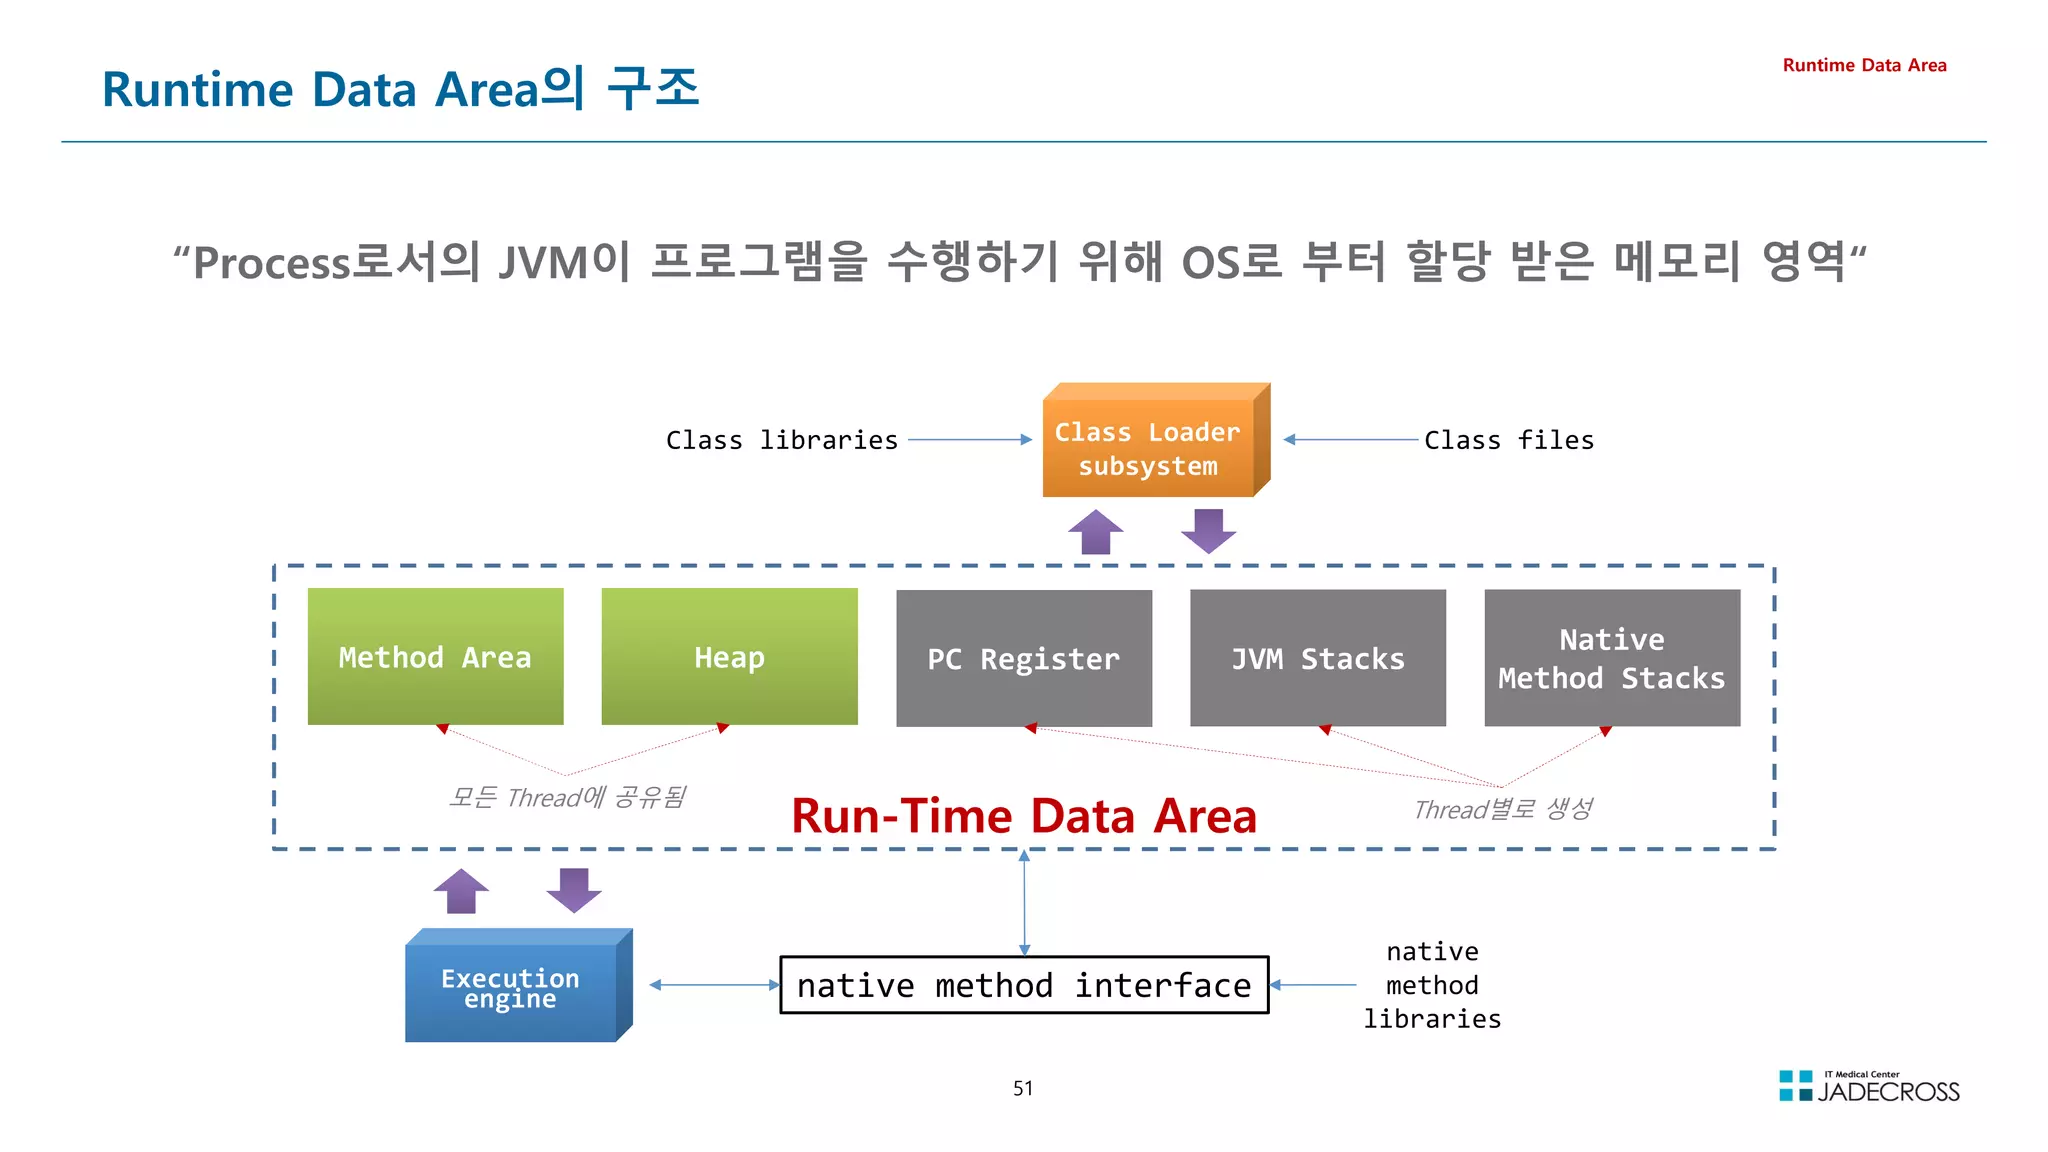
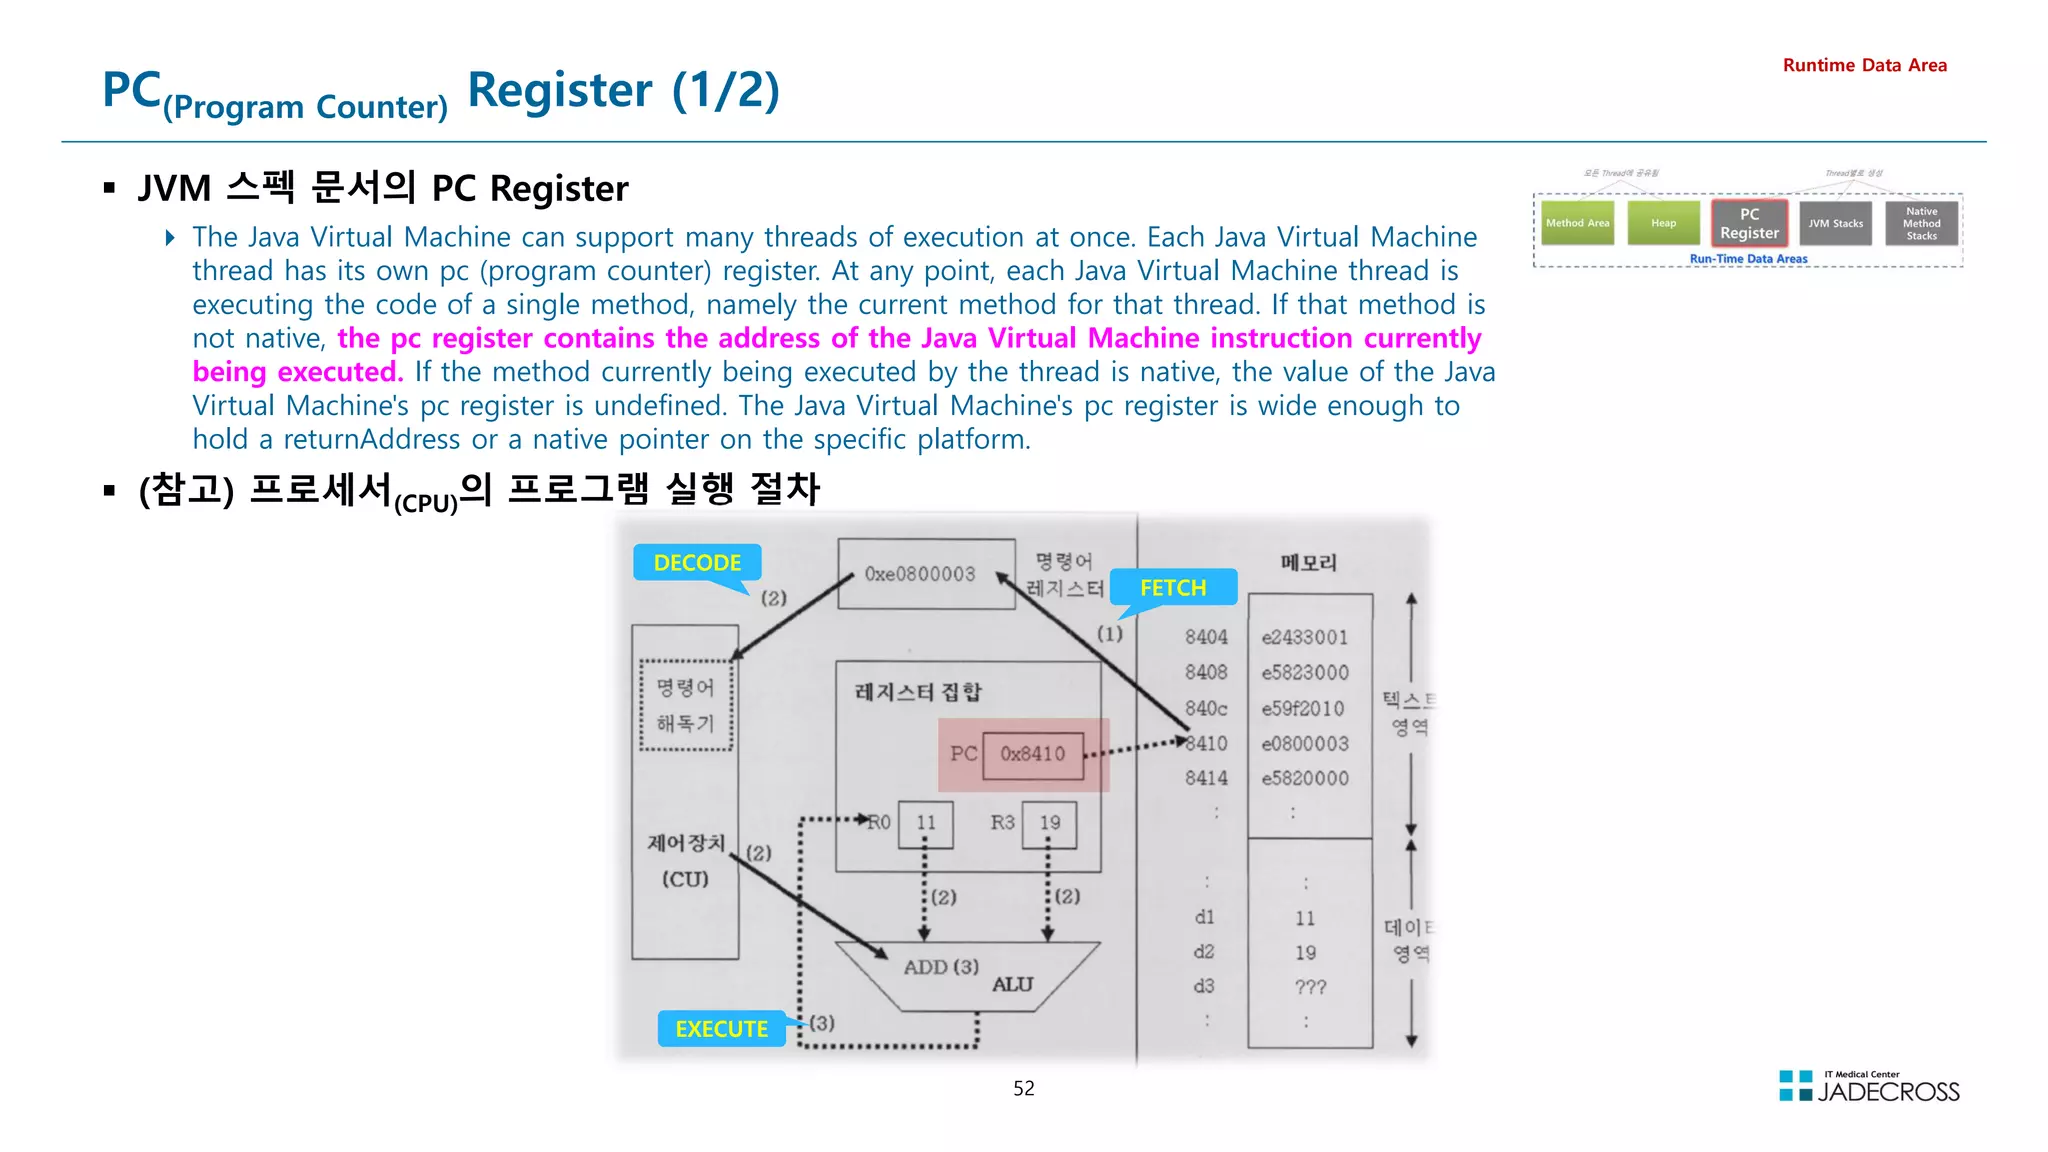
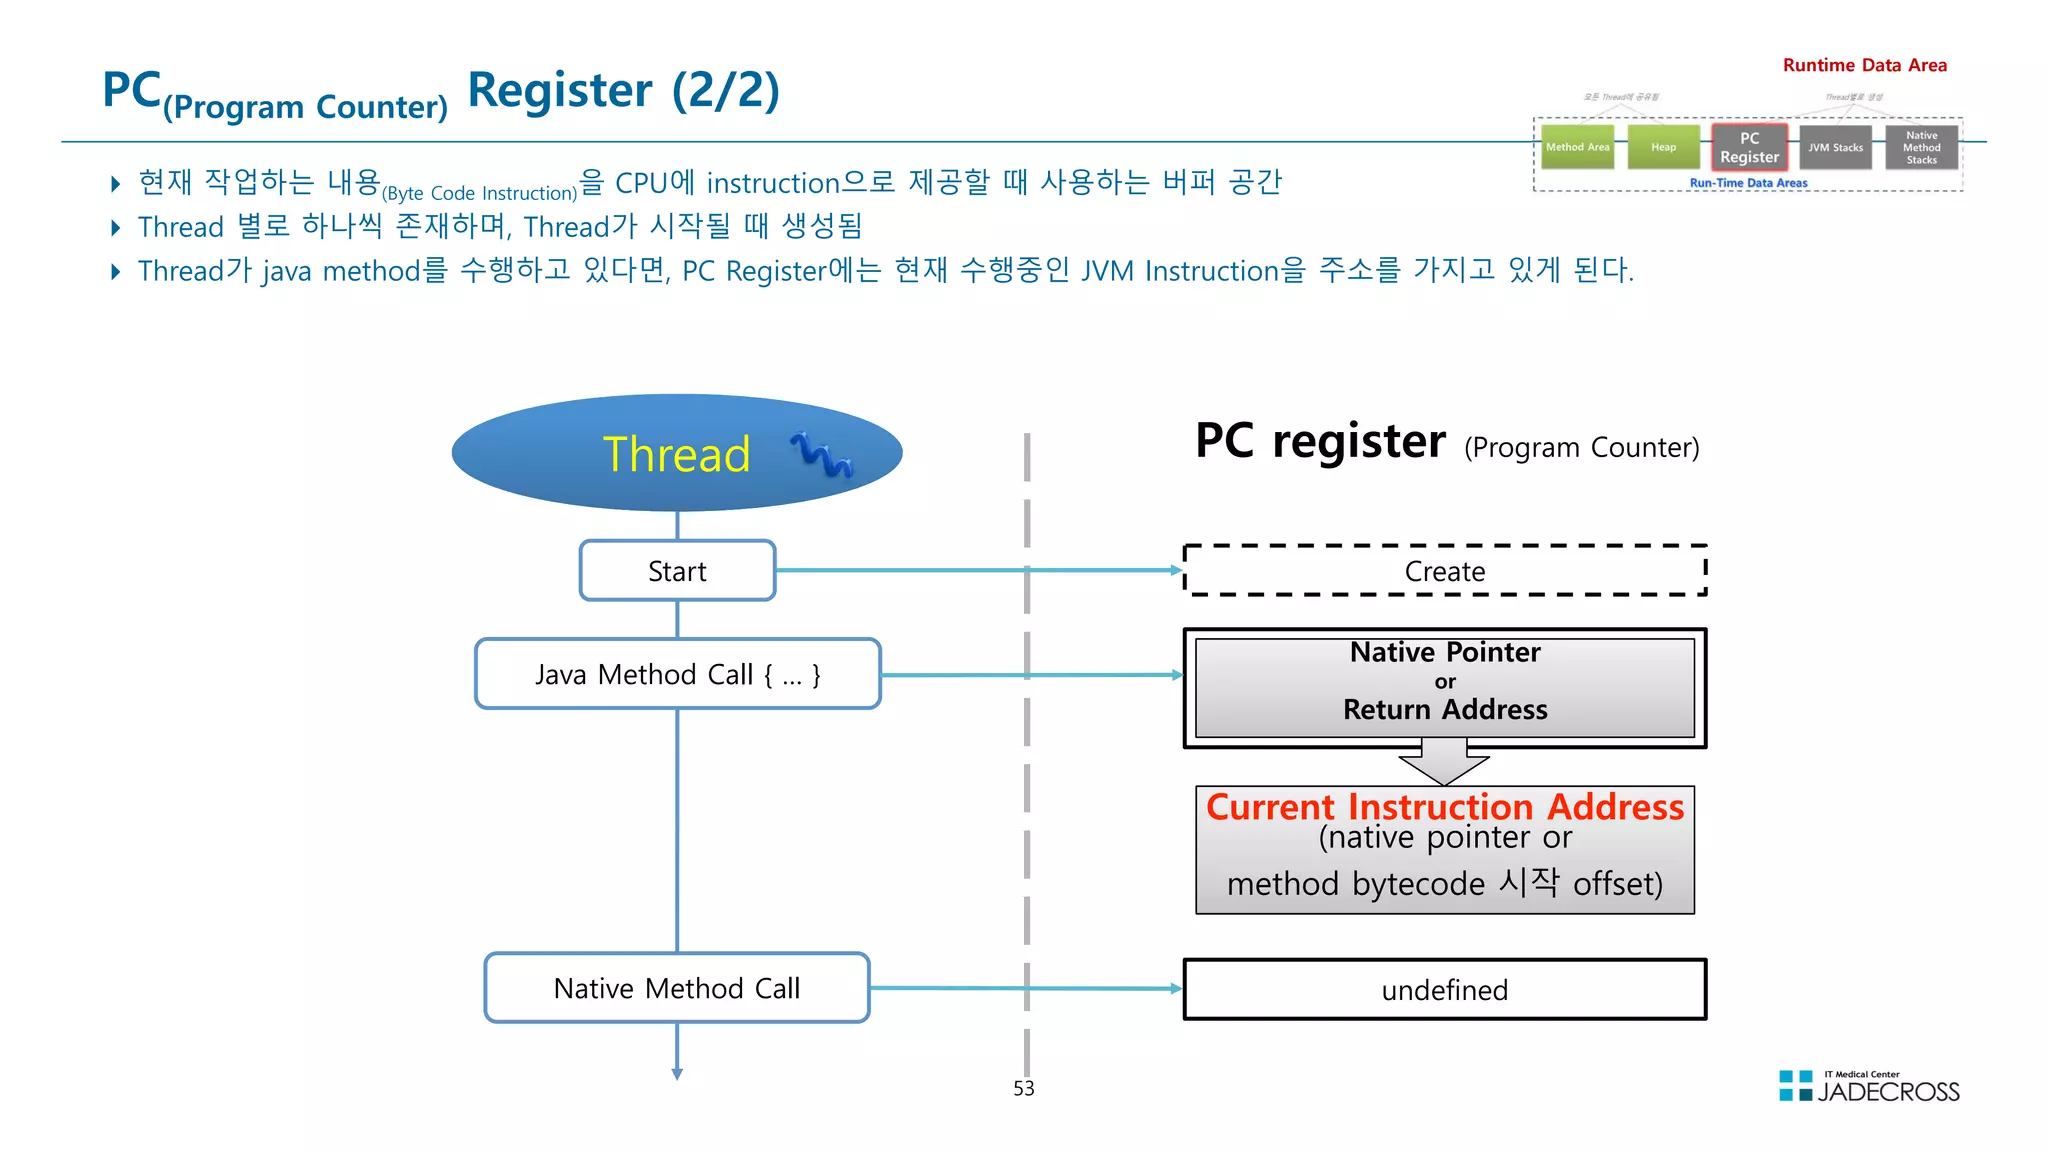
![54
Java Virtual Machine Stacks (1/2)
JVM 스펙의 JVM Stacks
Each Java Virtual Machine thread has a private Java Virtual Machine stack, created at the same time as the thread. A Java Virtual
Machine stack stores frames. A Java Virtual Machine stack is analogous to the stack of a conventional language such as C: it holds local
variables and partial results, and plays a part in method invocation and return. Because the Java Virtual Machine stack is never
manipulated directly except to push and pop frames, frames may be heap allocated. The memory for a Java Virtual Machine stack does
not need to be contiguous.
In the First Edition of The Java® Virtual Machine Specification, the Java Virtual Machine stack was known as the Java stack.
This specification permits Java Virtual Machine stacks either to be of a fixed size or to dynamically expand and contract as required by
the computation. If the Java Virtual Machine stacks are of a fixed size, the size of each Java Virtual Machine stack may be chosen
independently when that stack is created.
A Java Virtual Machine implementation may provide the programmer or the user control over the initial size of Java Virtual Machine stacks, as well as, in
the case of dynamically expanding or contracting Java Virtual Machine stacks, control over the maximum and minimum sizes.
Runtime Data Area
④
③
②
①
삽입(push) 제거(pop)
①②③④의 순서로 데이터 삽입 ④③②①의 순서로 데이터 제거
스택의 상위(Top)
[그림 5-2] 스택의 구조
The following exceptional conditions are associated with Java Virtual
Machine stacks:
If the computation in a thread requires a larger Java Virtual Machine stack than
is permitted, the Java Virtual Machine throws a StackOverflowError.
If Java Virtual Machine stacks can be dynamically expanded, and expansion is
attempted but insufficient memory can be made available to effect the
expansion, or if insufficient memory can be made available to create the initial
Java Virtual Machine stack for a new thread, the Java Virtual Machine throws an
OutOfMemoryError.](https://image.slidesharecdn.com/jvm-230511085906-be6f1201/75/JVM_-pdf-54-2048.jpg)
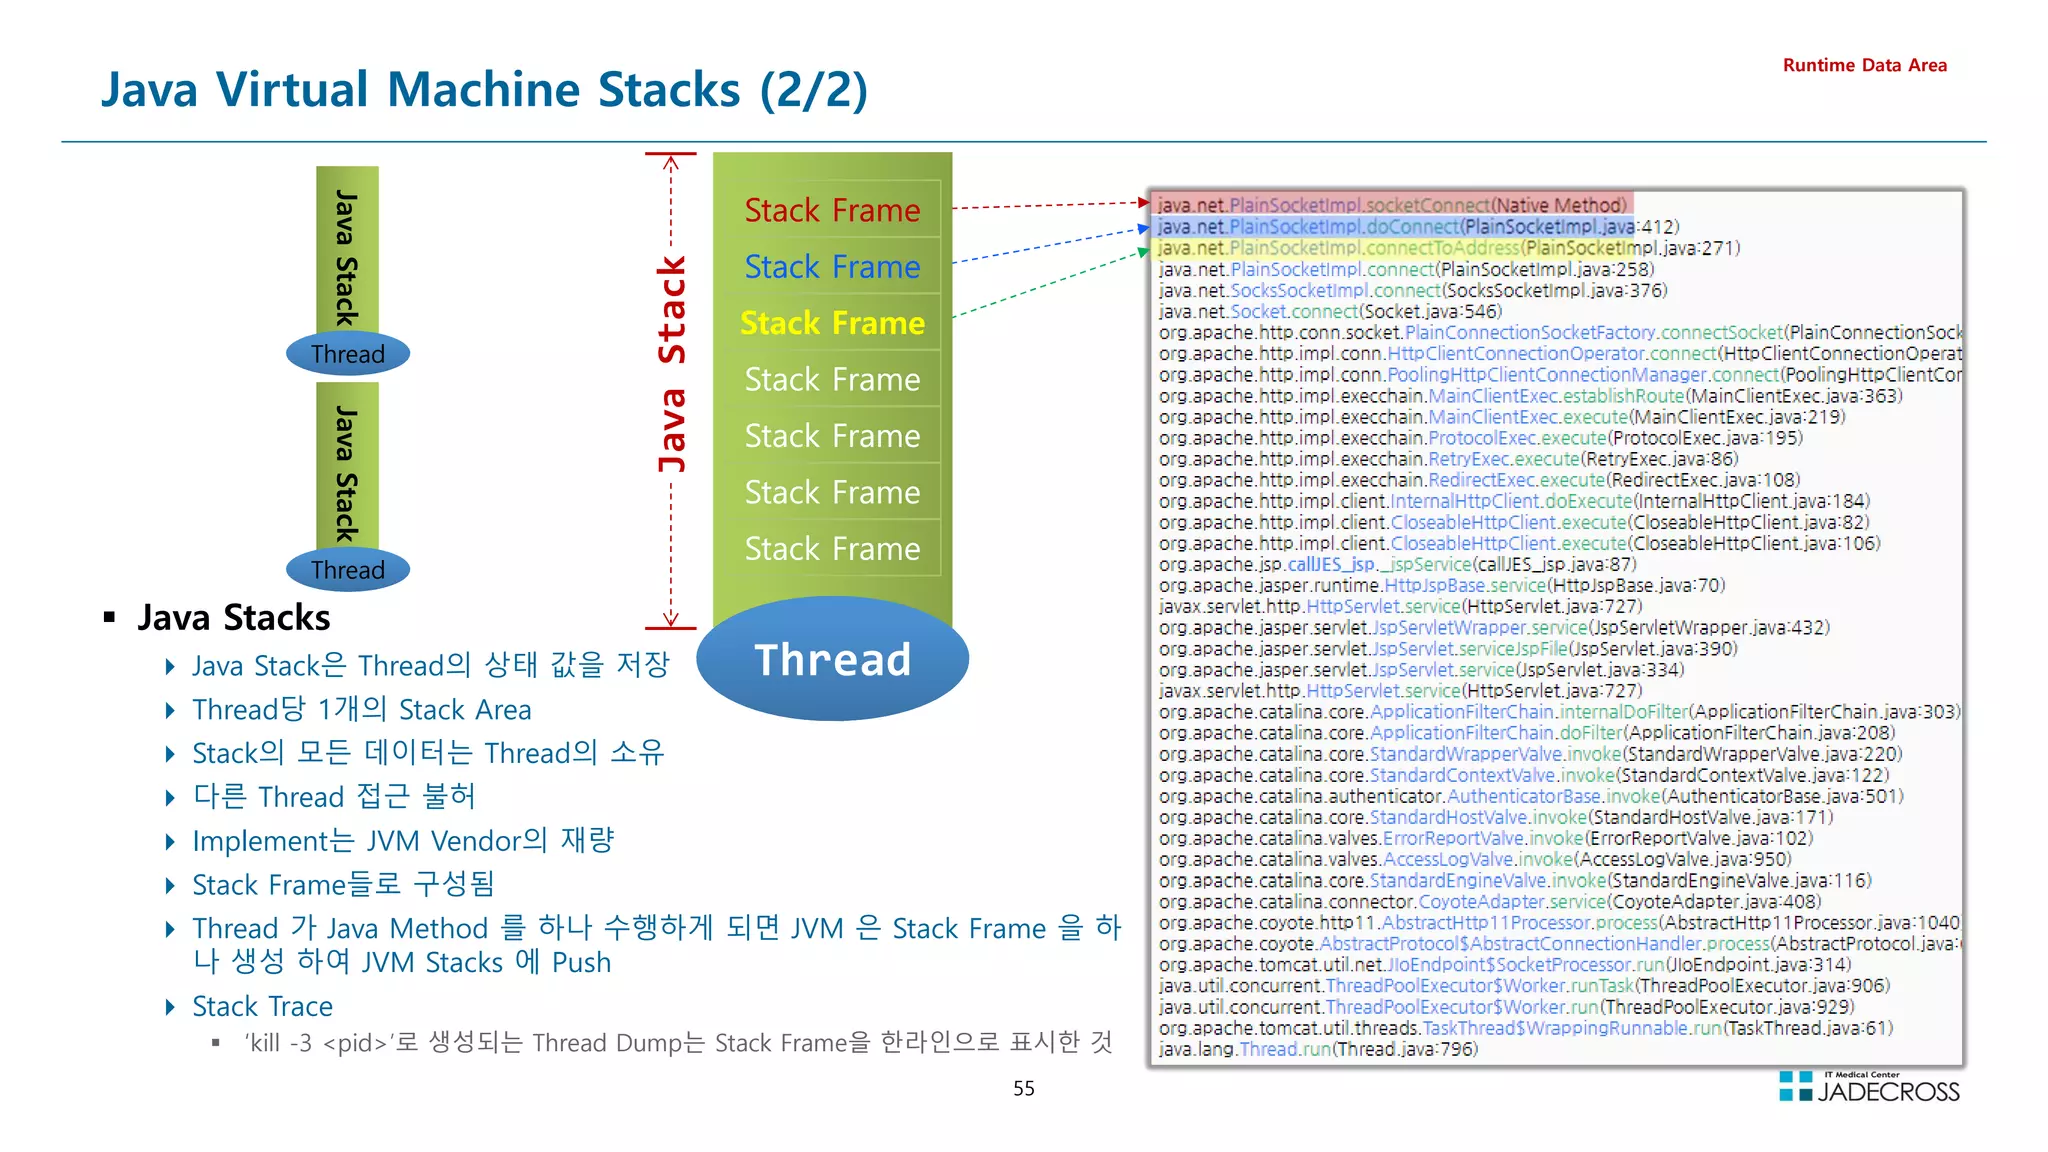
![56
LAB) Stack Trace (Thread Dump) 확인 (1/3)
jpetstore 샘플 웹어플리케이션 실행
Runtime Data Area
STS를 실행하고 “Tomcat v8.5” 서버 시작
[root@jvmedu ~]# sts
http://192.168.56.96:8080/jpetstore URL로 접속
Tomcat 시작
http://192.168.56.96:8080/jpetstore/](https://image.slidesharecdn.com/jvm-230511085906-be6f1201/75/JVM_-pdf-56-2048.jpg)
![57
LAB) Stack Trace (Thread Dump) 확인 (2/3)
VisualVM
https://visualvm.github.io/
Runtime Data Area
visualvm 프로그램을 설치하고 Alias 를 등록하고 visualvm 실행 후 visualgc 플러그인 설치
Tools Plugins Available Plugins Visual GC Install
[root@jvmedu ~]# cd ~/lab/java-tool
[root@jvmedu java-tool]# unzip visualvm_211.zip
[root@jvmedu java-tool]# echo alias visualvm='/root/lab/java-tool/visualvm_211/bin/visualvm /dev/null 21 ' ~/.bashrc
[root@jvmedu java-tool]# source ~/.bash_profile
[root@jvmedu java-tool]# visualvm
Applications 뷰에서 “Tomcat” 오픈 “Threads” 탭 “Thread Dump” 버튼 클릭](https://image.slidesharecdn.com/jvm-230511085906-be6f1201/75/JVM_-pdf-57-2048.jpg)
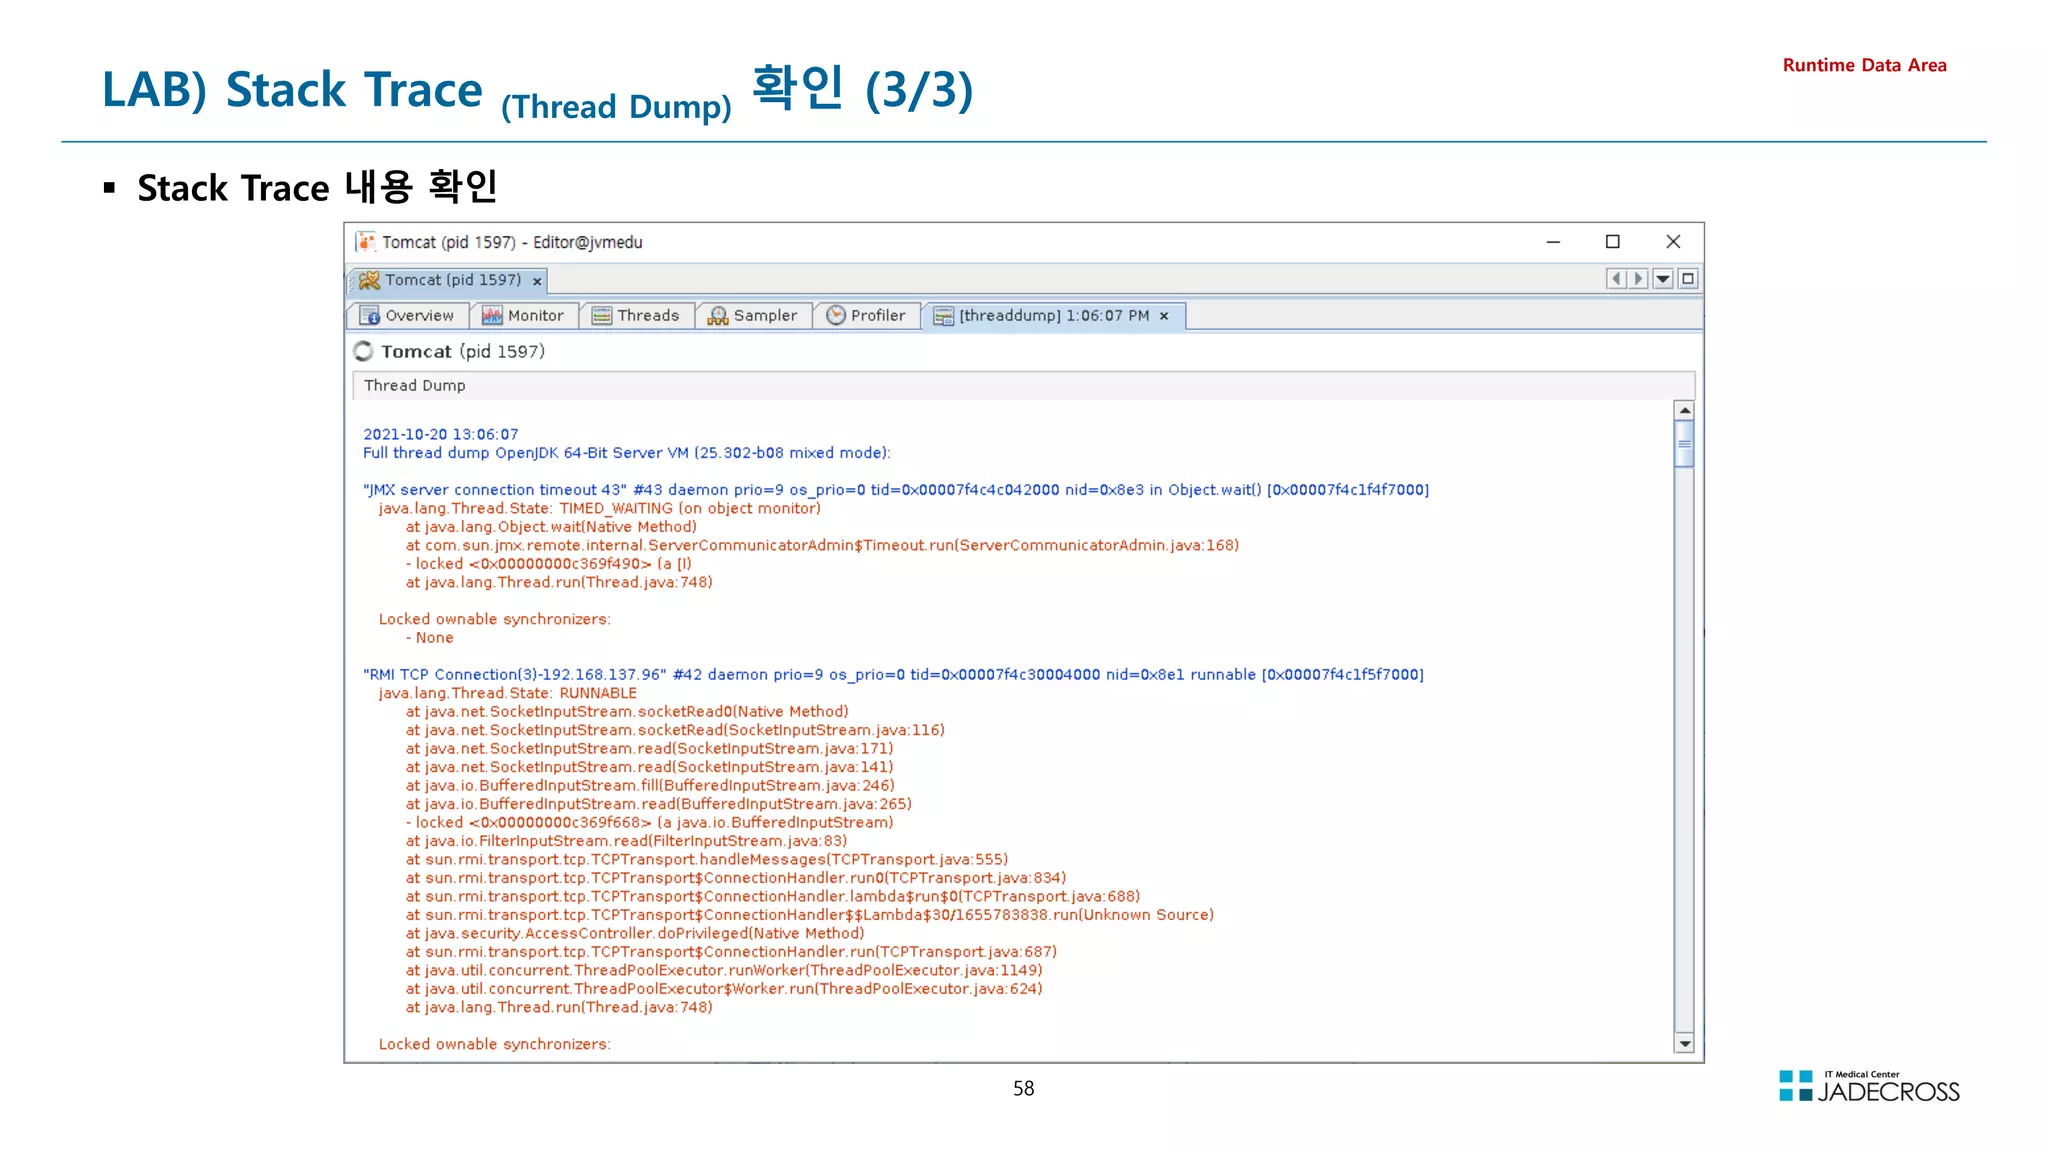
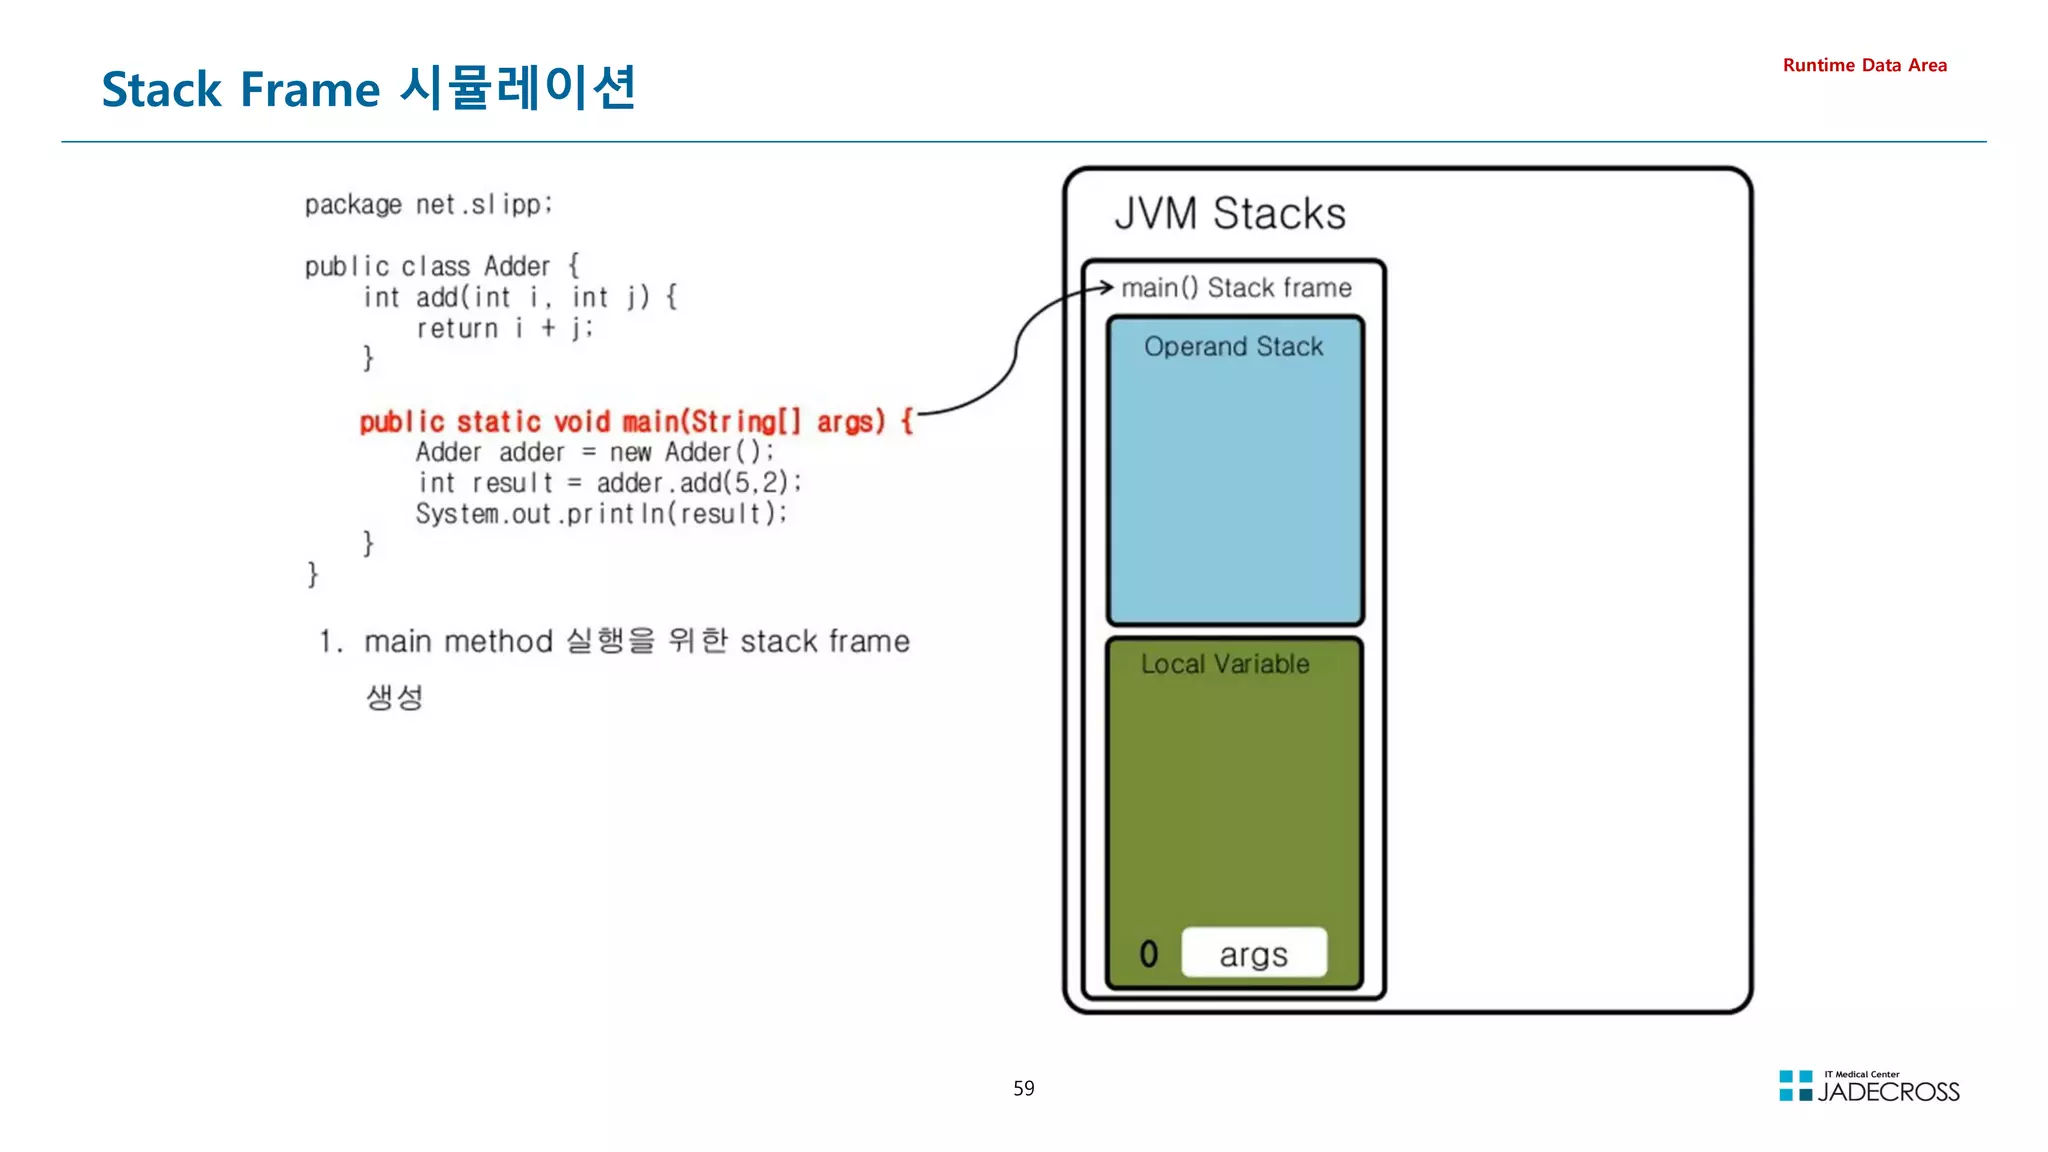
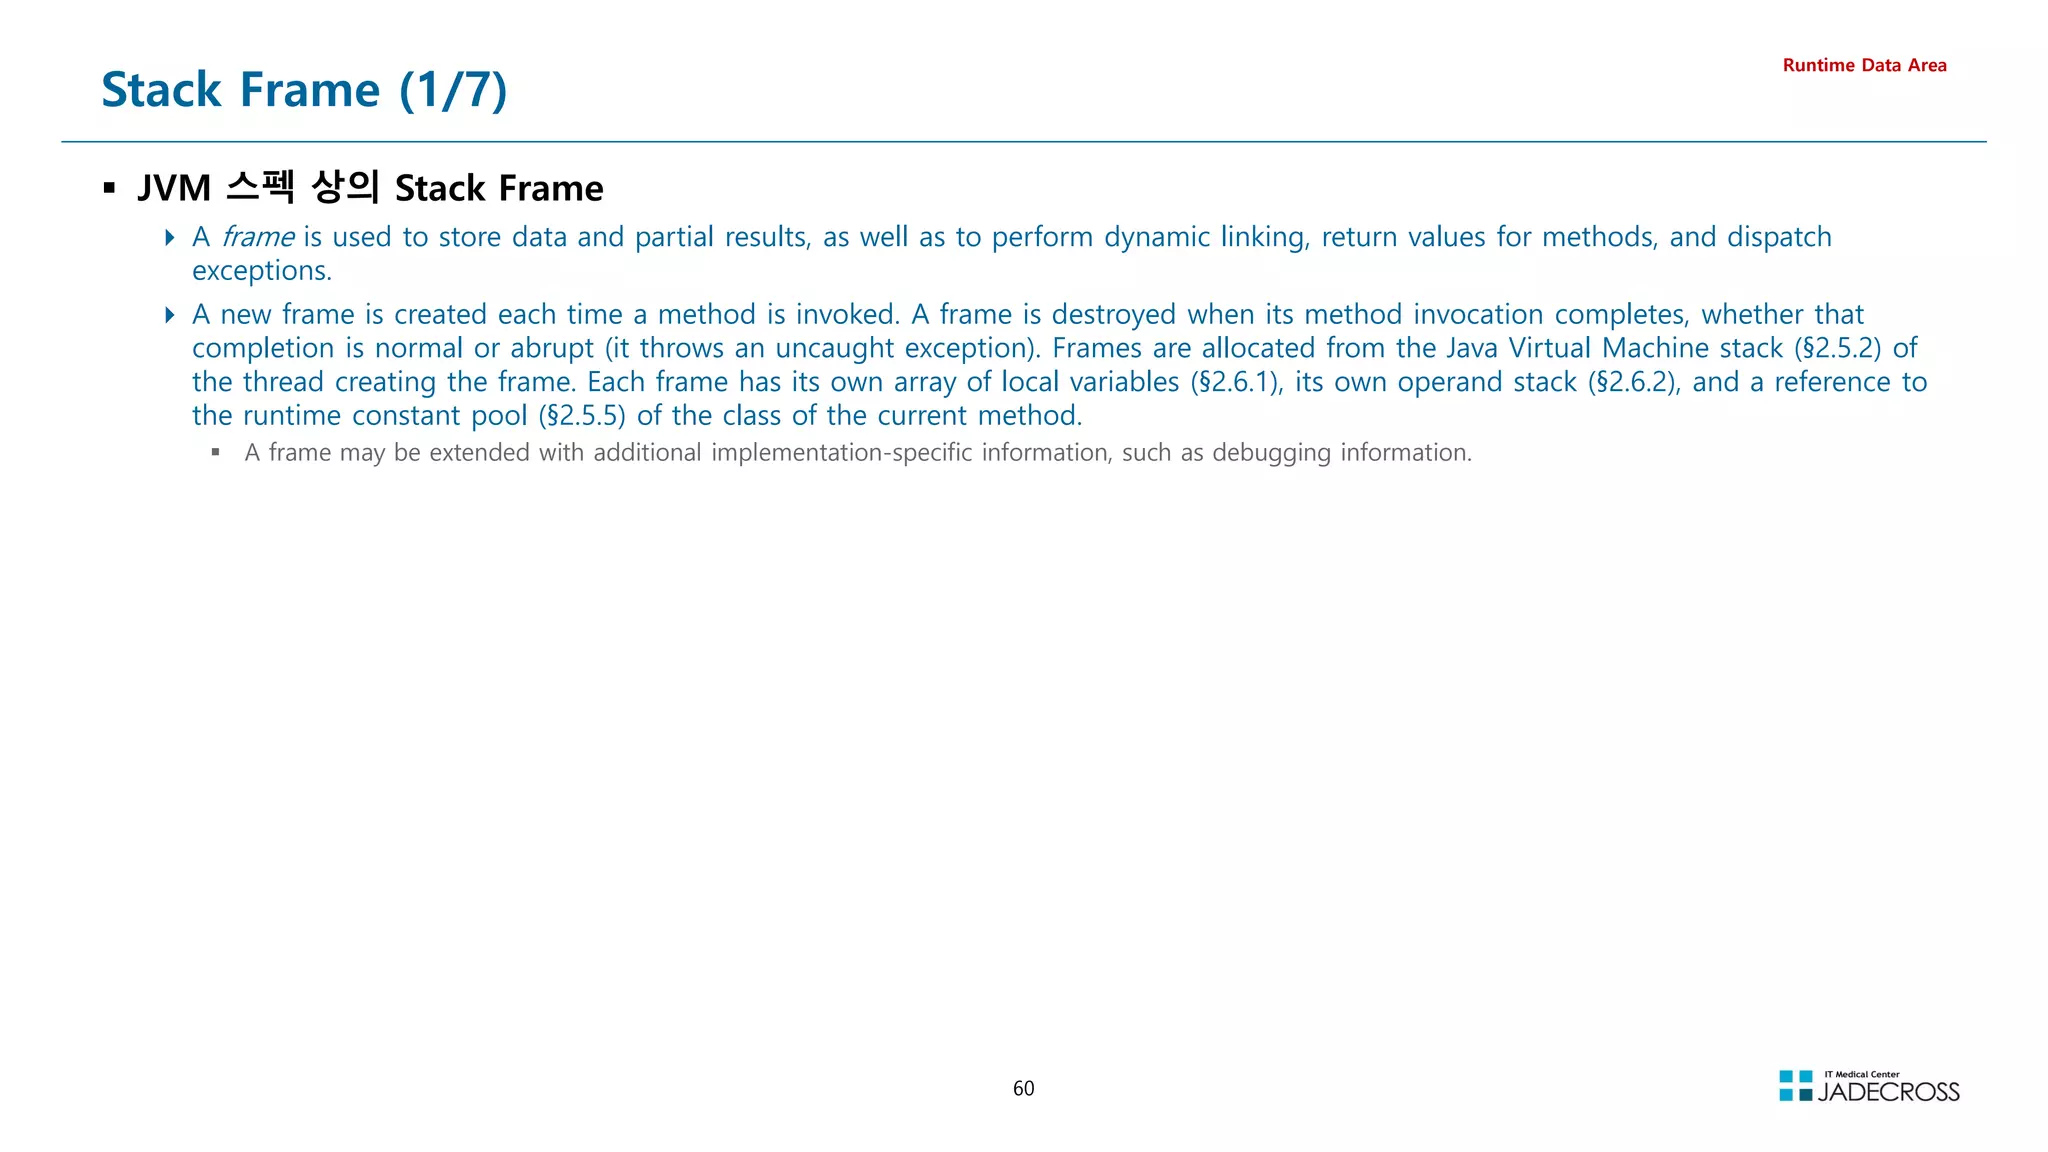
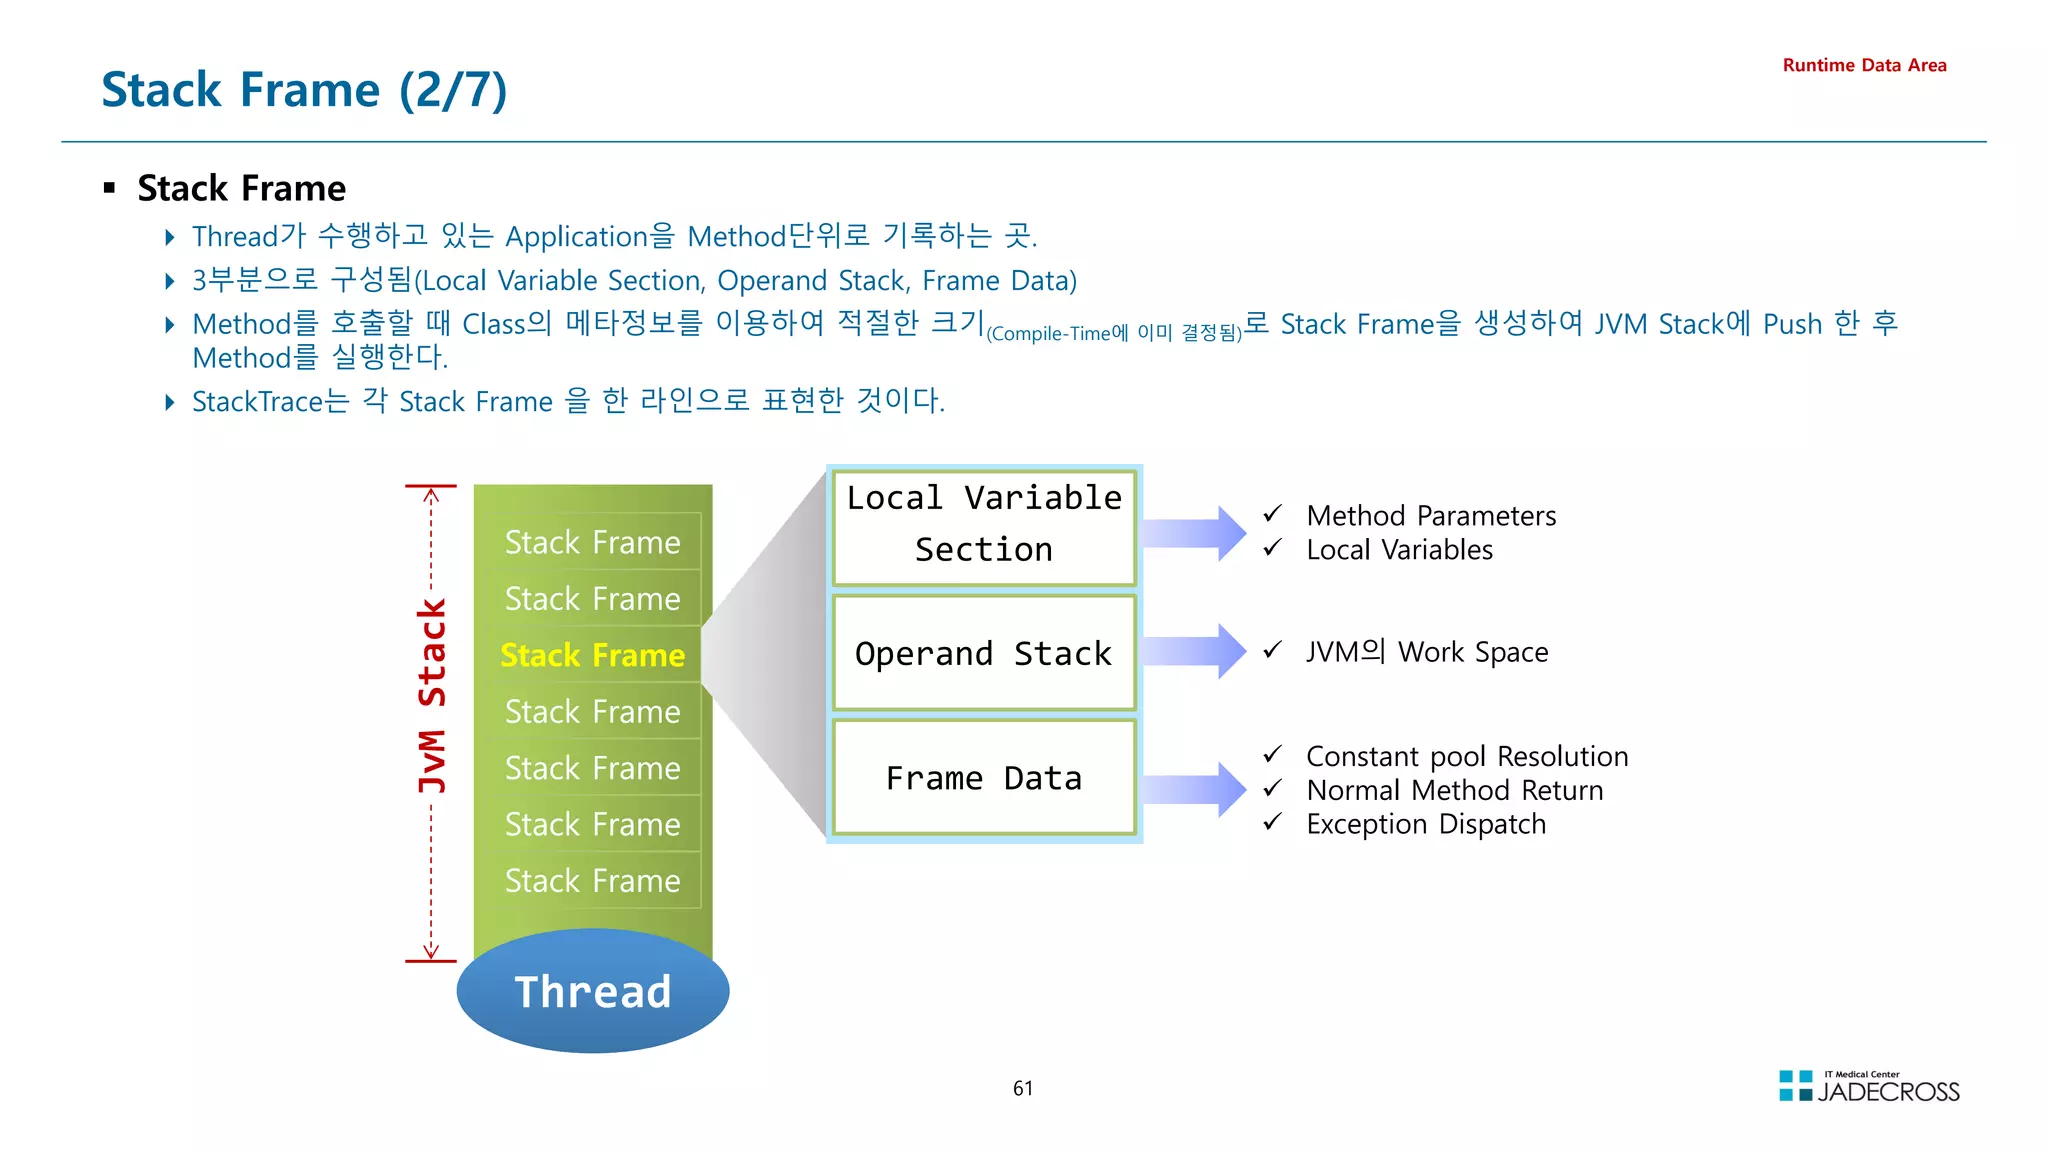
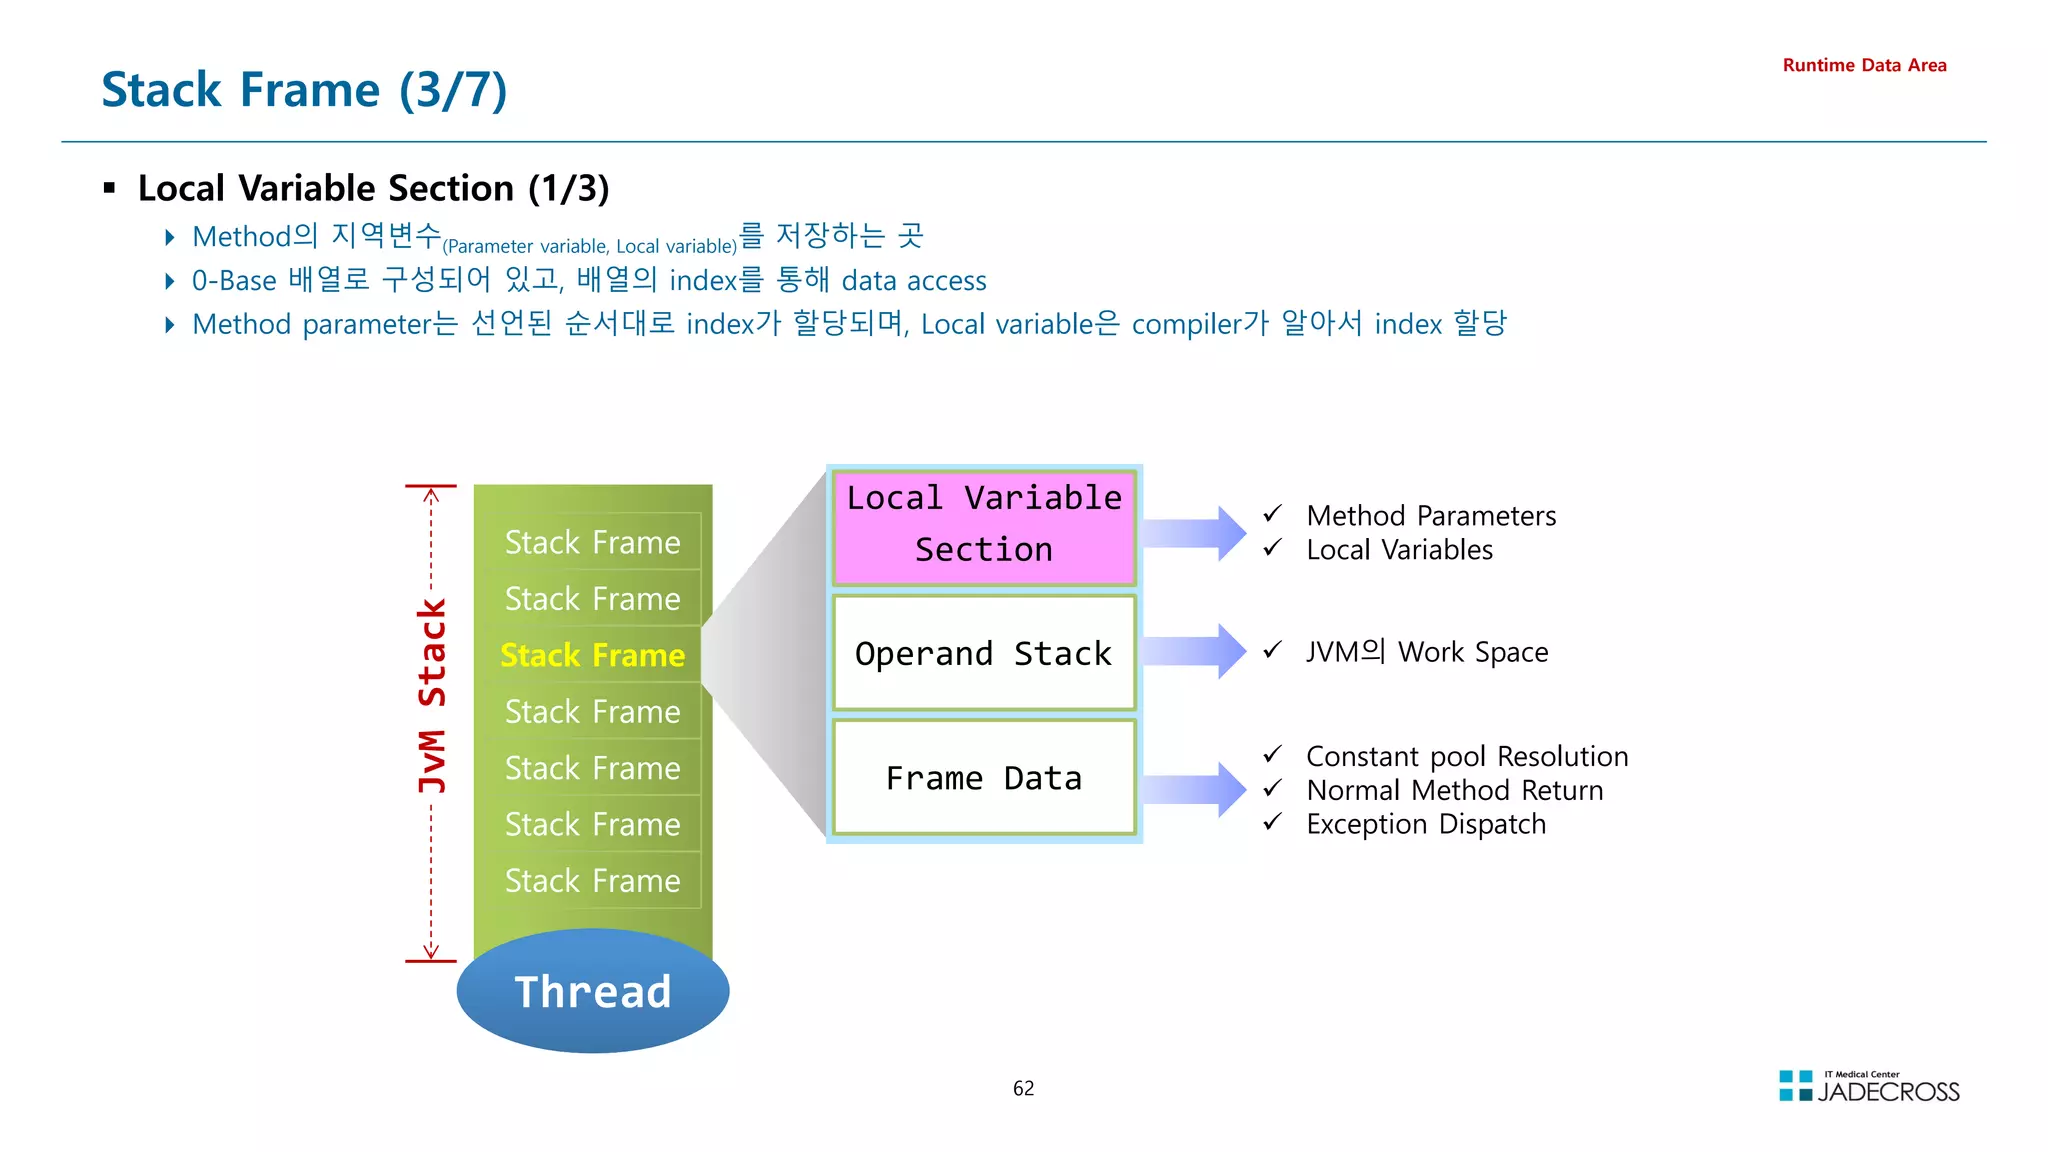
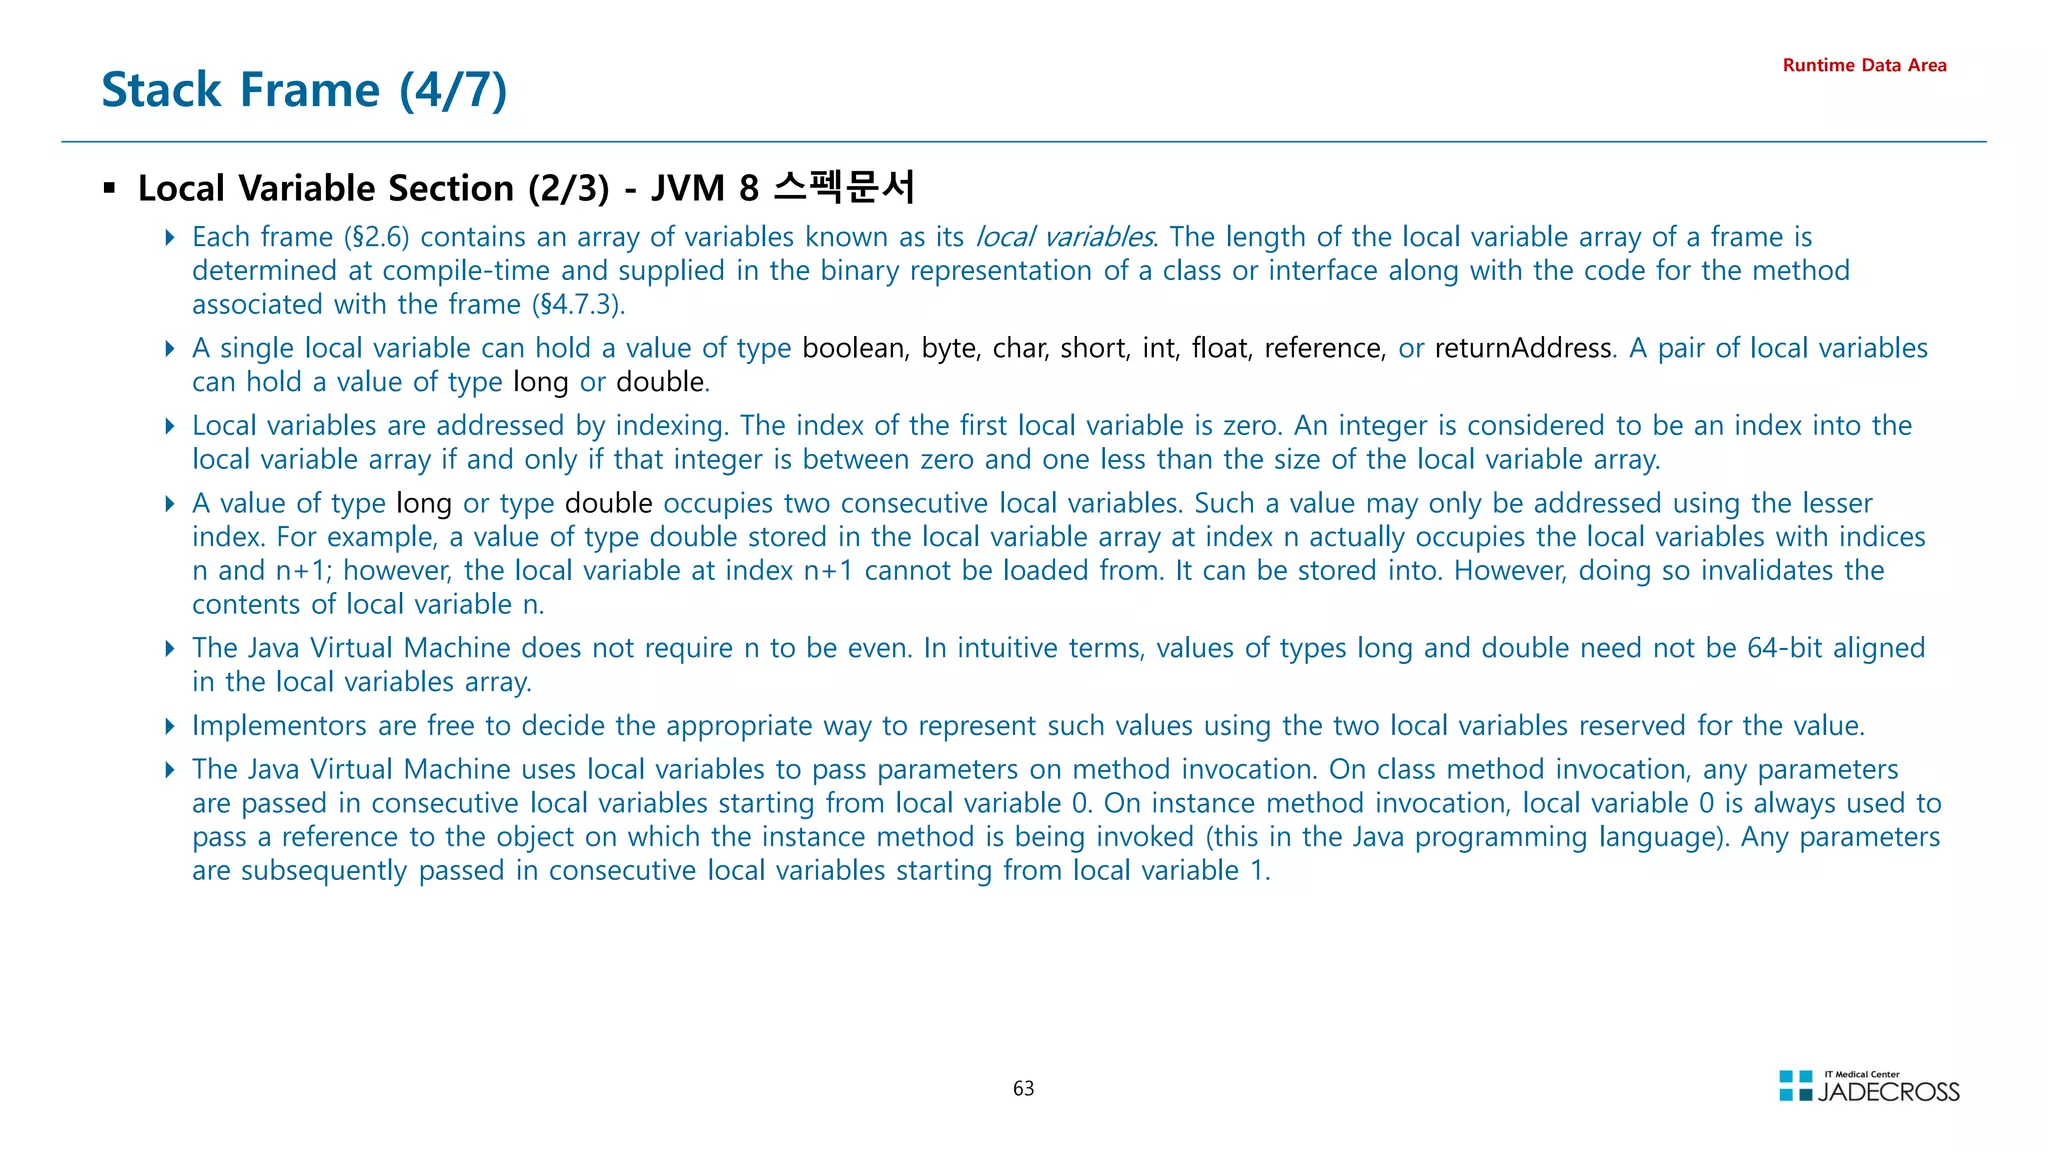
![64
// Compiled from LocalVariableSection.java (version 1.8 : 52.0, super bit)
public class LocalVariableSection {
// Method descriptor #6 ()V
// Stack: 1, Locals: 1
public LocalVariableSection();
0 aload_0 [this]
1 invokespecial java.lang.Object() [8]
4 return
Line numbers:
[pc: 0, line: 2]
Local variable table:
[pc: 0, pc: 5] local: this index: 0 type: LocalVariableSection
// Method descriptor #15 (ICJFLjava/lang/Object;DLjava/lang/String;BSZ)I
// Stack: 1, Locals: 13
public int testMethod(int a, char b, long c, float d, java.lang.Object e,
double f, java.lang.String g, byte h, short i, boolean j);
0 iconst_0
1 ireturn
Line numbers:
[pc: 0, line: 4]
Local variable table:
[pc: 0, pc: 2] local: this index: 0 type: LocalVariableSection
[pc: 0, pc: 2] local: a index: 1 type: int
[pc: 0, pc: 2] local: b index: 2 type: char
[pc: 0, pc: 2] local: c index: 3 type: long
[pc: 0, pc: 2] local: d index: 5 type: float
[pc: 0, pc: 2] local: e index: 6 type: java.lang.Object
[pc: 0, pc: 2] local: f index: 7 type: double
[pc: 0, pc: 2] local: g index: 9 type: java.lang.String
[pc: 0, pc: 2] local: h index: 10 type: byte
[pc: 0, pc: 2] local: i index: 11 type: short
[pc: 0, pc: 2] local: j index: 12 type: boolean
}
Stack Frame (5/7)
Local Variable Section (3/3)
Local Variable Section의 크기도 Compile-Time에 결정됨
Primitive Type은 실제 값이 저장되고, Object Type은 객체가 저장되는
Heap의 Reference가 저장
hidden this
0번 인덱스에 저장되는 reference형으로, 모든 Local Method, Instance Method
에 자동으로 추가되는 변수로, 여기에 저장된 reference를 통해 Heap에 있는
Class의 Instance 데이터를 찾아가는데 이용
static으로 선언한 Class Method의 경우에는 “hidden this” 레퍼런스가 존재하지
않음 Method Area에 저장됨
(샘플) Local Variable Section에서의 Method parameter
Runtime Data Area
class LocalVariableSection {
public int testMethod(int a,
char b,
long c,
float d,
Object e,
double f,
String g,
byte h,
short i,
boolean j) {
return 0;
}
}
index 선언 할당
0 reference hidden this
1 int int a
2 int int b
3
long long c
5 float float d
6 reference Object e
7
double double f
9 reference String g
10 int byte h
11 int short i
12 int boolean j
int -vs- Integer 어떤 자료형이 효율적일까?
Byte
Code](https://image.slidesharecdn.com/jvm-230511085906-be6f1201/75/JVM_-pdf-64-2048.jpg)
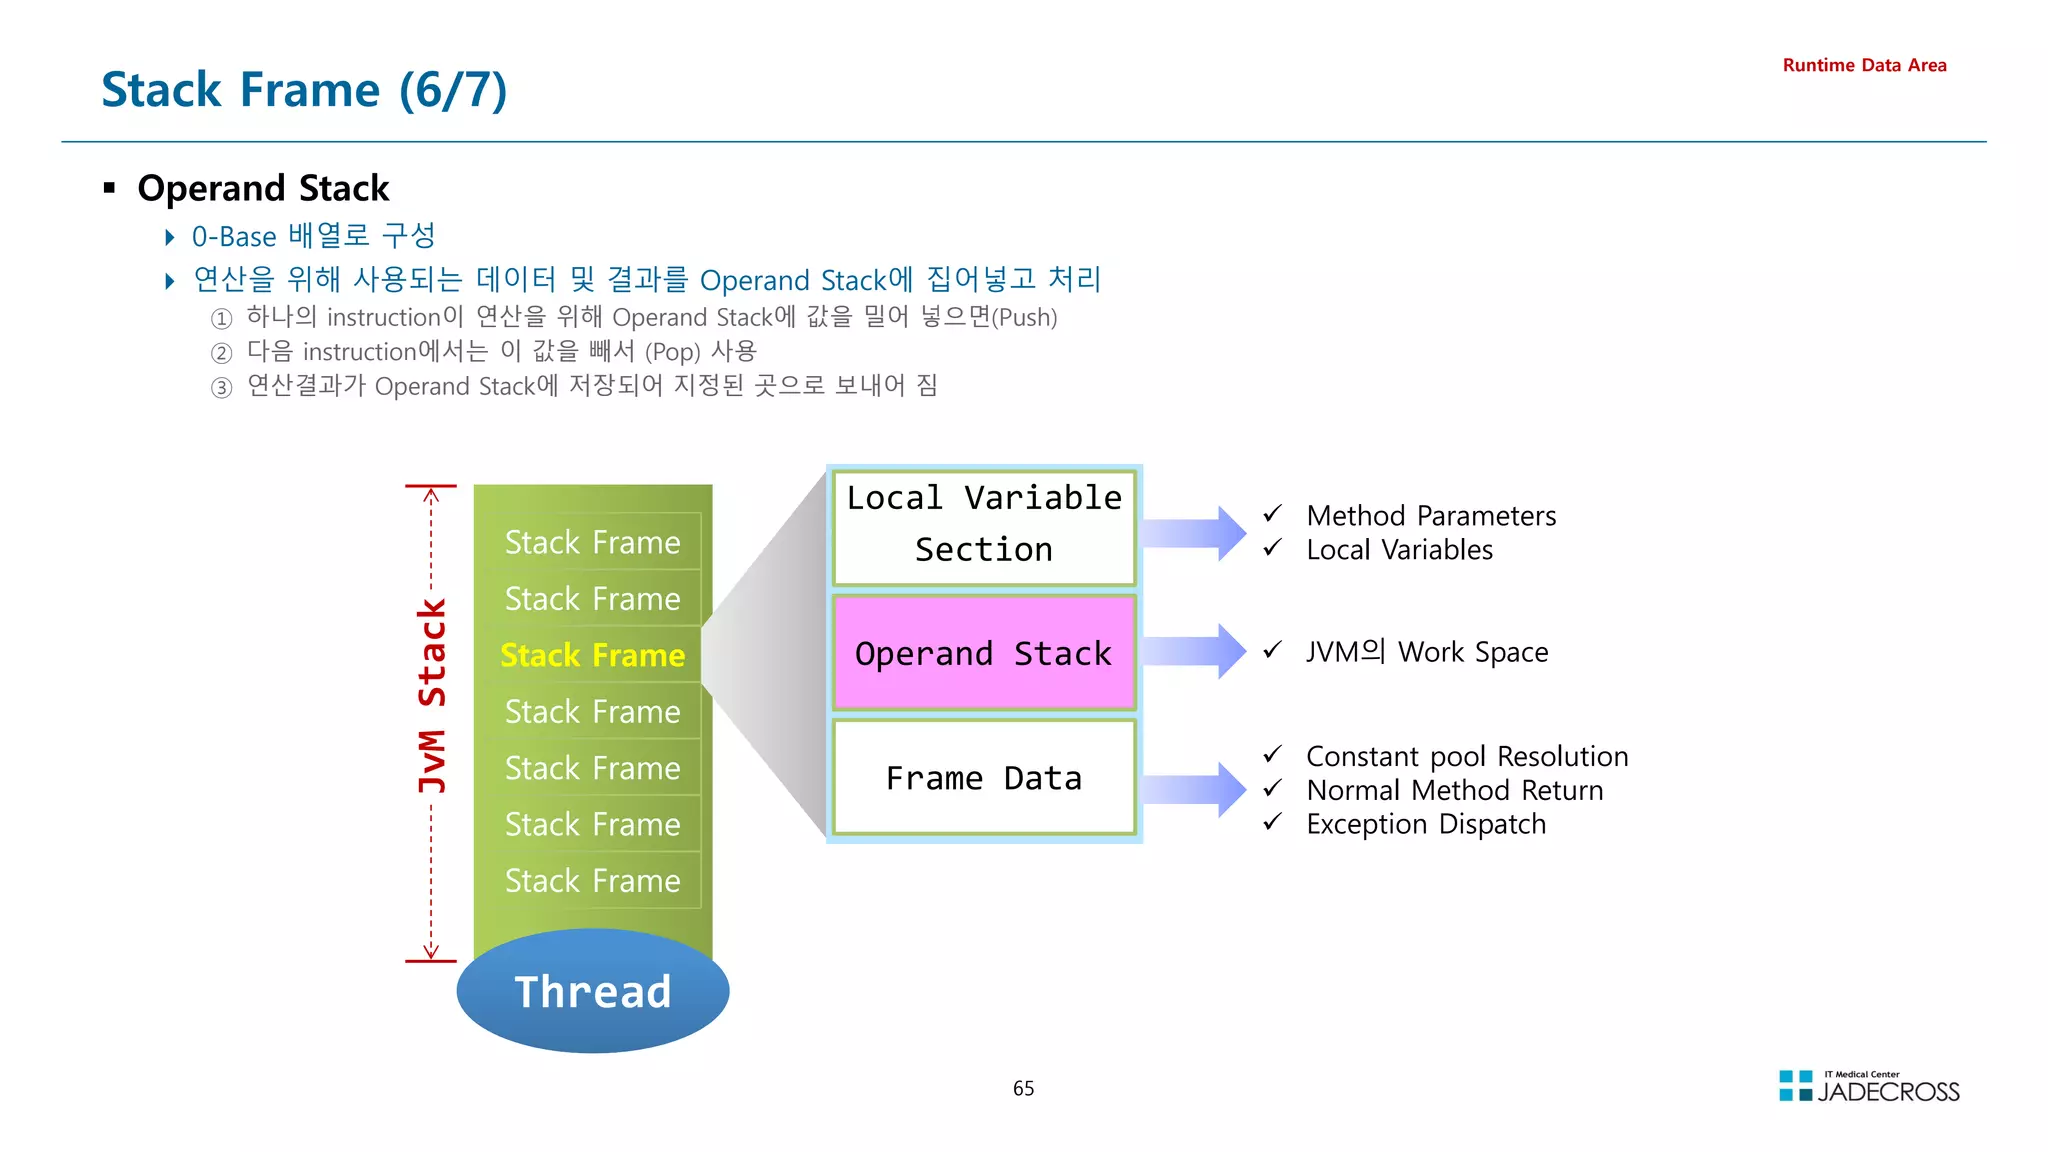
![66
Stack Frame (7/7)
Operand Stack 데모
Runtime Data Area
자바 소스 Byte Code
public class OperandStack {
public void testMethod() {
int a, b, c;
a = 5;
b = 6;
c = a + b;
}
}
// Compiled from OperandStack.java (version 1.8 : 52.0, super bit)
public class OperandStack {
// Method descriptor #6 ()V
// Stack: 1, Locals: 1
public OperandStack();
0 aload_0 [this]
1 invokespecial java.lang.Object() [8]
4 return
Line numbers:
[pc: 0, line: 2]
Local variable table:
[pc: 0, pc: 5] local: this index: 0 type: OperandStack
// Method descriptor #6 ()V
// Stack: 2, Locals: 4
public void testMethod();
0 iconst_5
1 istore_1 [a]
2 bipush 6
4 istore_2 [b]
5 iload_1 [a]
6 iload_2 [b]
7 iadd
8 istore_3 [c]
9 return
Line numbers:
[pc: 0, line: 5]
[pc: 2, line: 6]
[pc: 5, line: 7]
[pc: 9, line: 8]
Local variable table:
[pc: 0, pc: 10] local: this index: 0 type: OperandStack
[pc: 2, pc: 10] local: a index: 1 type: int
[pc: 5, pc: 10] local: b index: 2 type: int
[pc: 9, pc: 10] local: c index: 3 type: int
}](https://image.slidesharecdn.com/jvm-230511085906-be6f1201/75/JVM_-pdf-66-2048.jpg)
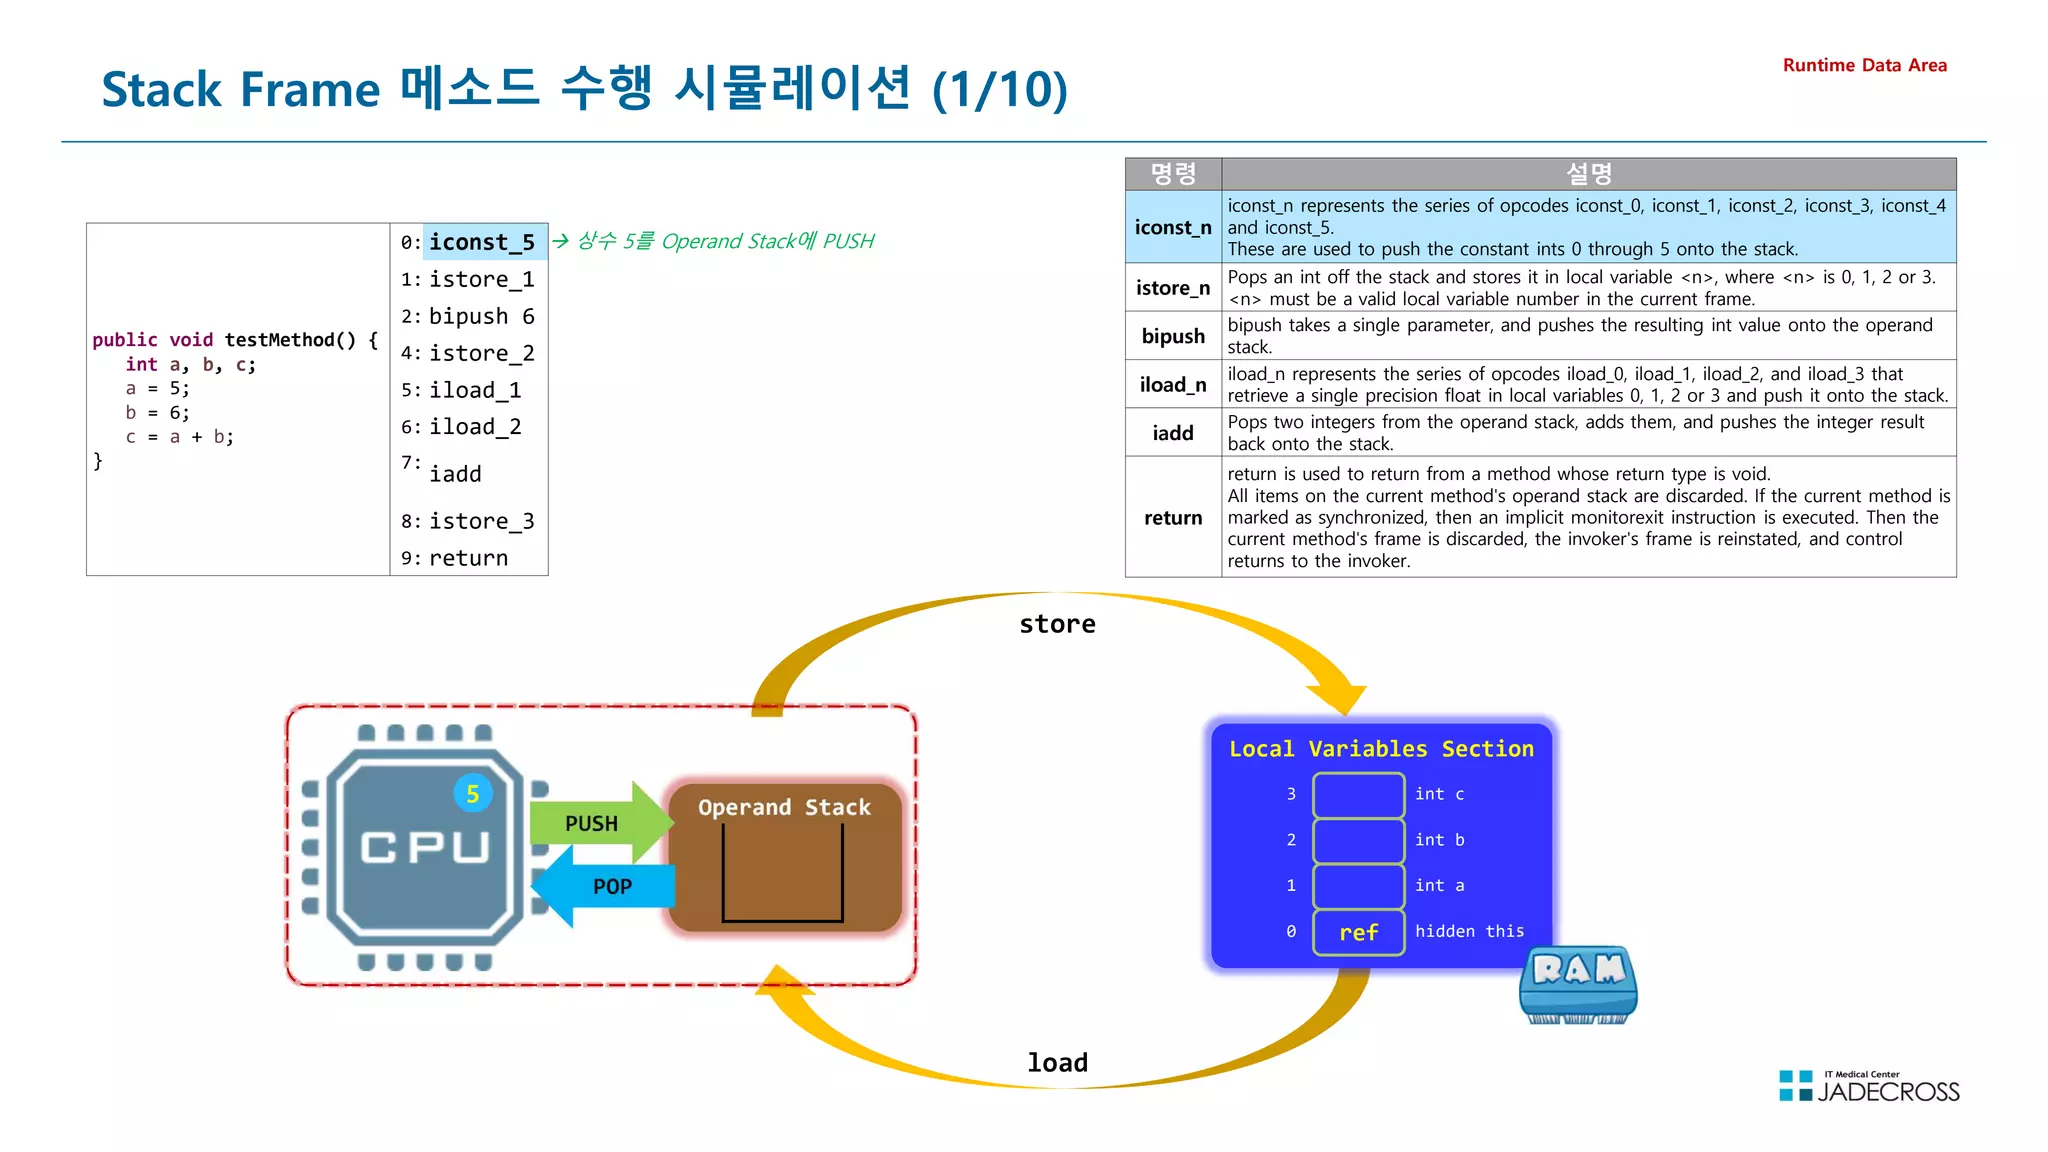
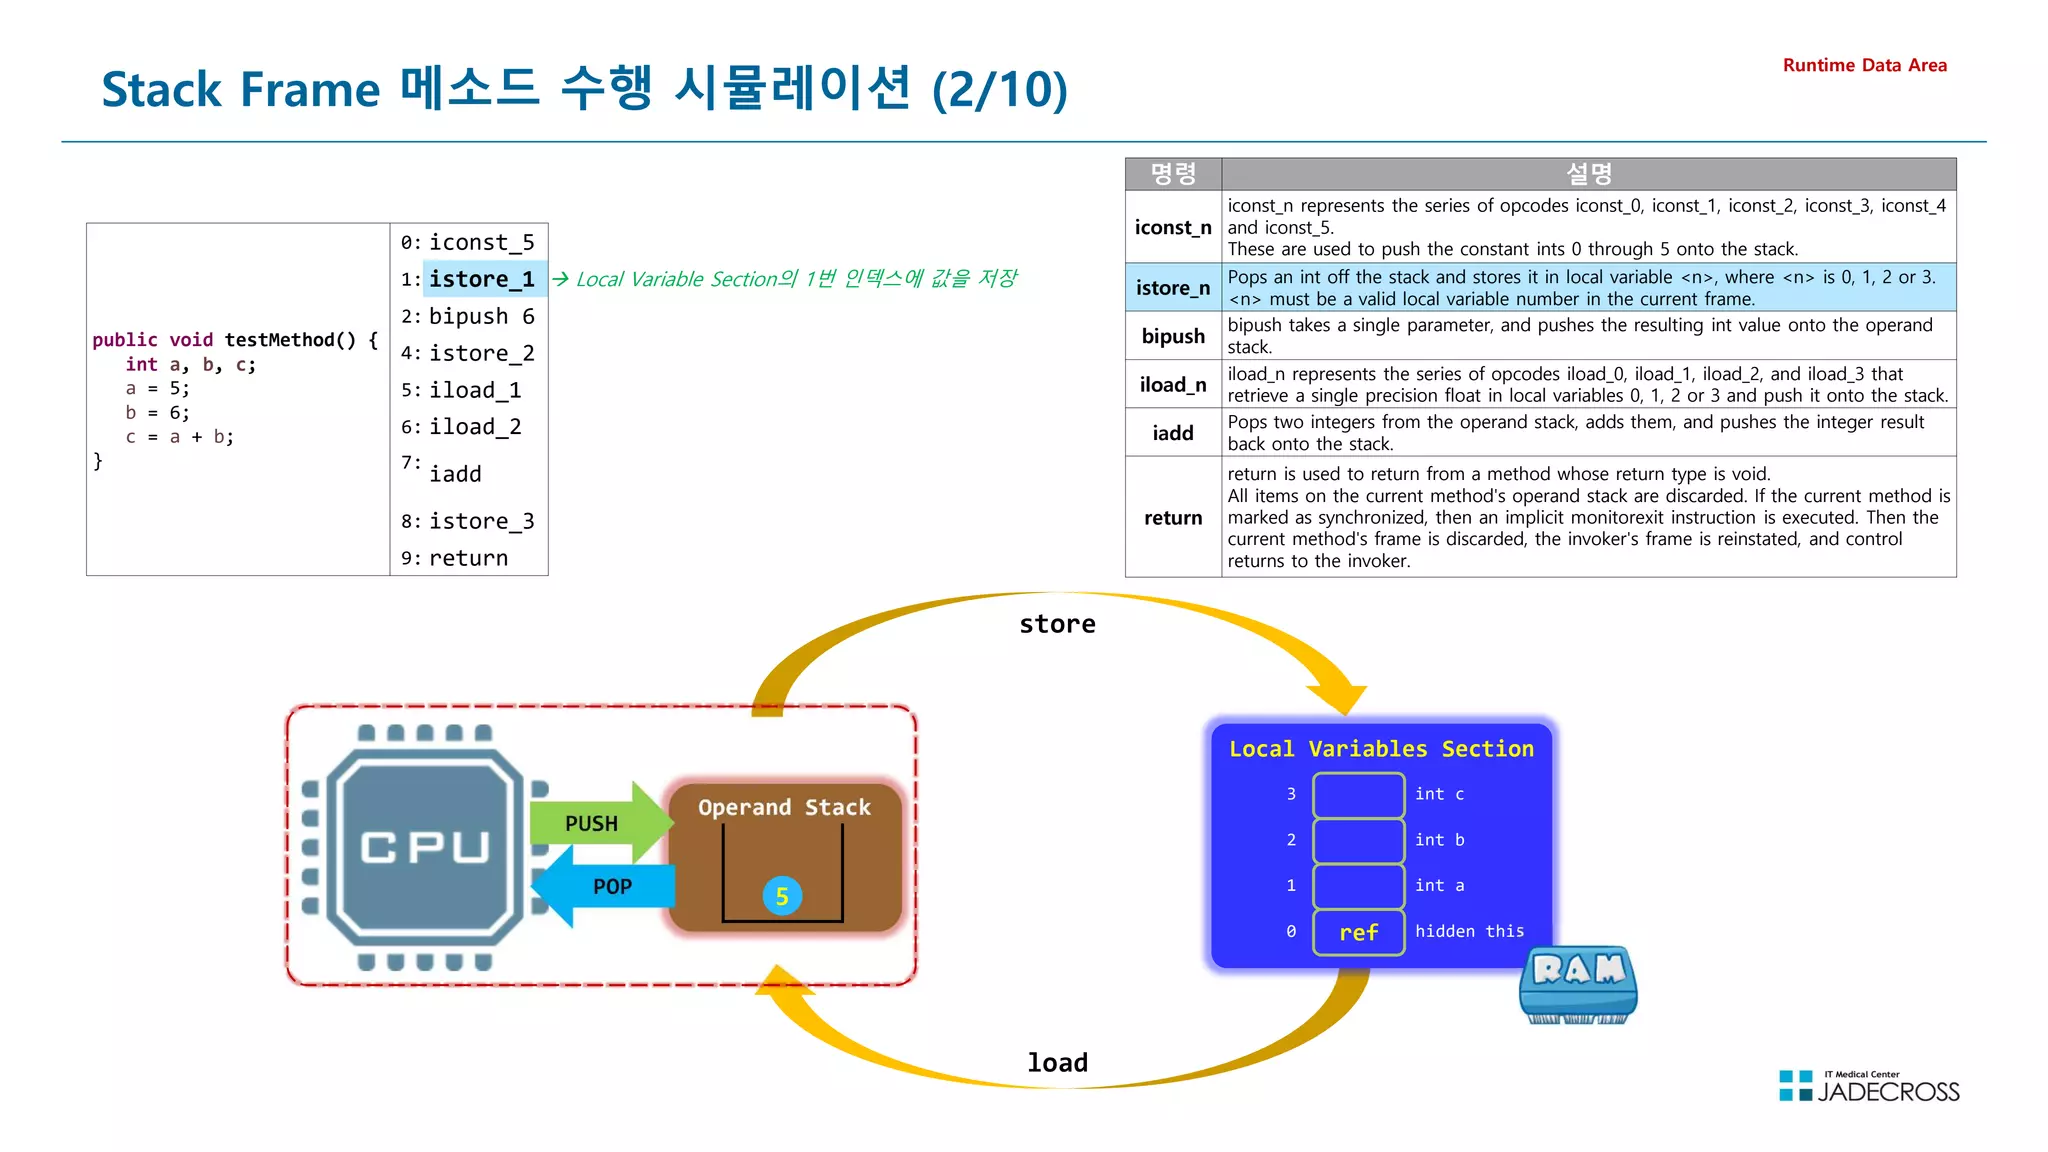
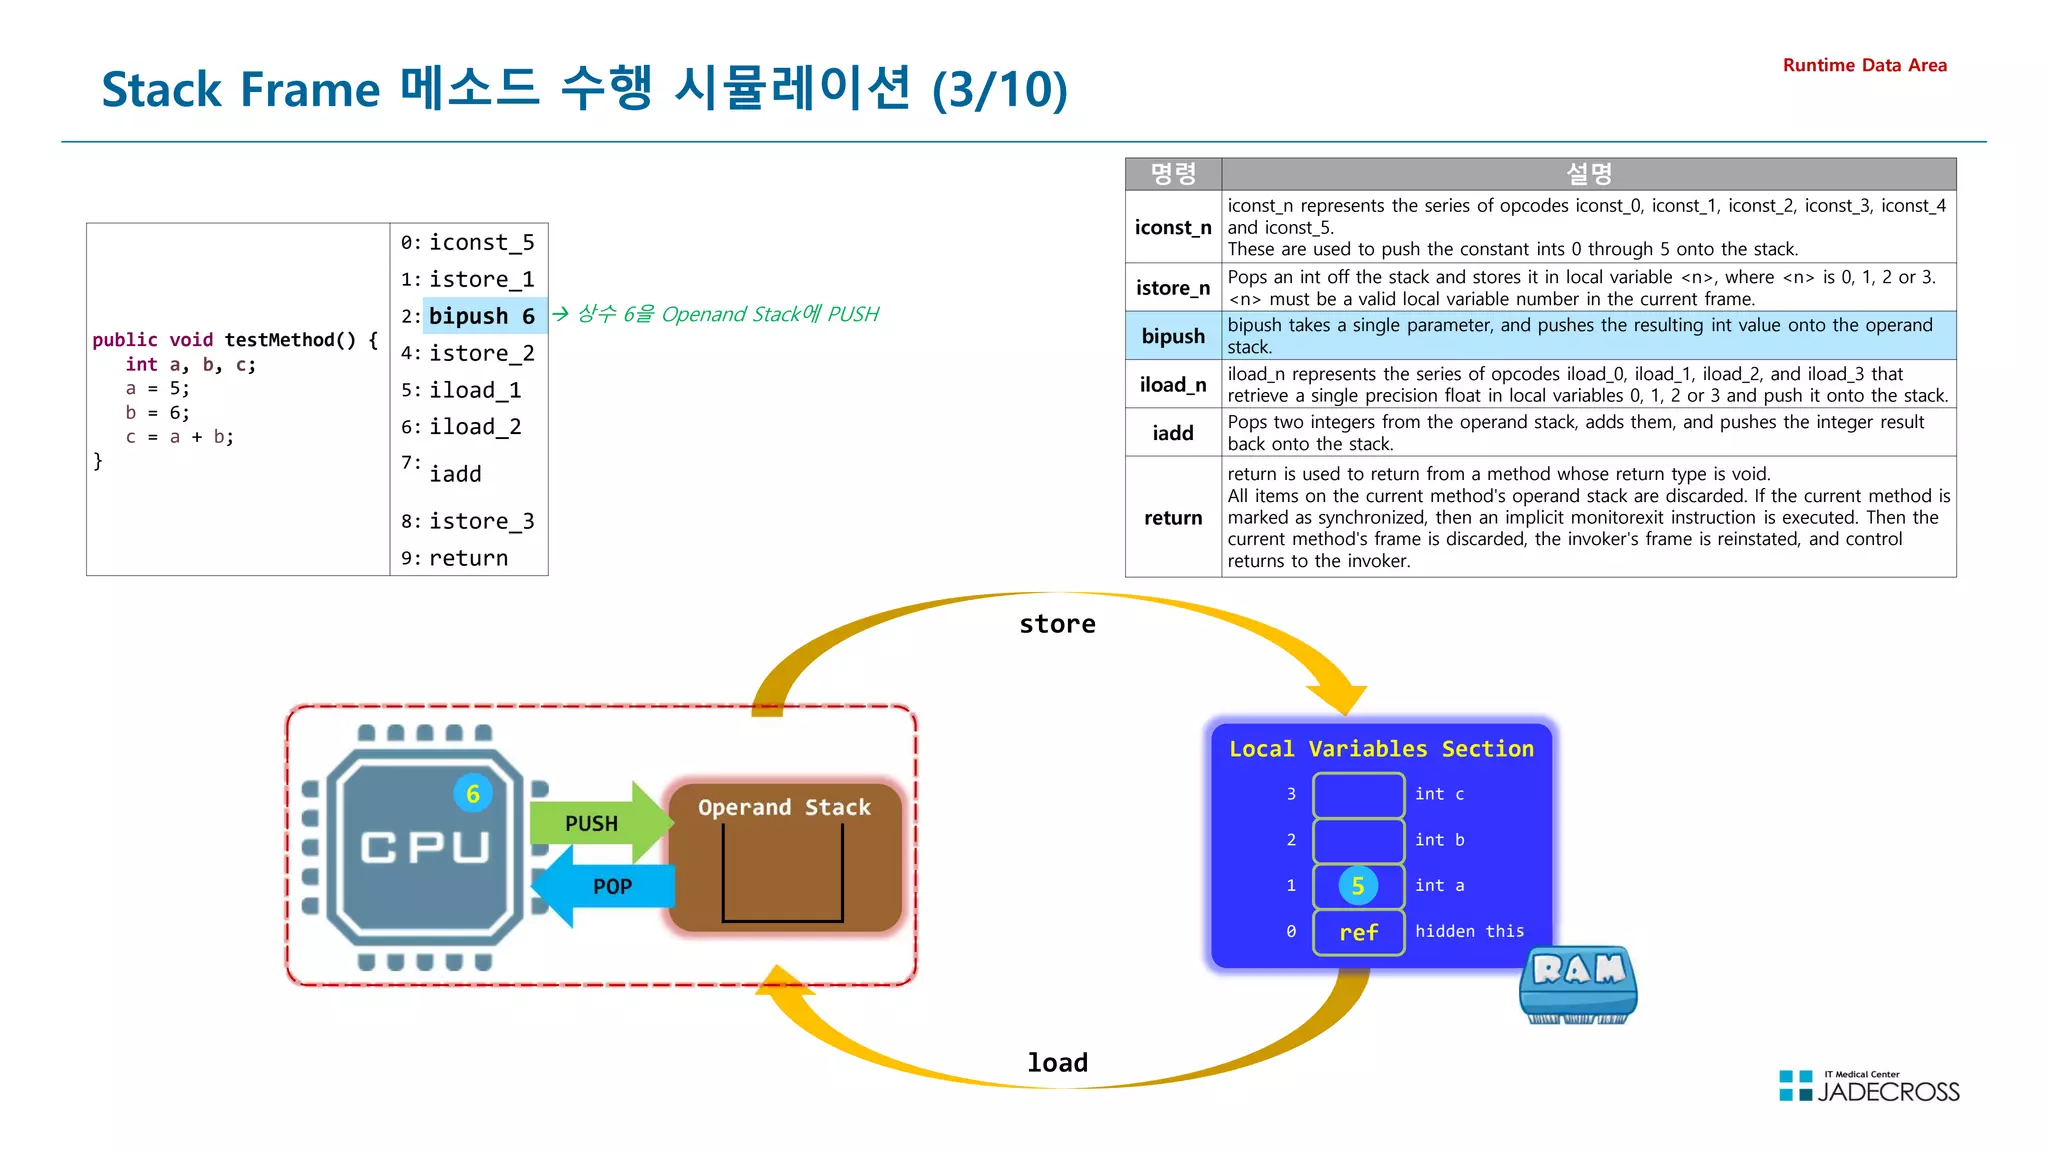
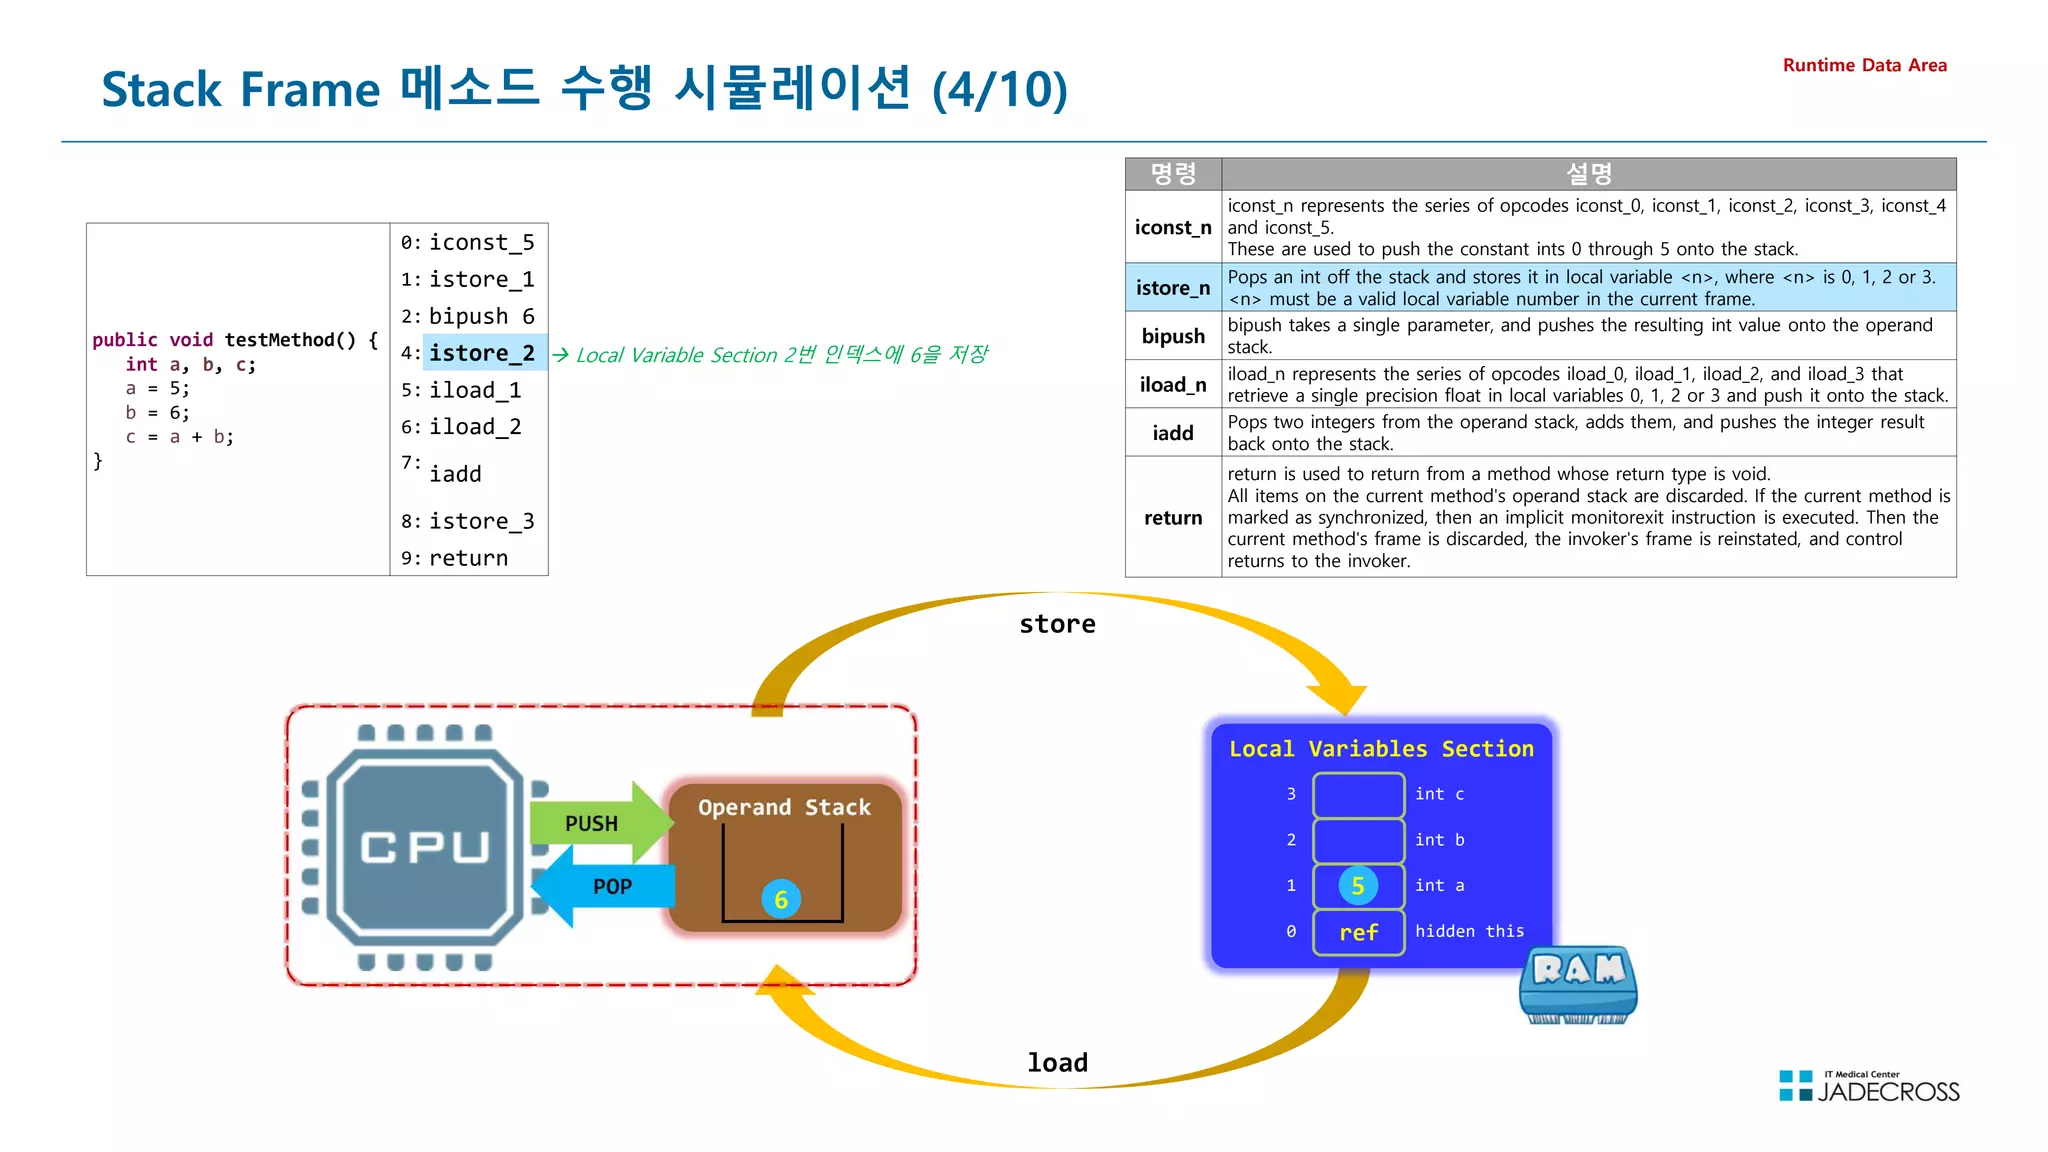
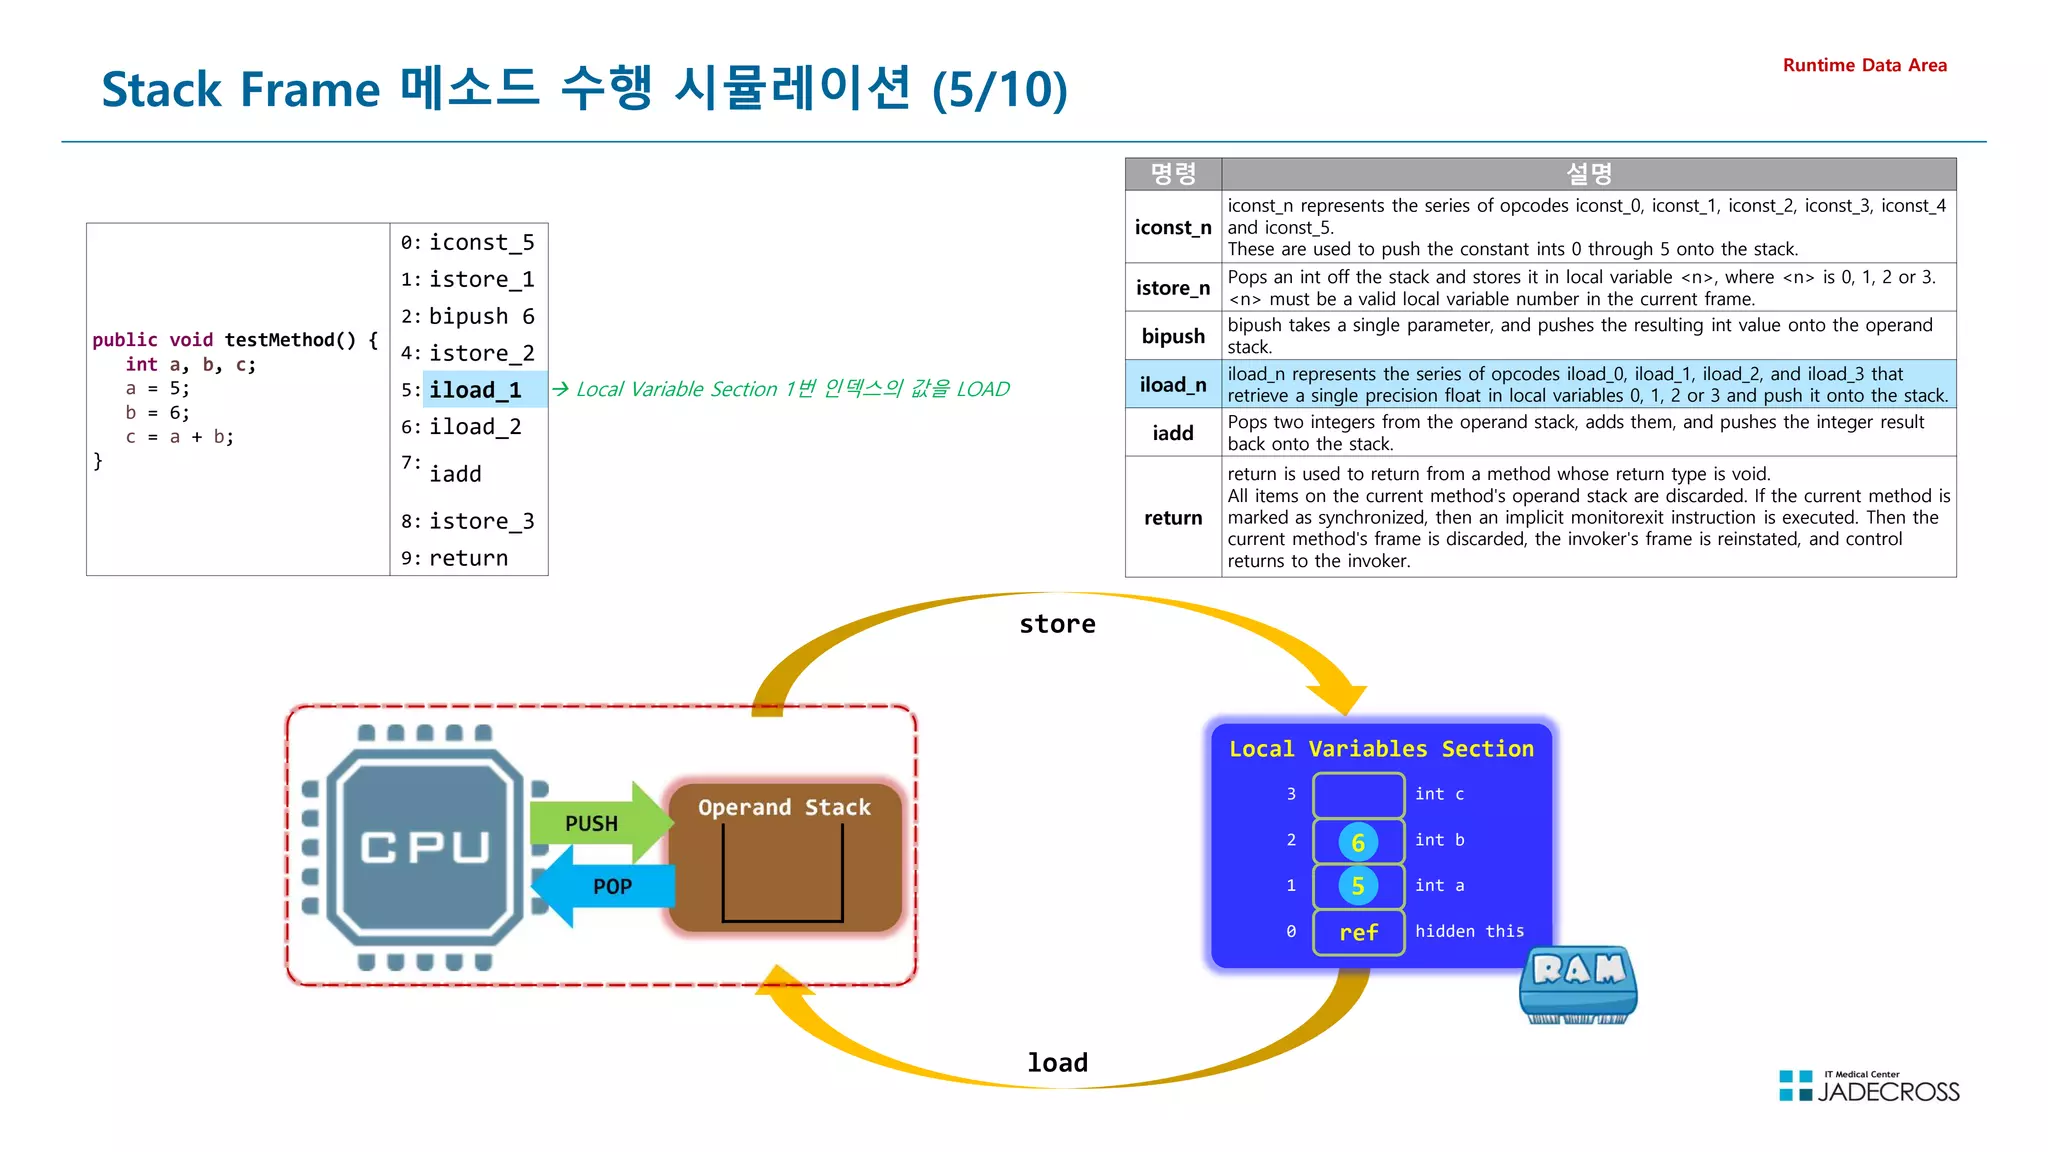
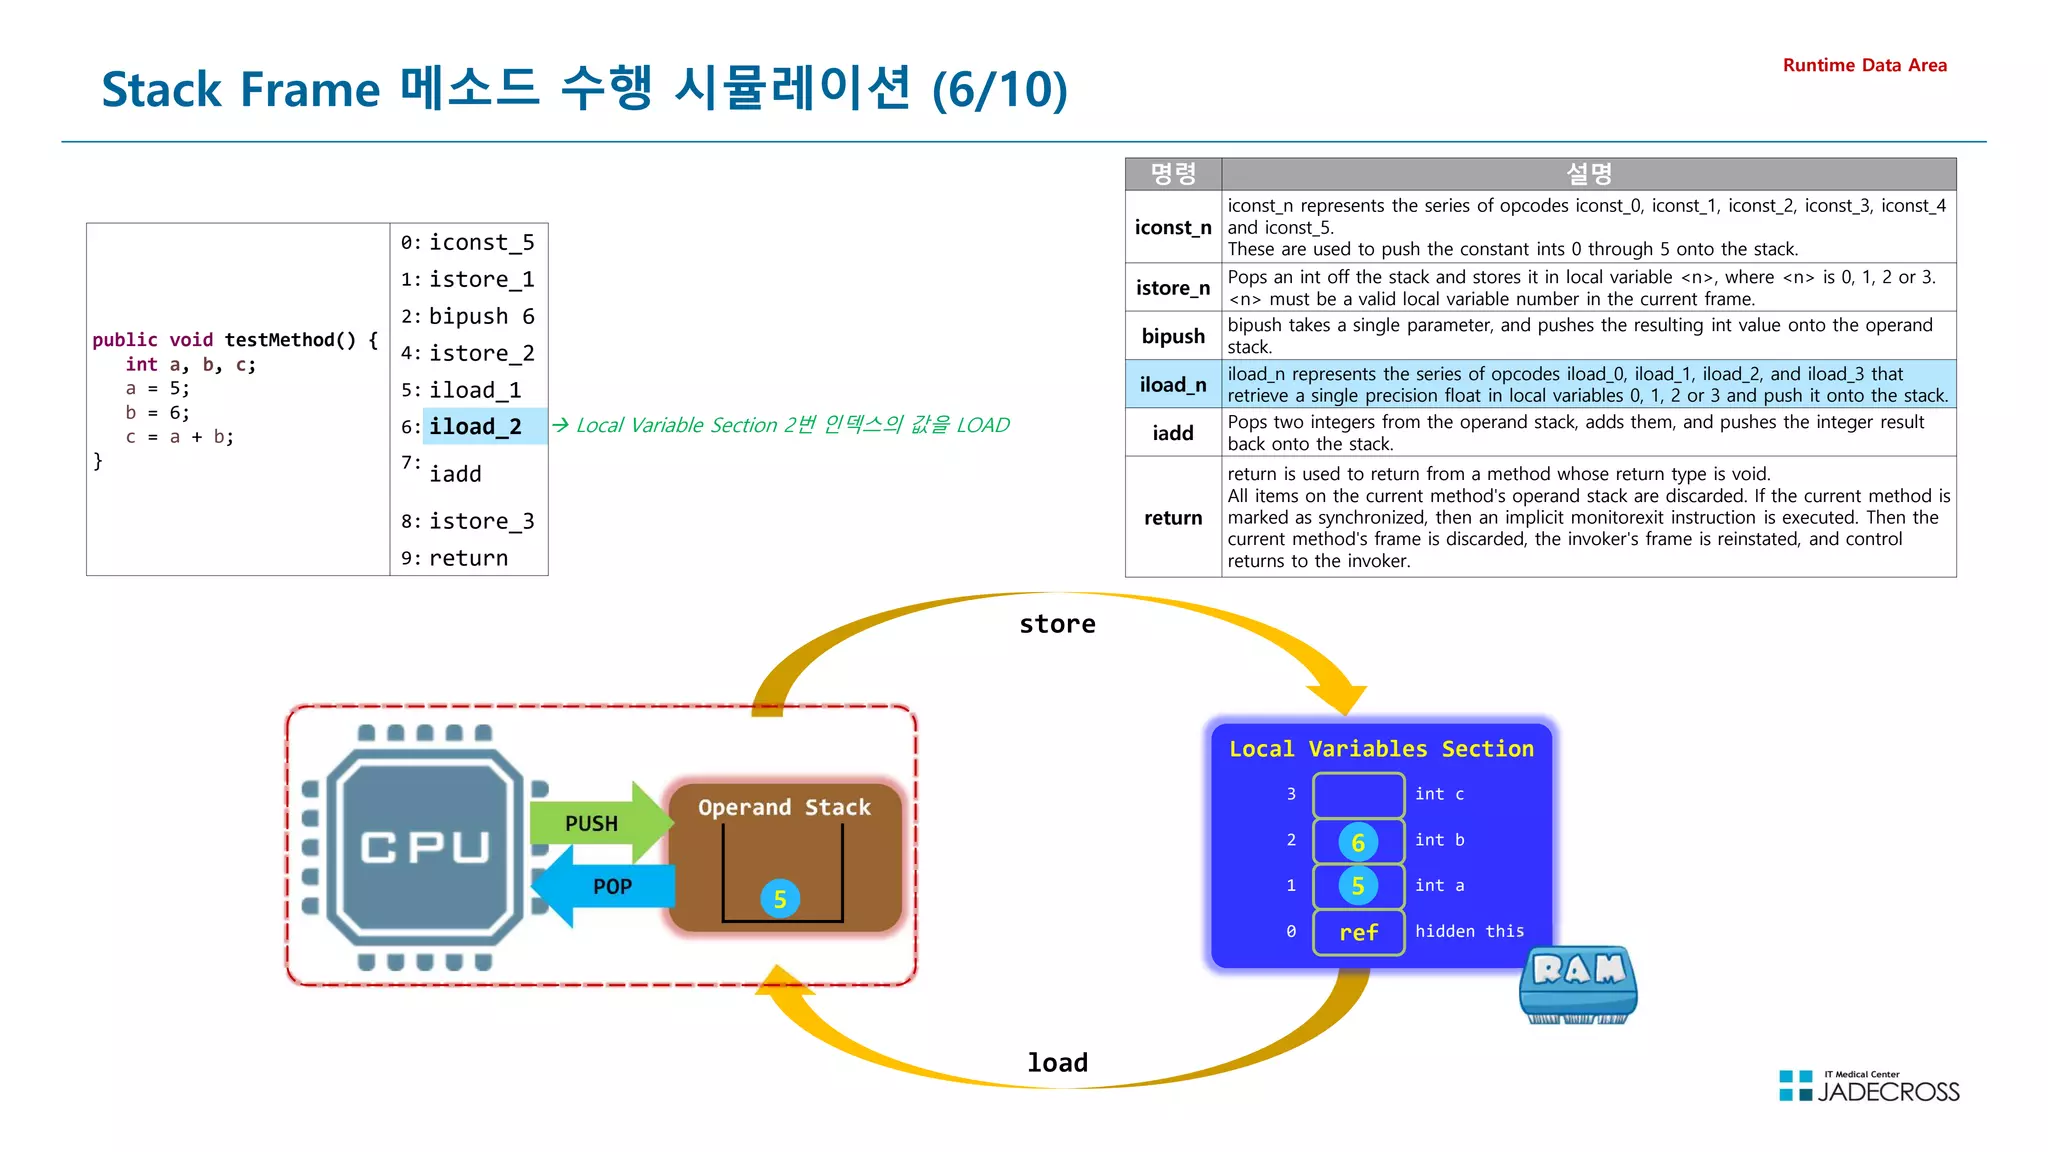
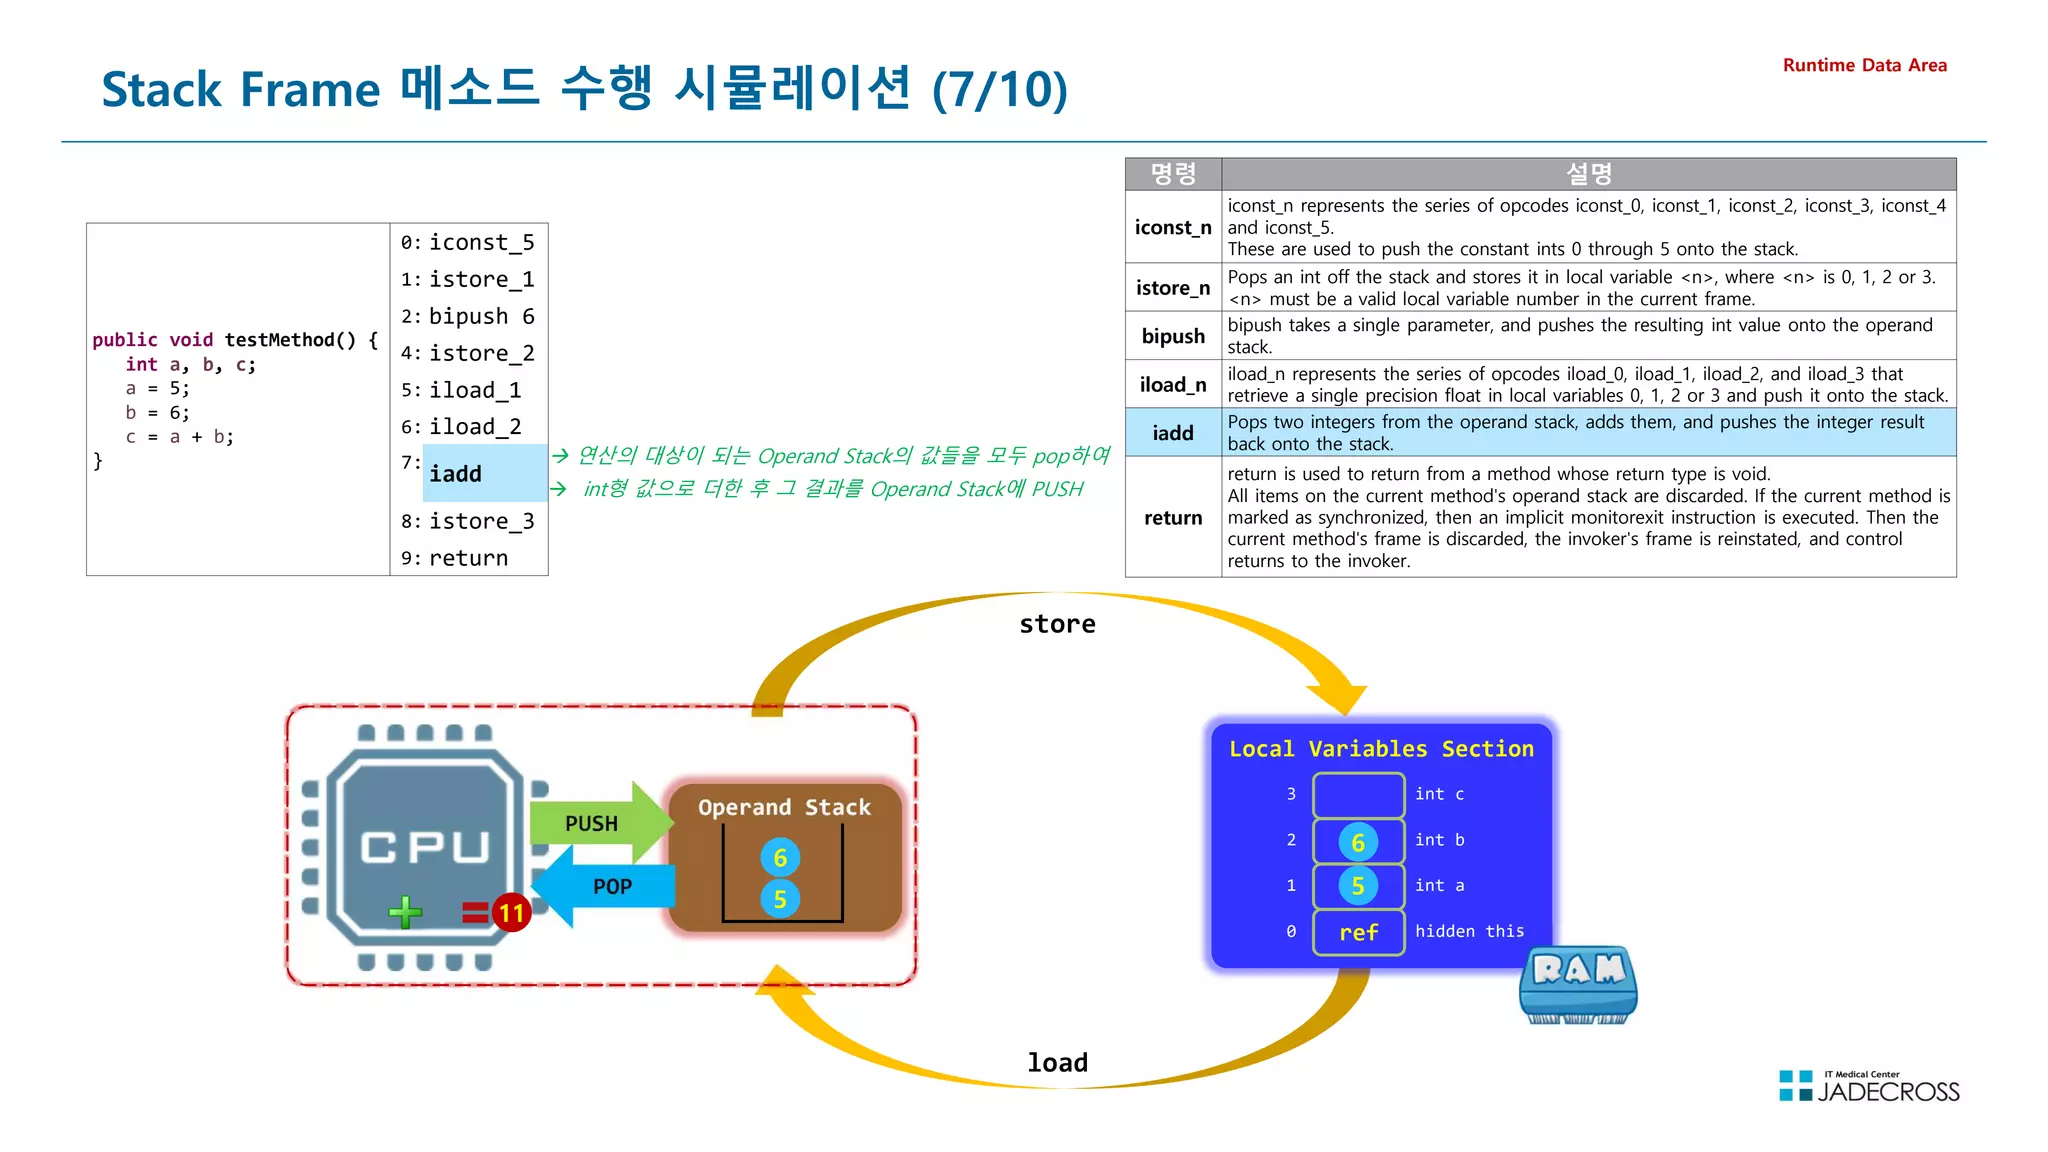
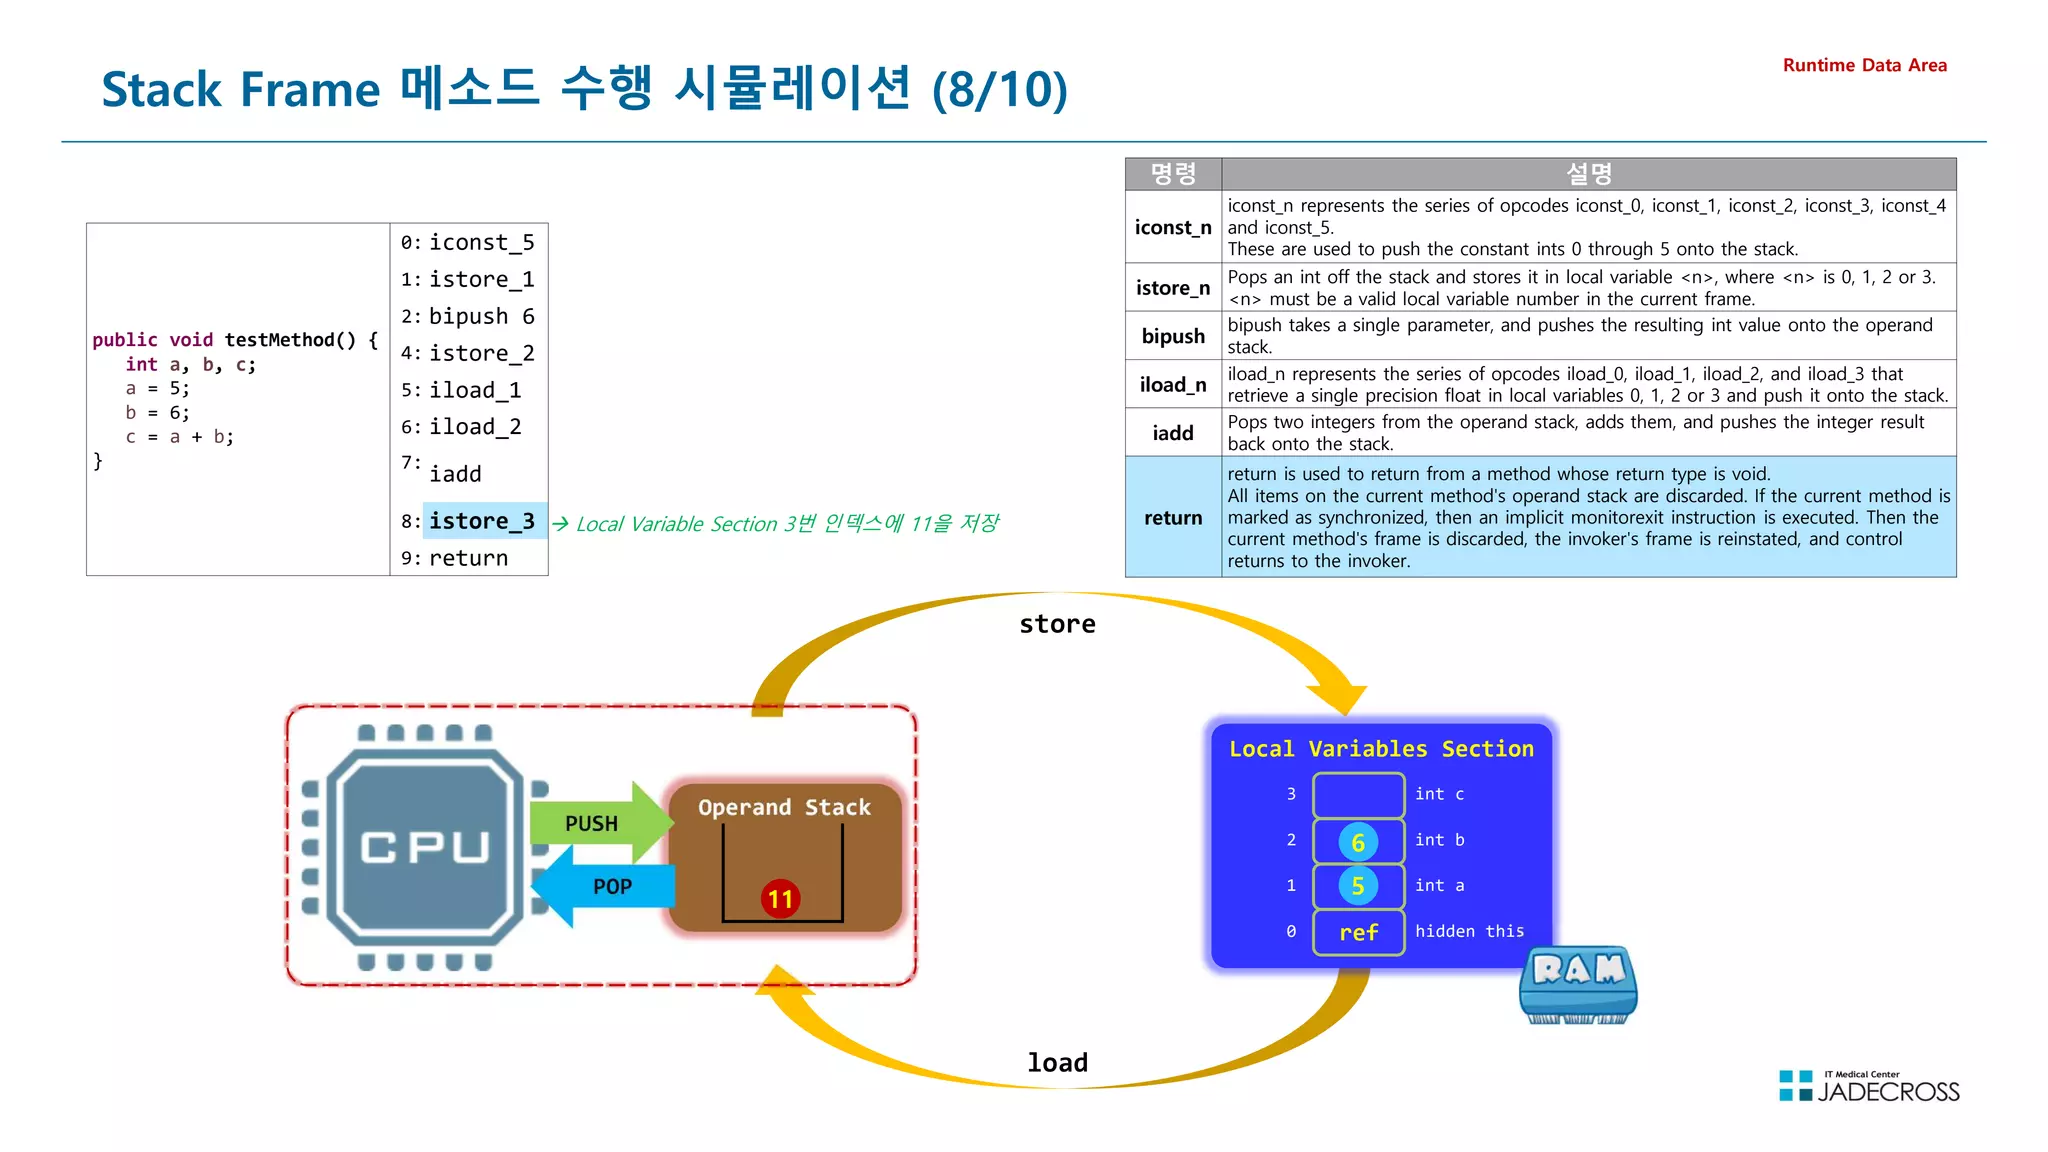

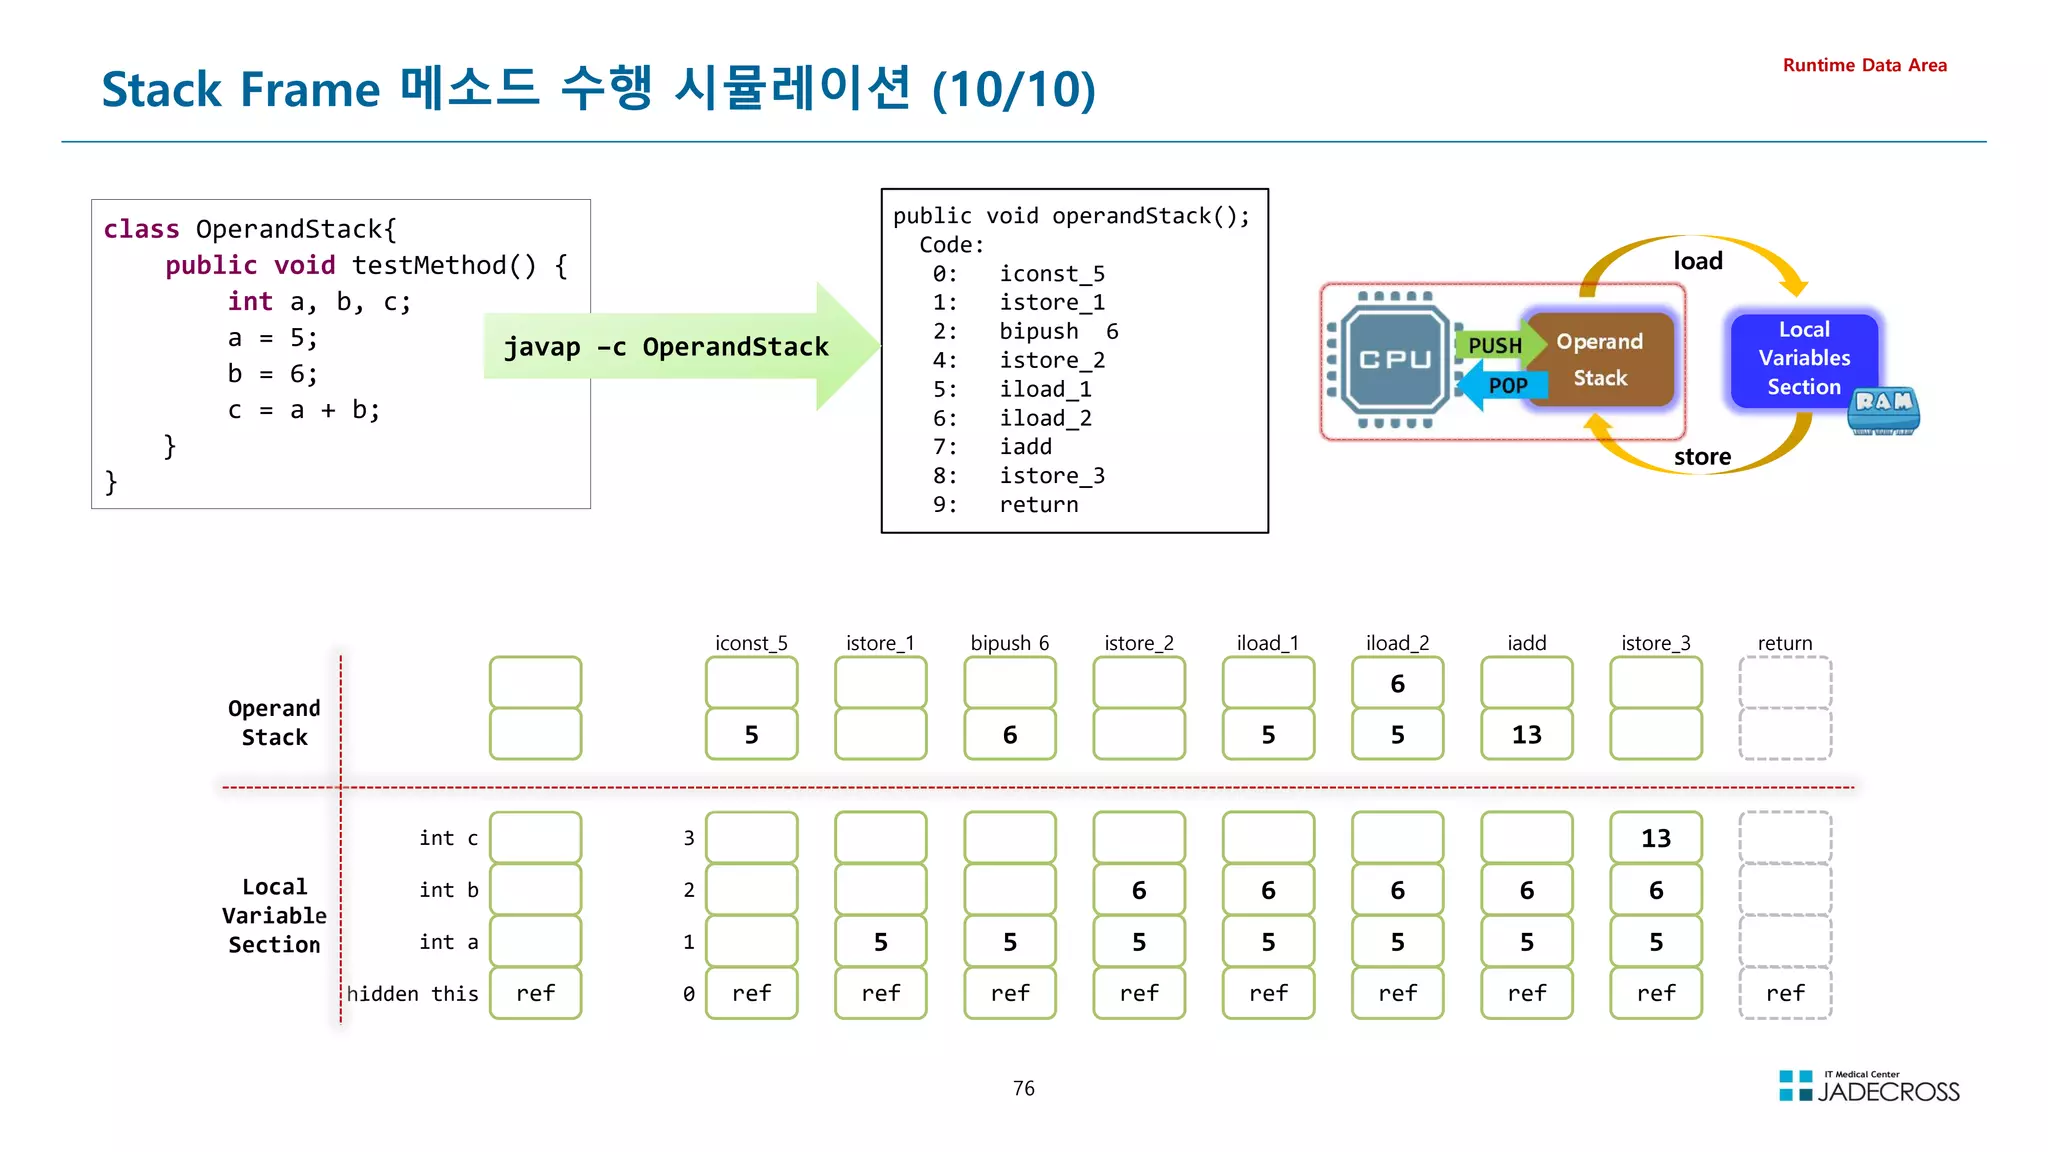
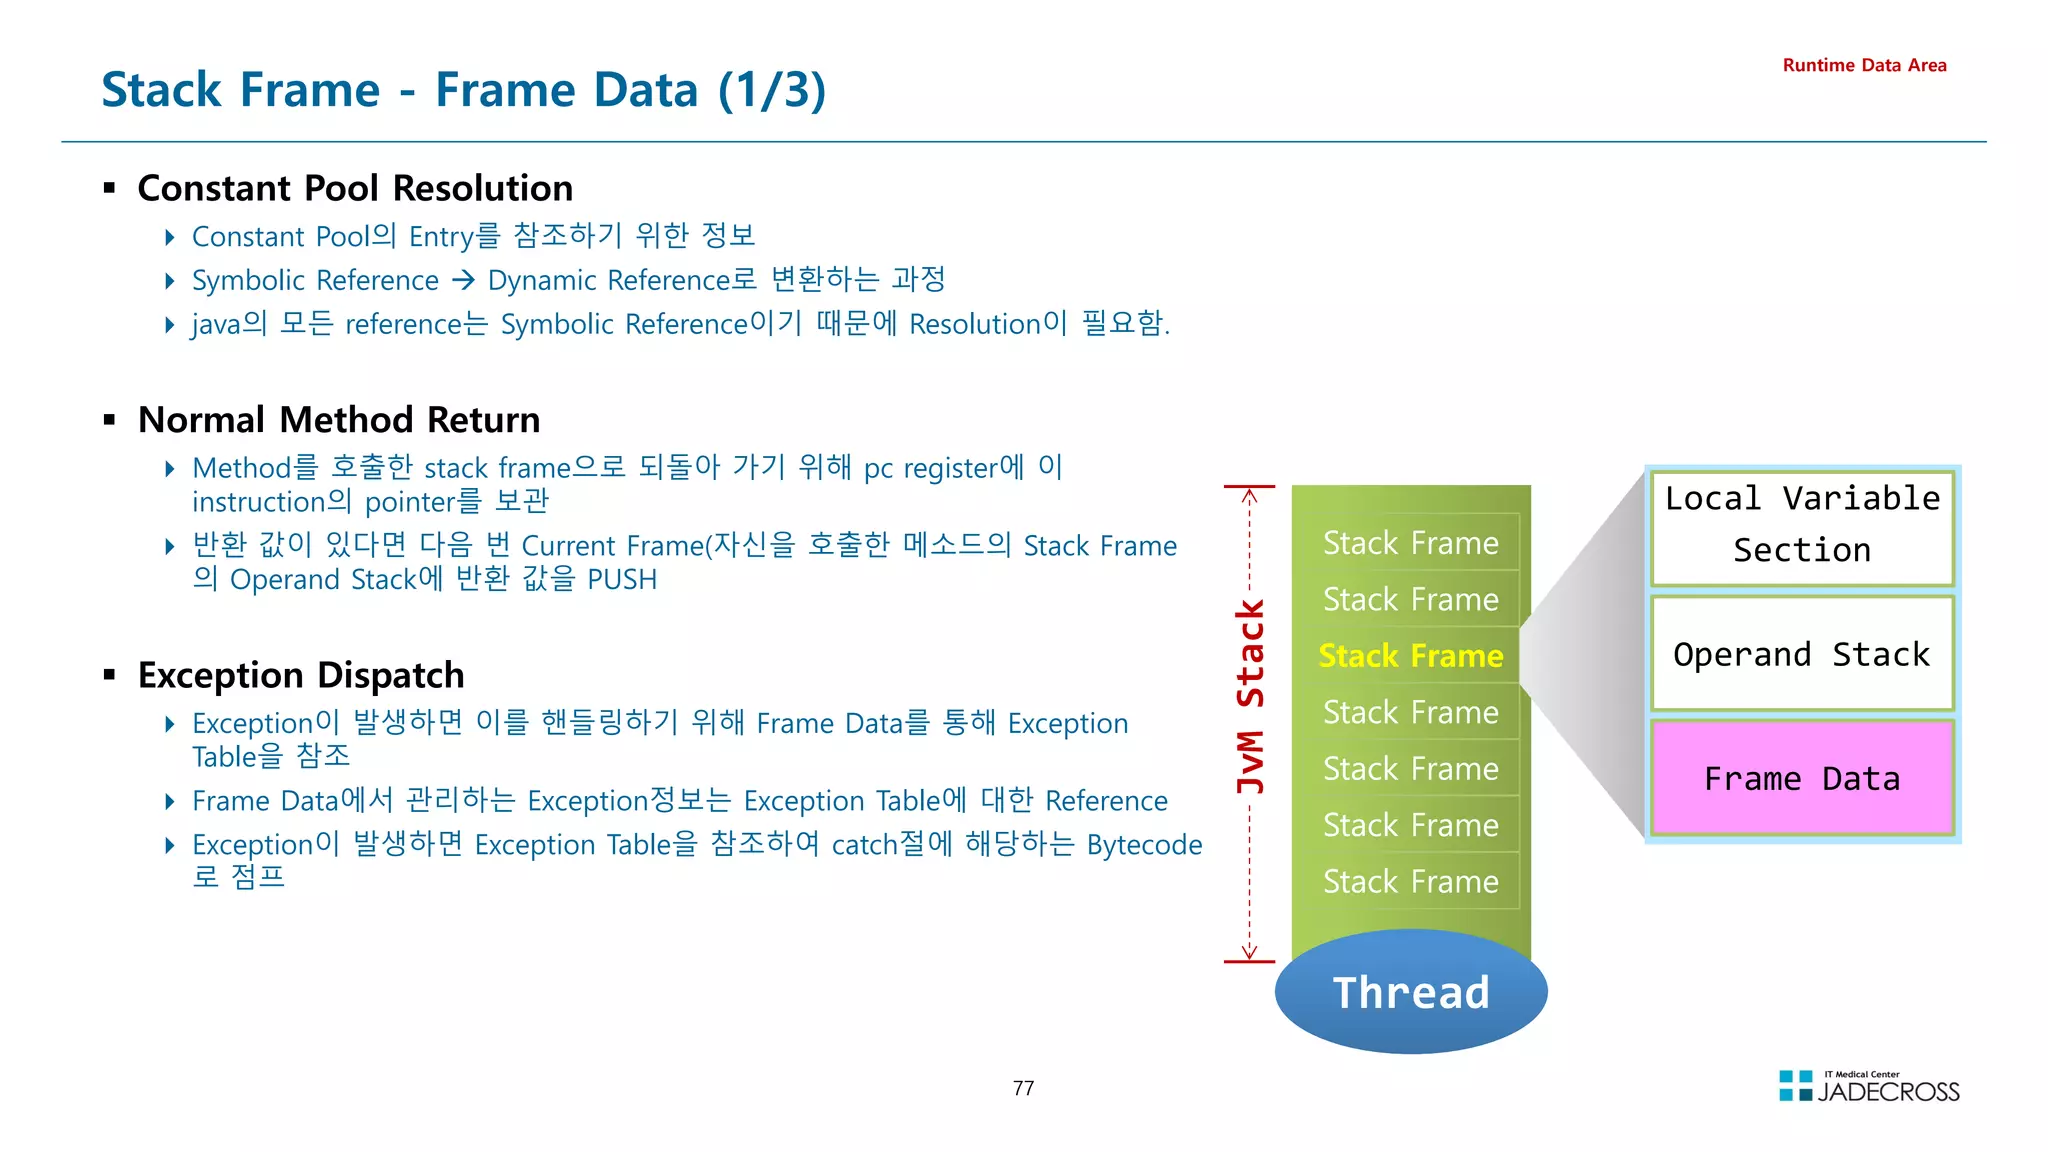
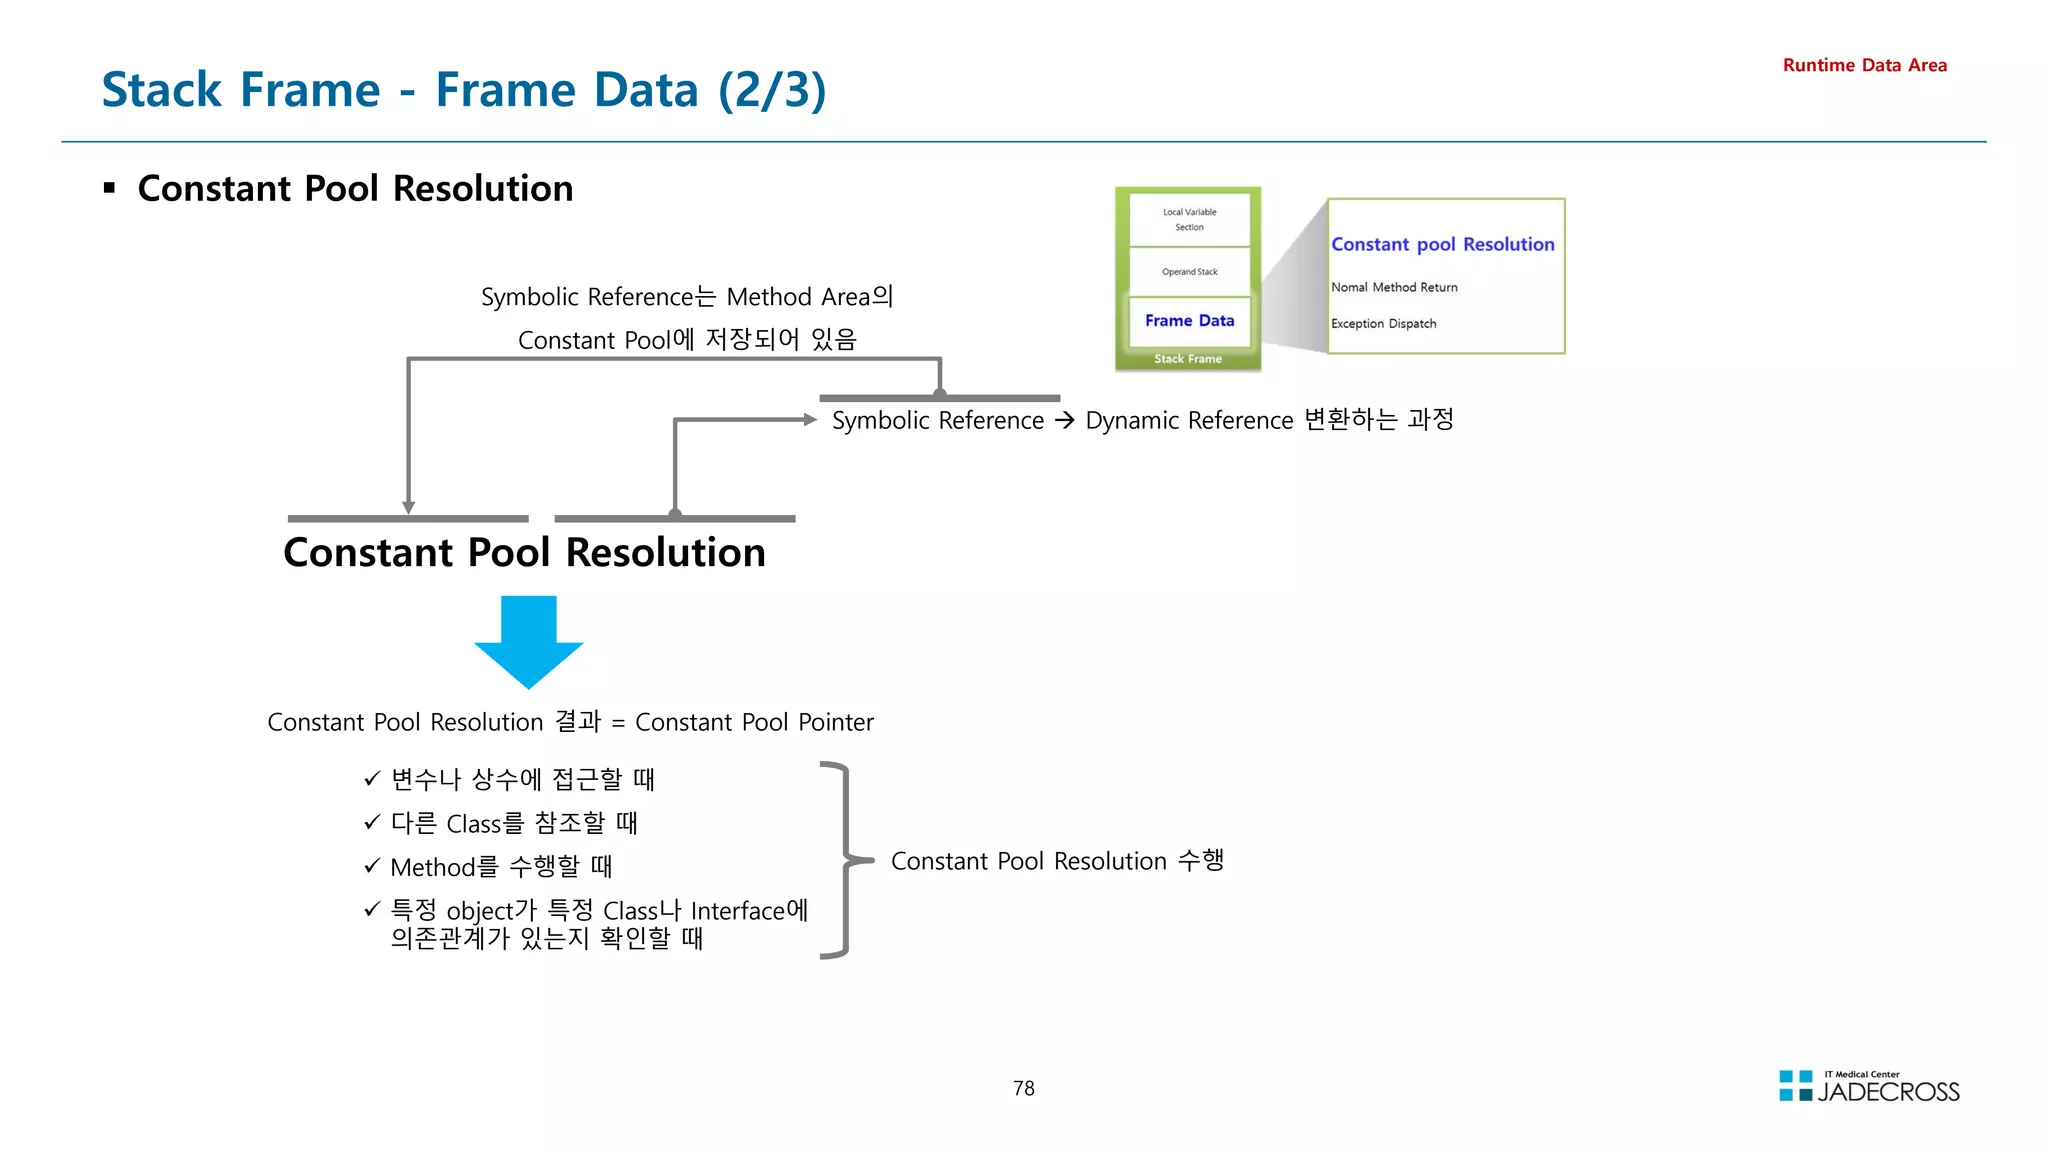
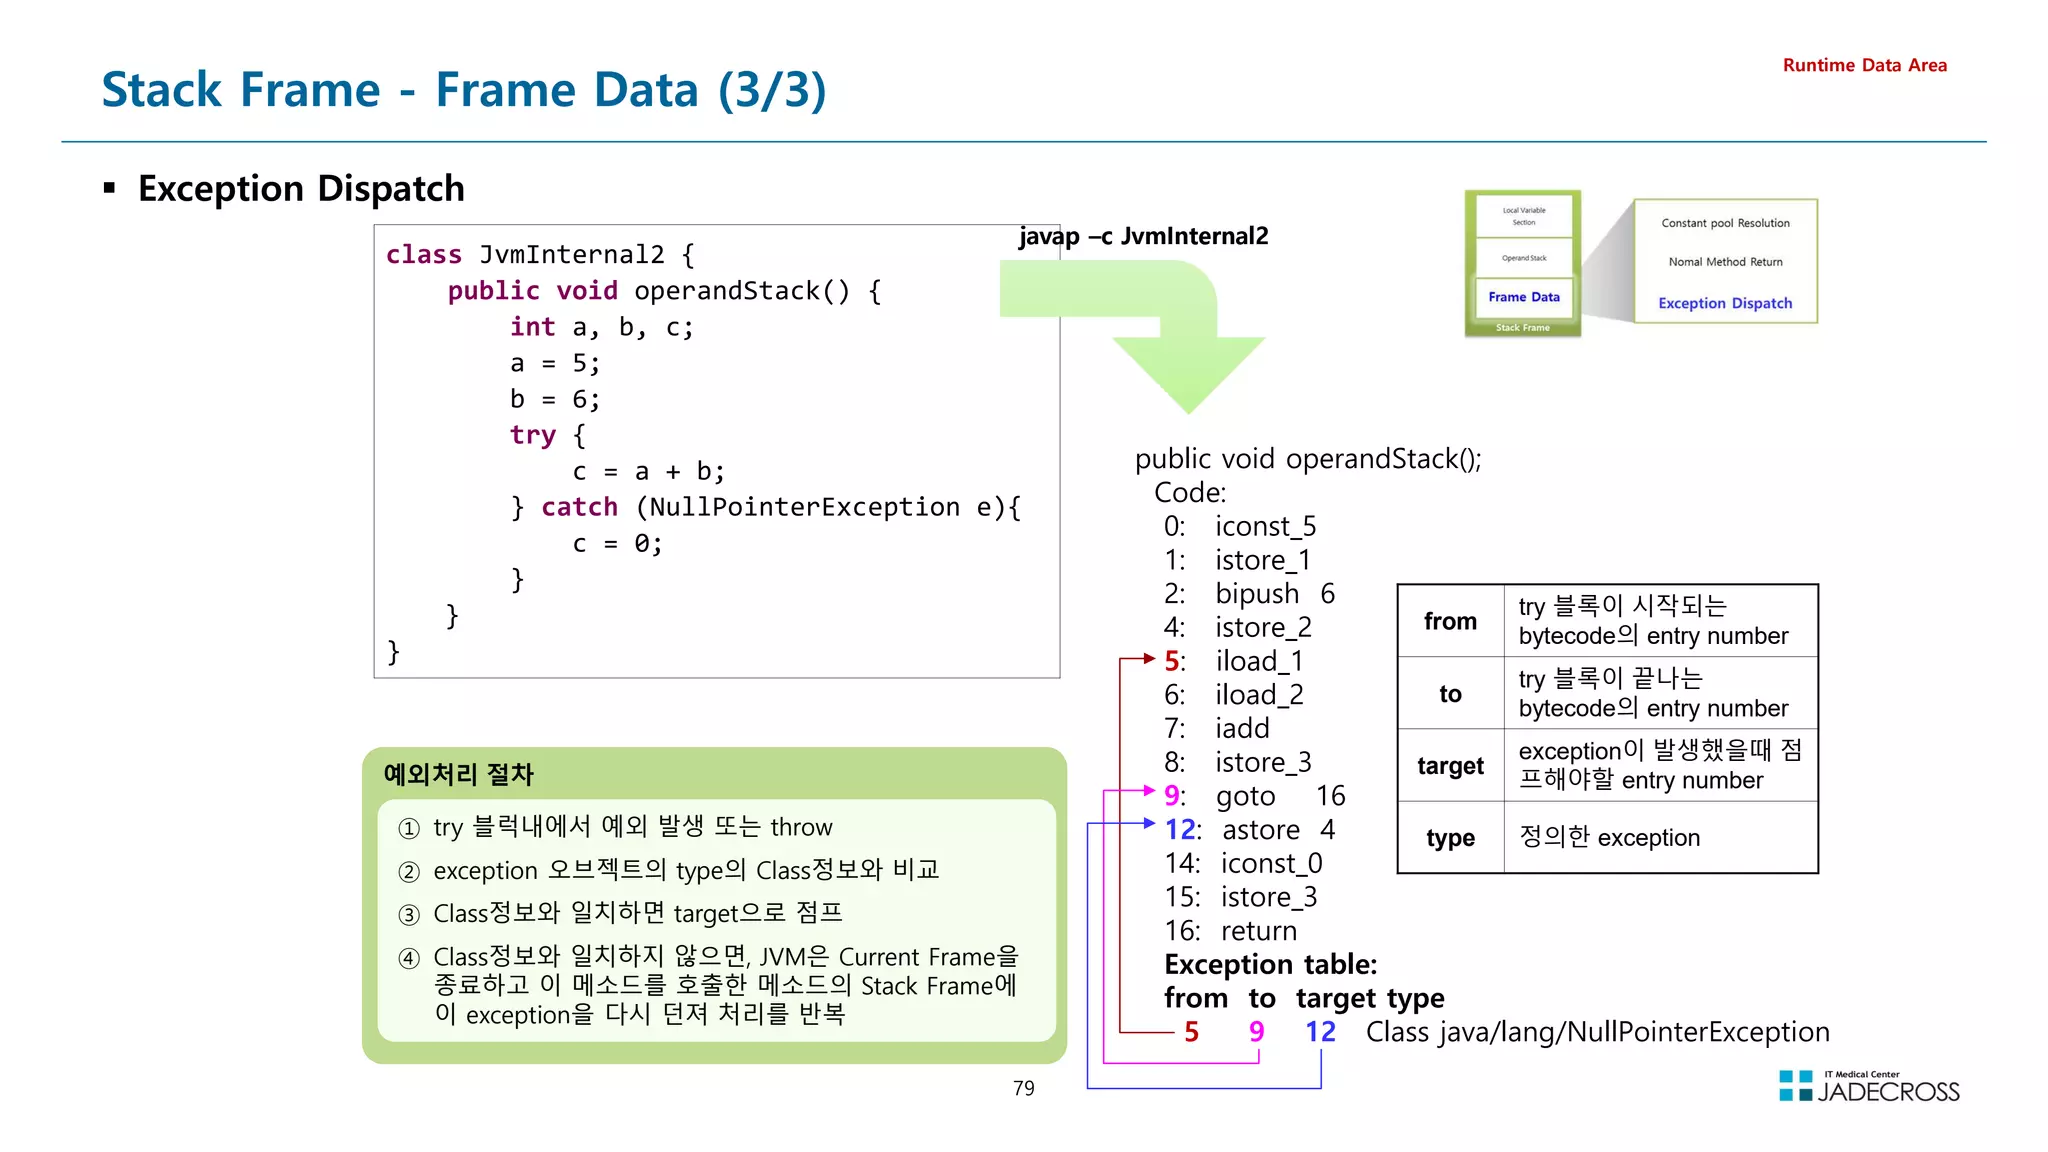
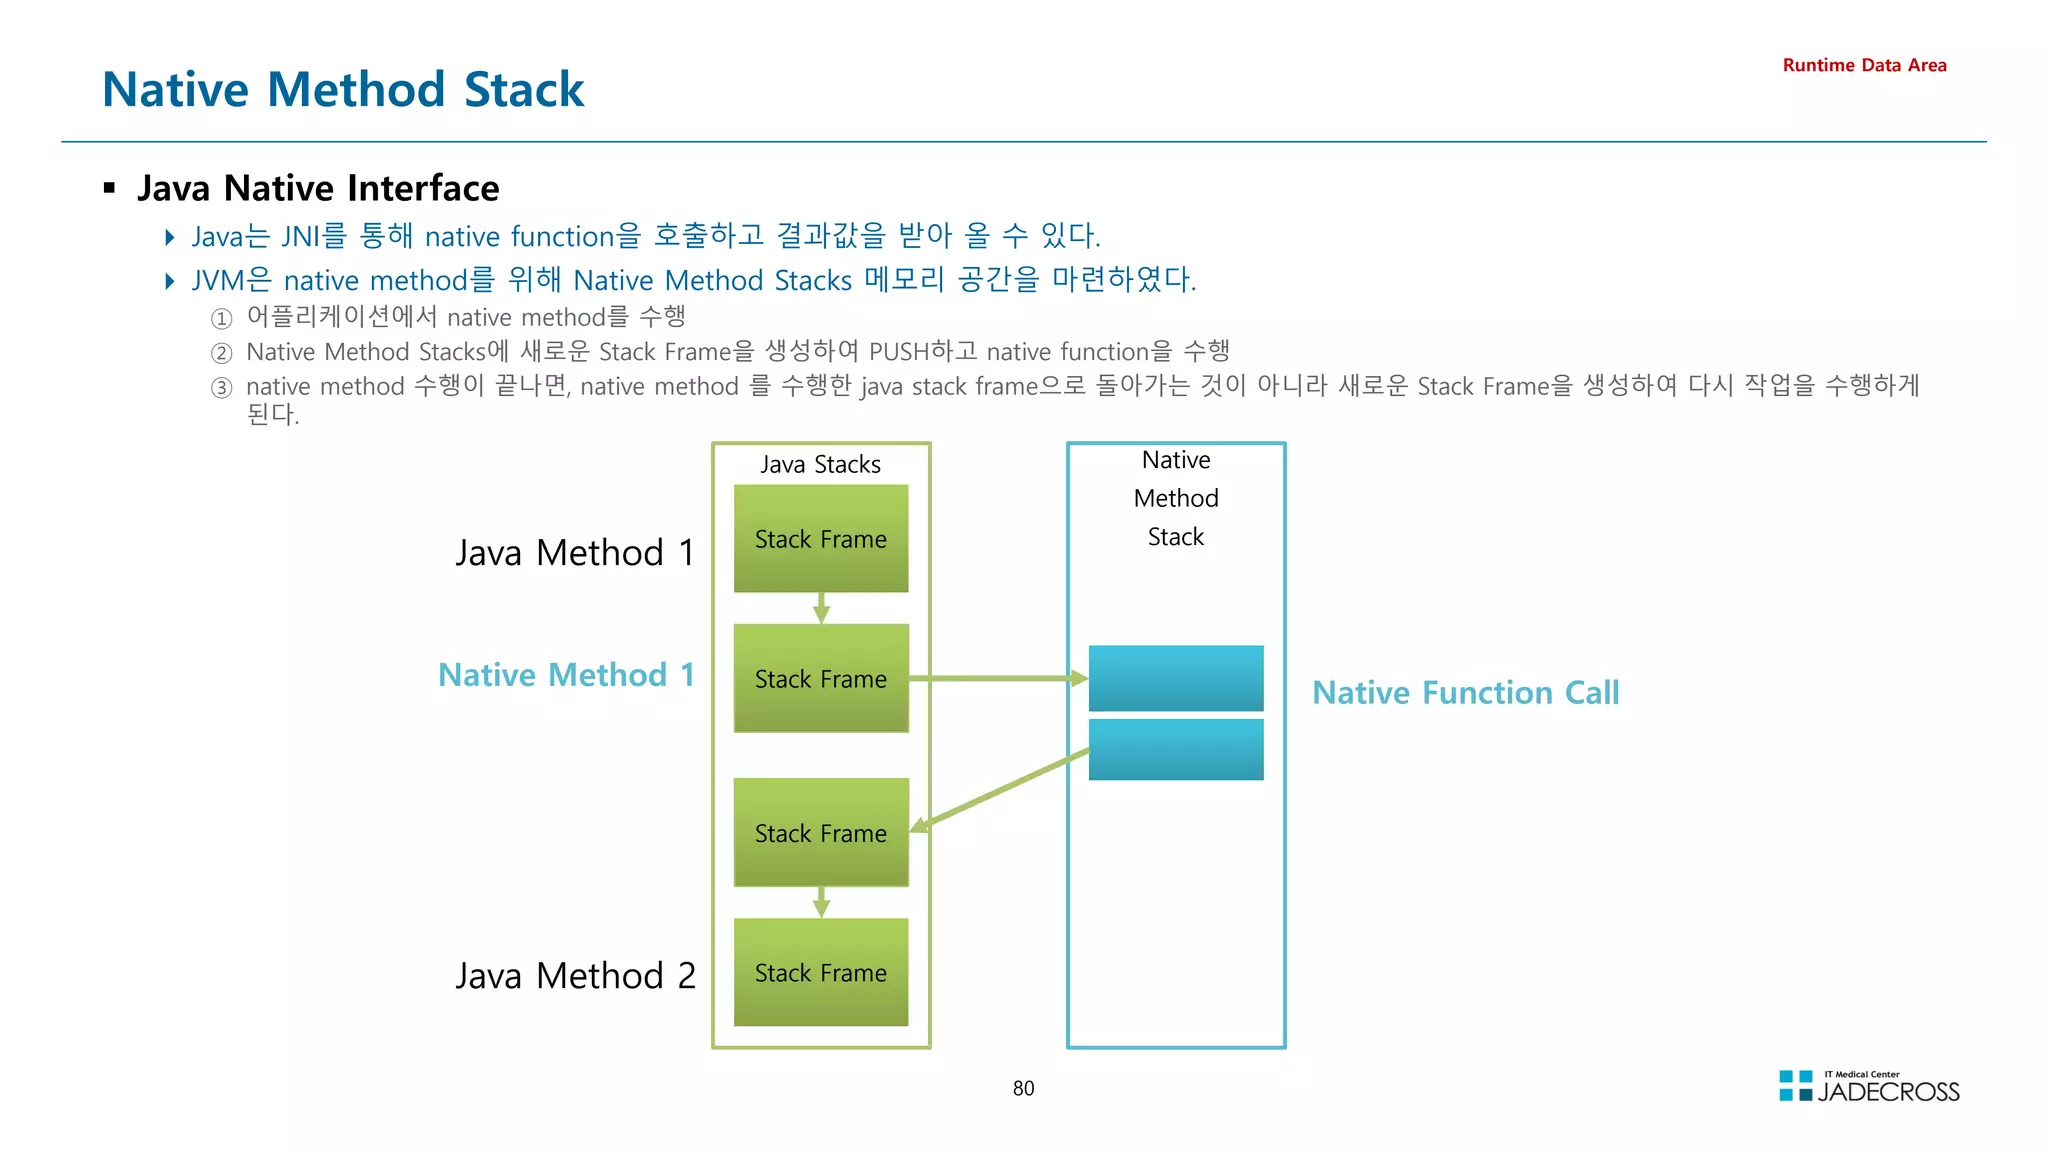
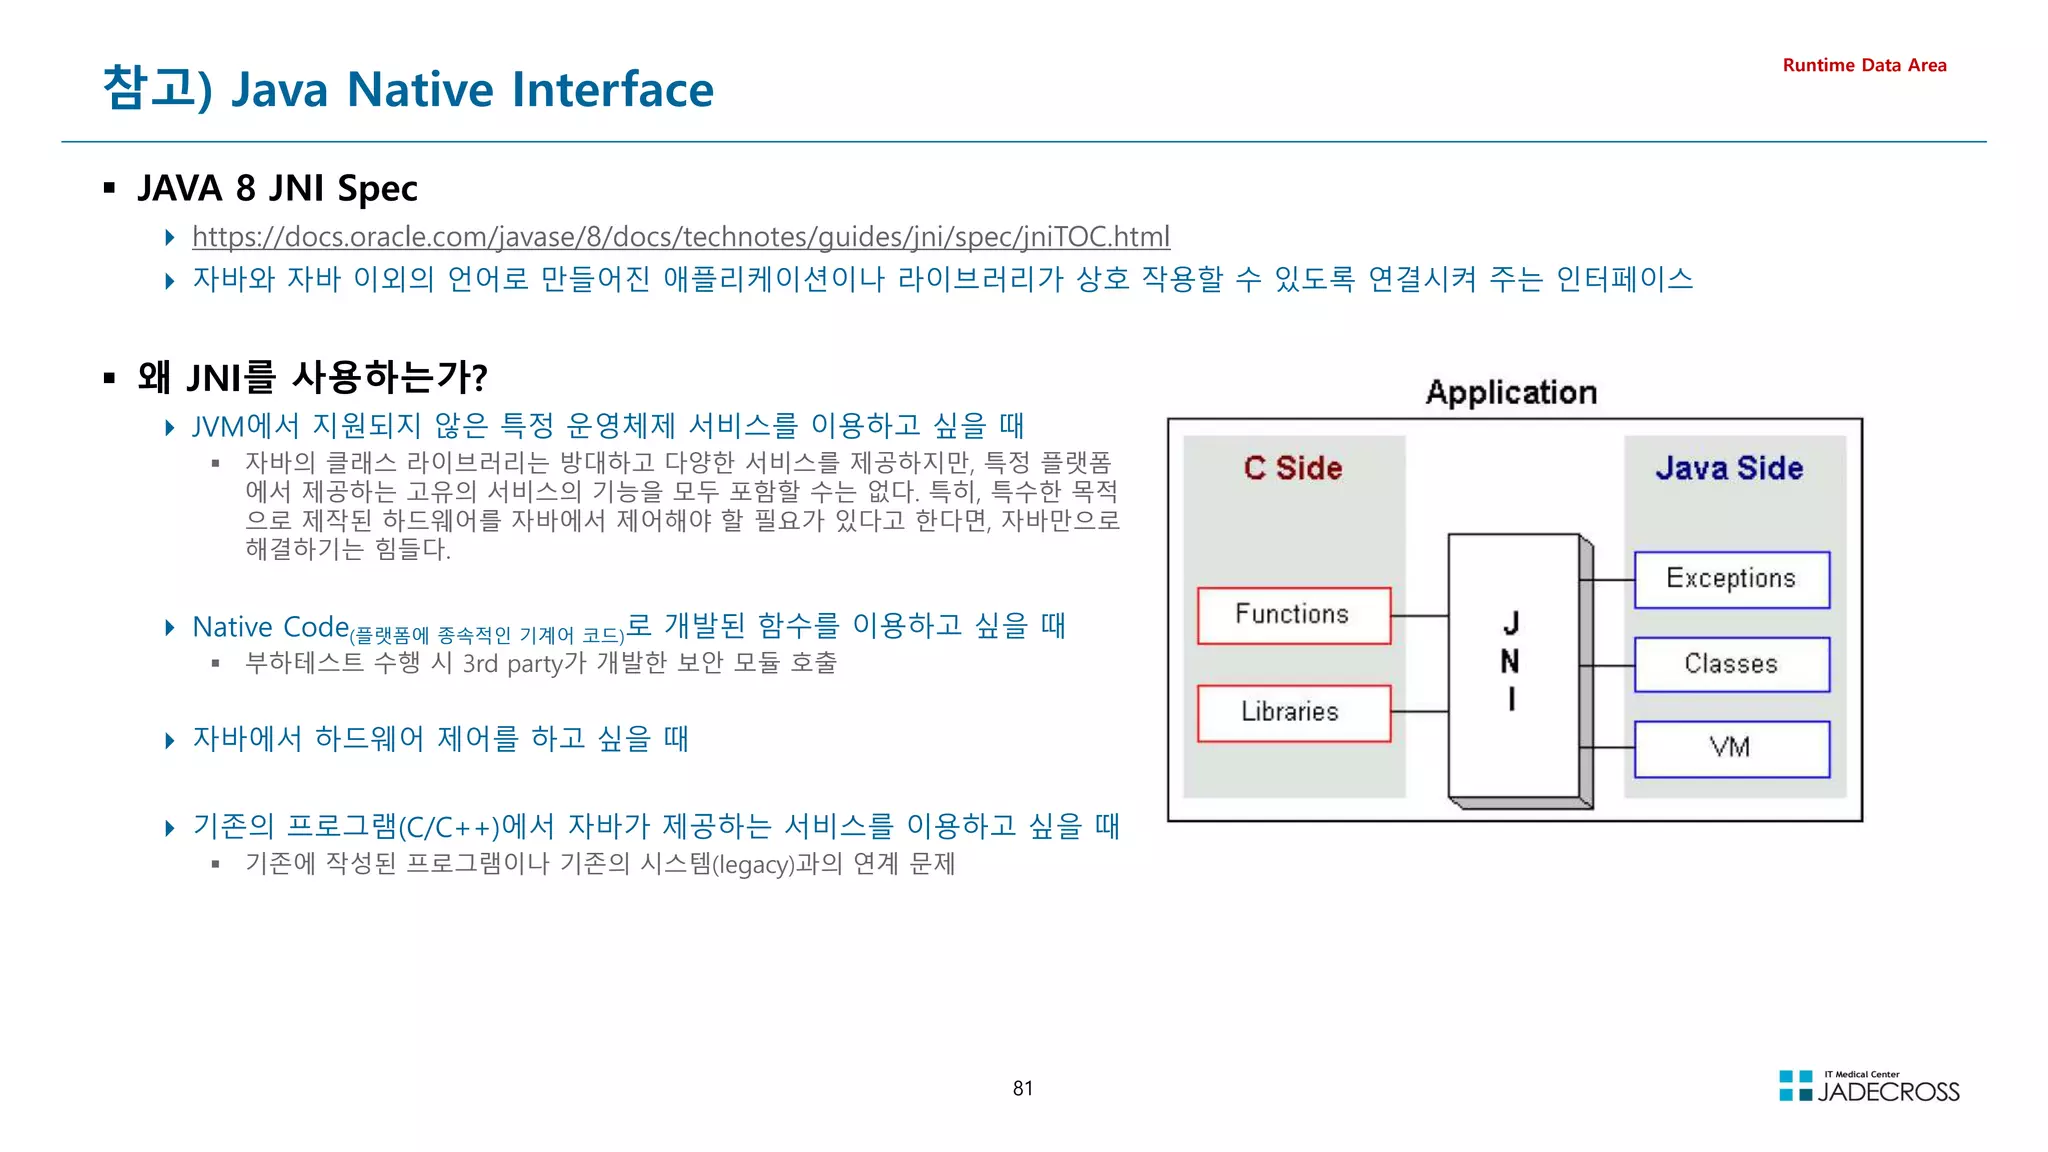
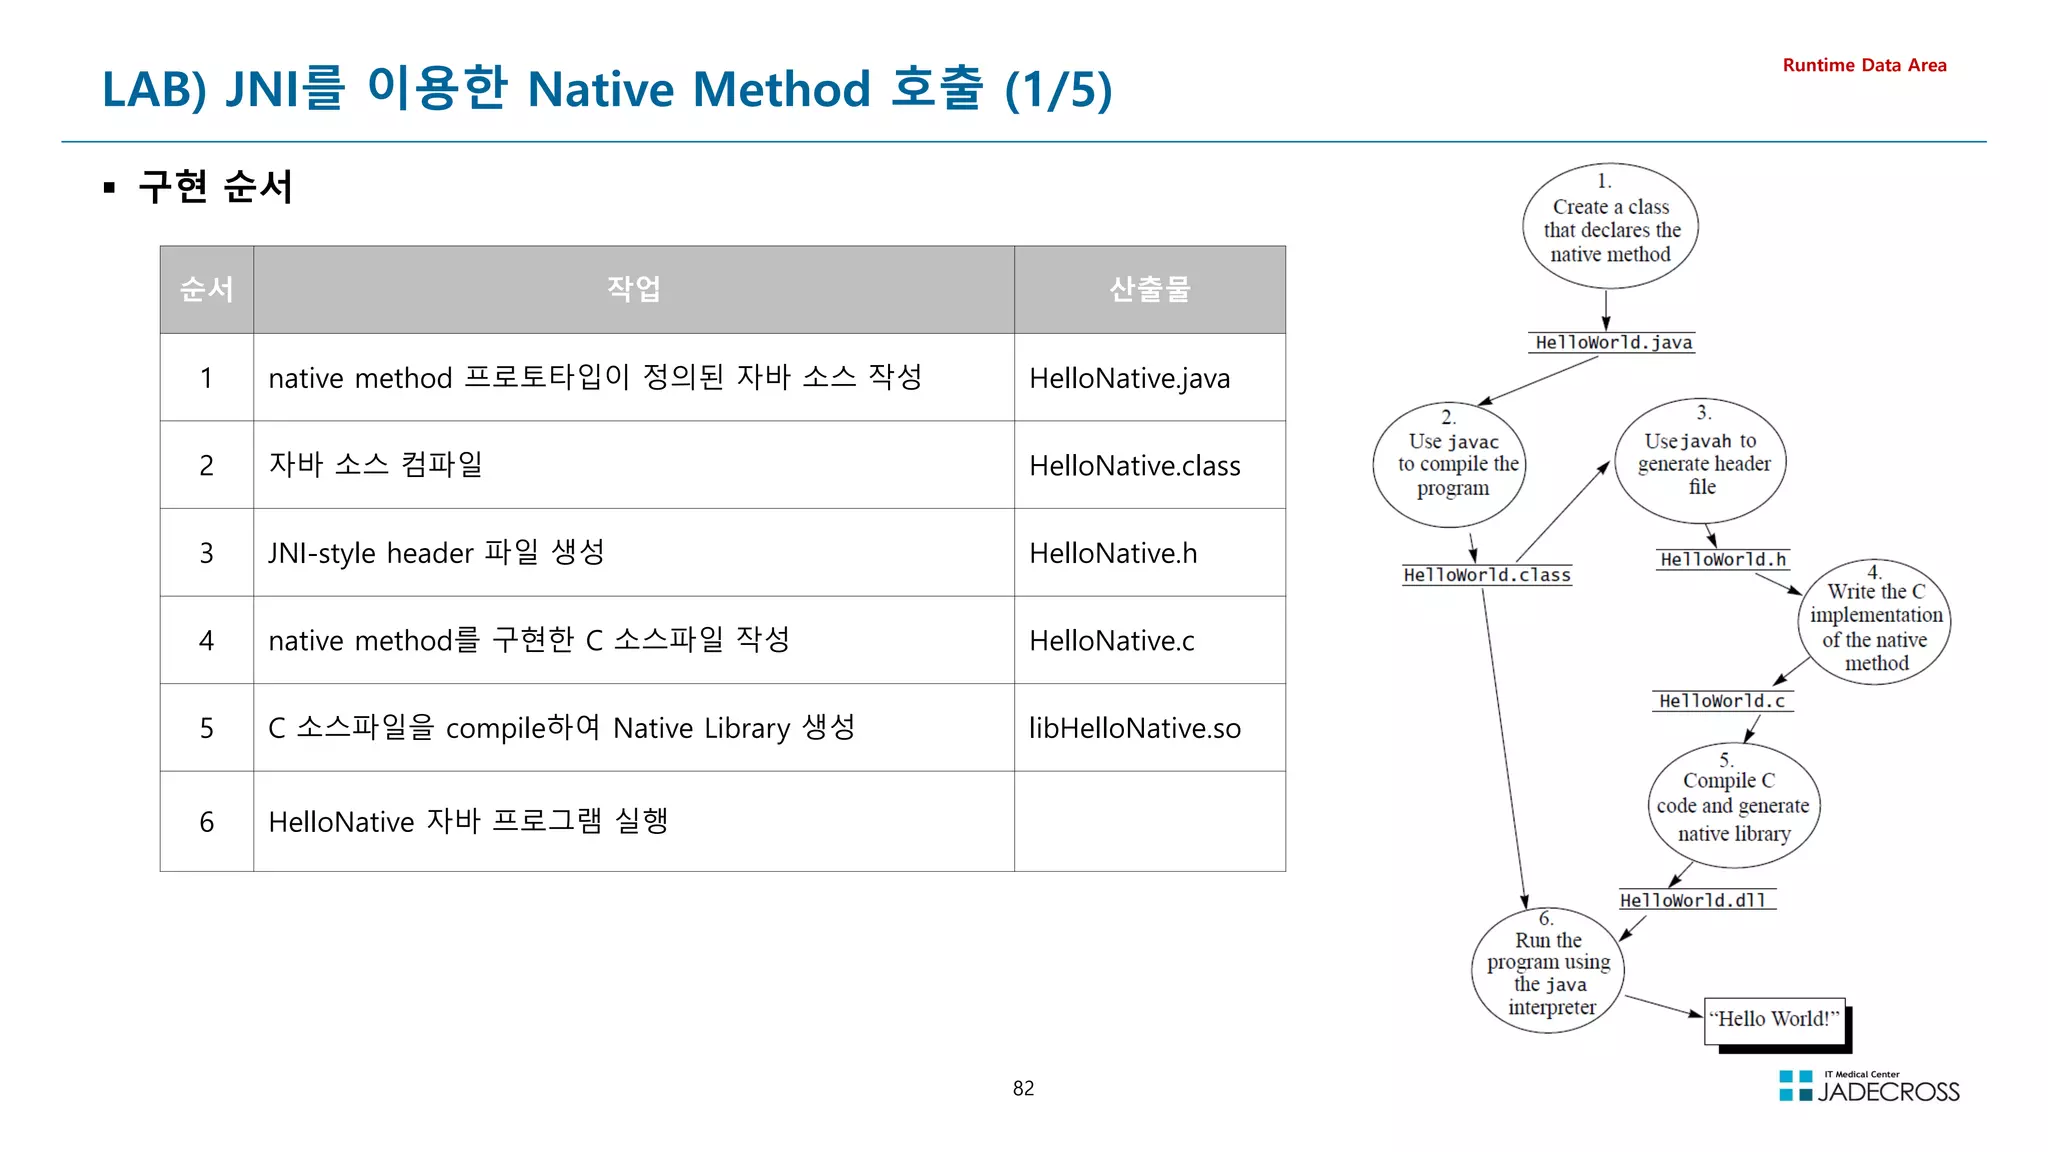
![83
LAB) JNI를 이용한 Native Method 호출 (2/5)
① native method 프로토타입이 정의된 자바 소스 작성
Runtime Data Area
native method 프로토타입이 정의된 자바 소스 작성
[root@jvmedu ~]# cd ~/lab/jni/ex01
[root@jvmedu ex01]# cat HelloNative.java
public class HelloNative {
private native void nativeMethod(int sleepSec); 함수 원형 정의
static {
System.loadLibrary(HelloNative);
}
nativeMethod() 가 구현된 라이브러리 로드
private void javaMethod(int sleepSec) {
System.out.println(javaMethod Called....);
this.nativeMethod(sleepSec);
}
네이티브 메소드 호출
public static void main(String[] args) throws Exception {
int sleepSec = Integer.parseInt(args[0]);
new HelloNative().javaMethod(sleepSec);
}
}
자바 메소드 호출
② 자바 소스 컴파일
HelloNative.java 파일을 컴파일하여 HelloNative.class 파일 생성
[root@jvmedu ex01]# javac HelloNative.java
[root@jvmedu ex01]# ls -l HelloNative.class
-rw-r--r-- 1 root root 781 Oct 20 23:21 HelloNative.class](https://image.slidesharecdn.com/jvm-230511085906-be6f1201/75/JVM_-pdf-83-2048.jpg)
![84
LAB) JNI를 이용한 Native Method 호출 (3/5)
③ JNI-style header 파일 생성
Runtime Data Area
javah 명령으로 이용하여 HelloNative.class에 정의된 native method에 대해 JNI-style의 헤더 파일 생성
[root@jvmedu ex01]# javah HelloNative
생성된 헤더 파일의 내용 확인
[root@jvmedu ex01]# cat HelloNative.h
/* DO NOT EDIT THIS FILE - it is machine generated */
#include jni.h
/* Header for class HelloNative */
#ifndef _Included_HelloNative
#define _Included_HelloNative
#ifdef __cplusplus
extern C {
#endif
/*
* Class: HelloNative
* Method: nativeMethod
* Signature: (I)V
*/
JNIEXPORT void JNICALL Java_HelloNative_nativeMethod
(JNIEnv *, jobject, jint);
nativeMethod() 함수 원형
#ifdef __cplusplus
}
#endif
#endif](https://image.slidesharecdn.com/jvm-230511085906-be6f1201/75/JVM_-pdf-84-2048.jpg)
![85
LAB) JNI를 이용한 Native Method 호출 (4/5)
④ native method를 구현한 C 소스파일 작성
Runtime Data Area
native method를 구현한 C 소스파일 작성
[root@jvmedu ex01]# vi HelloNative.c
HelloNative.c
#include jni.h
#include stdio.h
#include HelloNative.h
JNIEXPORT void JNICALL Java_HelloNative_nativeMethod(JNIEnv *env, jobject obj, jint sleepSec) {
printf(NativeMethod Called.....!n);
sleep(sleepSec);
return;
}
⑤ C 소스파일을 compile하여 Native Library 생성
gcc 컴파일러를 이용하여 HelloNative.c 를 compile하여 libHelloNative.so 공유 라이브러리 생성
[root@jvmedu ex01]# gcc HelloNative.c -o libHelloNative.so -shared -I${JAVA_HOME}/include -I${JAVA_HOME}/include/linux -fPIC
[root@jvmedu ex01]# file libHelloNative.so
libHelloNative.so: ELF 64-bit LSB shared object, x86-64, version 1 (SYSV), dynamically linked,
BuildID[sha1]=44fd5c90604df6023335a2211b4c39dd3fa797b3, not stripped](https://image.slidesharecdn.com/jvm-230511085906-be6f1201/75/JVM_-pdf-85-2048.jpg)
![86
LAB) JNI를 이용한 Native Method 호출 (5/5)
⑥ HelloNative 자바 프로그램 실행하고 visualvm으로 Thread Dump 생성 후 Native Stack 확인
Runtime Data Area
-Djava.library.path 옵션을 이용하여 HelloNative 자바 프로그램 실행
[root@jvmedu ex01]# java -Djava.library.path=. HelloNative 1000
javaMethod Called....
NativeMethod Called.....!
visualvm으로 Thread Dump 를 생성하고 main thread의 Stack Trace를 확인
Top Stack
-Djava.library.path 와 LD_LIBRARY_PATH 환경변수
native library를 찾을 위치 지정
java.lang.Thread.State: RUNNABLE
at java.net.SocketInputStream.socketRead0(Native Method)
at java.net.SocketInputStream.read(SocketInputStream.java:152)
at java.net.SocketInputStream.read(SocketInputStream.java:122)
at java.io.BufferedInputStream.fill(BufferedInputStream.java:235)
at java.io.BufferedInputStream.read(BufferedInputStream.java:254)
- locked 0x00000000fd47b808 (a java.io.BufferedInputStream)
at java.io.FilterInputStream.read(FilterInputStream.java:83)](https://image.slidesharecdn.com/jvm-230511085906-be6f1201/75/JVM_-pdf-86-2048.jpg)
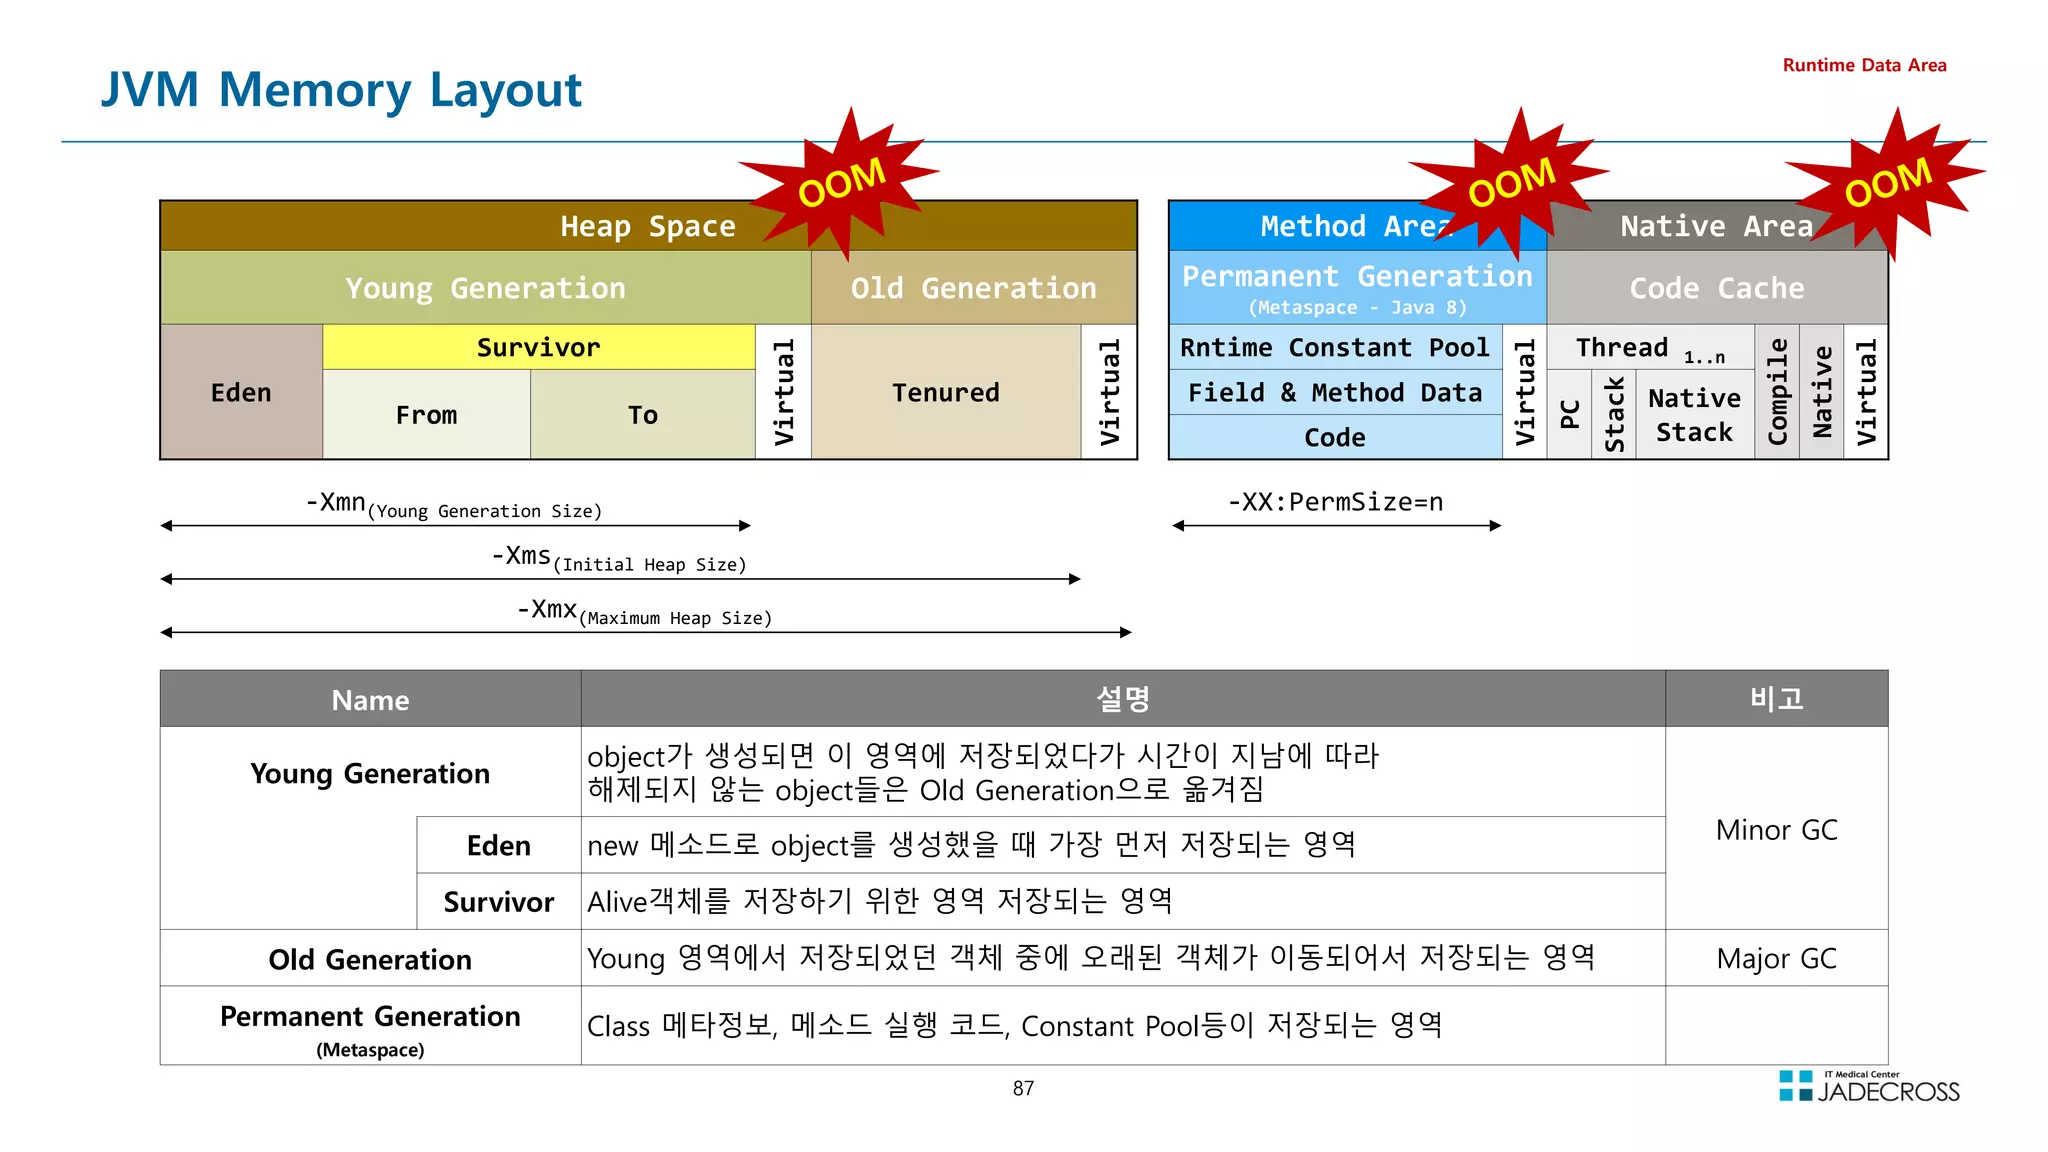

![89
LAB) Native Out Of Memory (2/3)
Runtime Data Area
① STS 실행후 Tomcat v8.5 서버 실행
[root@jvmedu ~]# sts
② visualvm을 실행하고 visualgc 플러그인 설치
Applications 뷰에서 Local Tomcat 더블 클릭 Visual GC 탭 클릭
[root@jvmedu ~]# visualvm
③ “System Monitor”를 실행하고 Resources 탭을 클릭하여 메모리 상황 관찰
[root@jvmedu ~]# gnome-system-monitor](https://image.slidesharecdn.com/jvm-230511085906-be6f1201/75/JVM_-pdf-89-2048.jpg)
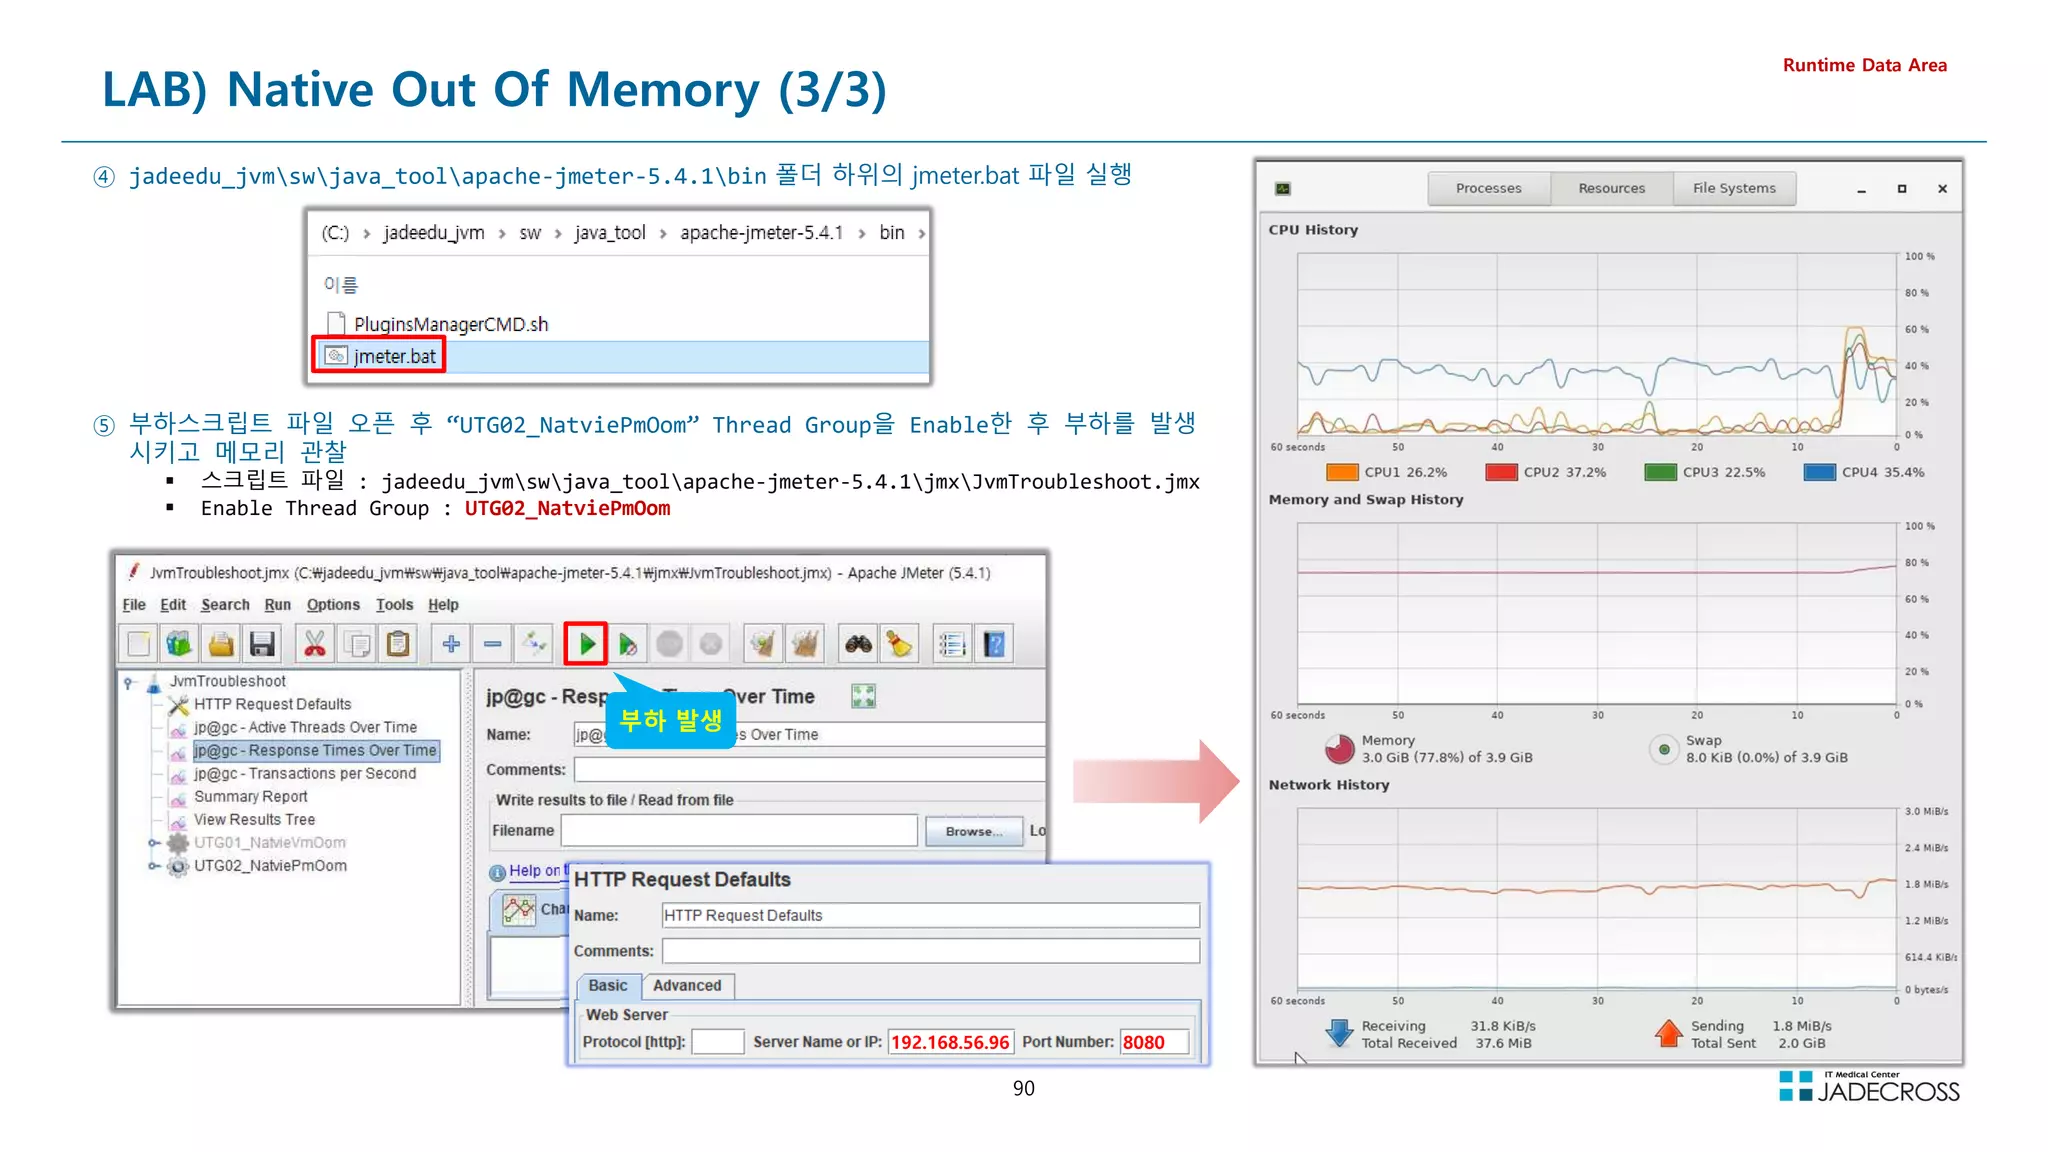
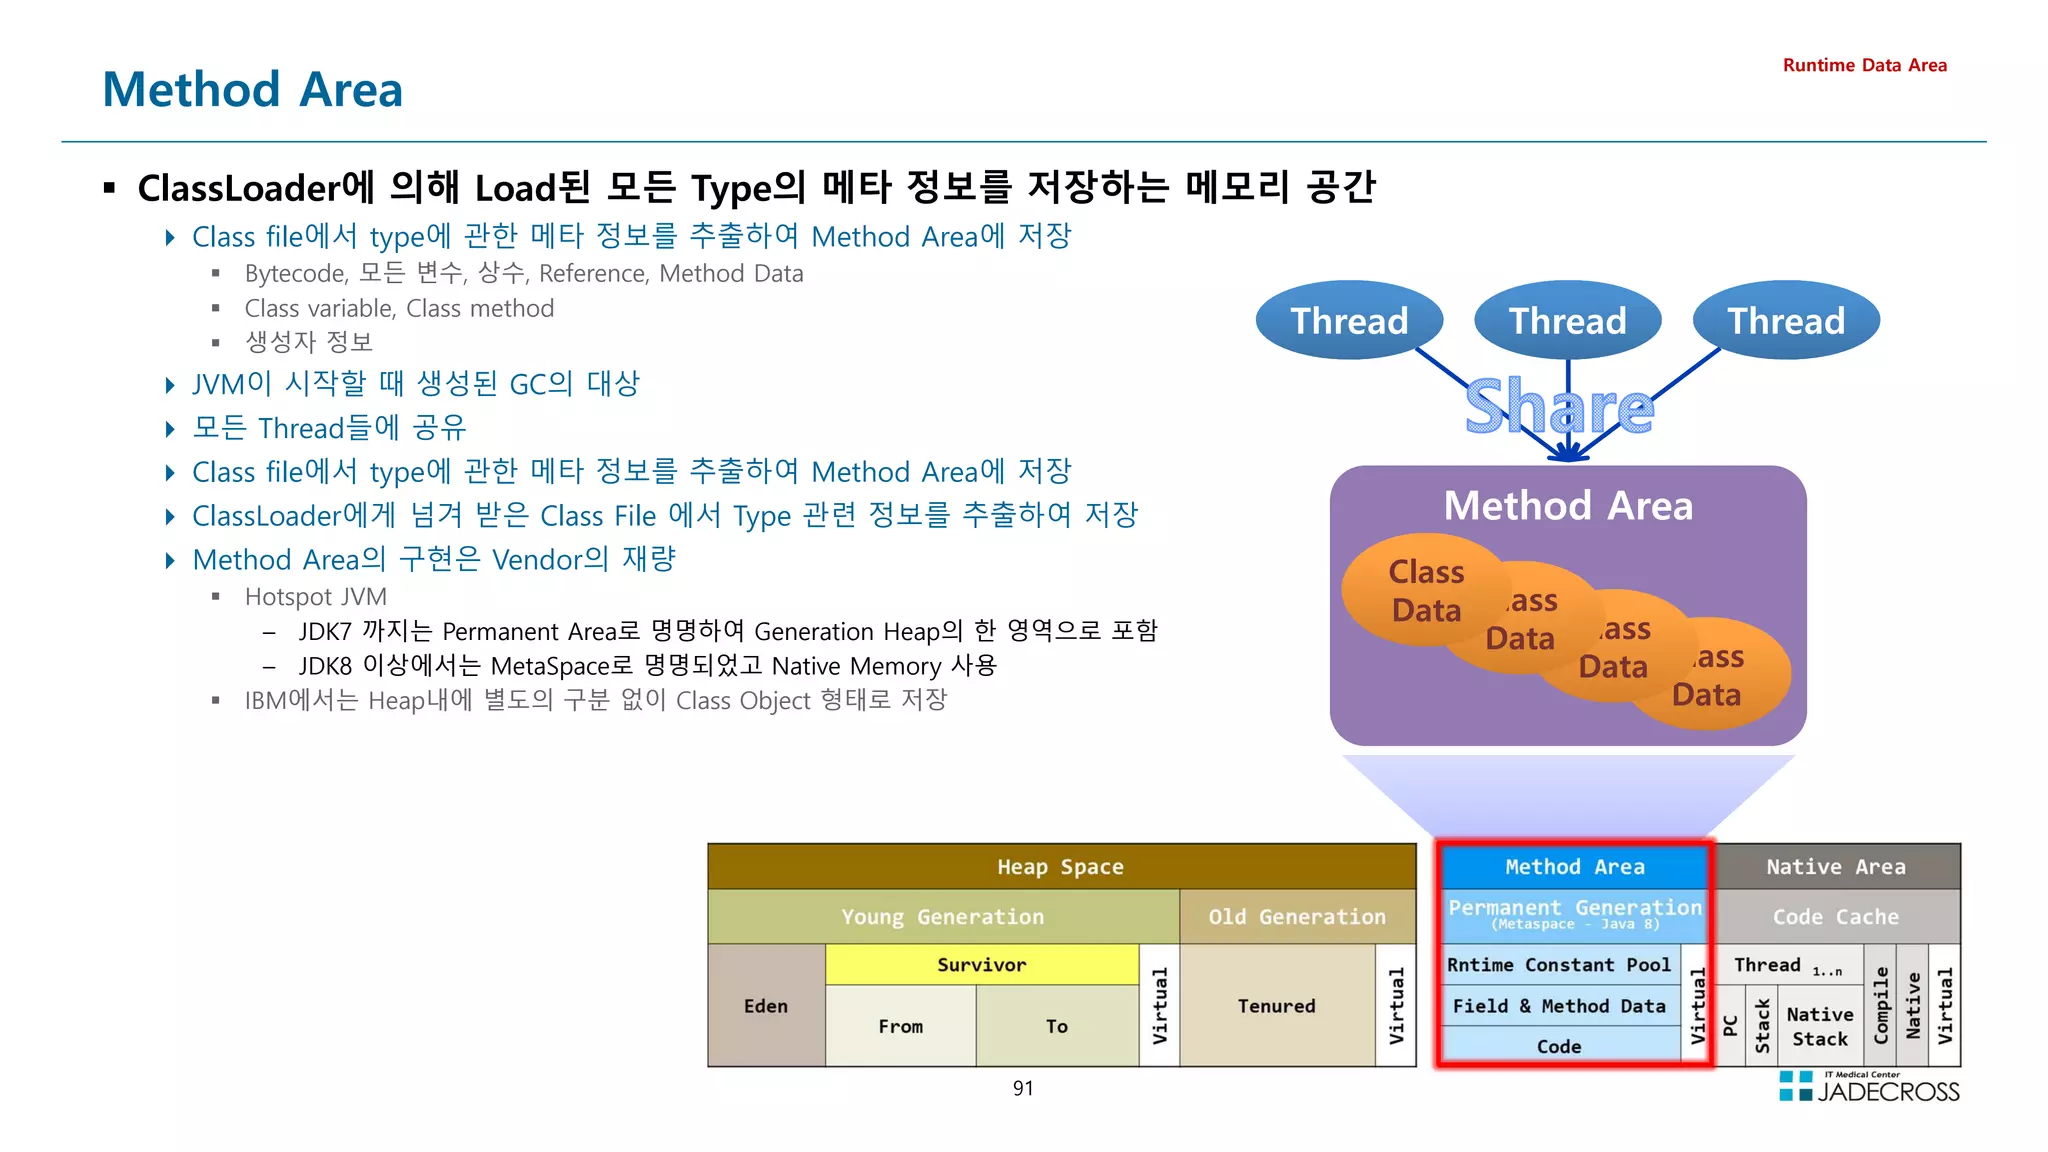
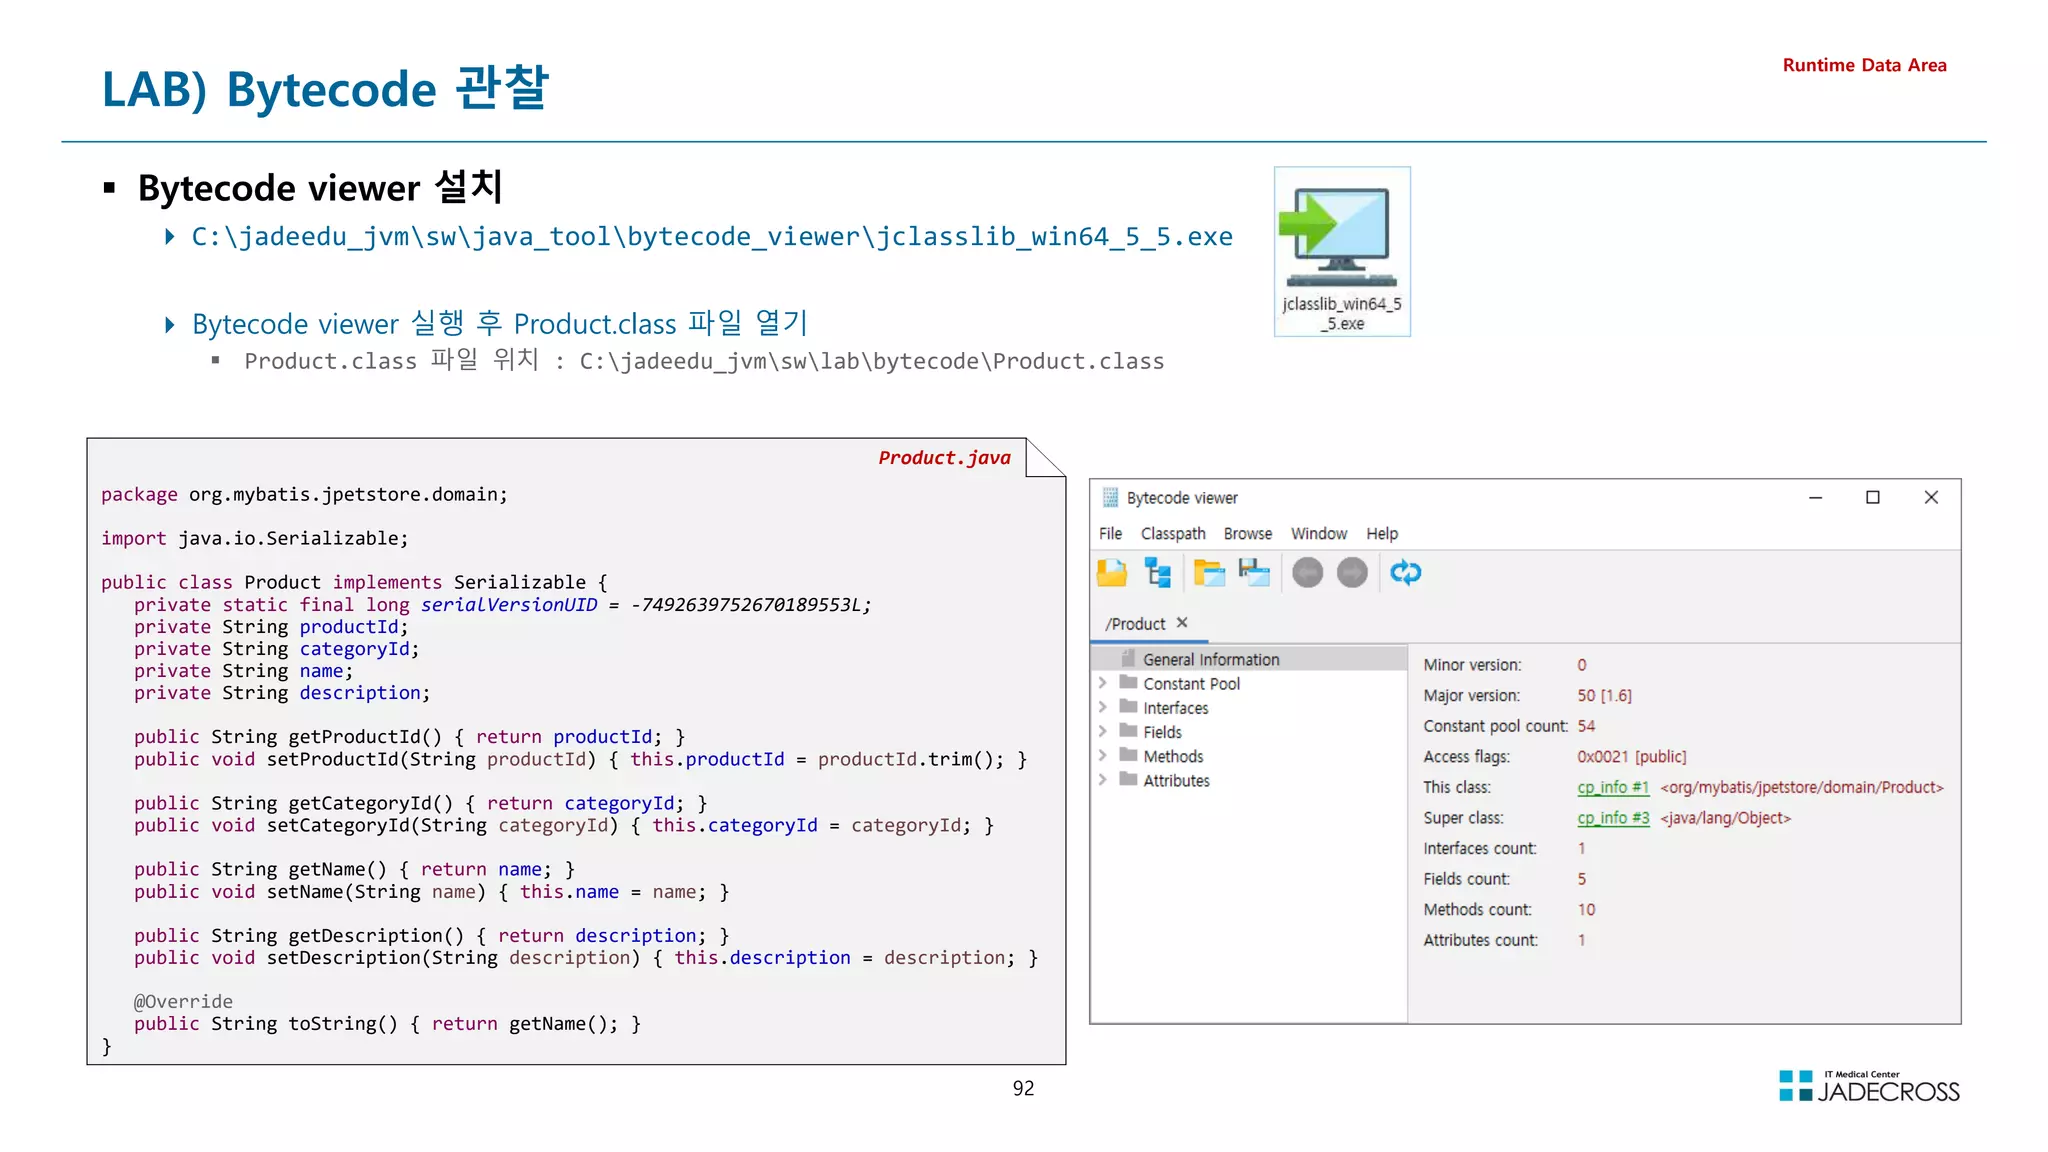
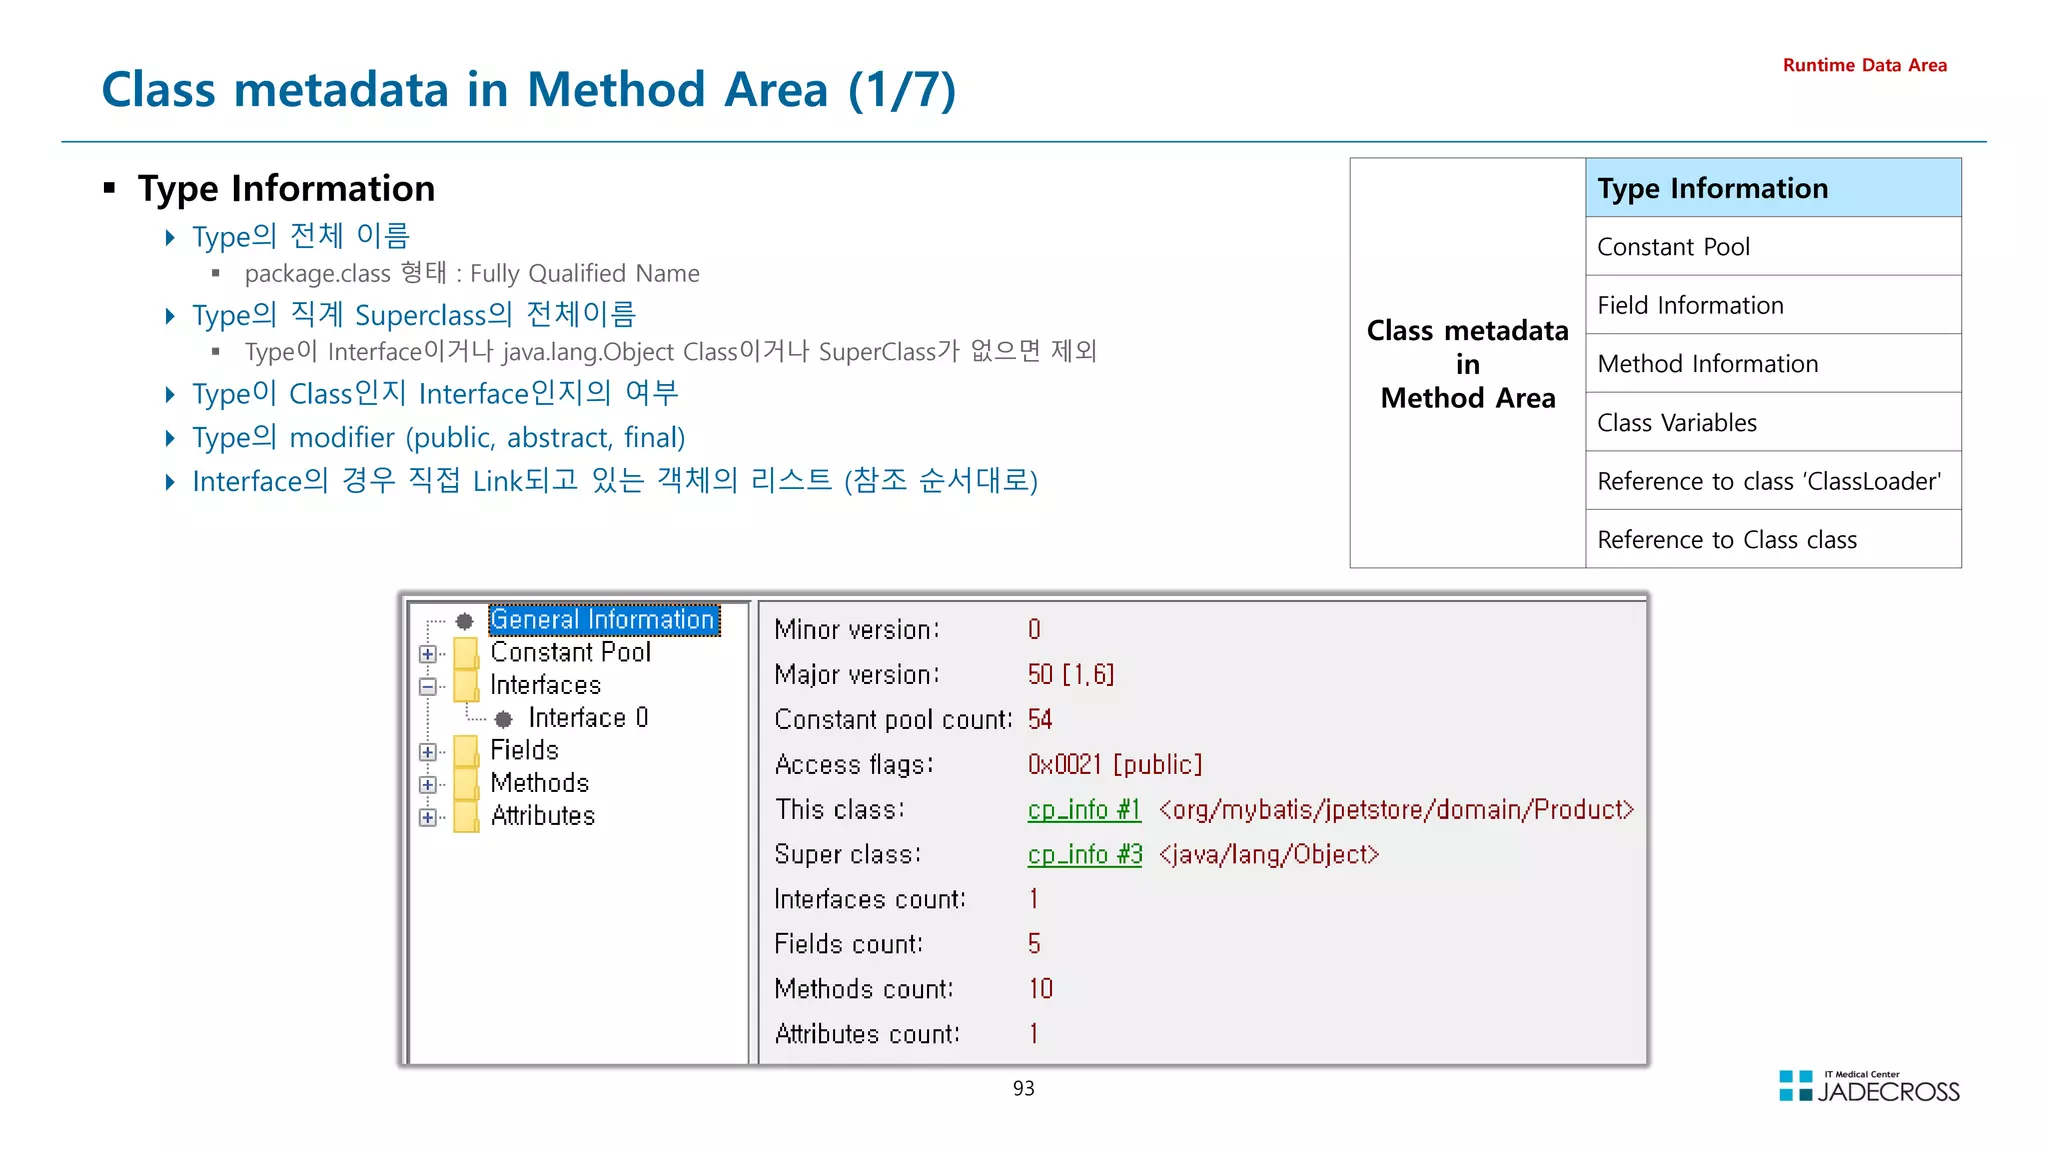
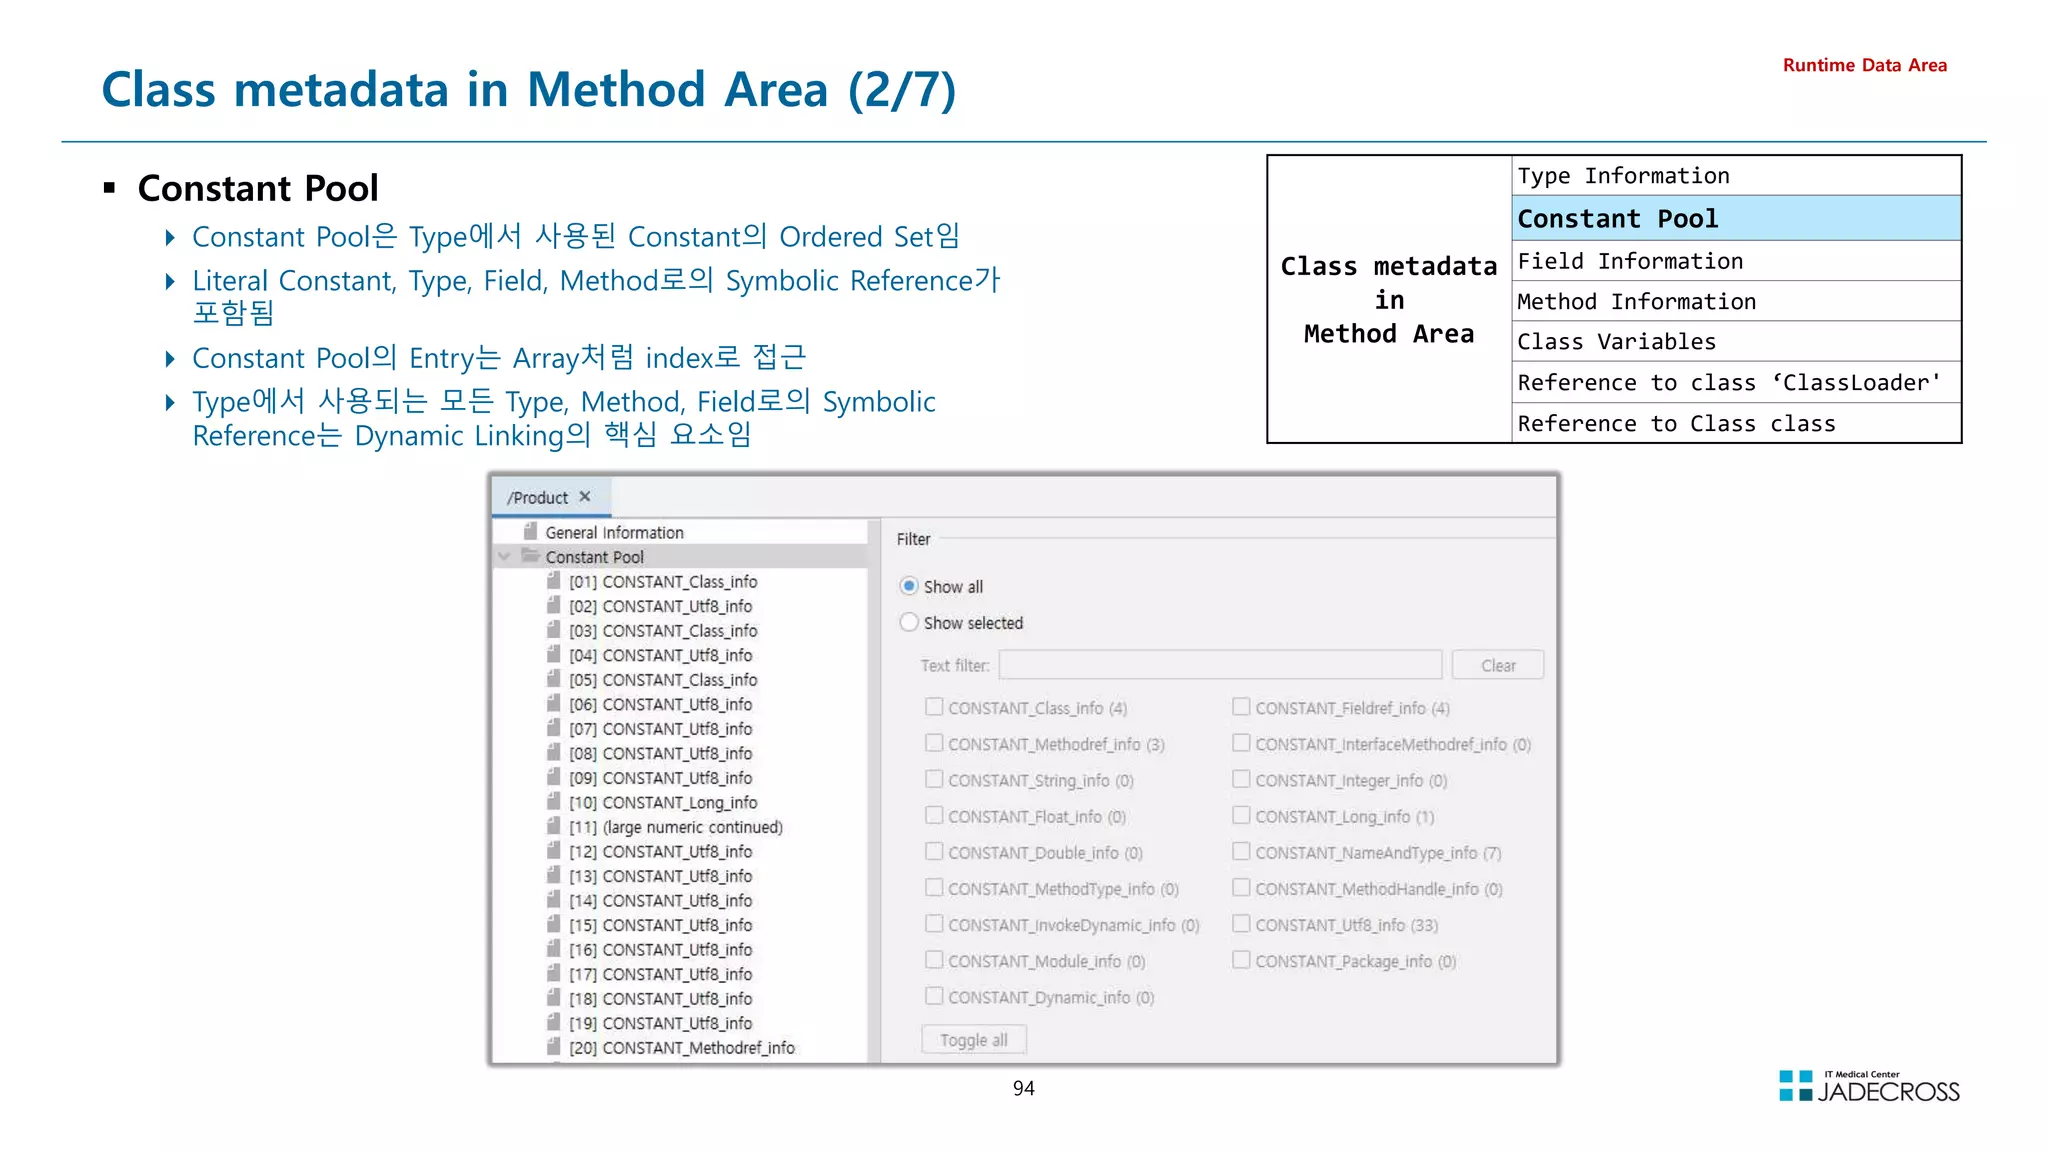
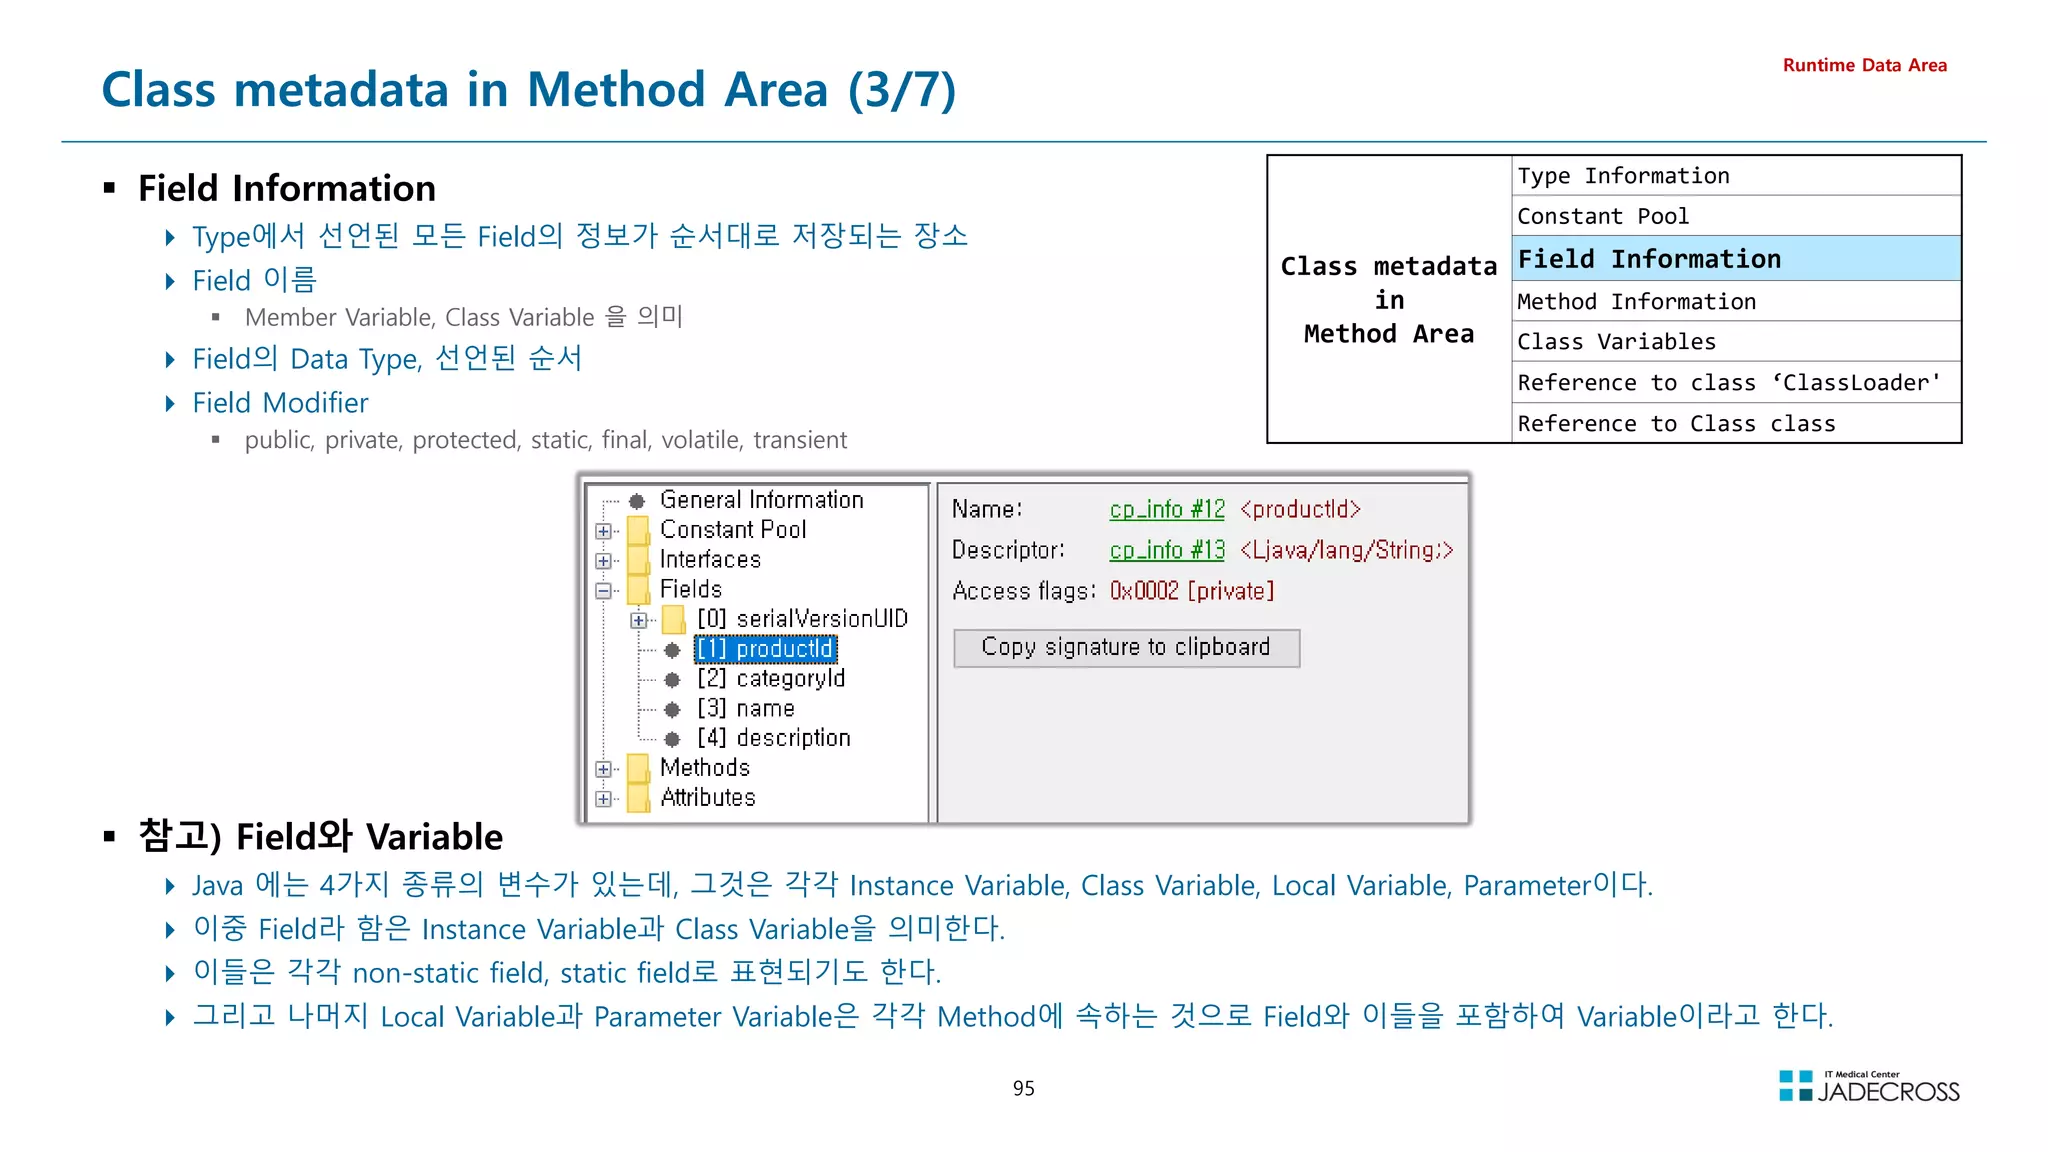
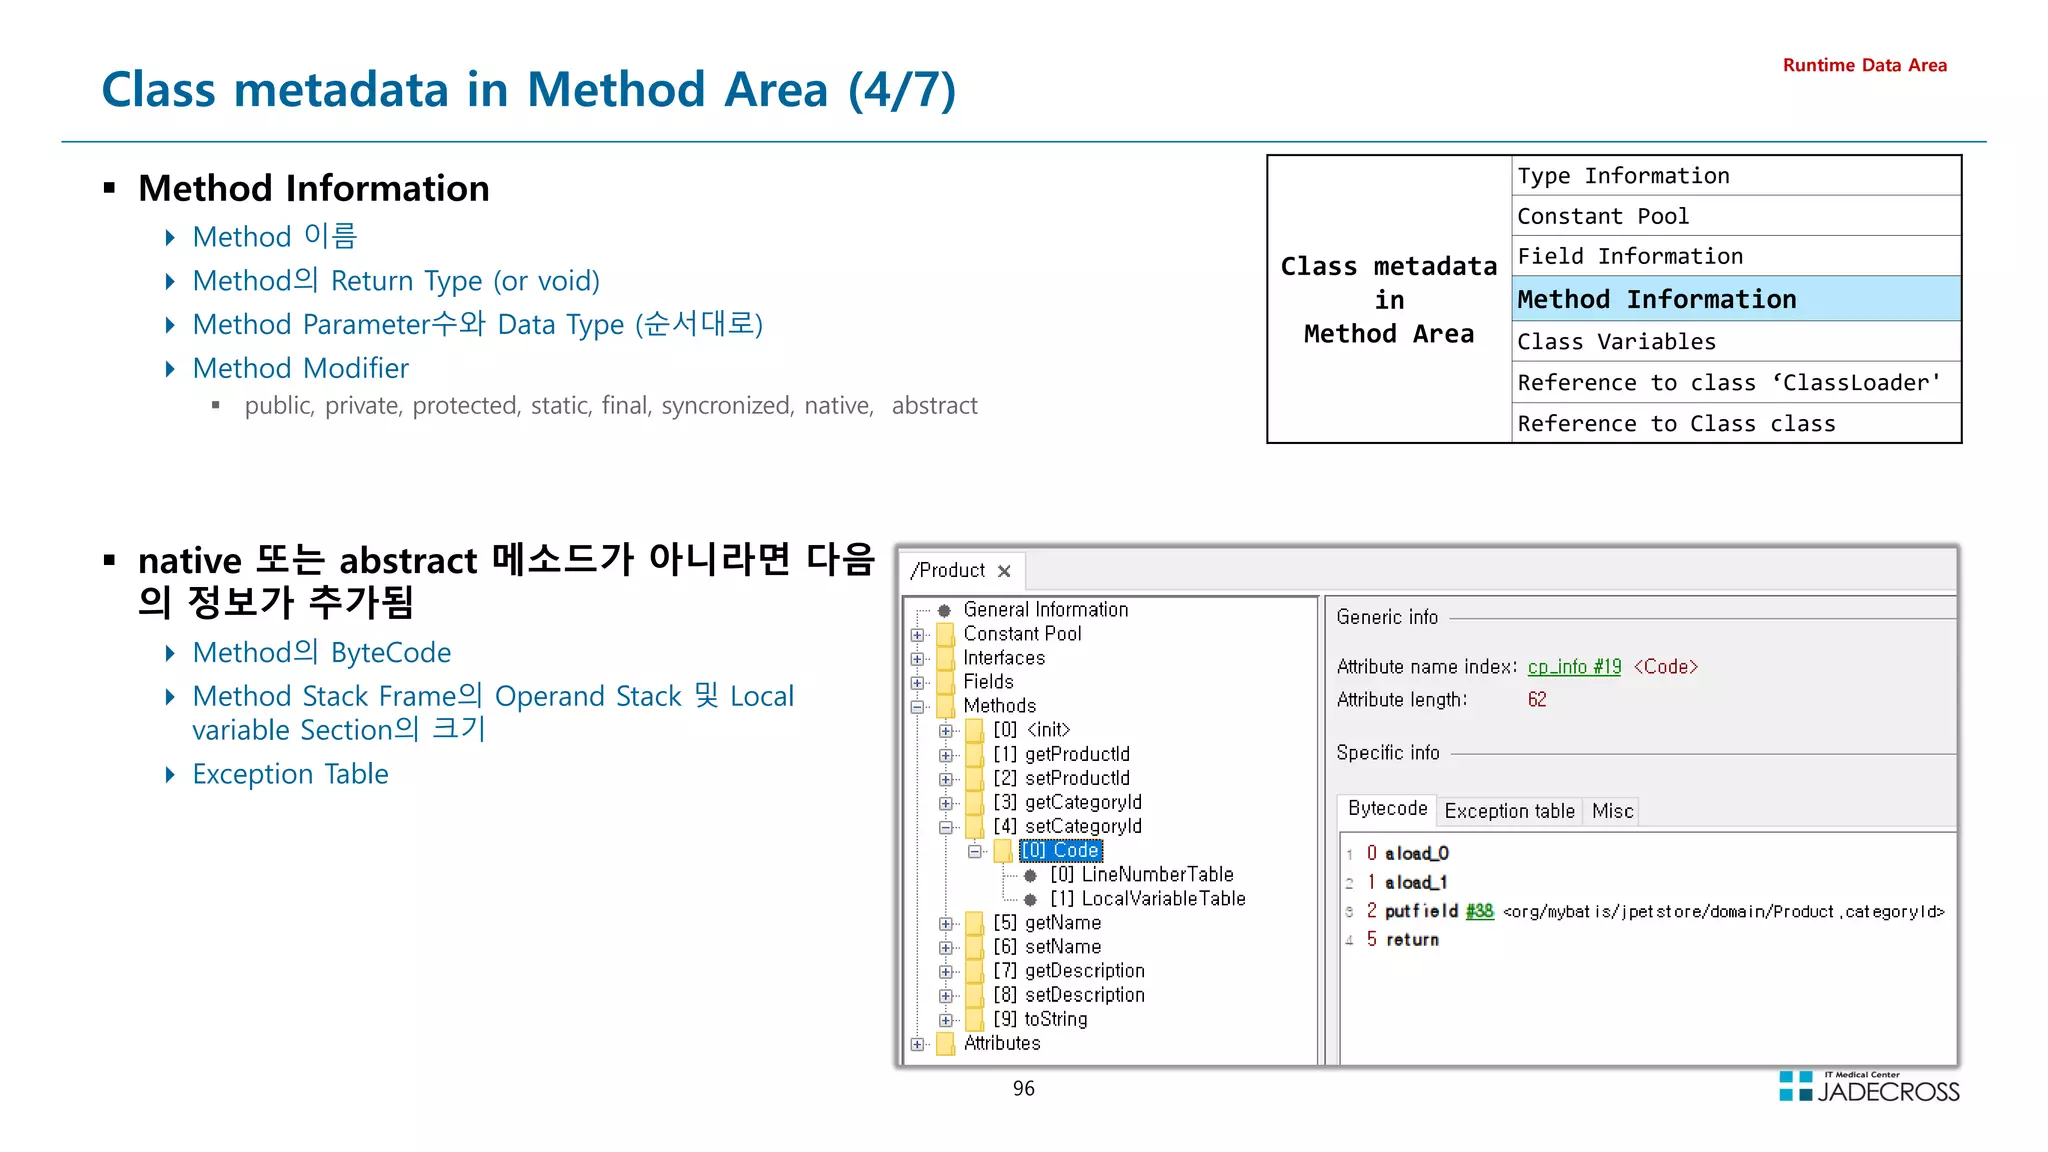
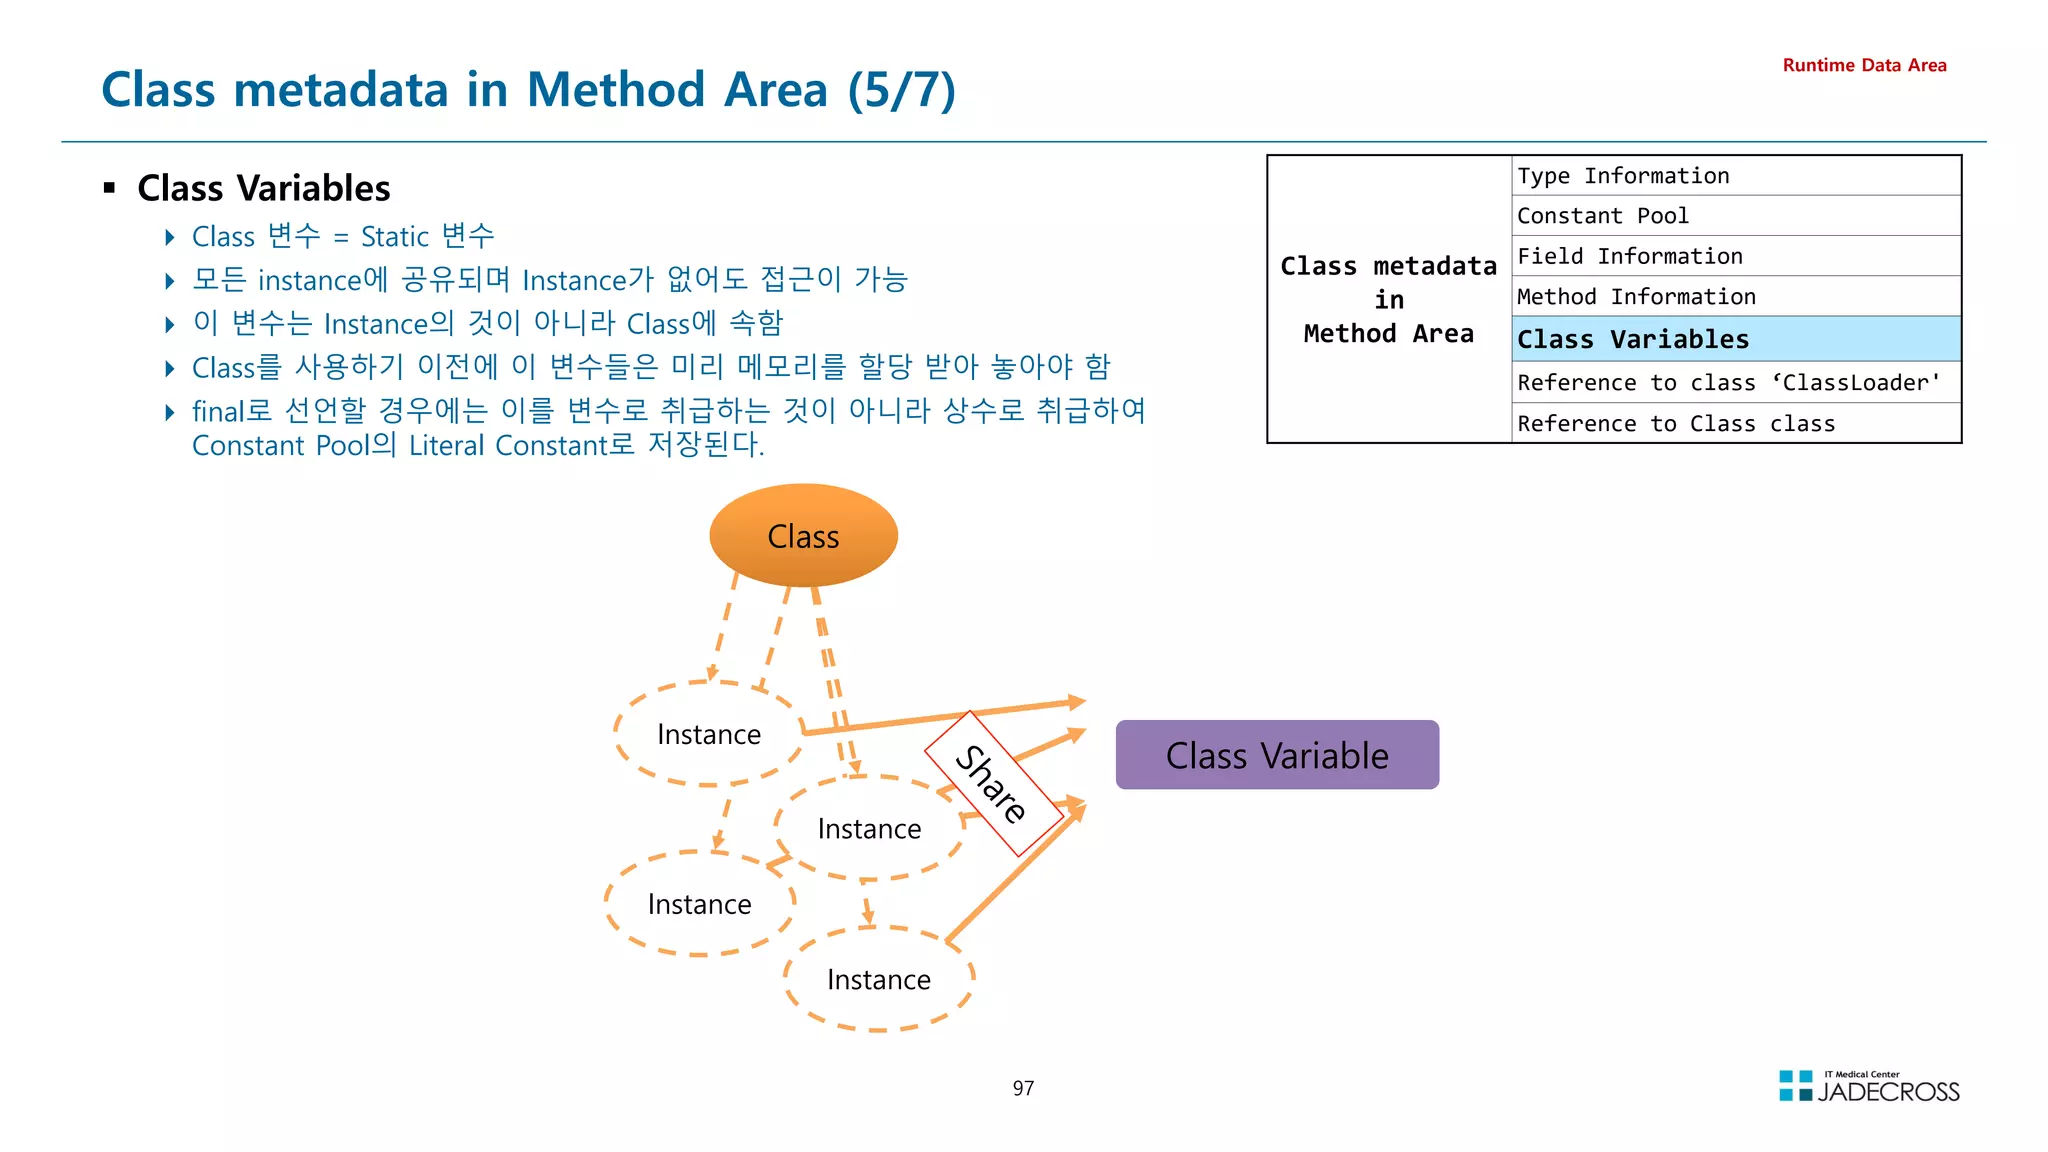
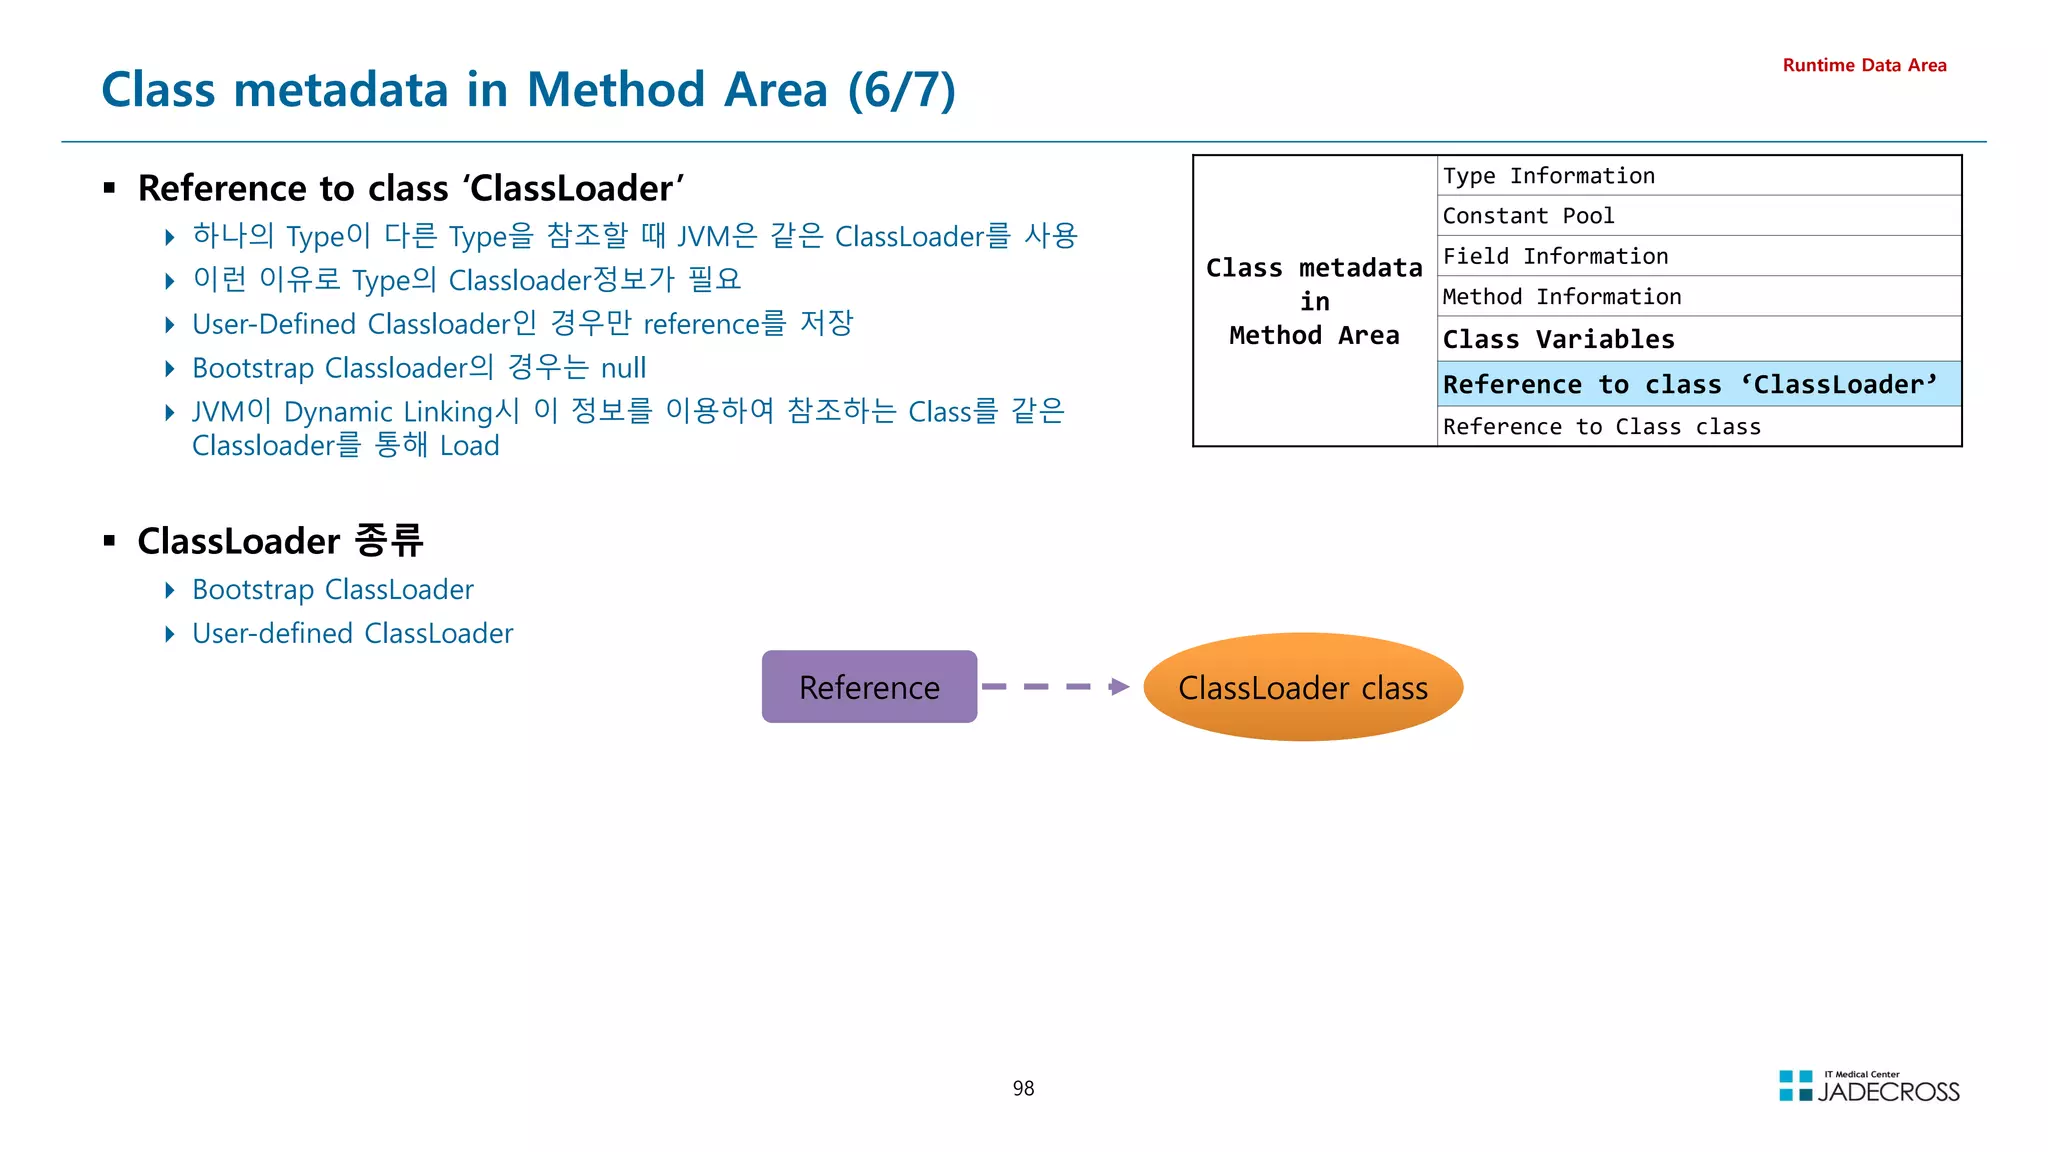
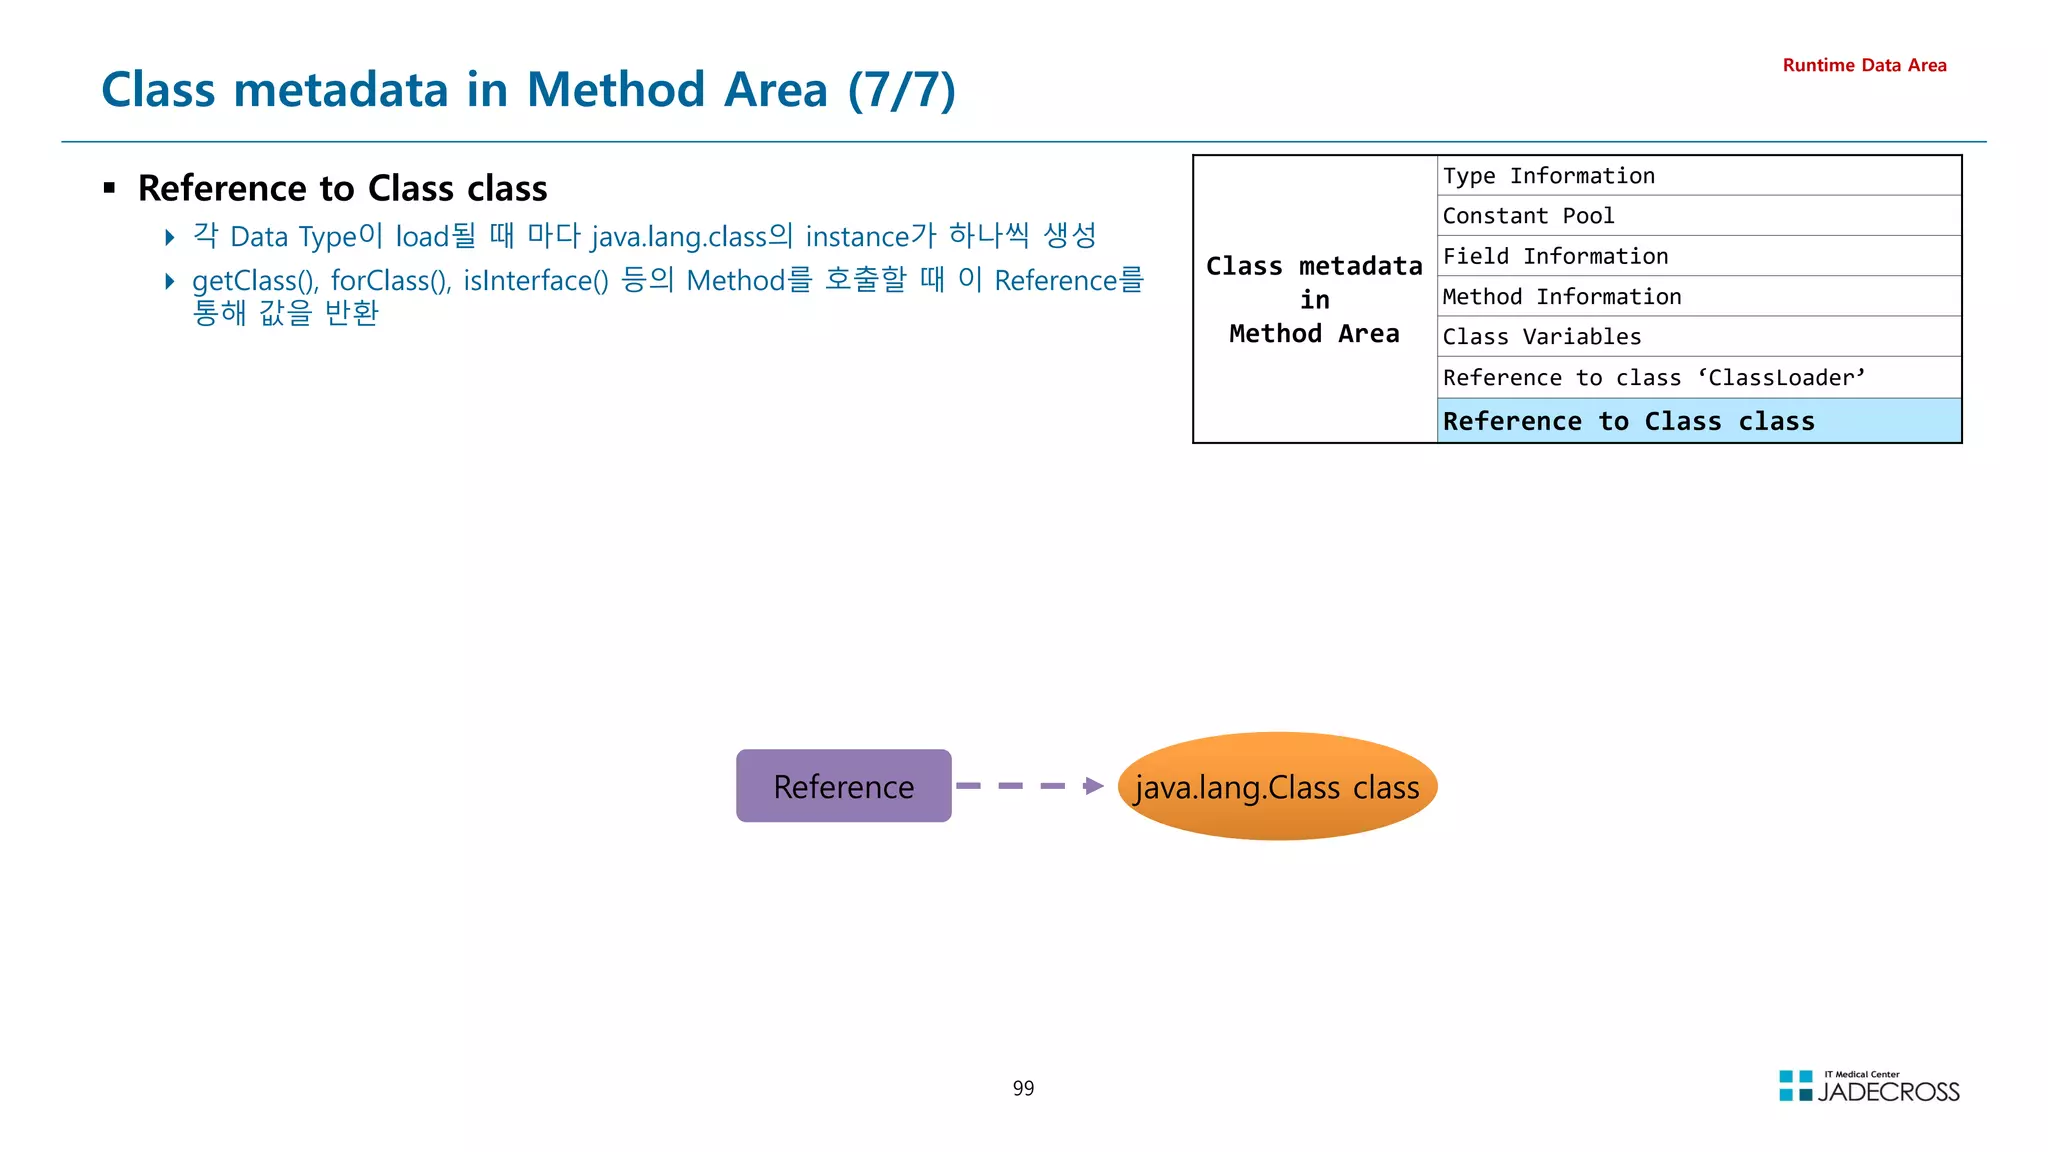
![100
LAB) Method Area Out Of Memory (1/6)
LAB 개요
Http Request 1번마다 동적으로 Class를 하나 생성하고 JVM에
로드하는 부하를 발생시키고 Permgen(Metaspace) OOM 관찰
Runtime Data Area
PermgenOomDynamicClassLoadFromPermanentClassLoader.java
public class PermgenOomDynamicClassLoadFromPermanentClassLoader extends HttpServlet {
protected void doGet(HttpServletRequest request, HttpServletResponse response)
throws ServletException, IOException {
String dynamicClassName = null;
PermanentClassLoader myClassLoader = null;
Class? dynamicClass = null;
myClassLoader = PermanentClassLoader.getInstance();
try {
dynamicClassName = C_ + UUID.randomUUID().toString().replace(-, );
dynamicClass = myClassLoader.findClass(dynamicClassName);
dynamicClass.getDeclaredMethod(hello).invoke(dynamicClass.newInstance());
} catch (Exception ex) {
System.out.println(ex.getMessage());
}
response.getWriter().append(Class : )
.append(dynamicClassName)
.append( Loaded by PermanentClassLoader.... );
}
}
PermanentClassLoader.java
public class PermanentClassLoader extends ClassLoader {
private static PermanentClassLoader _instance = new PermanentClassLoader();
public static PermanentClassLoader getInstance() {
return _instance;
}
@Override
protected Class? findClass(String className) throws ClassNotFoundException {
byte[] classBytes;
try {
classBytes = HelloWorldClassCreator.dump(className);
return defineClass(className, classBytes, 0, classBytes.length);
} catch (Exception e) { }
return super.findClass(className);
}
}
HelloWorldClassCreator.java
public class HelloWorldClassCreator implements Opcodes {
public static byte[] dump(String className) throws Exception {
ClassWriter cw = new ClassWriter(0);
MethodVisitor mv;
cw.visit(V1_6, ACC_PUBLIC + ACC_SUPER, className, null, java/lang/Object, null);
cw.visitSource(className + .java, null);
{
mv = cw.visitMethod(ACC_PUBLIC, init, ()V, null, null);
mv.visitCode();
Label l0 = new Label();
mv.visitLabel(l0);
mv.visitLineNumber(1, l0);
mv.visitVarInsn(ALOAD, 0);
mv.visitMethodInsn(INVOKESPECIAL, java/lang/Object, init, ()V, false);
~~~
}
{
mv = cw.visitMethod(ACC_PUBLIC, hello, ()V, null, null);
mv.visitCode();
Label l0 = new Label();
mv.visitLabel(l0);
mv.visitLineNumber(6, l0);
mv.visitFieldInsn(GETSTATIC, java/lang/System, out, Ljava/io/PrintStream;);
// mv.visitLdcInsn(bbbbb);
mv.visitLdcInsn(Class : + className + Loaded...);
mv.visitMethodInsn(INVOKEVIRTUAL, java/io/PrintStream, println, (Ljava/lang/String;)V, false);
~~~
}
cw.visitEnd();
return cw.toByteArray();
}
}](https://image.slidesharecdn.com/jvm-230511085906-be6f1201/75/JVM_-pdf-100-2048.jpg)
![101
① STS 실행후 Tomcat v7.0 서버 실행
[root@jvmedu ~]# sts
② visualvm을 실행하고 visualgc 플러그인 설치
Applications 뷰에서 Local Tomcat 더블 클릭 Visual GC 탭 클릭
[root@jvmedu ~]# visualvm
③ “System Monitor”를 실행하고 Resources 탭을 클릭하여 메모리 상황 관찰
[root@jvmedu ~]# gnome-system-monitor
LAB) Method Area Out Of Memory (2/6)
Runtime Data Area
Permgen](https://image.slidesharecdn.com/jvm-230511085906-be6f1201/75/JVM_-pdf-101-2048.jpg)
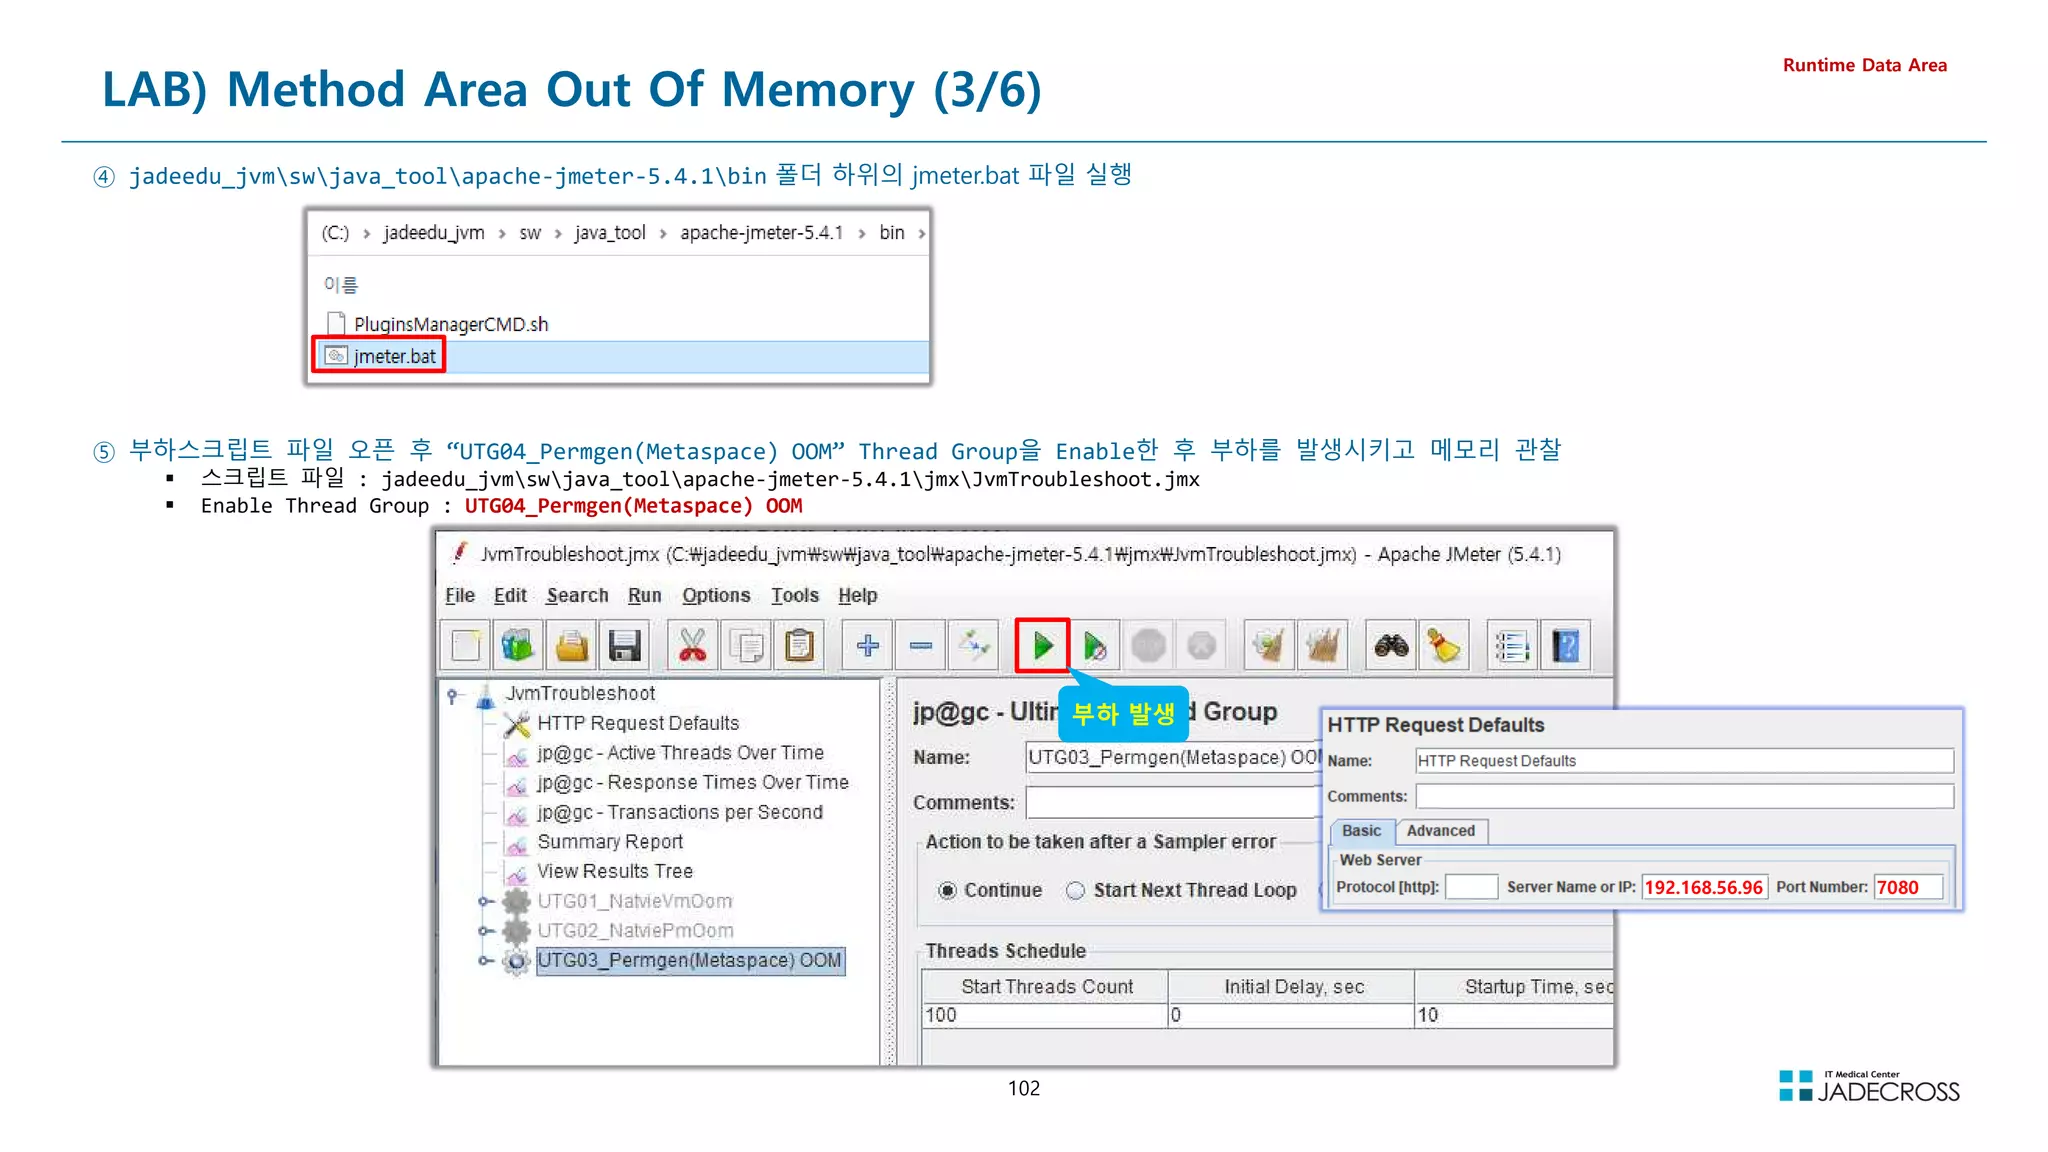
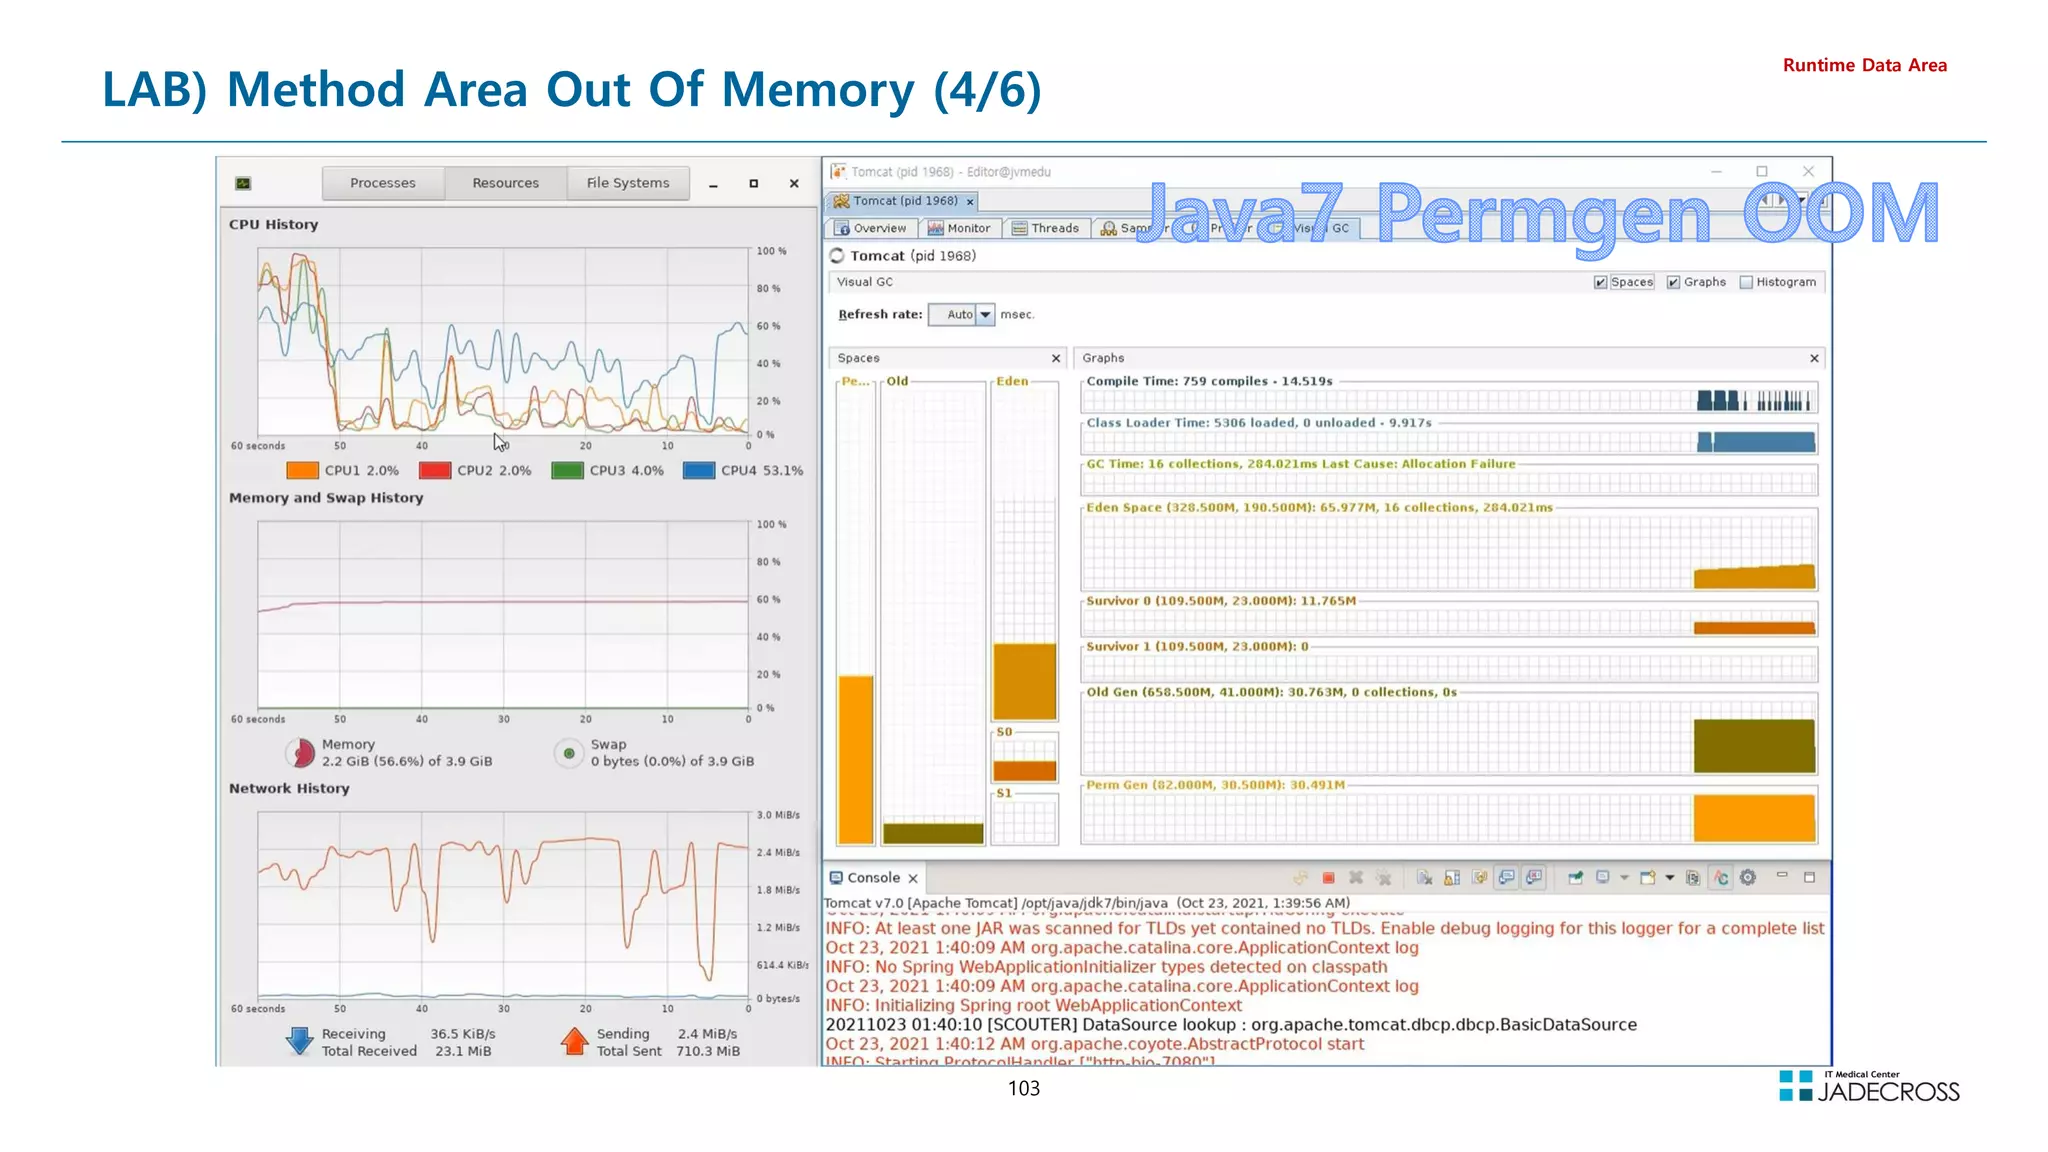
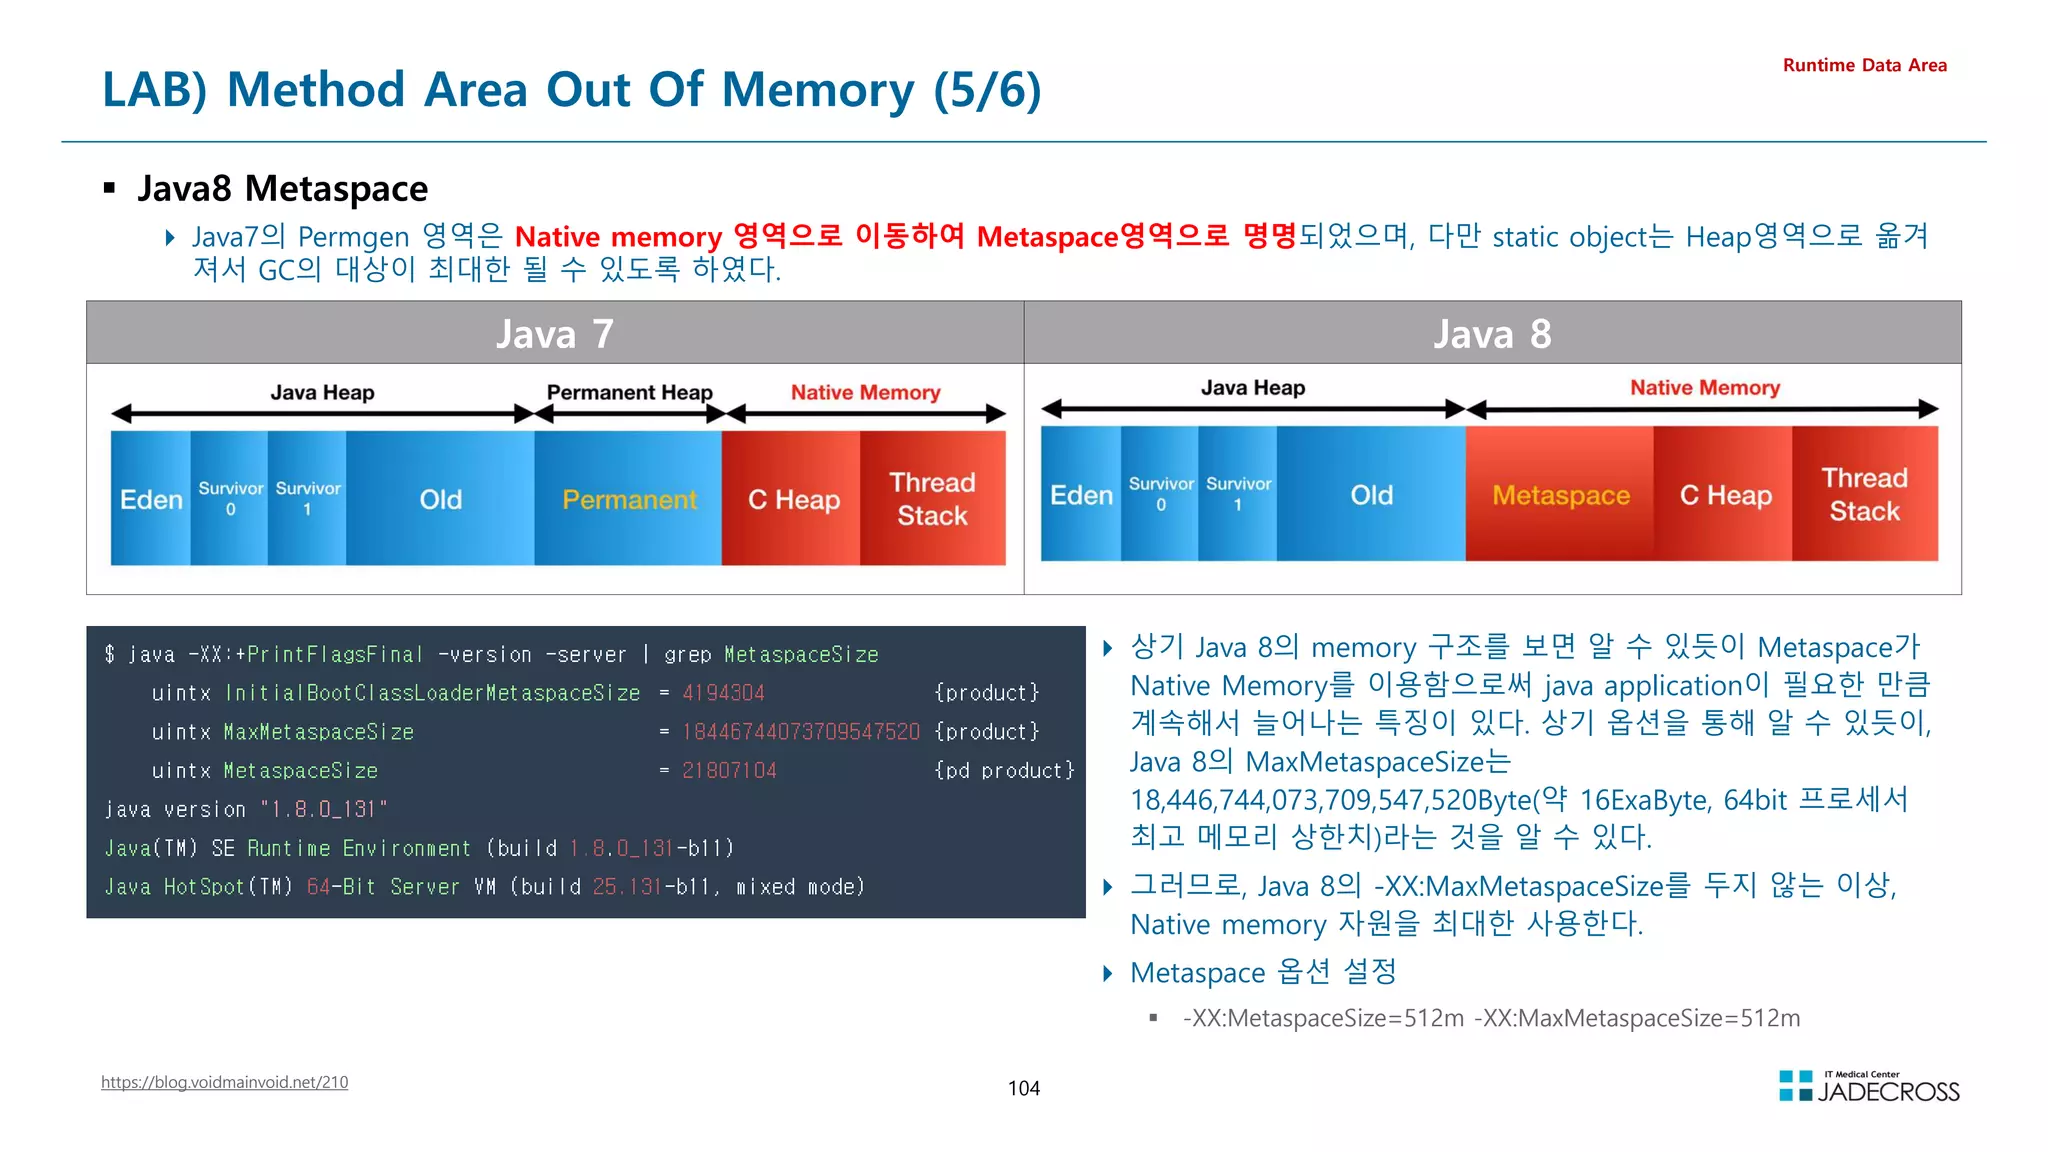
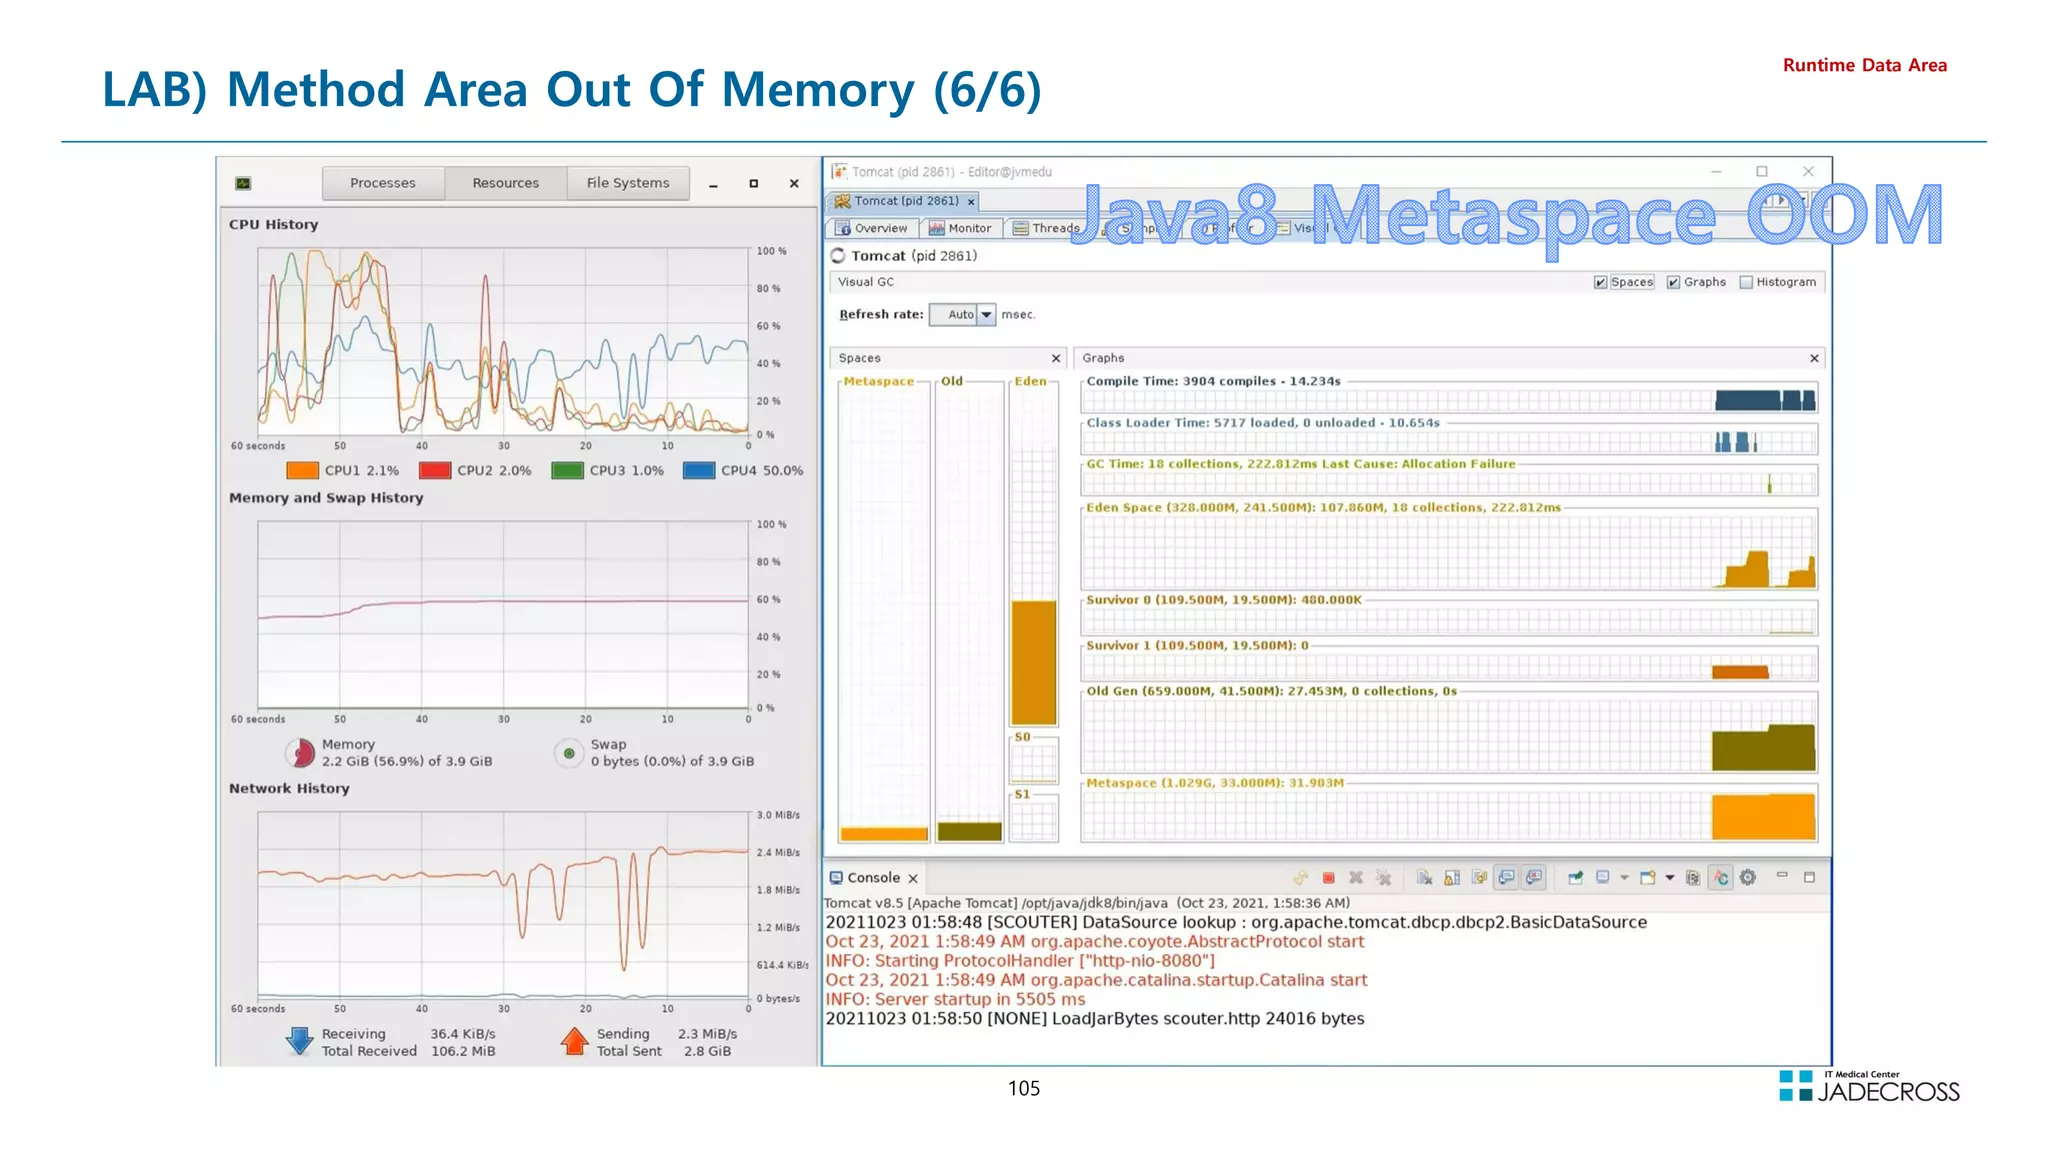
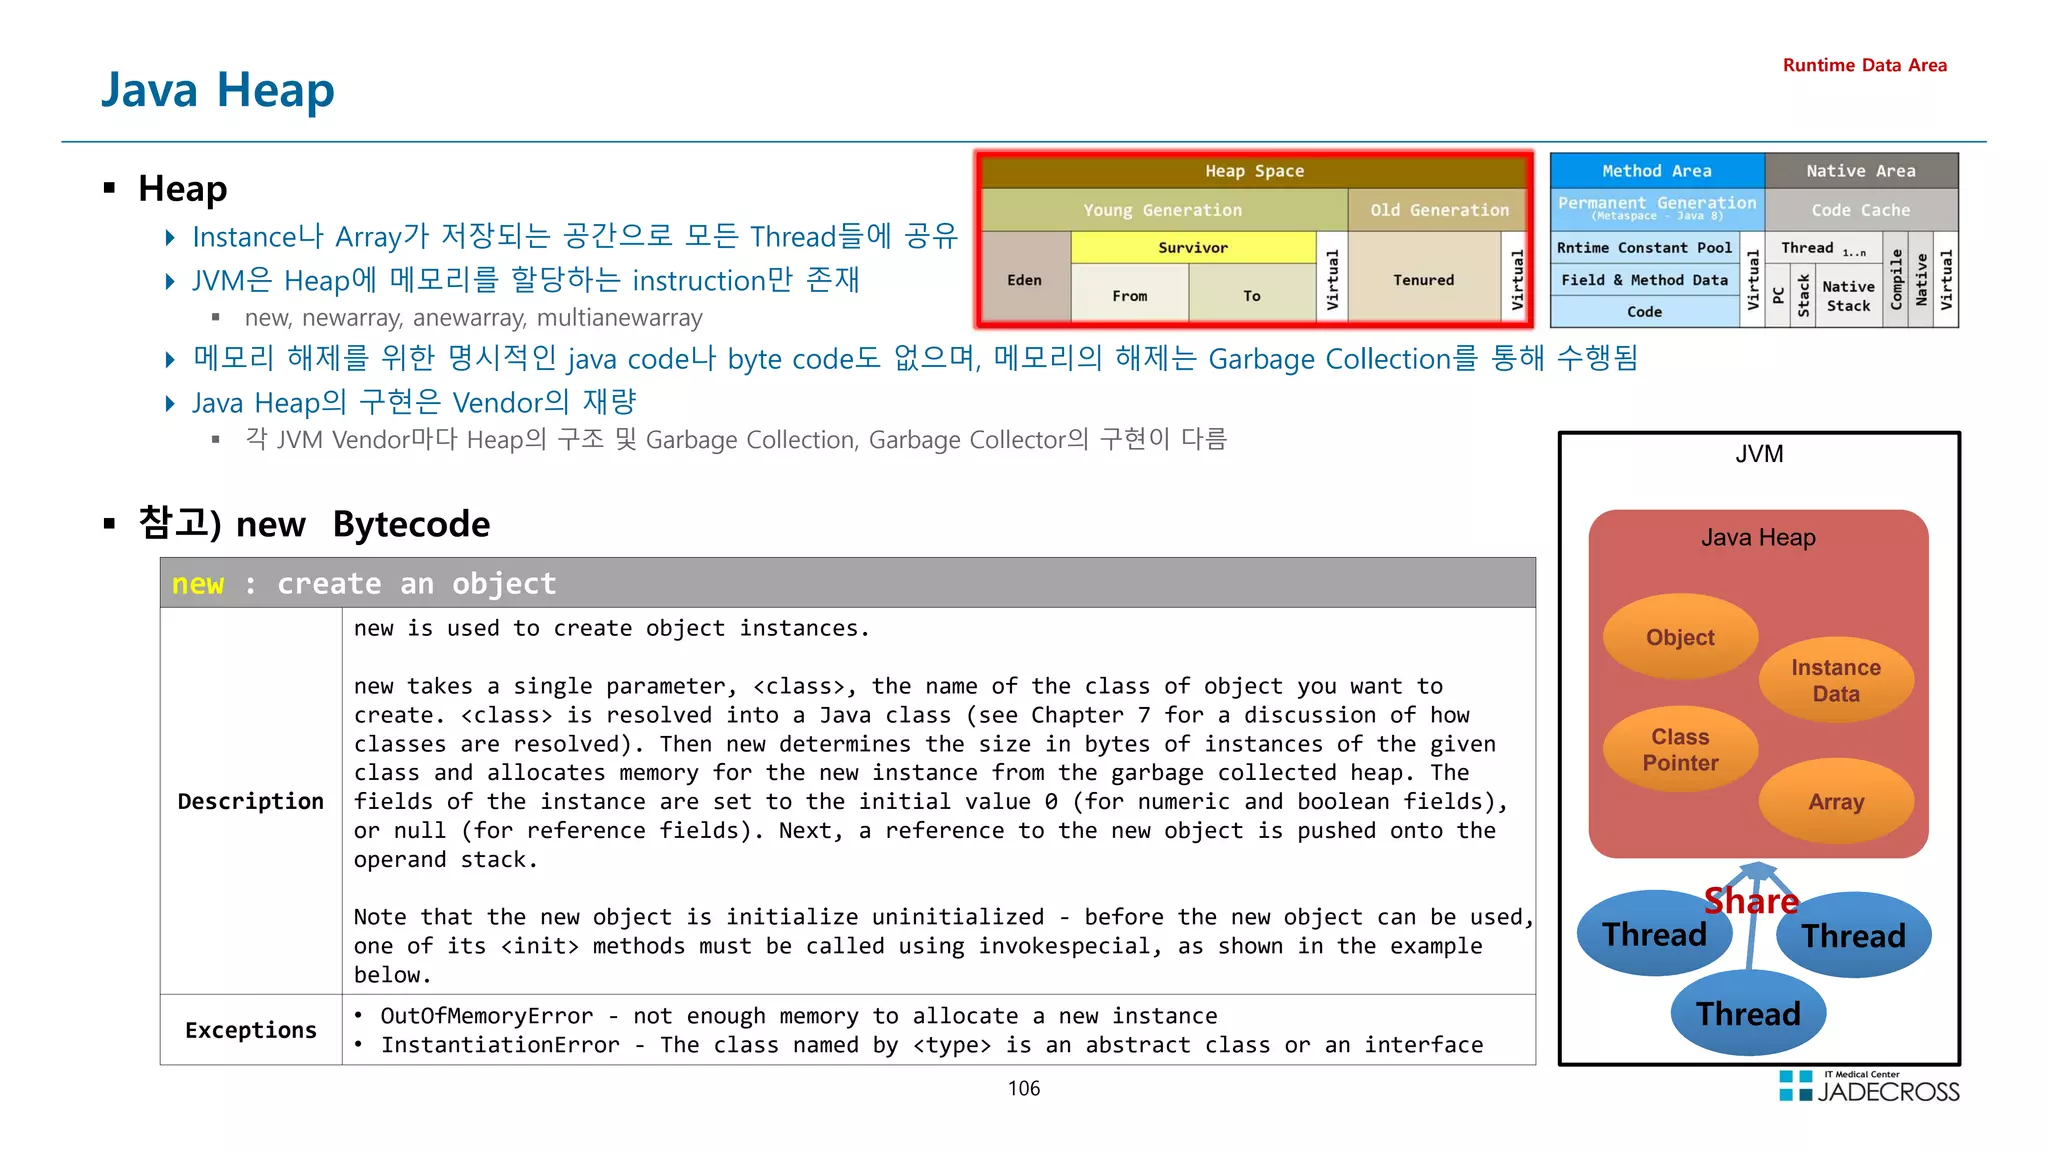
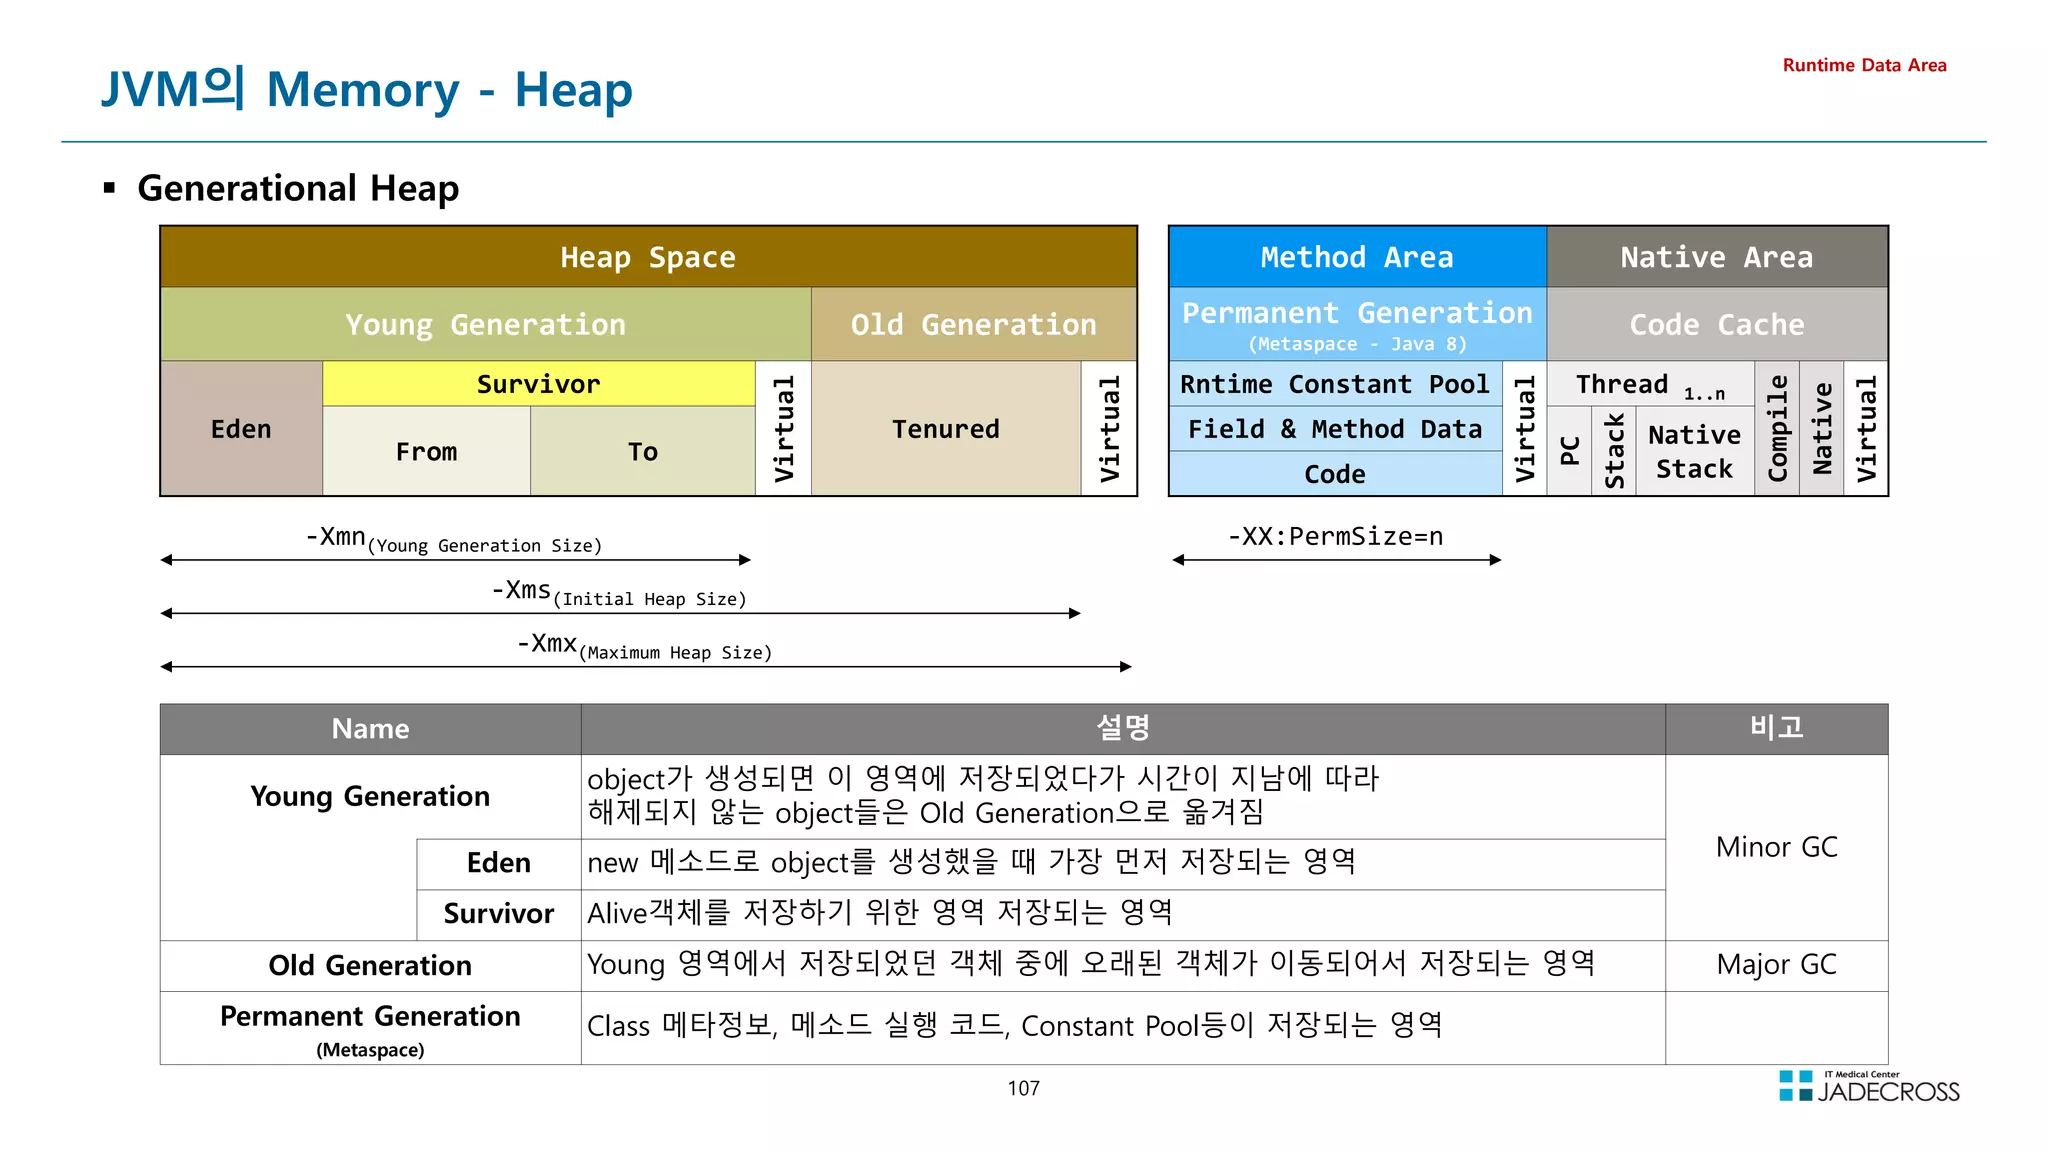
![108
LAB) 디폴트 힙 사이즈 확인
Java5부터 자동으로 Garbage Collector, Heap Size등을 자동으로 선택
Hardware Resource와 OS정보가 기준
Sever Class와 Client Class의 구분
-XX:+PrintCommandLineFlags
This option prints all command-line flags to the VM
Runtime Data Area
Version 디폴트 Command Line Flags
JAVA 7
[root@jvmedu ~]# /opt/java/jdk7/bin/java -XX:+PrintCommandLineFlags -version
-XX:InitialHeapSize=64717248 -XX:MaxHeapSize=1035475968 -XX:+PrintCommandLineFlags -XX:+UseCompressedOops -
XX:+UseParallelGC
java version 1.7.0_80
Java(TM) SE Runtime Environment (build 1.7.0_80-b15)
Java HotSpot(TM) 64-Bit Server VM (build 24.80-b11, mixed mode)
JAVA 8
[root@jvmedu ~]# /opt/java/jdk8/bin/java -XX:+PrintCommandLineFlags -version
-XX:InitialHeapSize=64717248 -XX:MaxHeapSize=1035475968 -XX:+PrintCommandLineFlags -XX:+UseCompressedClassPointers
-XX:+UseCompressedOops -XX:+UseParallelGC
openjdk version 1.8.0_302
OpenJDK Runtime Environment (Temurin)(build 1.8.0_302-b08)
OpenJDK 64-Bit Server VM (Temurin)(build 25.302-b08, mixed mode)](https://image.slidesharecdn.com/jvm-230511085906-be6f1201/75/JVM_-pdf-108-2048.jpg)
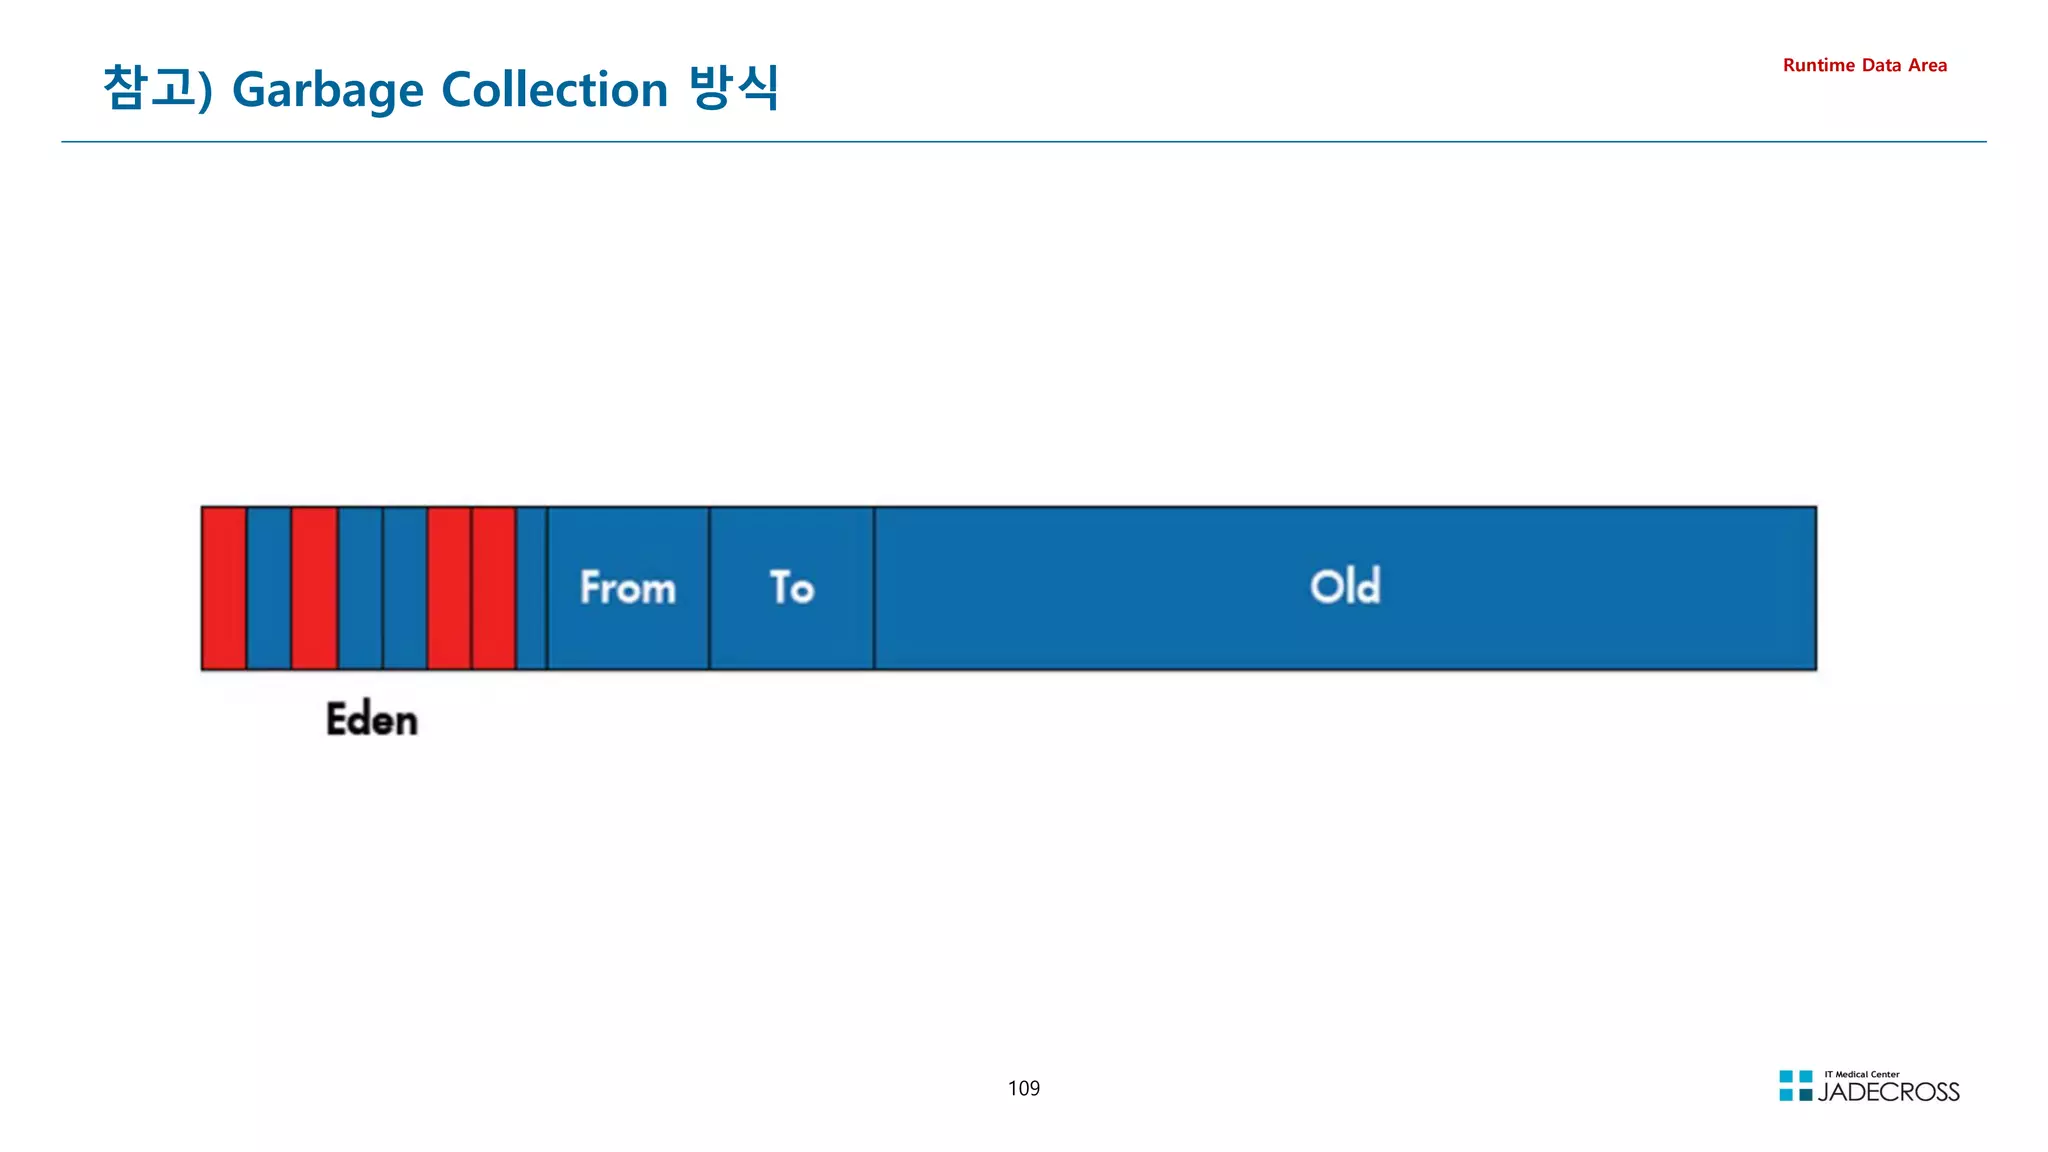
![110
① STS 실행후 Tomcat v8.5 서버 실행
[root@jvmedu ~]# sts
② visualvm을 실행하고 visualgc 플러그인 설치
Tools Plugins Available Plugins Visual GC Install
[root@jvmedu ~]# visualvm
LAB) visualvm을 이용한 JVM 메모리 이해 (1/2)
visualgc 플러그인
Runtime Data Area
③ Applications 뷰에서 Local Tomcat 더블 클릭 Visual GC 탭 클릭](https://image.slidesharecdn.com/jvm-230511085906-be6f1201/75/JVM_-pdf-110-2048.jpg)
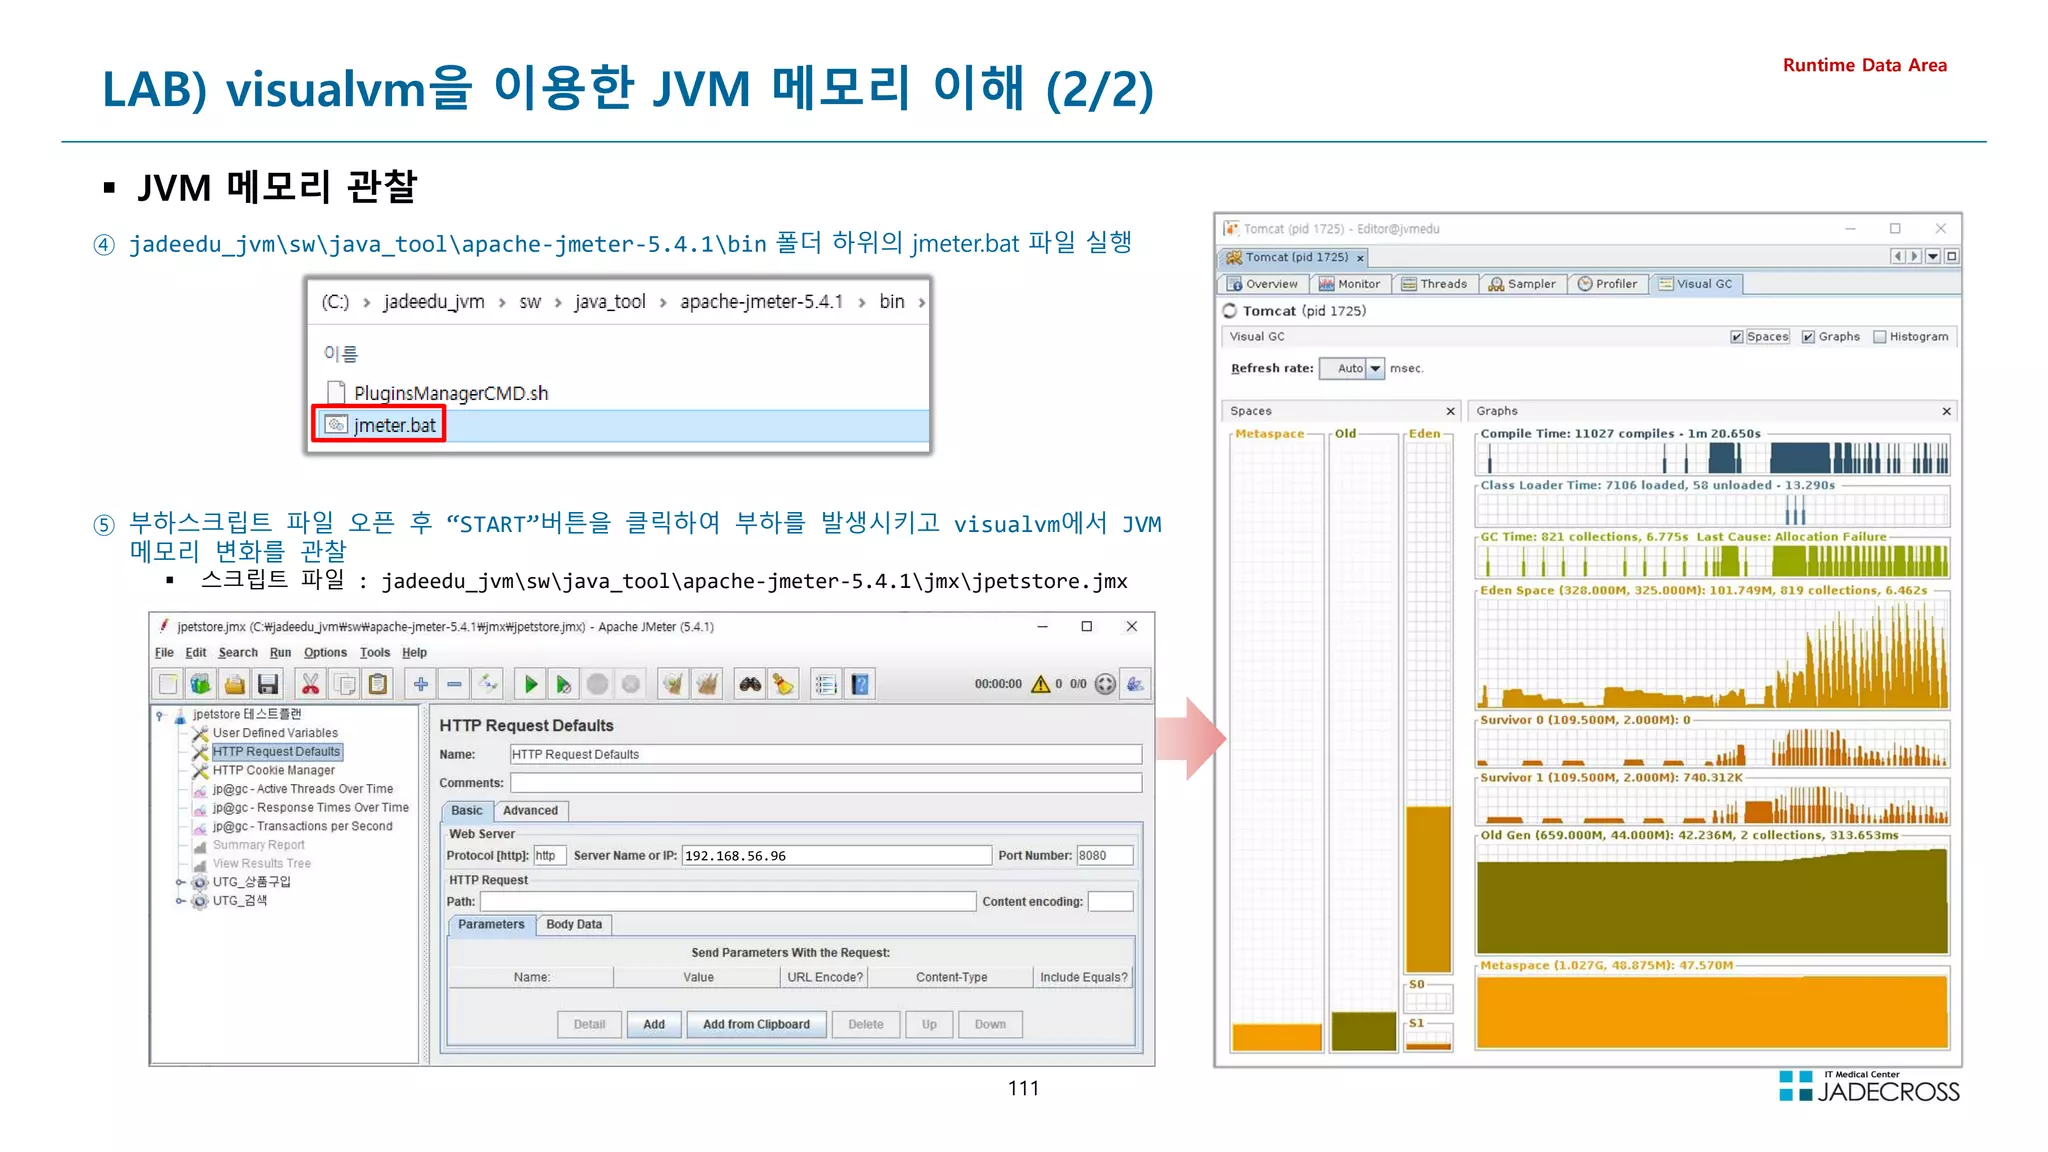
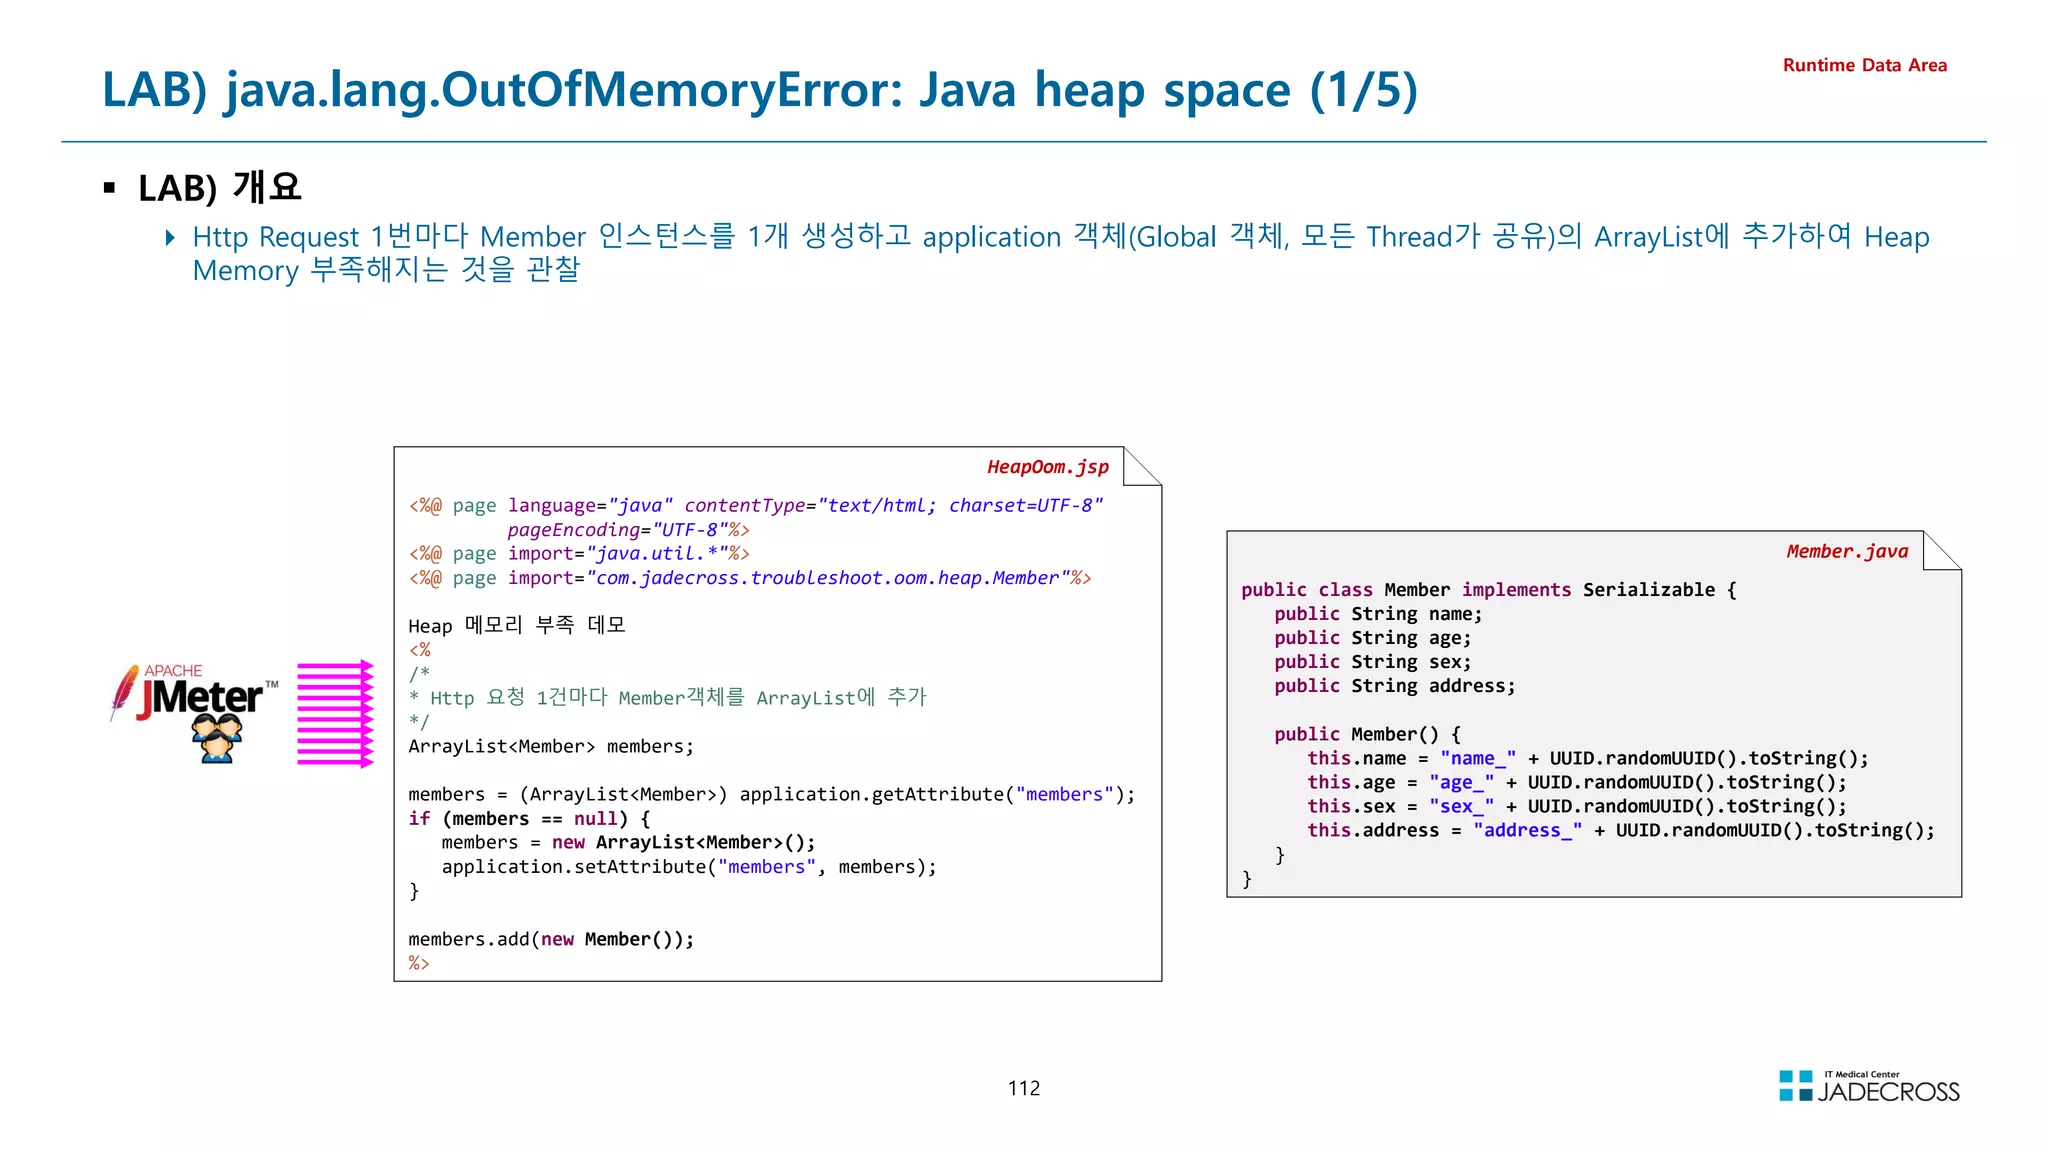
![113
LAB) java.lang.OutOfMemoryError: Java heap space (2/5)
Runtime Data Area
① STS 실행후 Tomcat v7.0 서버 실행
[root@jvmedu ~]# sts
② visualvm을 실행하고 visualgc 플러그인 설치
Applications 뷰에서 Local Tomcat 더블 클릭 Visual GC 탭 클릭
[root@jvmedu ~]# visualvm
③ “System Monitor”를 실행하고 Resources 탭을 클릭하여 메모리 상황 관찰
[root@jvmedu ~]# gnome-system-monitor
Permgen](https://image.slidesharecdn.com/jvm-230511085906-be6f1201/75/JVM_-pdf-113-2048.jpg)
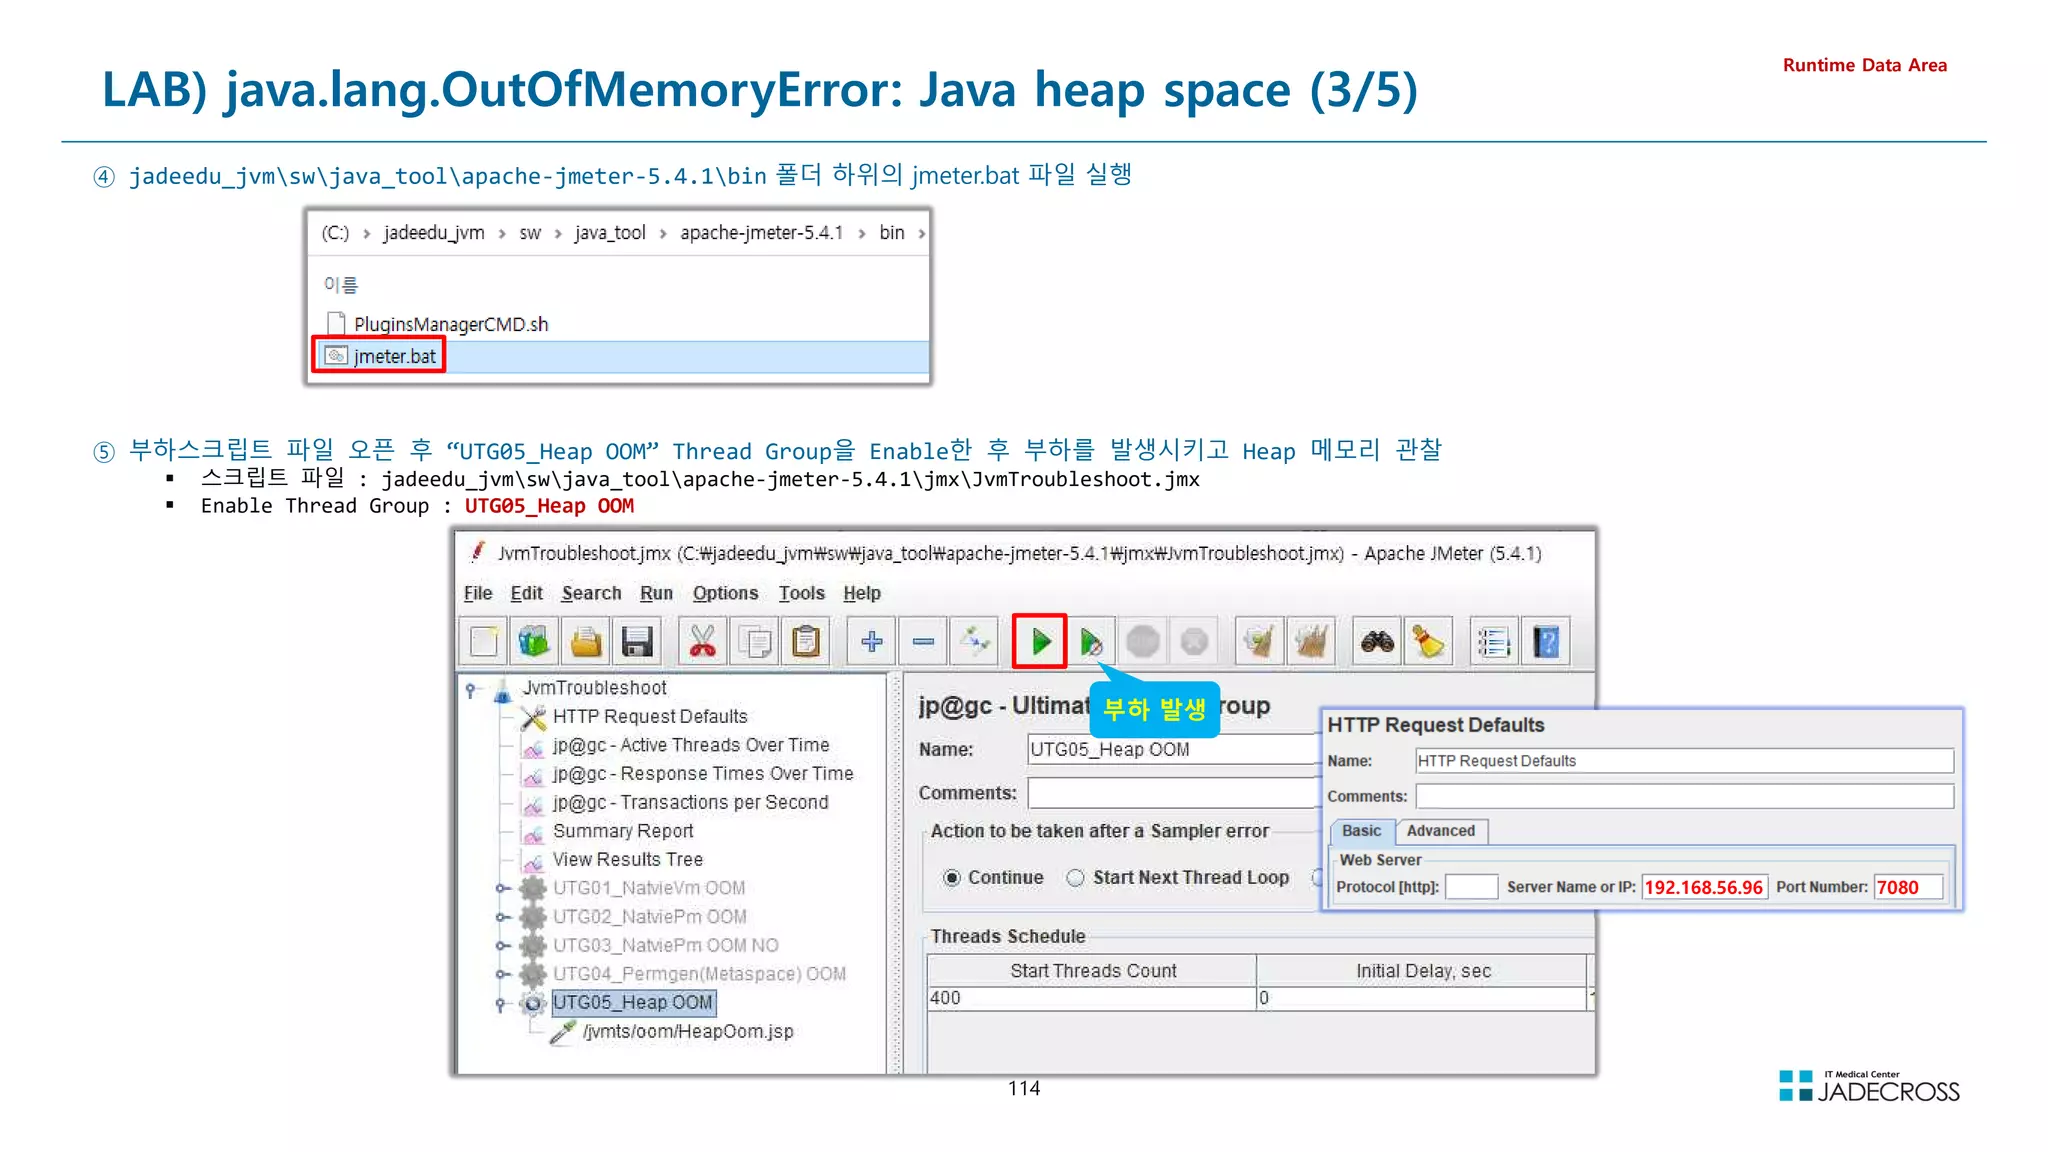
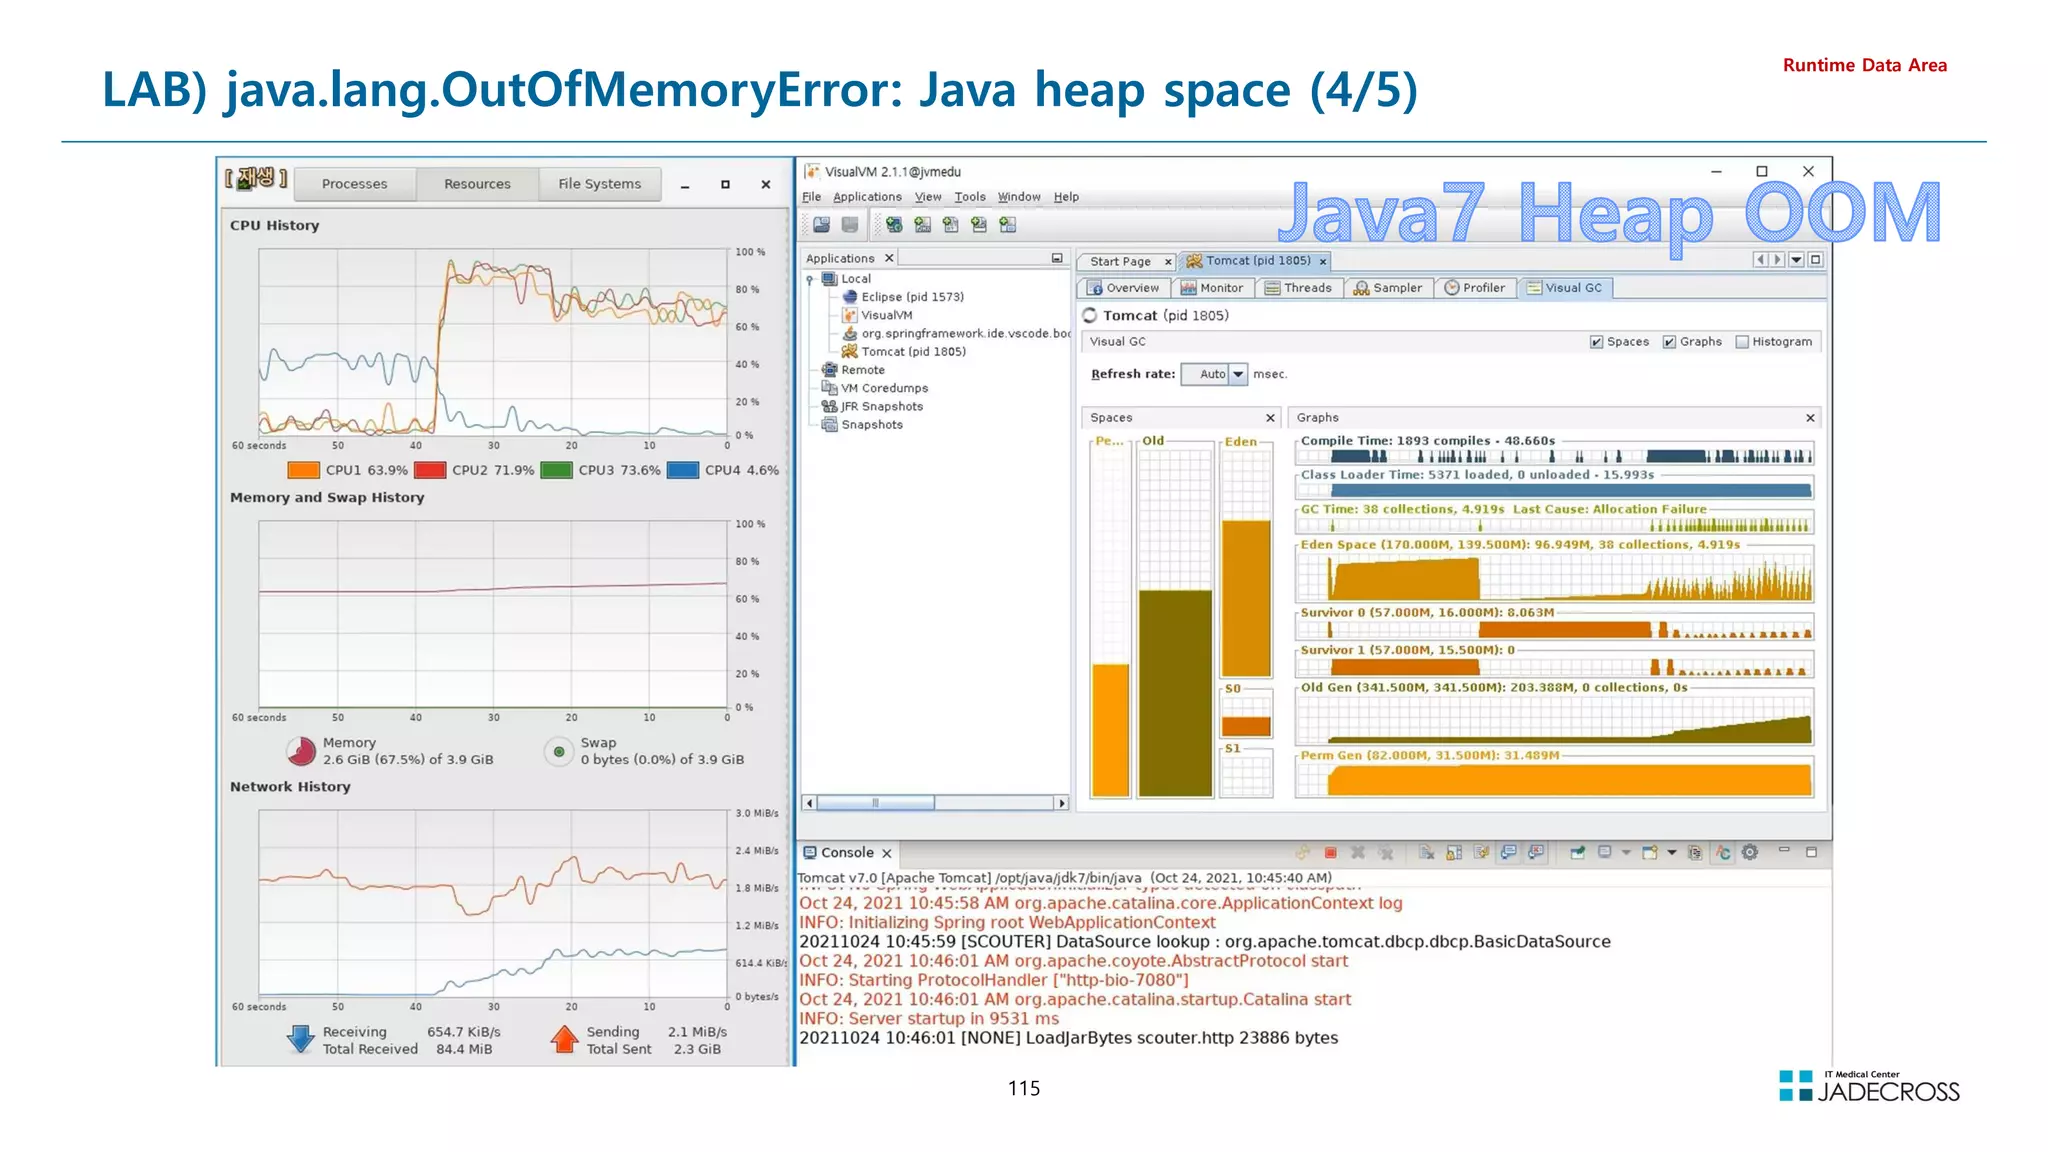
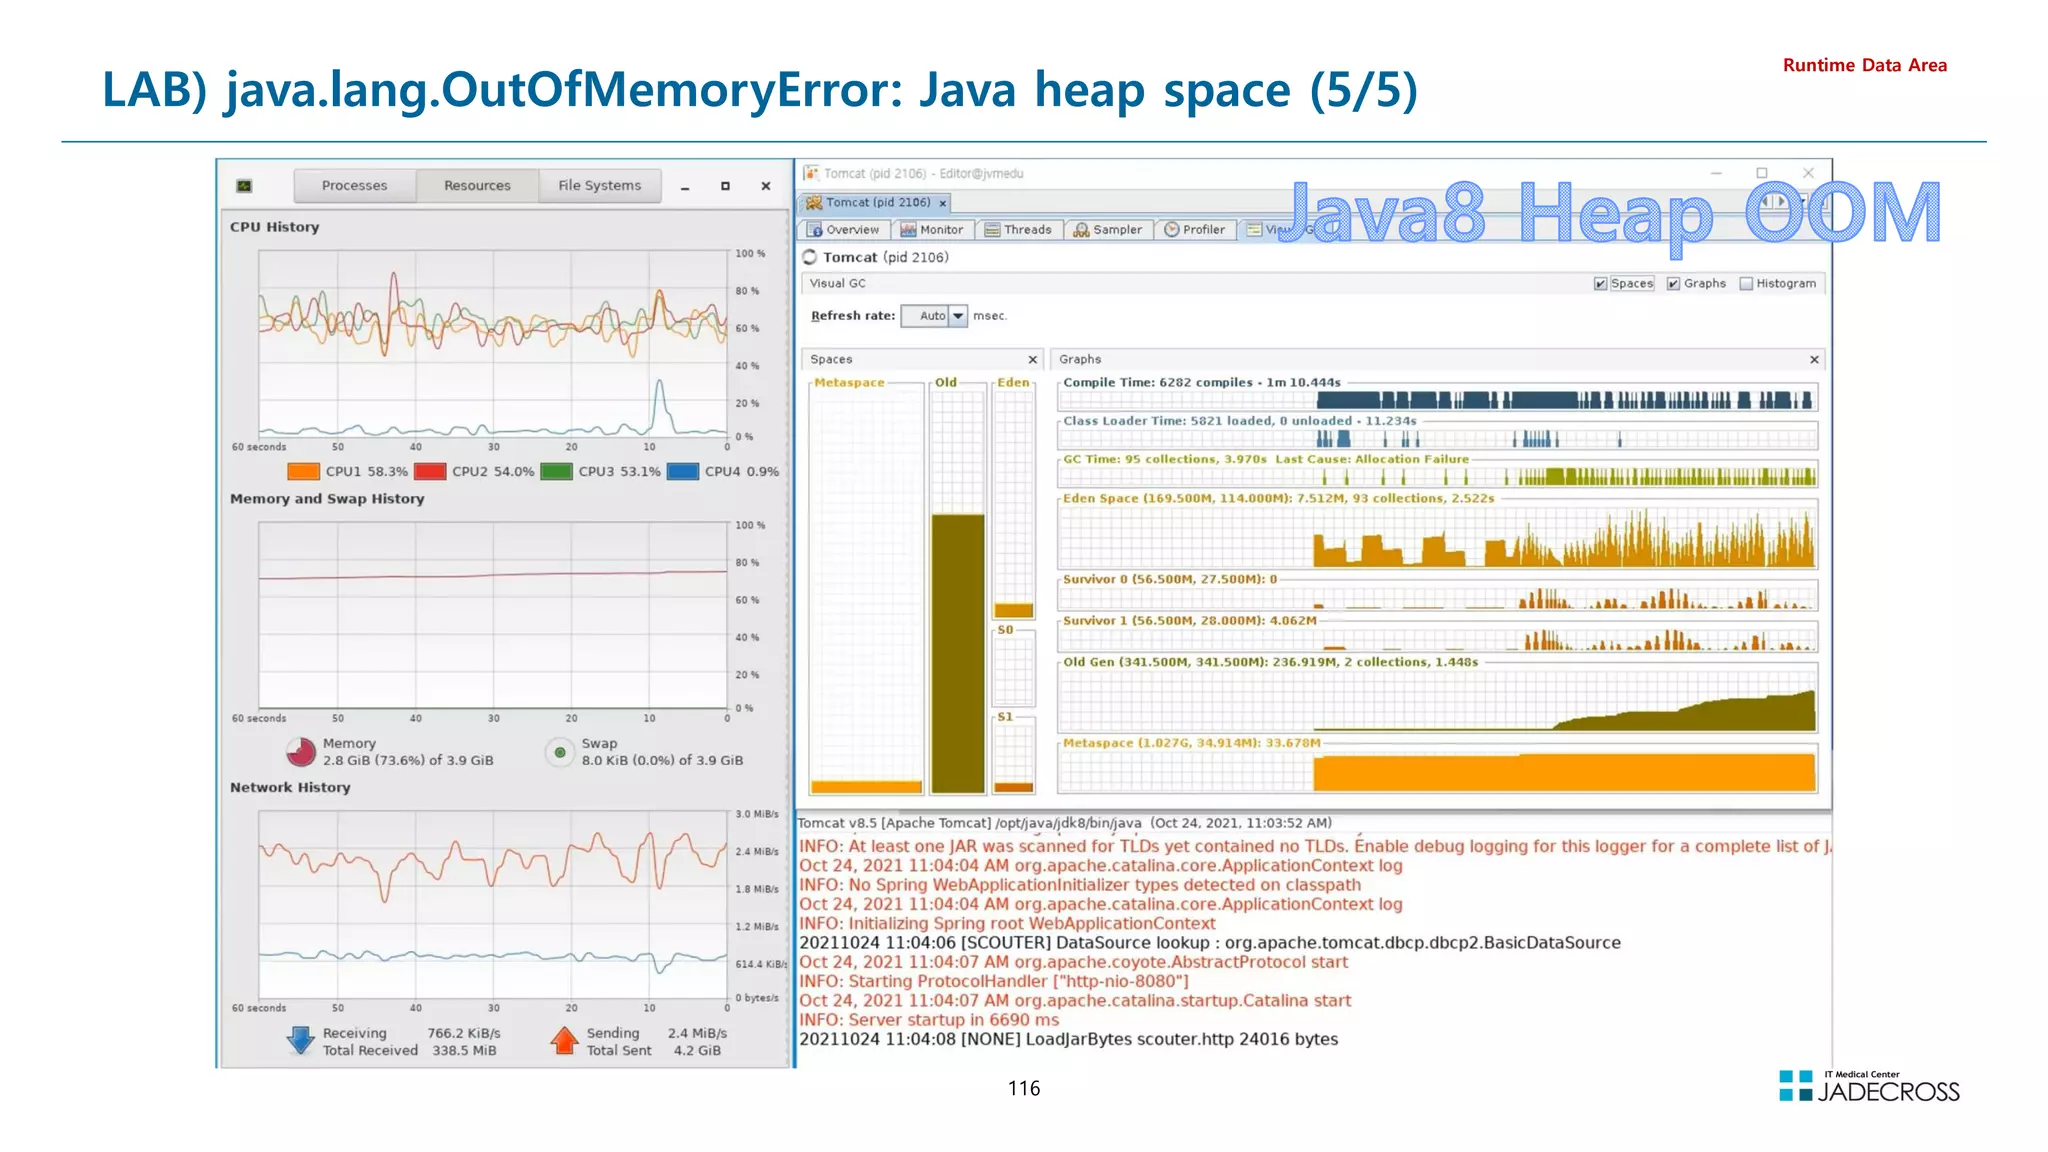
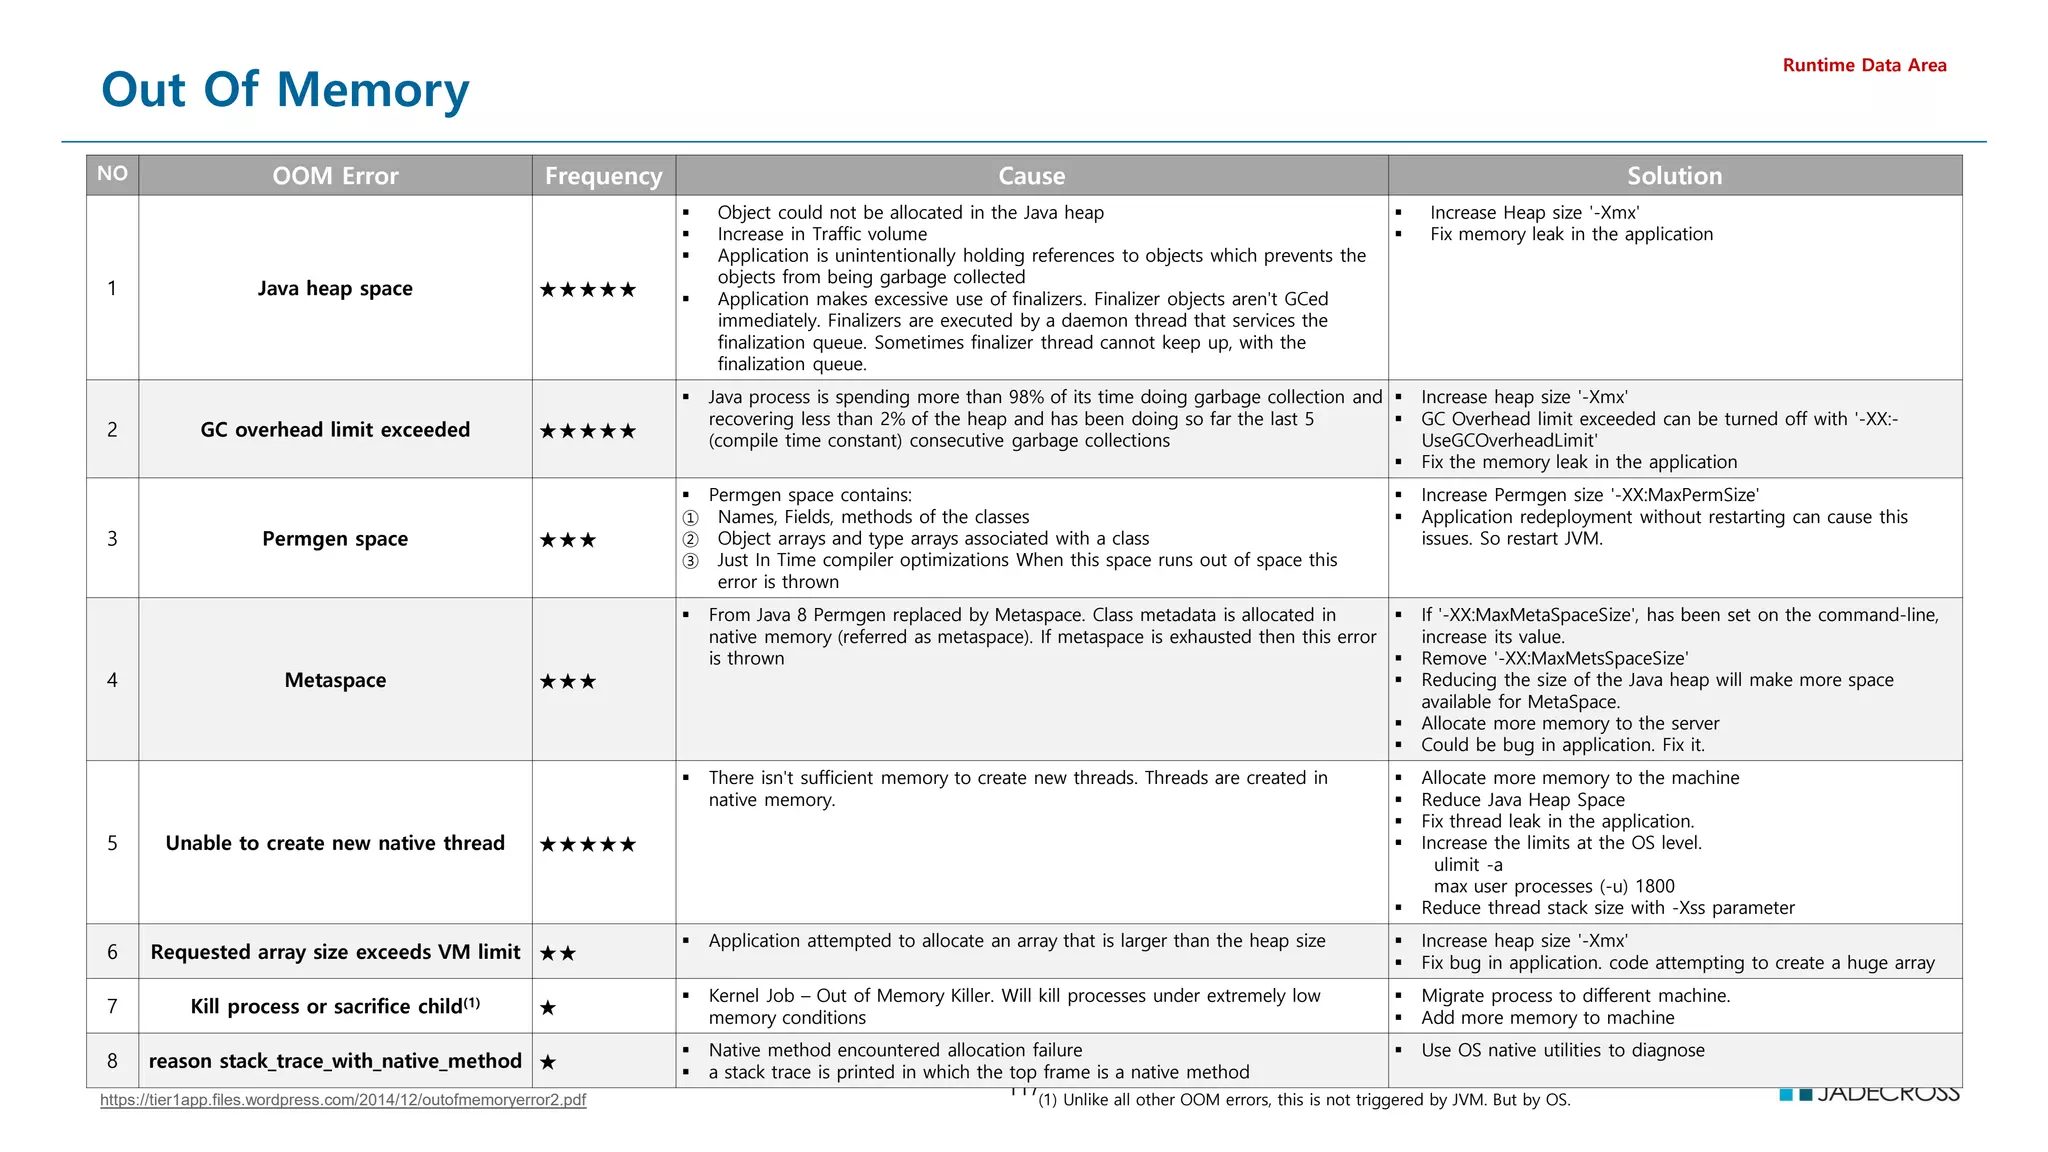
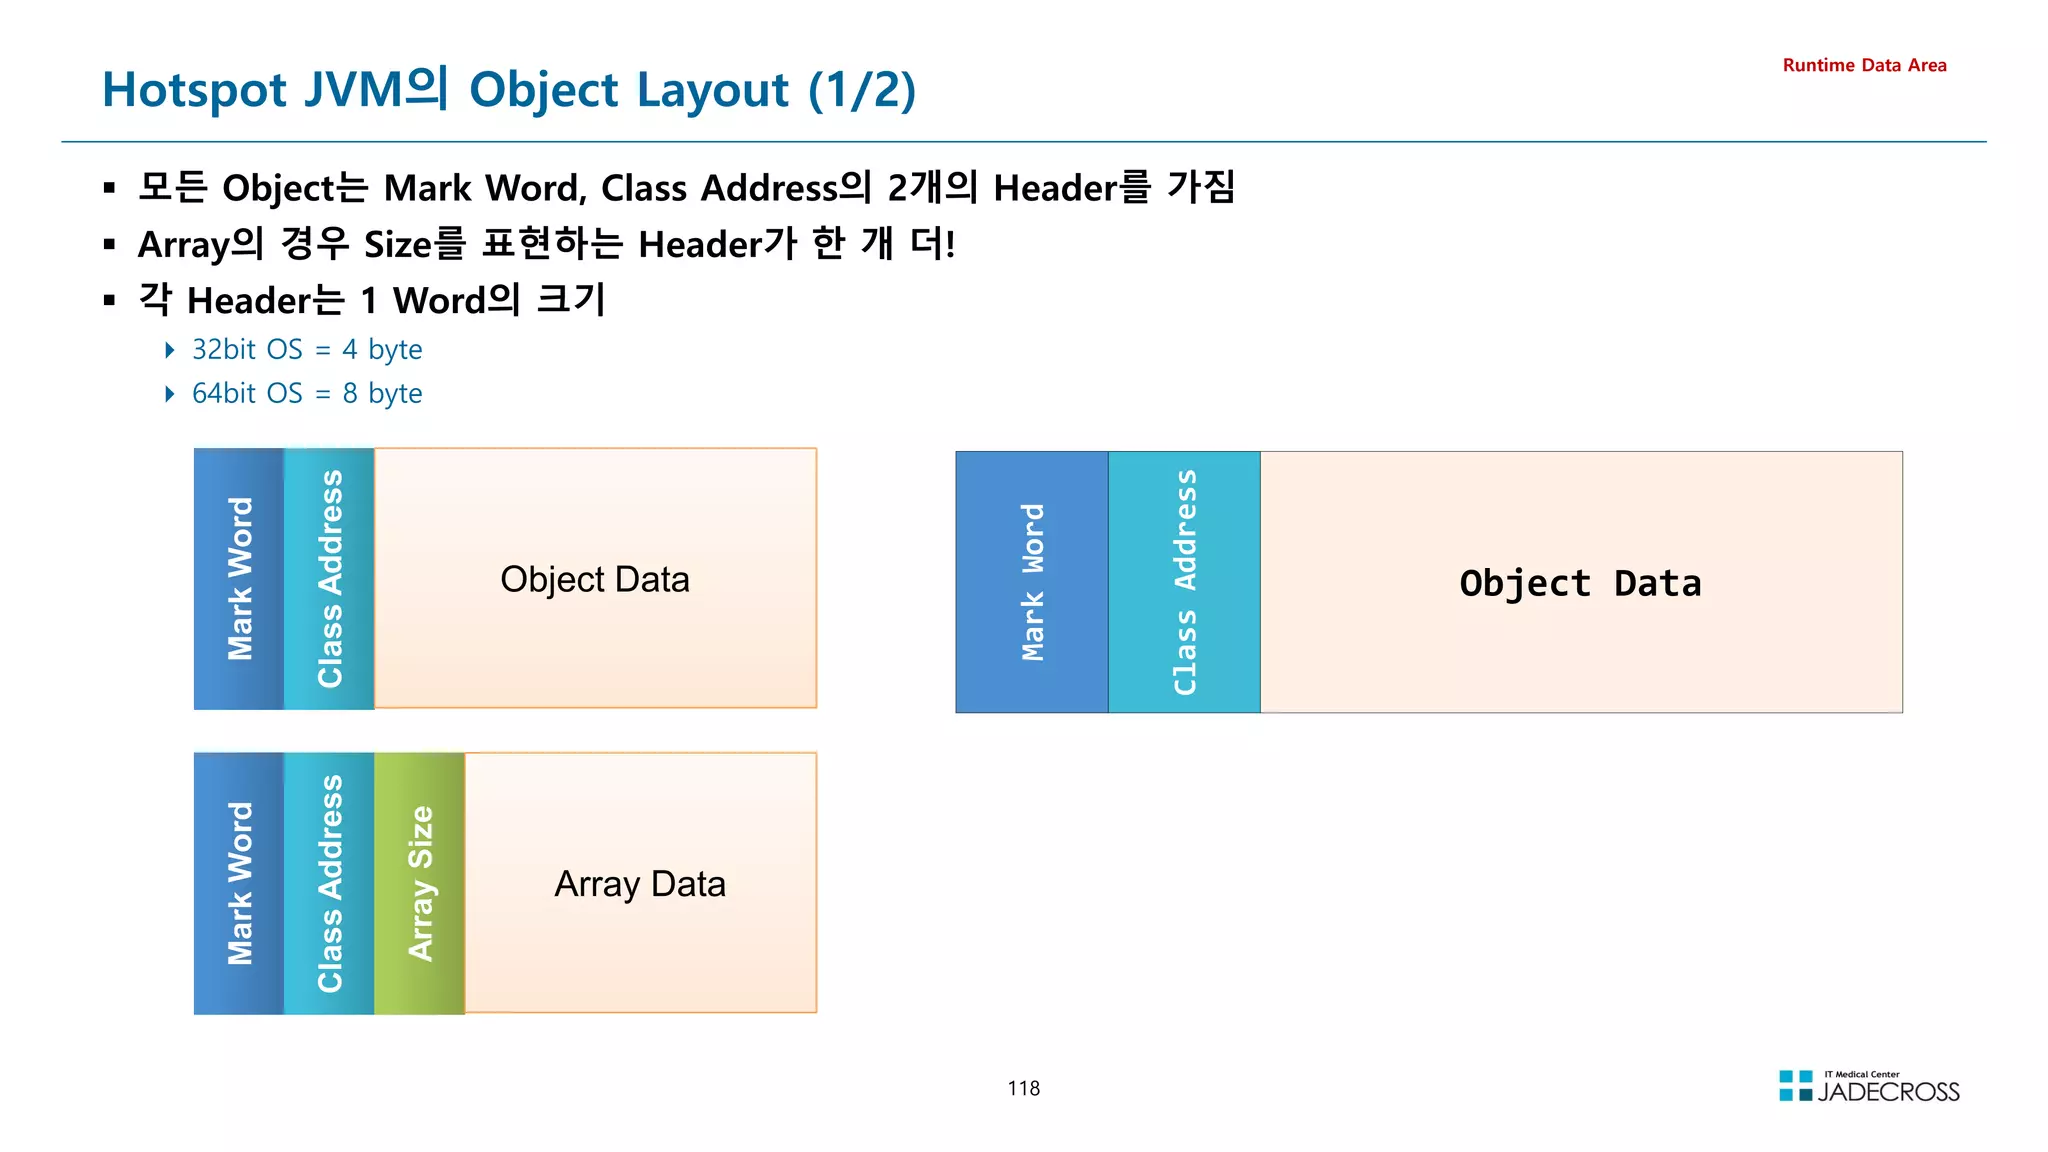
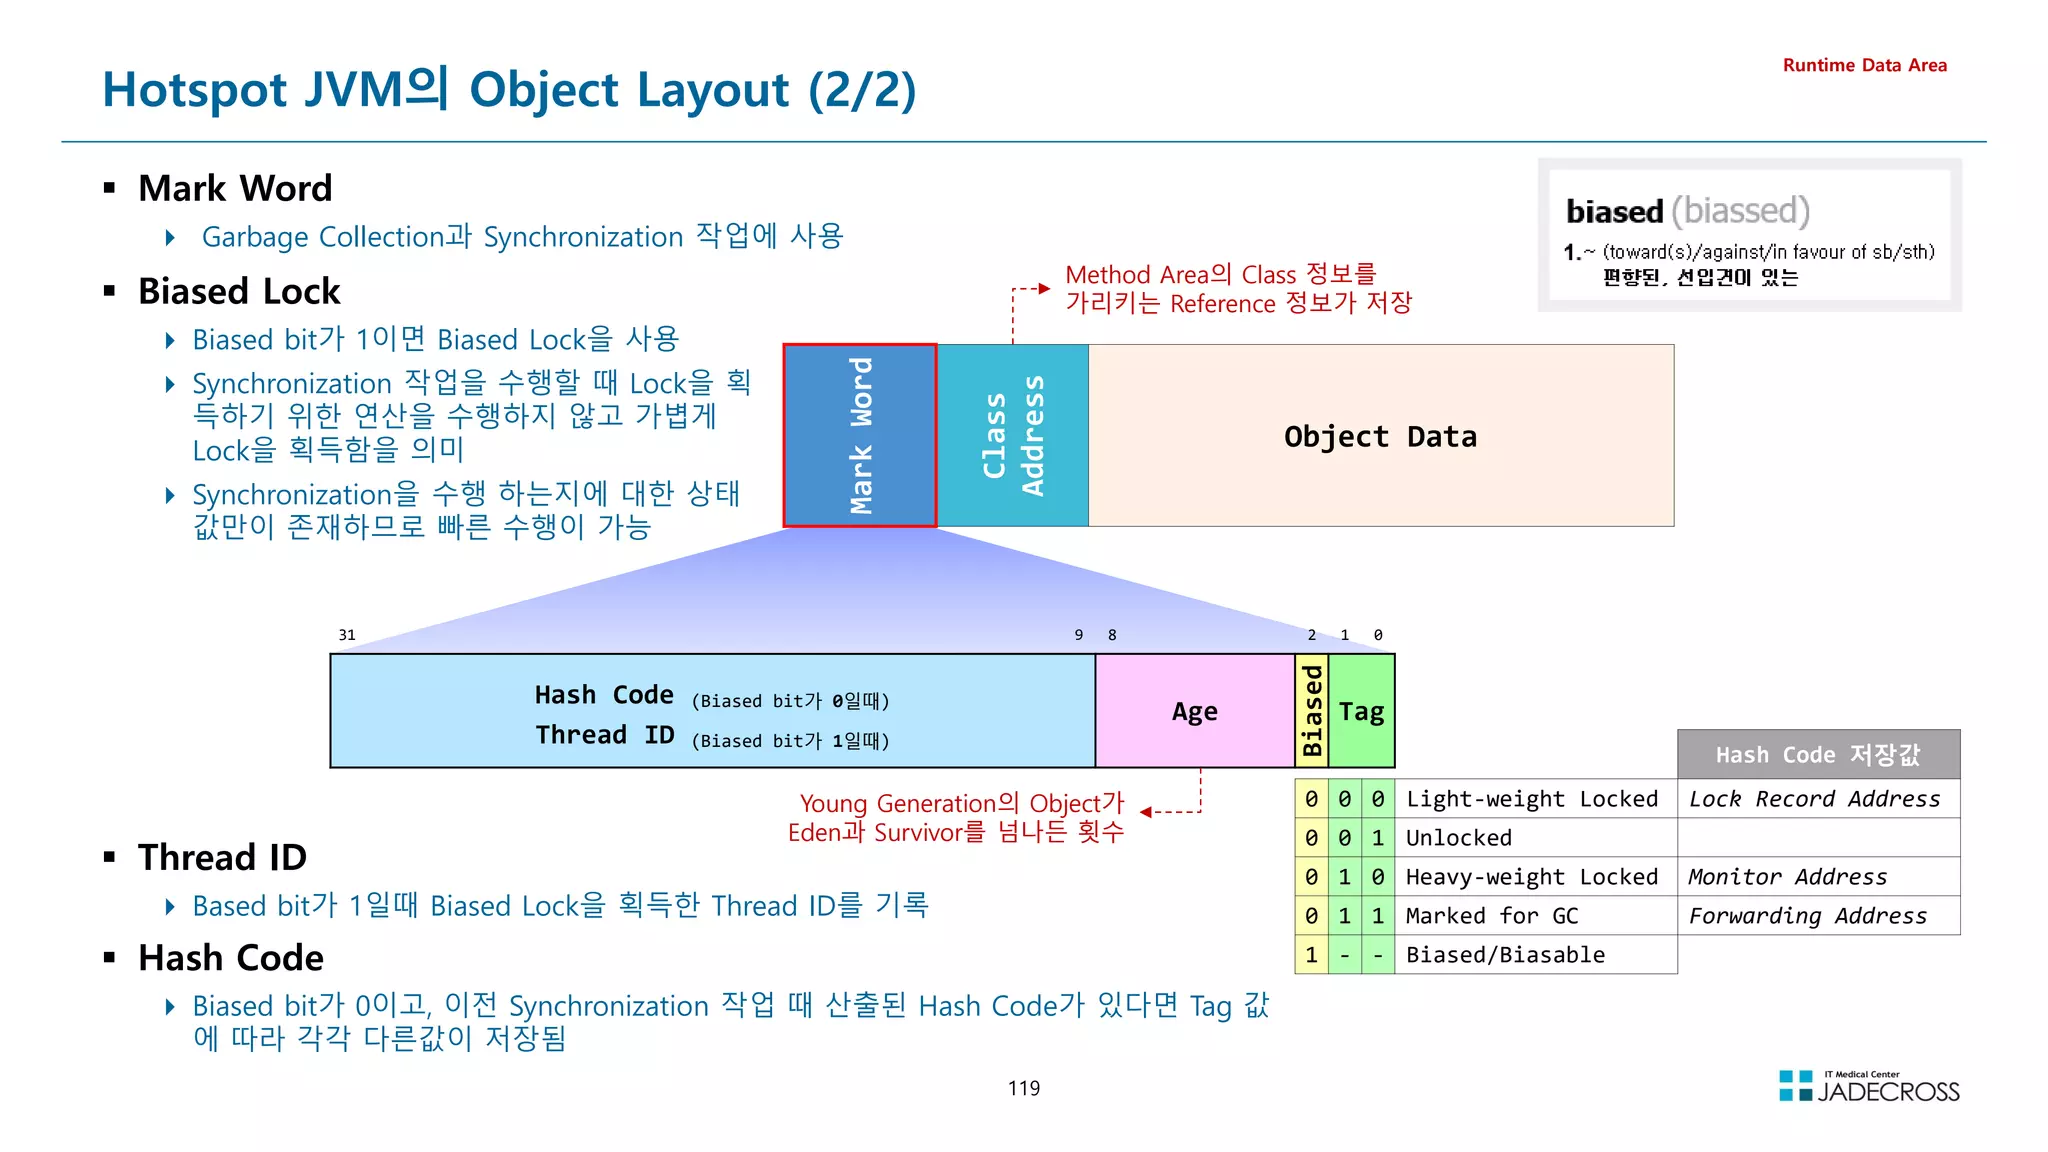
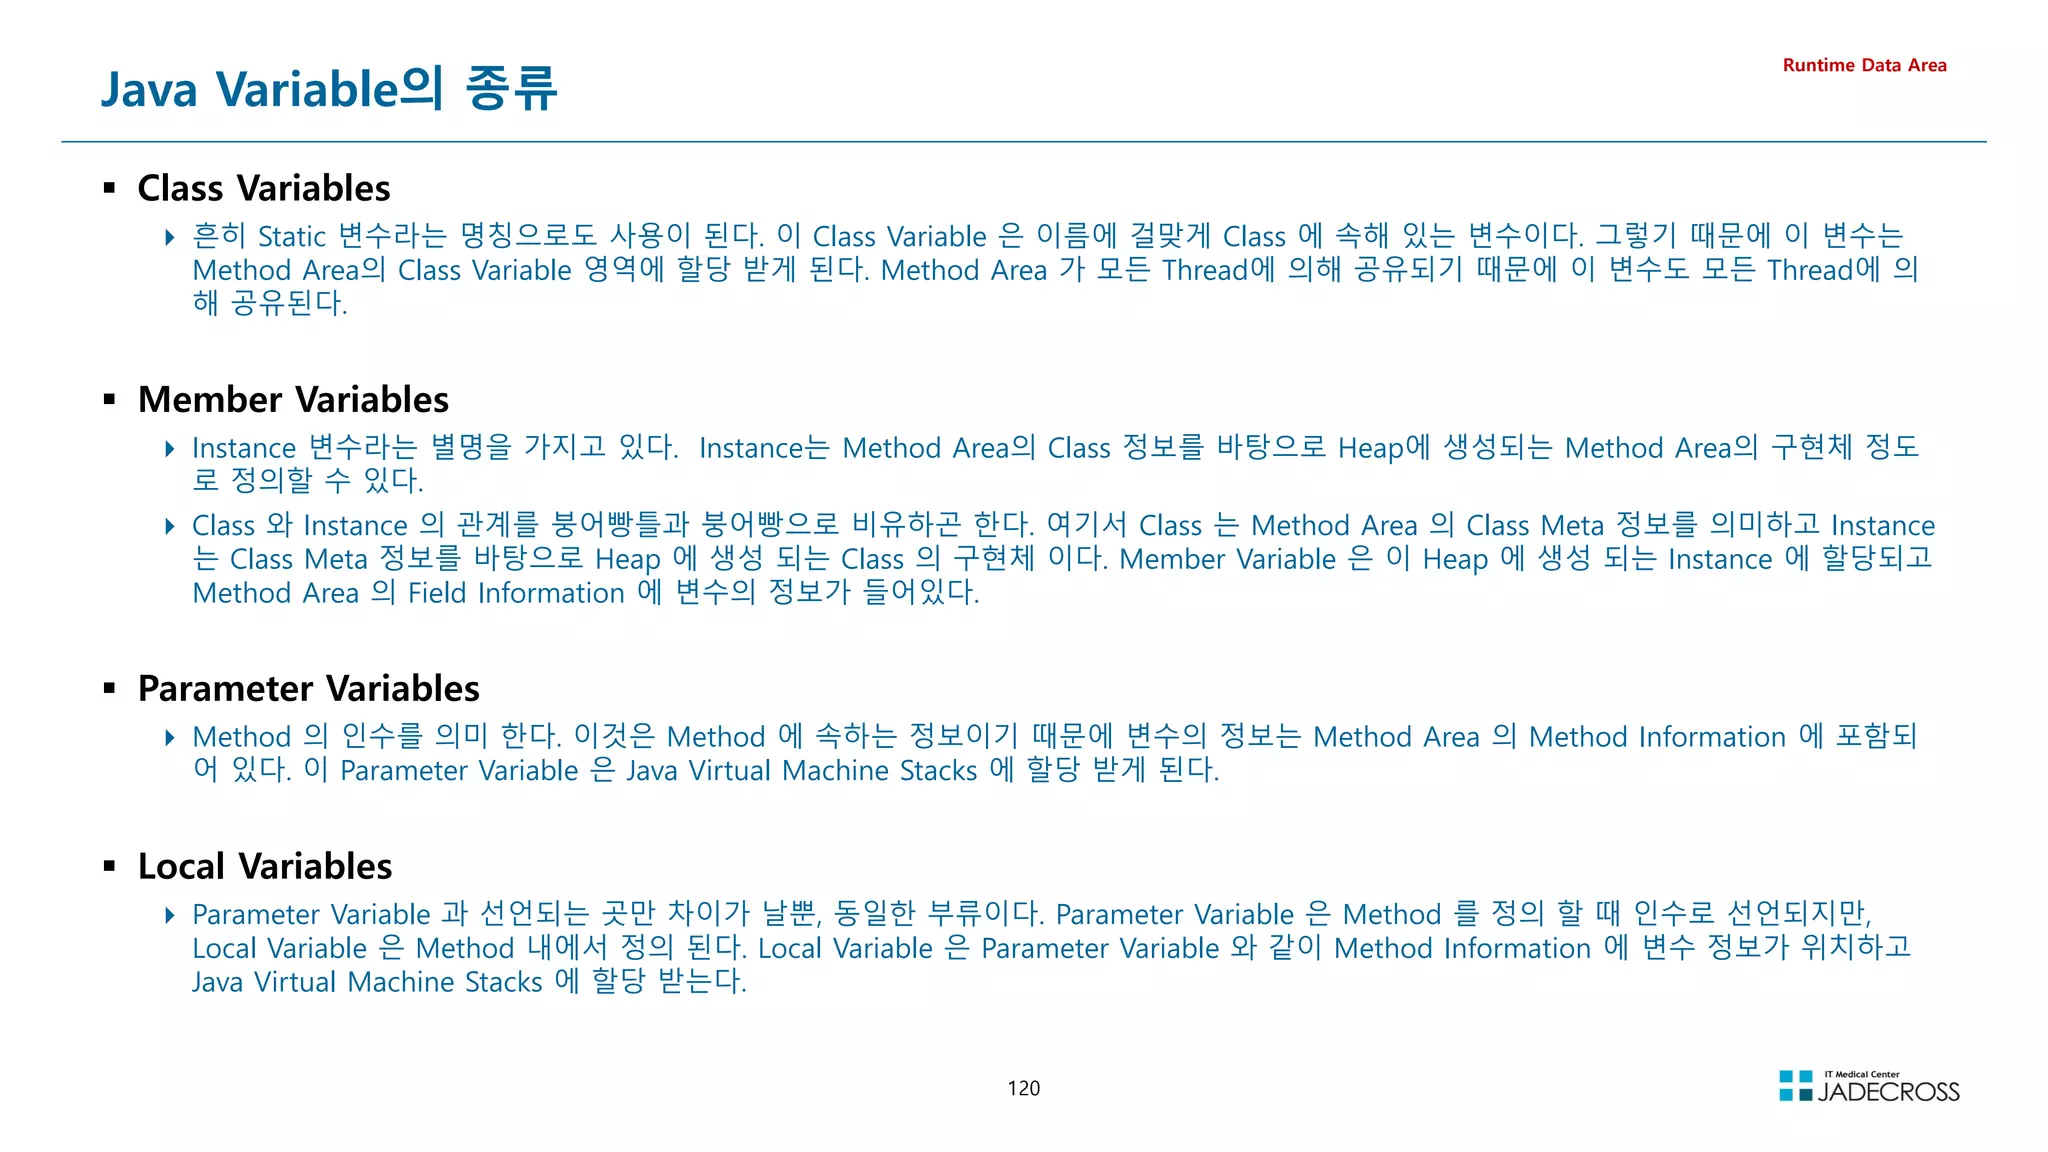
![121
Java Variable의 종류별 메모리 레이아웃
Runtime Data Area
public class VariableArrange {
static int ci = 3;
static String cs = Static;
int mi = 4;
String ms = Member;
void method(int pi, String ps) {
int li = 5;
String ls = Local;
}
}
// Compiled from VariableArrange.java (version 1.8 : 52.0, super bit)
public class VariableArrange {
// Field descriptor #6 I
static int ci;
// Field descriptor #8 Ljava/lang/String;
static java.lang.String cs;
// Field descriptor #6 I
int mi;
// Field descriptor #8 Ljava/lang/String;
java.lang.String ms;
// Method descriptor #12 ()V
// Stack: 1, Locals: 0
static {};
0 iconst_3
1 putstatic VariableArrange.ci : int [14]
4 ldc String Static [16]
6 putstatic VariableArrange.cs : java.lang.String [18]
9 return
Line numbers:
[pc: 0, line: 3]
[pc: 4, line: 4]
// Method descriptor #12 ()V
// Stack: 2, Locals: 1
public VariableArrange();
0 aload_0 [this]
1 invokespecial java.lang.Object() [23]
4 aload_0 [this]
5 iconst_4
6 putfield VariableArrange.mi : int [25]
9 aload_0 [this]
10 ldc String Member [27]
12 putfield VariableArrange.ms : java.lang.String [29]
15 return
Line numbers:
[pc: 0, line: 2]
[pc: 4, line: 5]
[pc: 9, line: 6]
[pc: 15, line: 2]
Local variable table:
[pc: 0, pc: 16] local: this index: 0 type: VariableArrange
// Method descriptor #34 (ILjava/lang/String;)V
// Stack: 1, Locals: 5
void method(int pi, java.lang.String ps);
0 iconst_5
1 istore_3 [li]
2 ldc String Loca1 [35]
4 astore 4 [ls]
6 return
Line numbers:
[pc: 0, line: 9]
[pc: 2, line: 10]
[pc: 6, line: 11]
Local variable table:
[pc: 0, pc: 7] local: this index: 0 type: VariableArrange
[pc: 0, pc: 7] local: pi index: 1 type: int
[pc: 0, pc: 7] local: ps index: 2 type: java.lang.String
[pc: 2, pc: 7] local: li index: 3 type: int
[pc: 6, pc: 7] local: ls index: 4 type: java.lang.String
}
Compile
ByteCode](https://image.slidesharecdn.com/jvm-230511085906-be6f1201/75/JVM_-pdf-121-2048.jpg)
![122
Runtime Data Areas Simulation (1/2)
Runtime Data Area
Java Code Byte Code
public class JvmInternal {
static int cv = 0;
final static int fcv = 100;
public static void main(String[] args) {
int a, b, c;
a = Integer.parseInt(args[0]);
b = Integer.parseInt(args[1]);
c = addTwoArgs(a, b);
}
static int addTwoArgs(int x, int y) {
cv = fcv;
return (x + y);
}
}
public class JvmInternal {
static int cv;
static final int fcv;
static {};
Code:
0: iconst_0
1: putstatic #13 // Field cv:I
4: return
public JvmInternal();
Code:
0: aload_0
1: invokespecial #18 // Method java/lang/Object.init:()V
4: return
public static void main(java.lang.String[]);
Code:
0: aload_0
1: iconst_0
2: aaload
3: invokestatic #24 // Method java/lang/Integer.parseInt:(Ljava/lang/String;)I
6: istore_1
7: aload_0
8: iconst_1
9: aaload
10: invokestatic #24 // Method java/lang/Integer.parseInt:(Ljava/lang/String;)I
13: istore_2
14: iload_1
15: iload_2
16: invokestatic #30 // Method addTwoArgs:(II)I
19: istore_3
20: return
static int addTwoArgs(int, int);
Code:
0: bipush 100
2: putstatic #13 // Field cv:I
5: iload_0
6: iload_1
7: iadd
8: ireturn
}
Presentation
https://youtu.be/1fuavjAjBo0](https://image.slidesharecdn.com/jvm-230511085906-be6f1201/75/JVM_-pdf-122-2048.jpg)
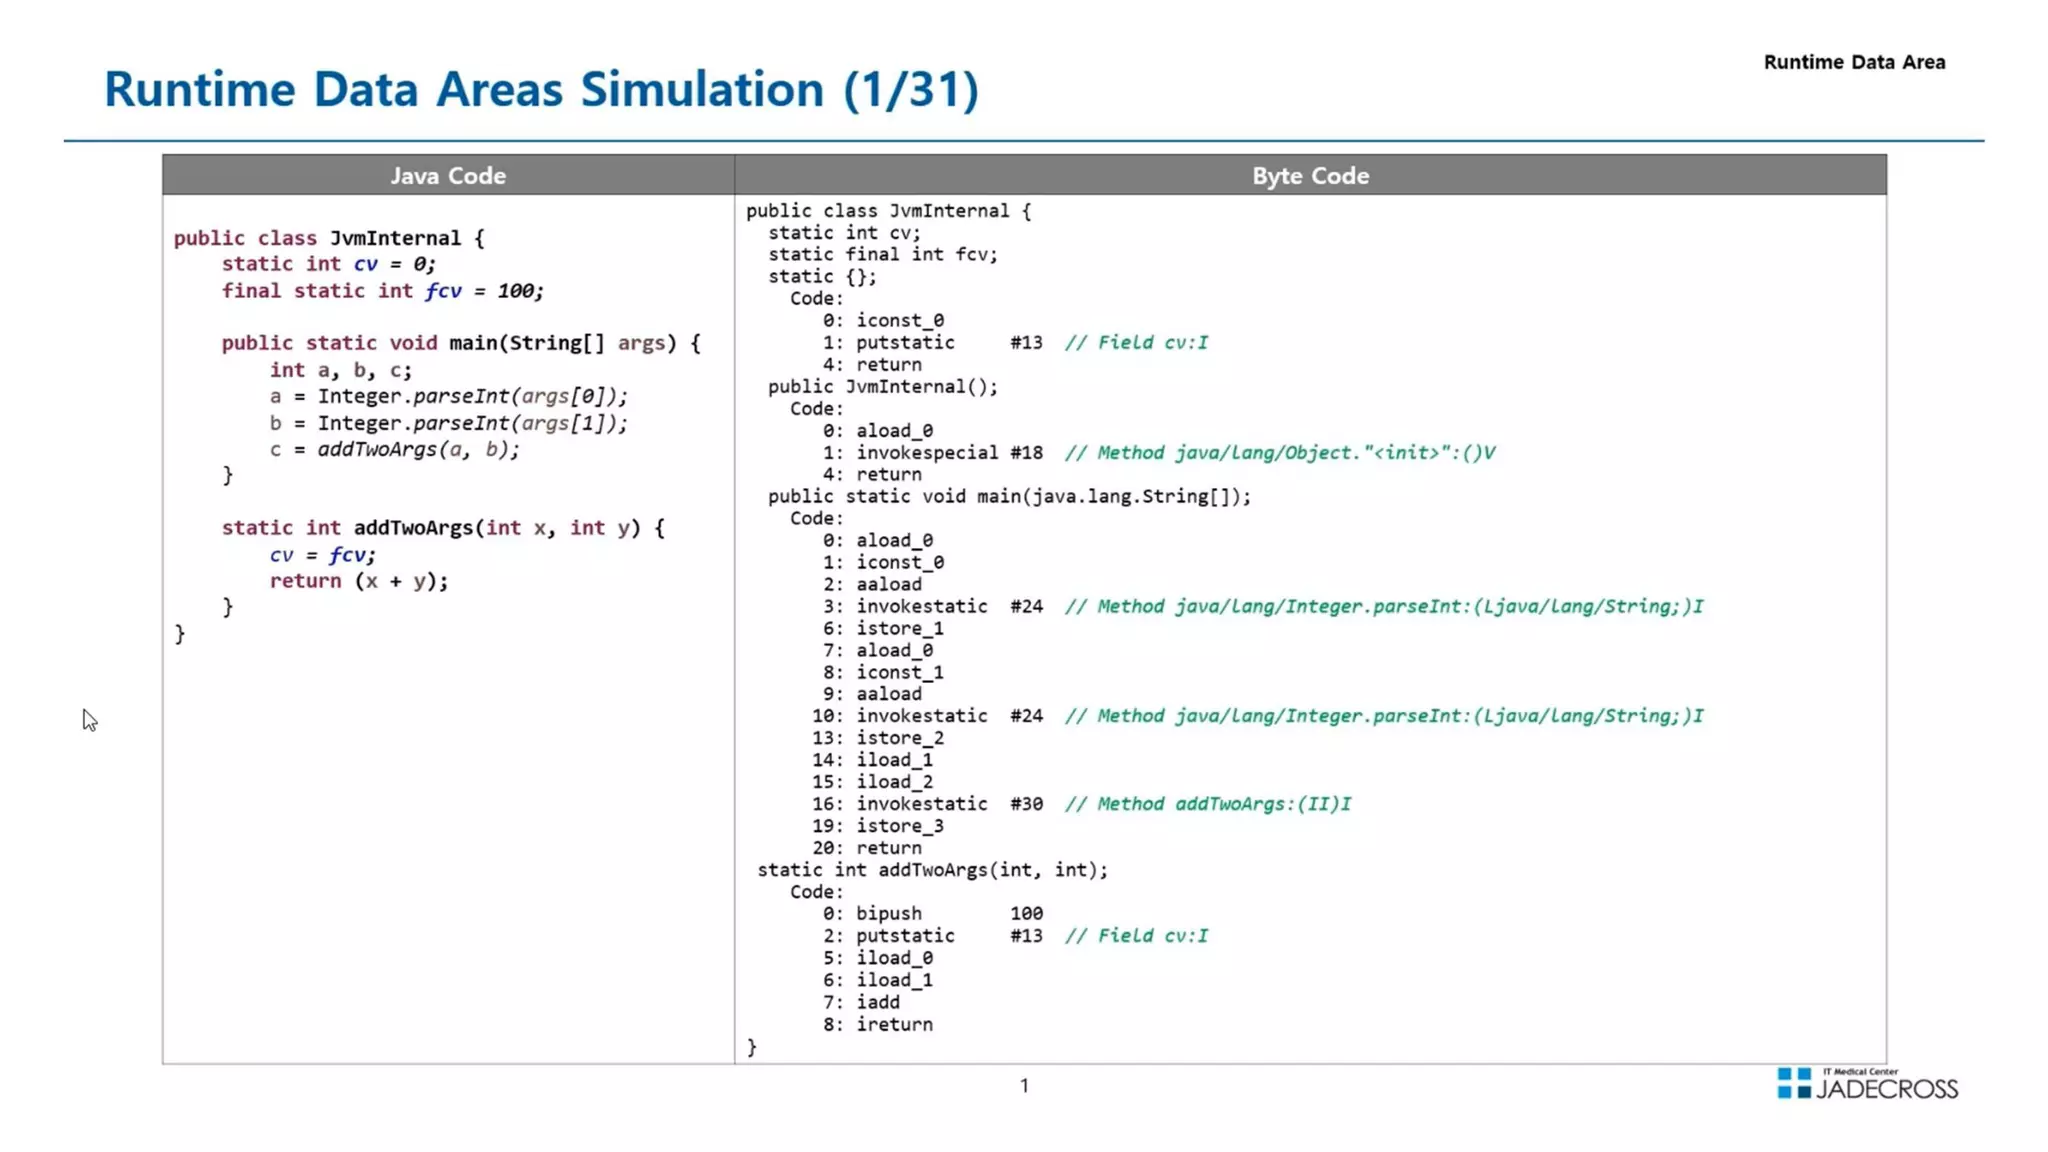
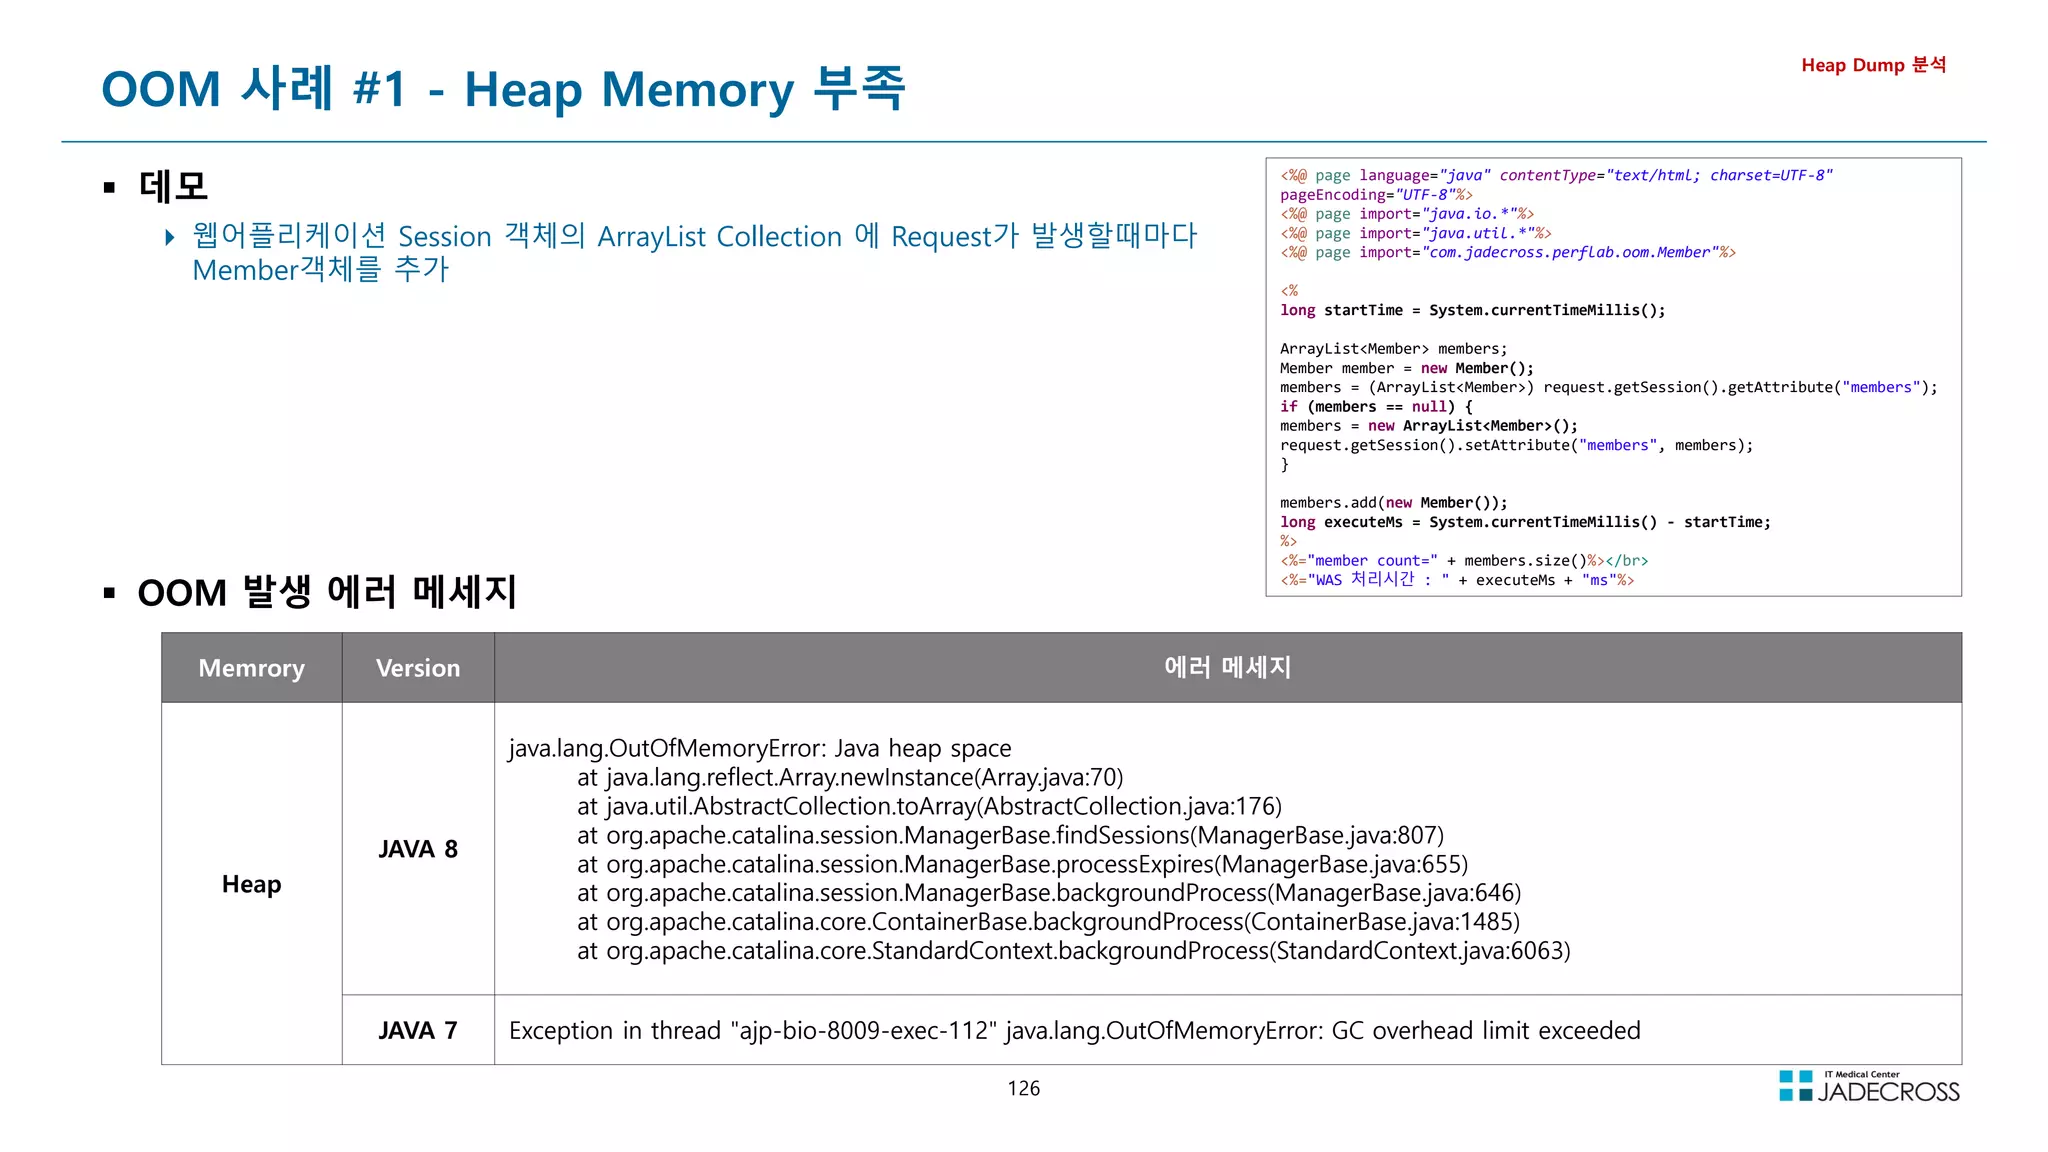
![127
OOM 사례 #2 - PermGen(=Metaspace) Memory 부족
데모
jsp 페이지가 호출될때마다 동적으로 jsp파일을 새로 만들고 호출
하여 로딩되는 class를 증가
Heap Dump 분석
Memrory Version 에러 메세지
PermGen
또는
Metaspace
JAVA 7 20191214 09:44:07 [A146] java.lang.OutOfMemoryError: PermGen space
JAVA 8 java.lang.OutOfMemoryError: Metaspace
%@ page language=java contentType=text/html; charset=UTF-8 pageEncoding=UTF-8%
%@ page import=java.io.*%
%@ page import=java.nio.channels.*%
%@ page import=java.util.*%
%
String contextRoot = getServletContext().getRealPath(/);
String newJspName = C_ + UUID.randomUUID().toString().replace(-, ) + .jsp;
// 01. 신규 JSP 파일 생성
fileCopy(contextRoot + 03_oom/jdbc_sample.jsp, contextRoot + 03_oom/temp_jsp/ + newJspName);
// 02. 신규 JSP 파일로 이동
request.getRequestDispatcher(temp_jsp/ + newJspName).forward(request, response);
%
%!
public void fileCopy(String orgFilePath, String newFilePath) {
File orgFile = new File(orgFilePath);
try {
FileInputStream inputStream = new FileInputStream(orgFile);
FileOutputStream outputStream = new FileOutputStream(newFilePath);
FileChannel fcin = inputStream.getChannel();
FileChannel fcout = outputStream.getChannel();
long size = fcin.size();
fcin.transferTo(0, size, fcout);
fcout.close();
fcin.close();
outputStream.close();
inputStream.close();
} catch (Exception e) {}
}%
OOM 발생 에러 메세지](https://image.slidesharecdn.com/jvm-230511085906-be6f1201/75/JVM_-pdf-127-2048.jpg)
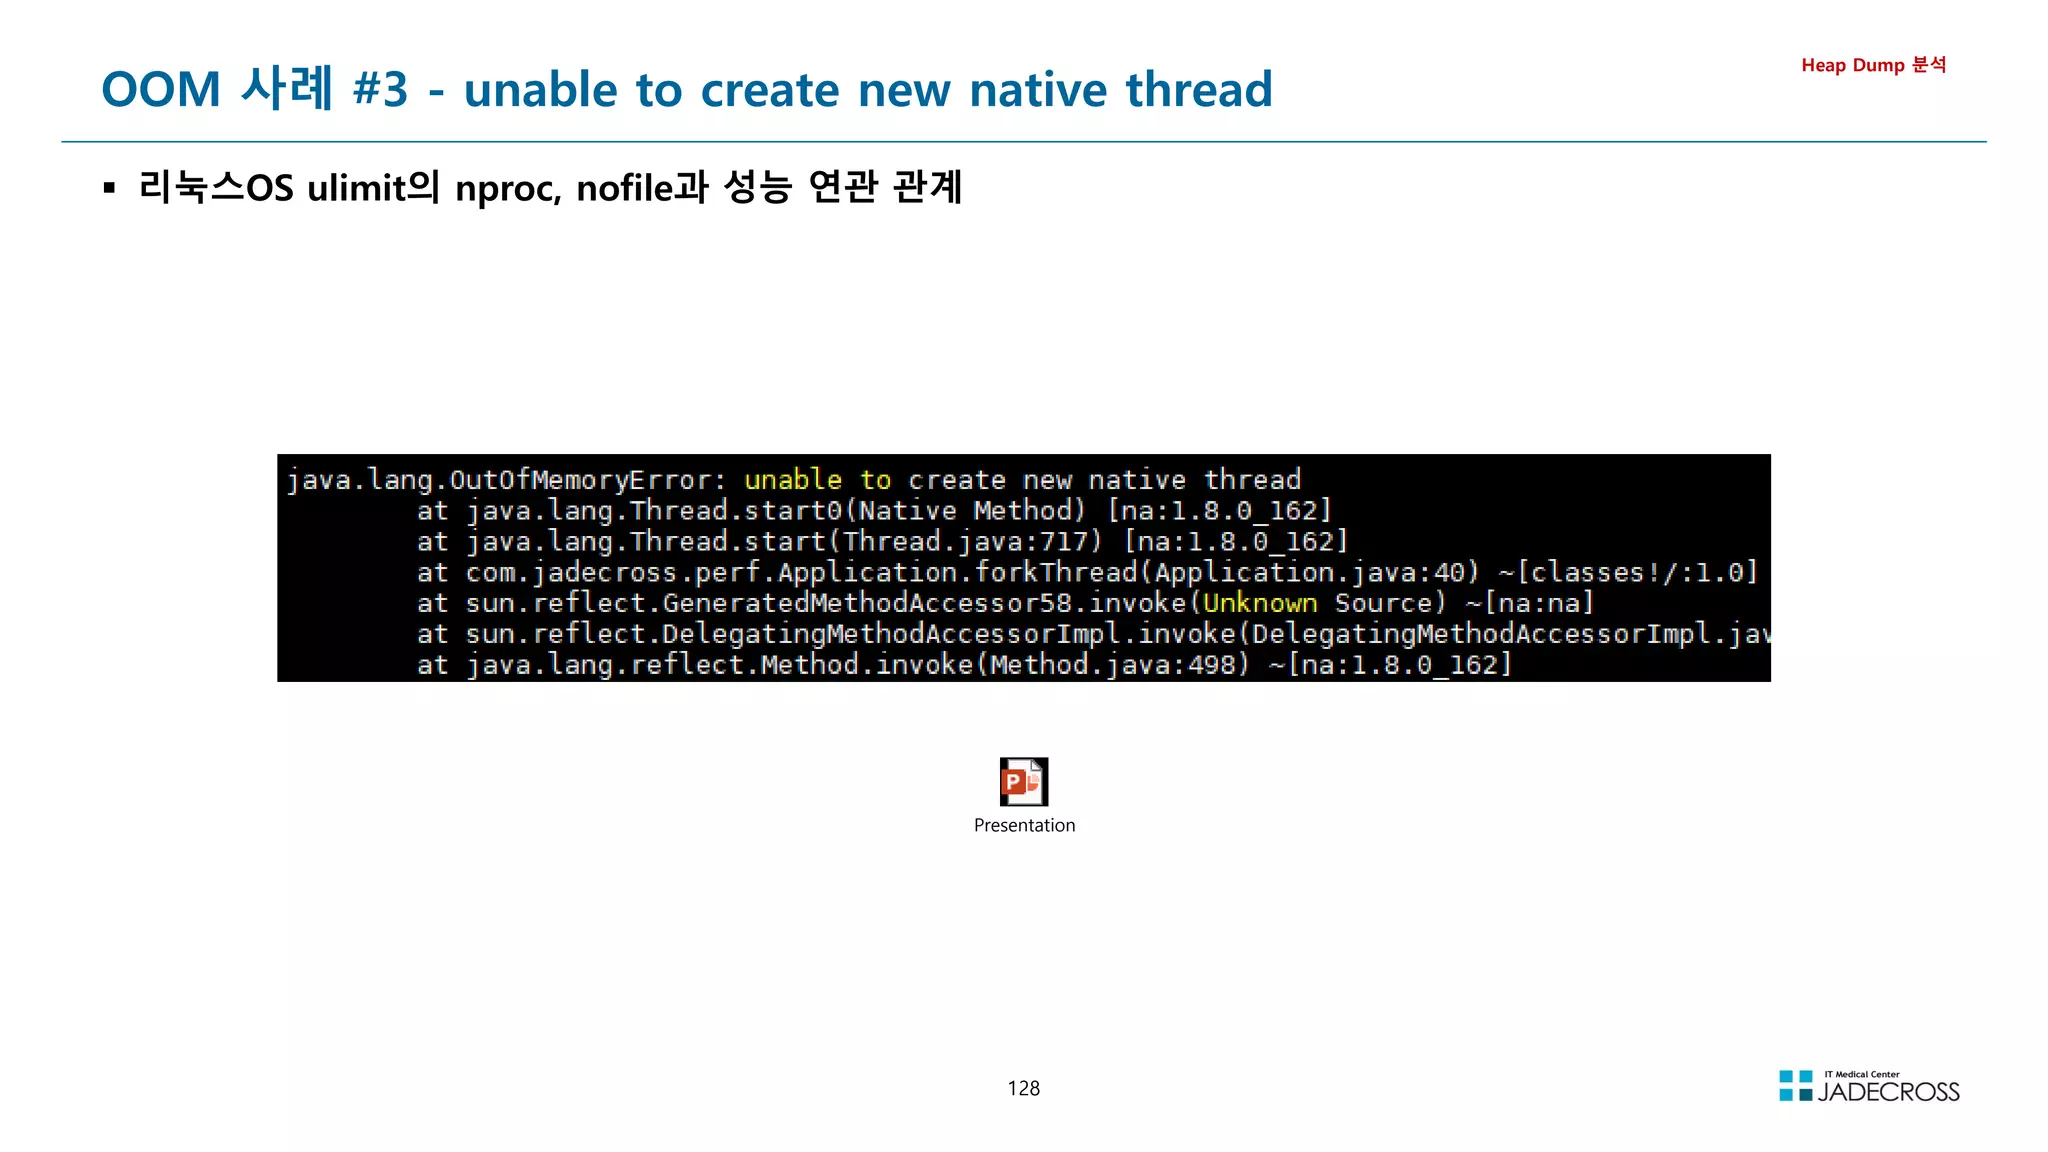
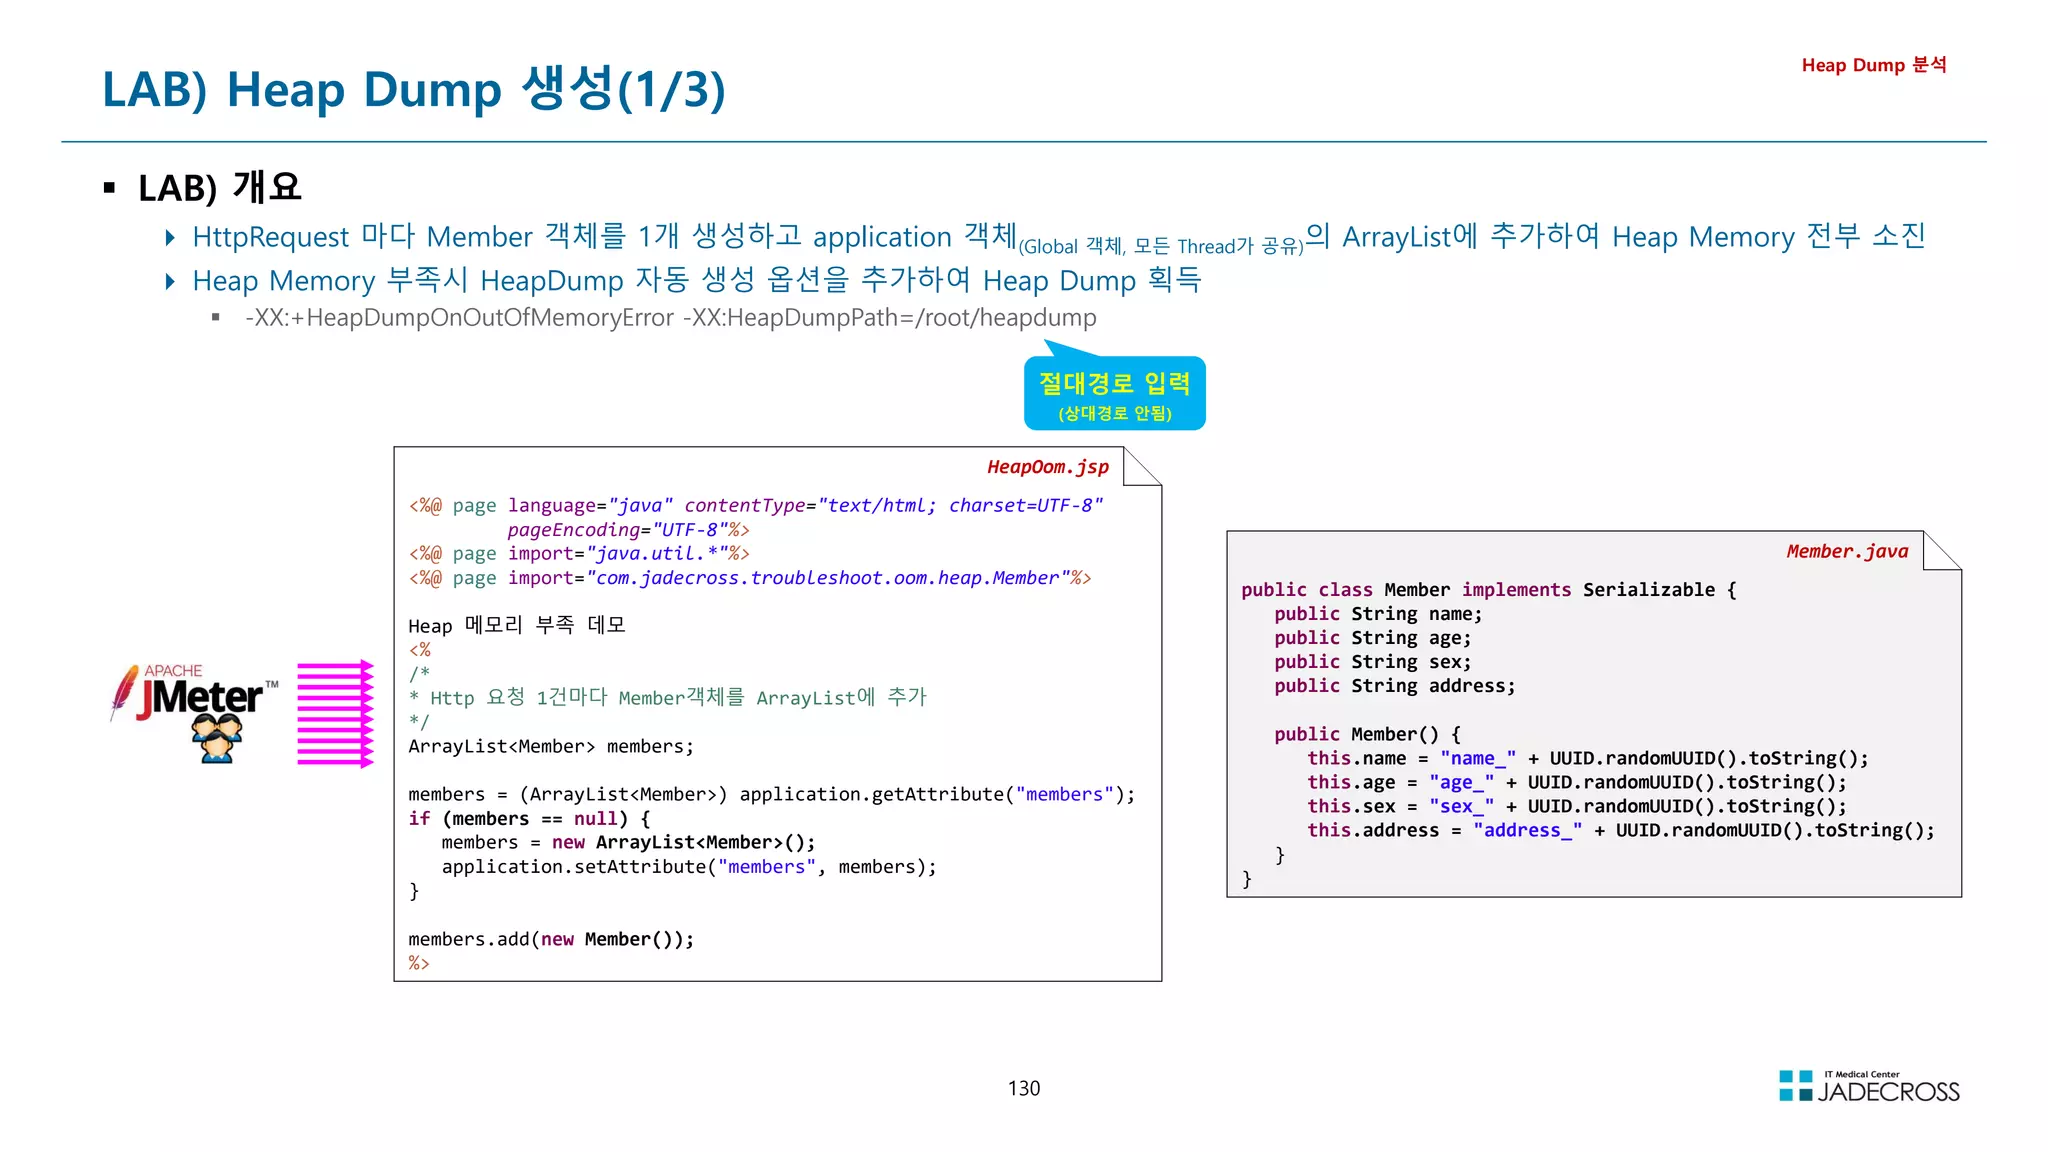
![131
① STS 실행후 Tomcat v7.0 서버에 “HeapDump 자동 생성” 옵션 추가 후 서버 시작
-XX:+HeapDumpOnOutOfMemoryError -XX:HeapDumpPath=/root/heapdump
[root@jvmedu ~]# sts
② visualvm 실행
Applications 뷰에서 Local Tomcat 더블 클릭 Visual GC 탭 클릭
[root@jvmedu ~]# visualvm
LAB) Heap Dump 생성(2/3)
Heap Dump 분석
Permgen](https://image.slidesharecdn.com/jvm-230511085906-be6f1201/75/JVM_-pdf-131-2048.jpg)
![132
LAB) Heap Dump 생성(3/3)
Heap Dump 분석
③ jadeedu_jvmswjava_toolapache-jmeter-5.4.1bin 폴더 하위의 jmeter.bat 파일 실행
④ 부하스크립트 파일 오픈 후 “UTG05_Heap OOM” Thread Group을 Enable하고 Heap Dump가 자동으로 생성될때까지 부하를 발생
스크립트 파일 : jadeedu_jvmswjava_toolapache-jmeter-5.4.1jmxJvmTroubleshoot.jmx
Enable Thread Group : UTG05_Heap OOM
⑤ ~/heapdump 하위에 생성도 HeapDump 파일 확인
[root@jvmedu ~]# ls -lh ~/heapdump
total 708M
-rw------- 1 root root 708M Oct 24 16:04 java_pid1518.hprof
부하 발생](https://image.slidesharecdn.com/jvm-230511085906-be6f1201/75/JVM_-pdf-132-2048.jpg)
![133
Heap Dump 개요
왜 분석하나?
메모리를 많이 사용하는 객체를 찾을때
메모리 누수를 유발시키는 특정 객체를 찾을때
GC되어 메모리에서 사라져야할 객체(A객체)가 사용되지도 않는데, 특정
객체(B 객체)에서 사용되지 않는 객체(A 객체)를 계속 참조하고 있으면 메모
리 누수가 발생됨
다양한 명령과 툴을 이용하여 생성 가능
jmap 명령 이용
jmap -dump:format=b,file=filename.hprof pid
Heap Dump 분석
[root@jvmedu ~]# jmap
Usage:
jmap [option] pid
(to connect to running process)
jmap [option] executable core
(to connect to a core file)
jmap [option] [server_id@]remote server IP or hostname
(to connect to remote debug server)
where option is one of:
none to print same info as Solaris pmap
-heap to print java heap summary
-histo[:live] to print histogram of java object heap; if the live
suboption is specified, only count live objects
-clstats to print class loader statistics
-finalizerinfo to print information on objects awaiting finalization
-dump:dump-options to dump java heap in hprof binary format
dump-options:
live dump only live objects; if not specified,
all objects in the heap are dumped.
format=b binary format
file=file dump heap to file
Example: jmap -dump:live,format=b,file=heap.bin pid
-F force. Use with -dump:dump-options pid or -histo
to force a heap dump or histogram when pid does not
respond. The live suboption is not supported
in this mode.
-h | -help to print this help message
-Jflag to pass flag directly to the runtime system](https://image.slidesharecdn.com/jvm-230511085906-be6f1201/75/JVM_-pdf-133-2048.jpg)
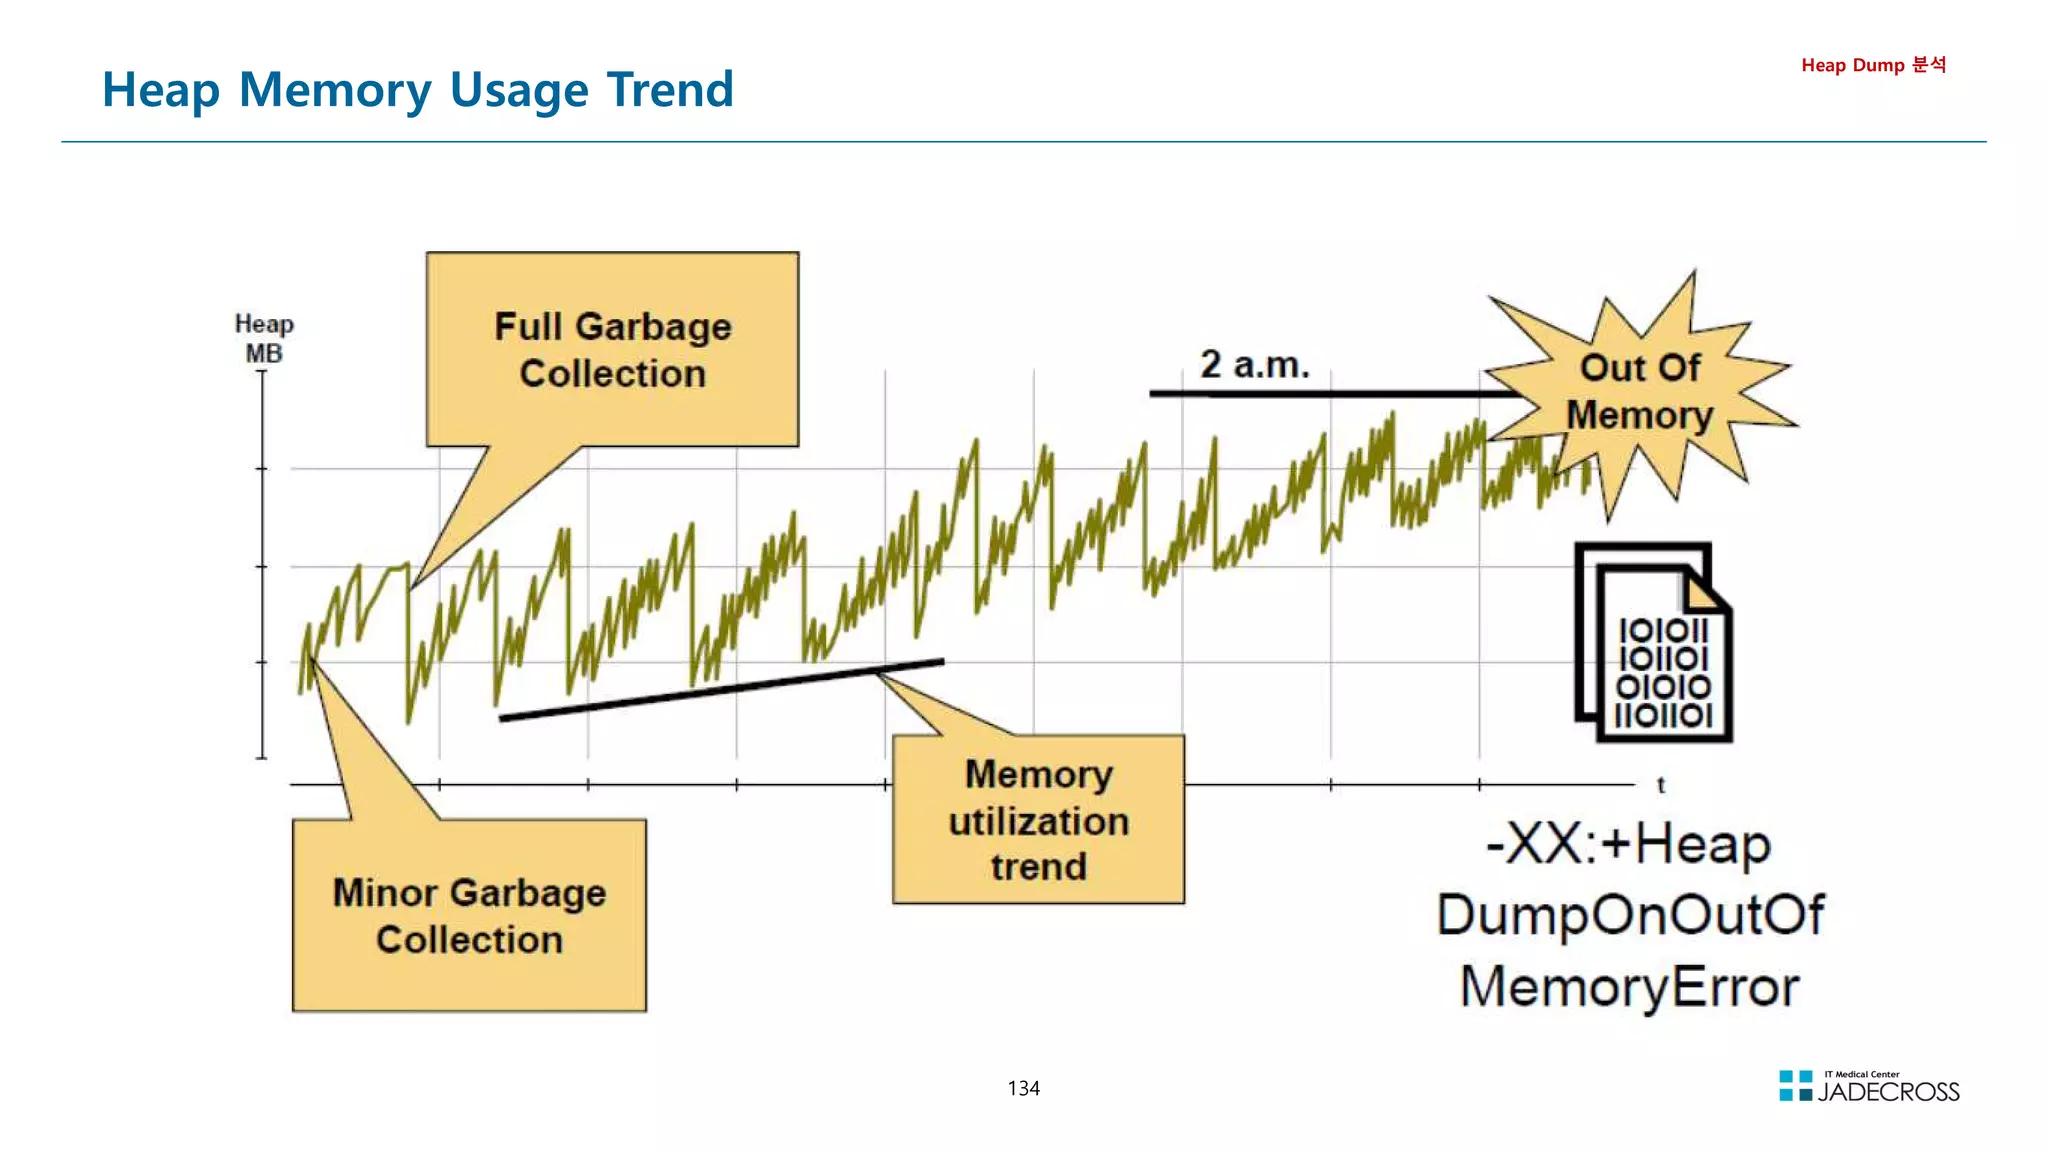
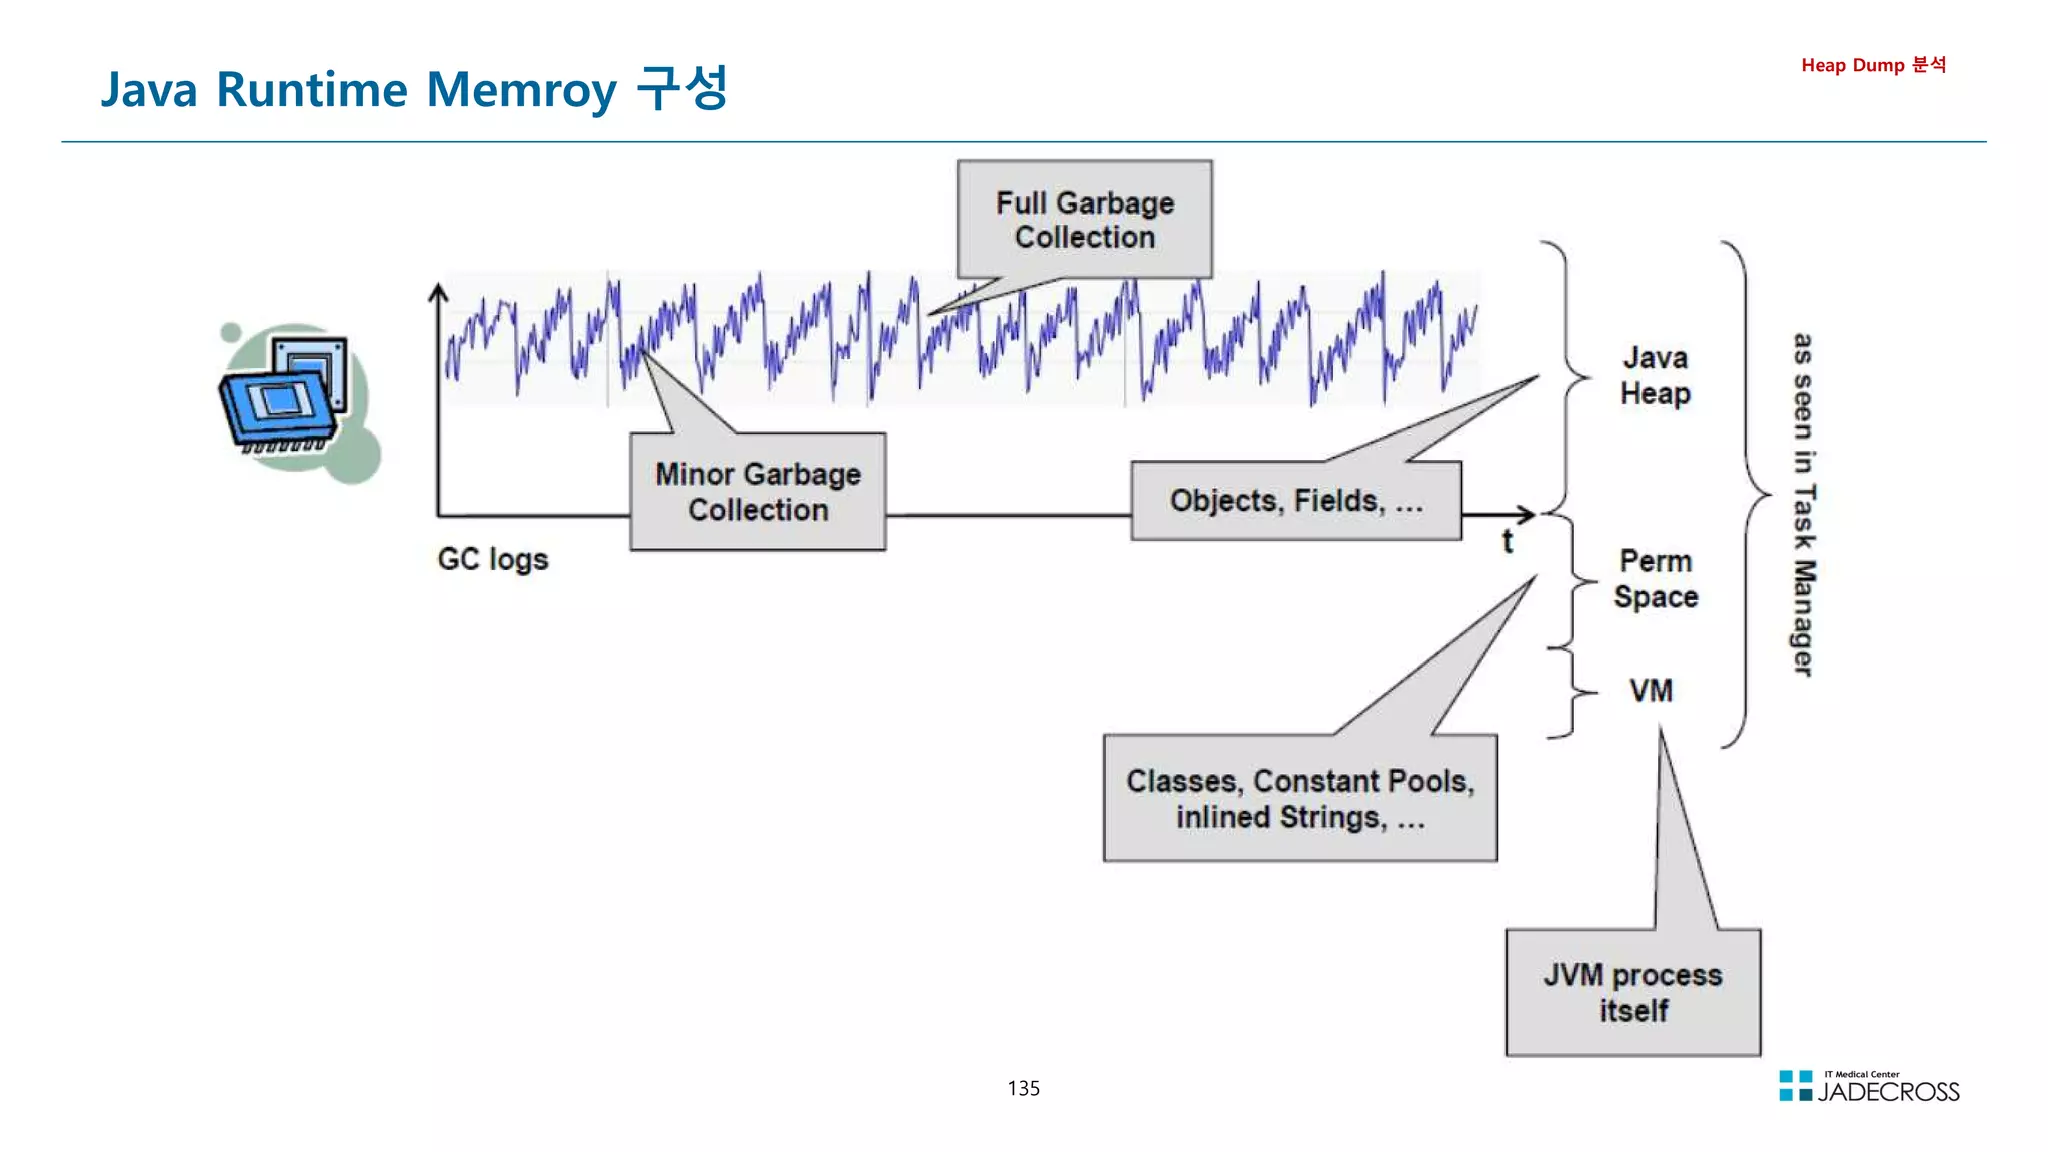
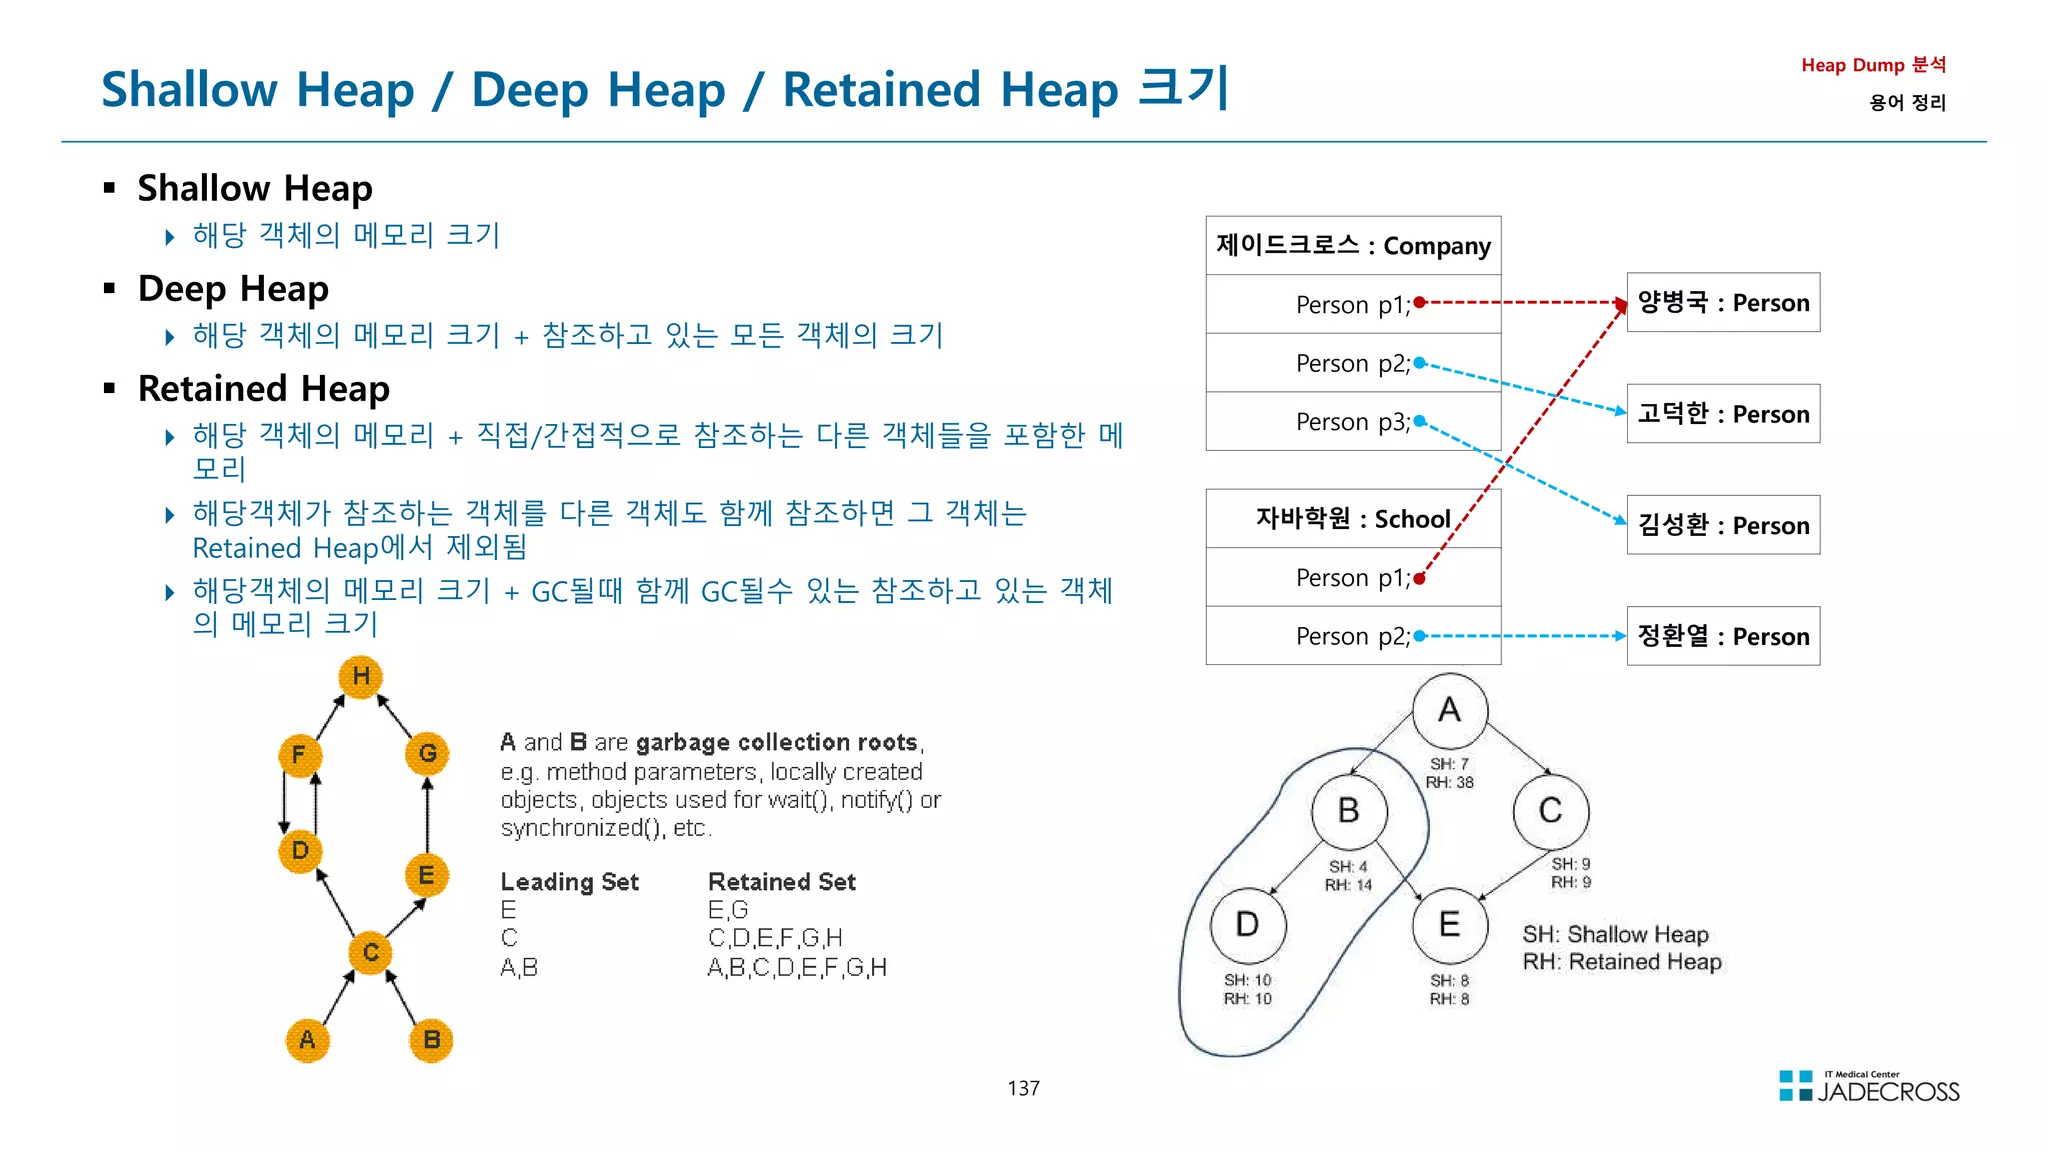
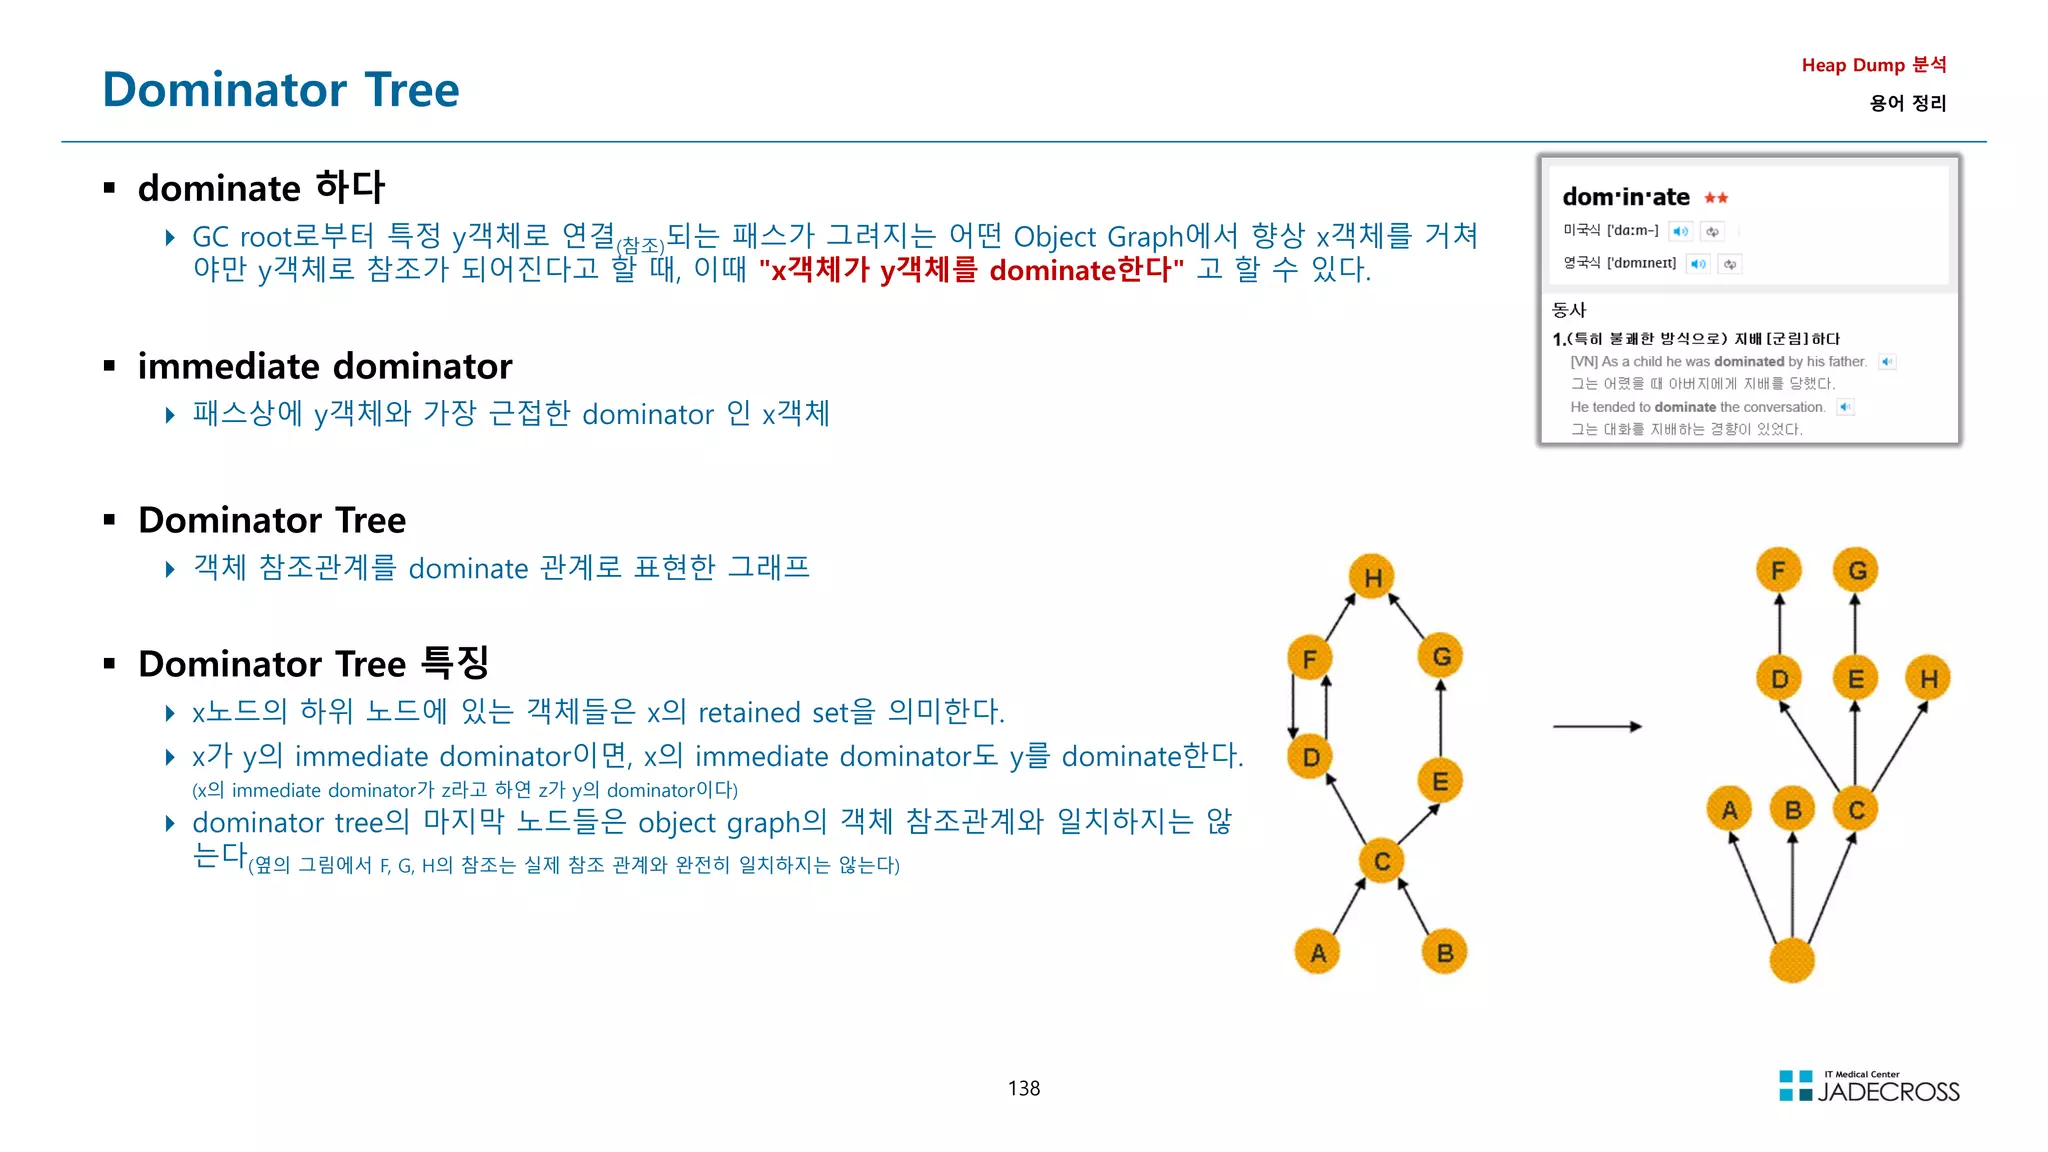
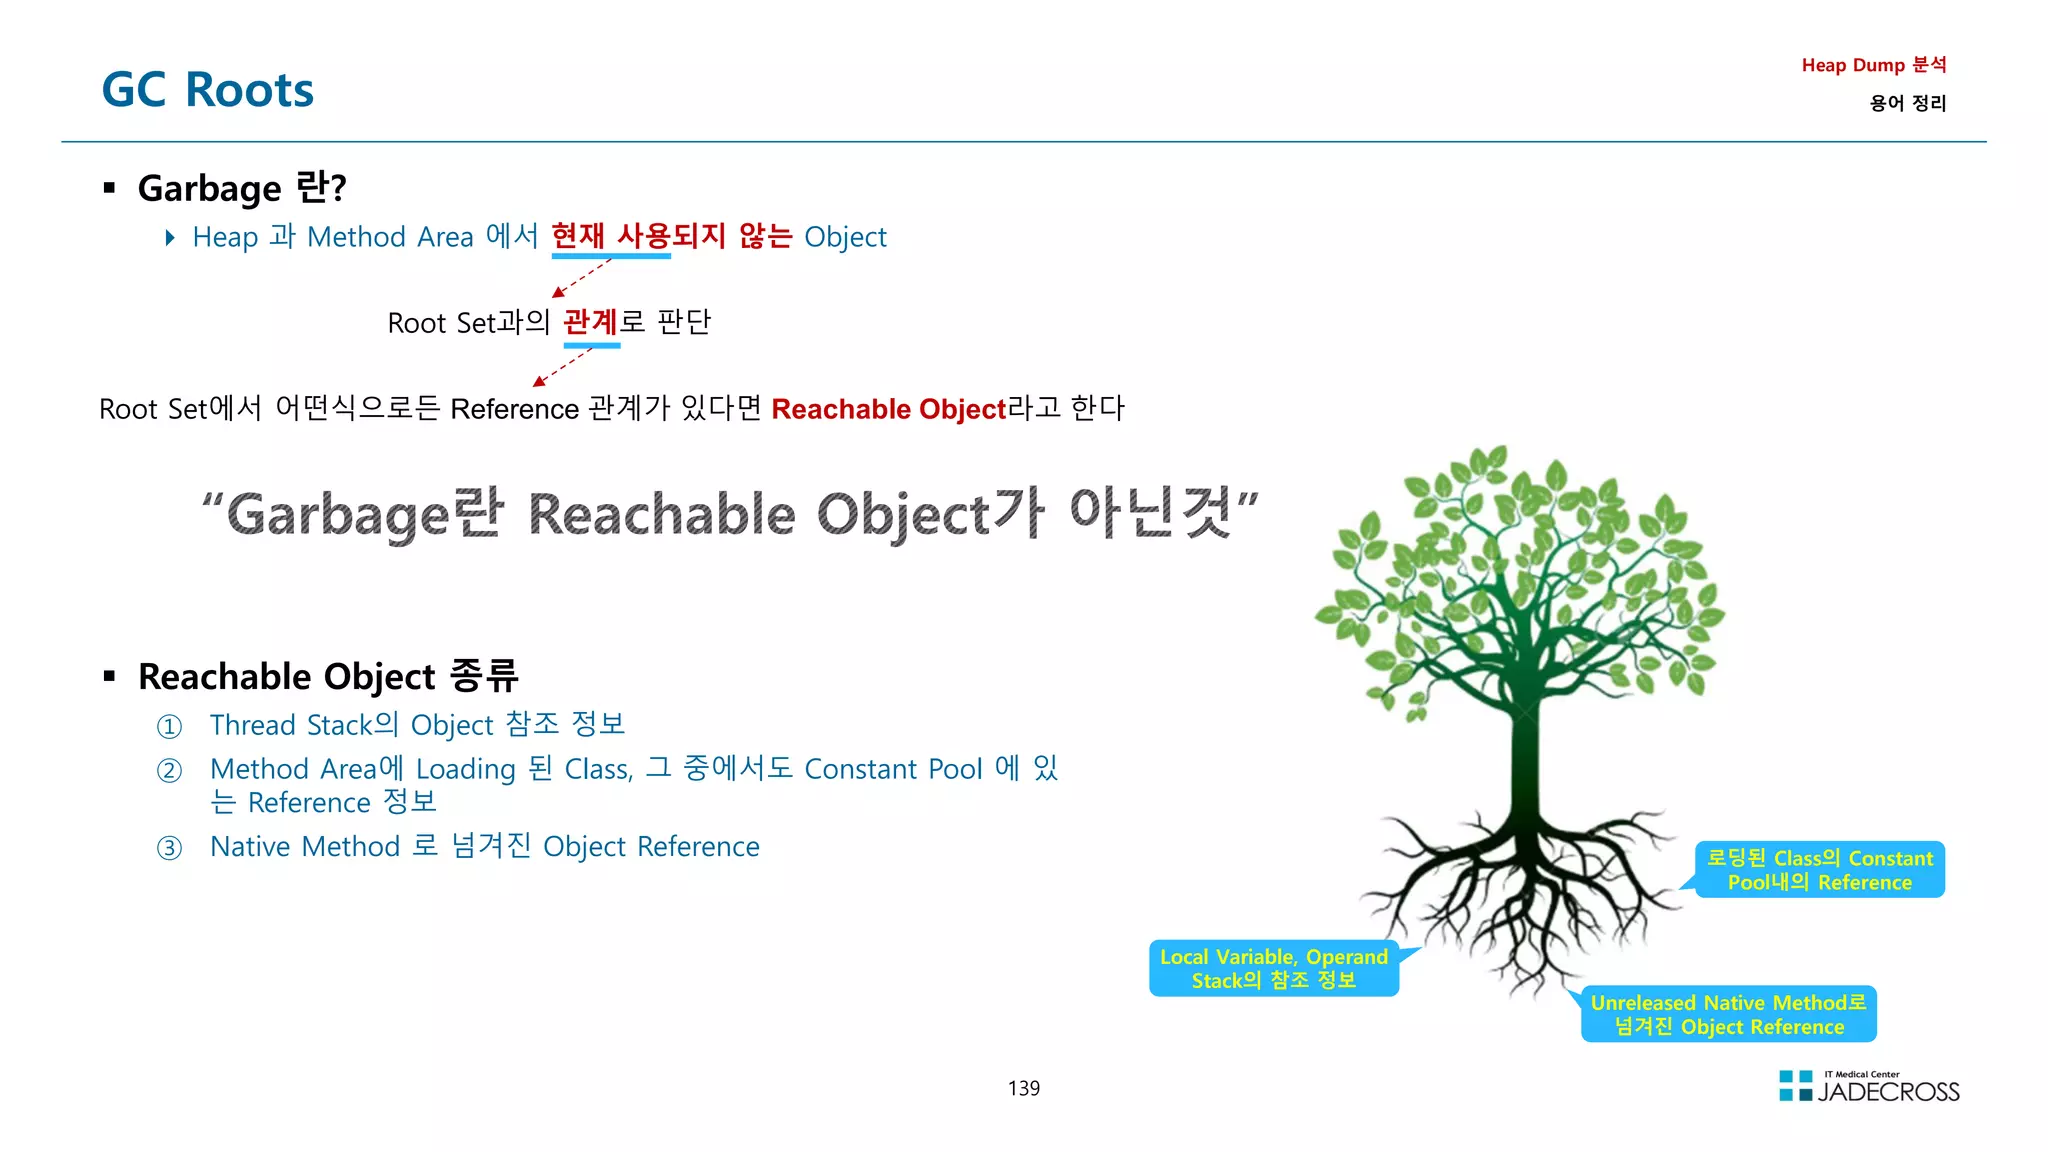
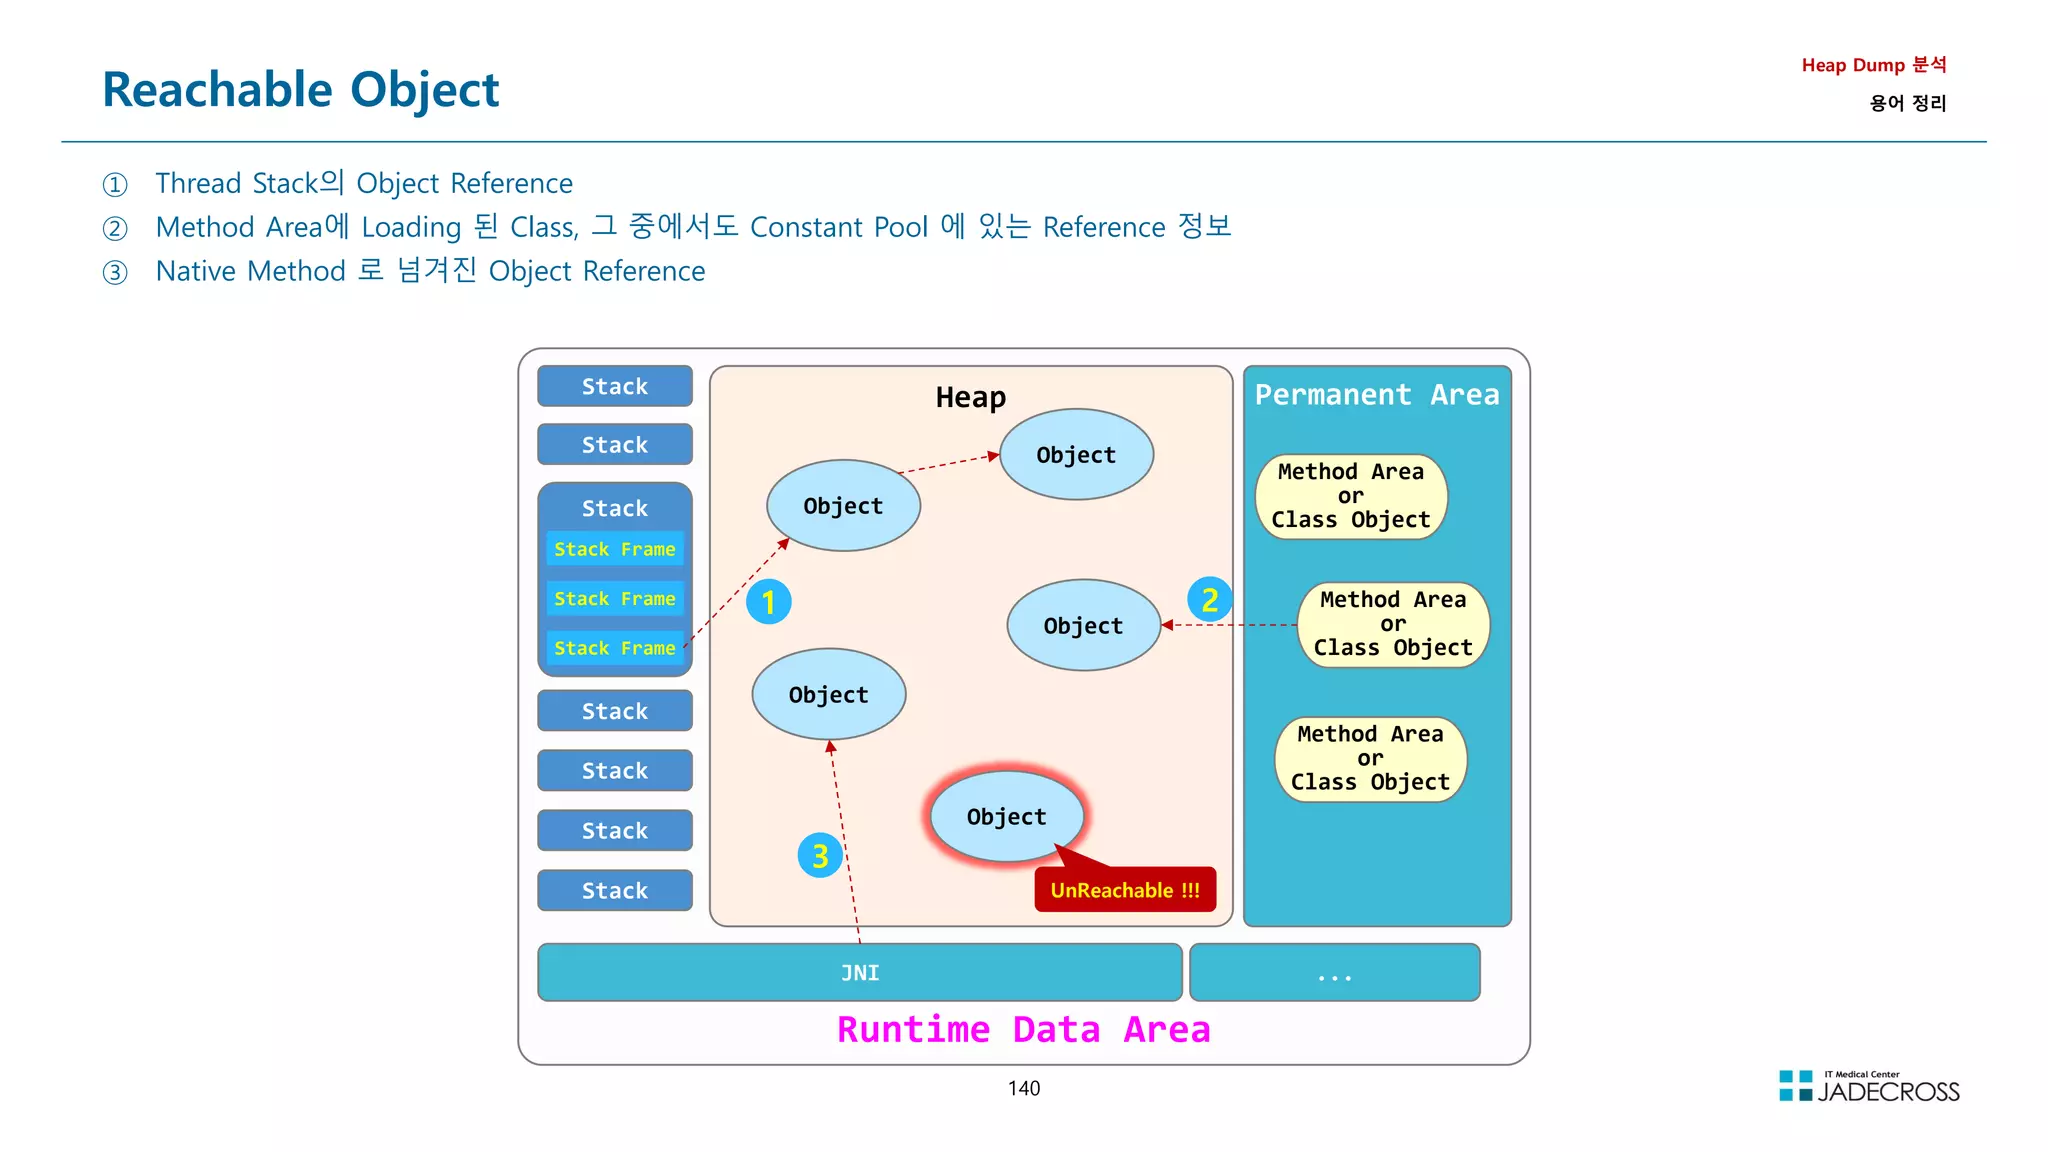
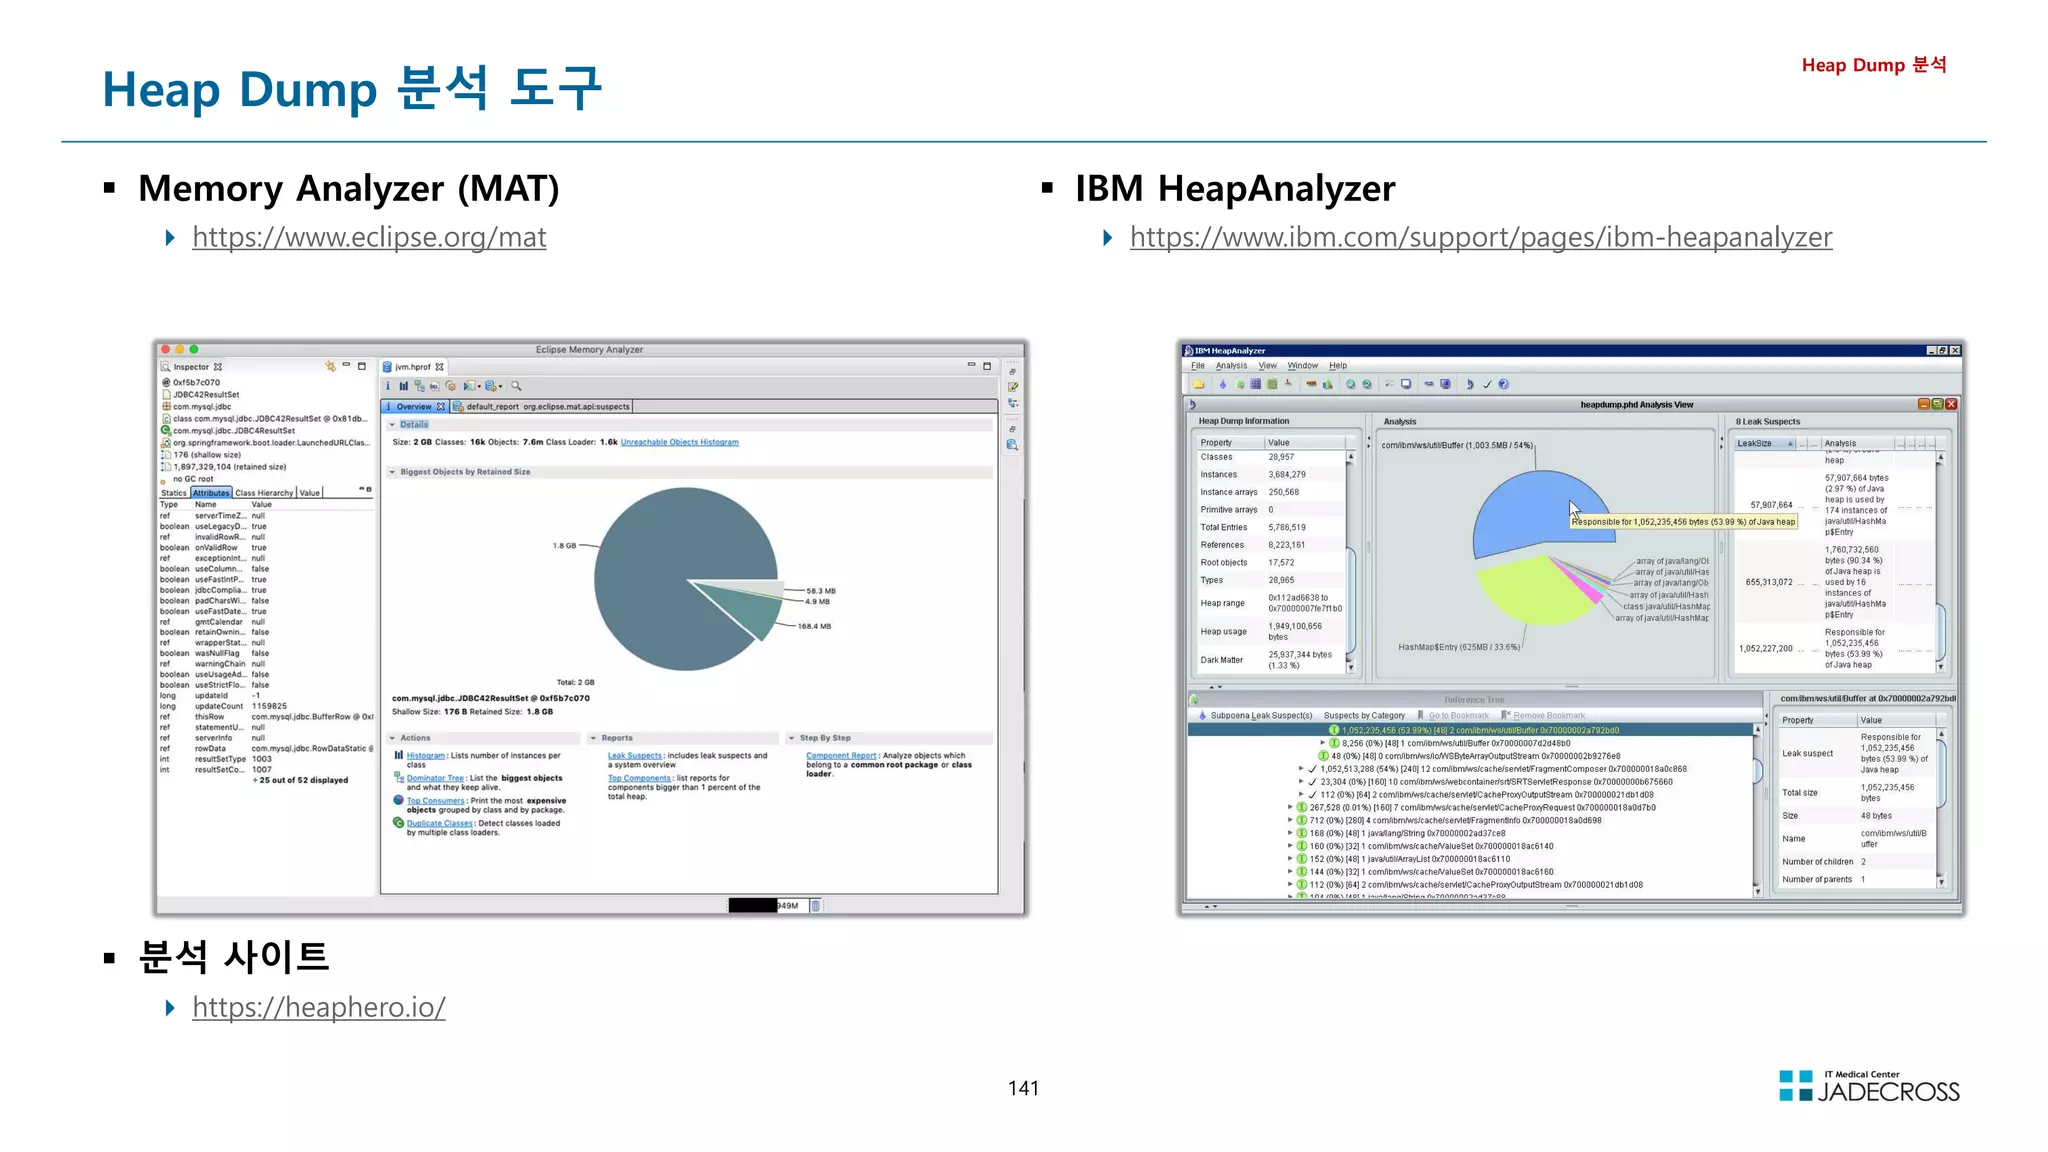
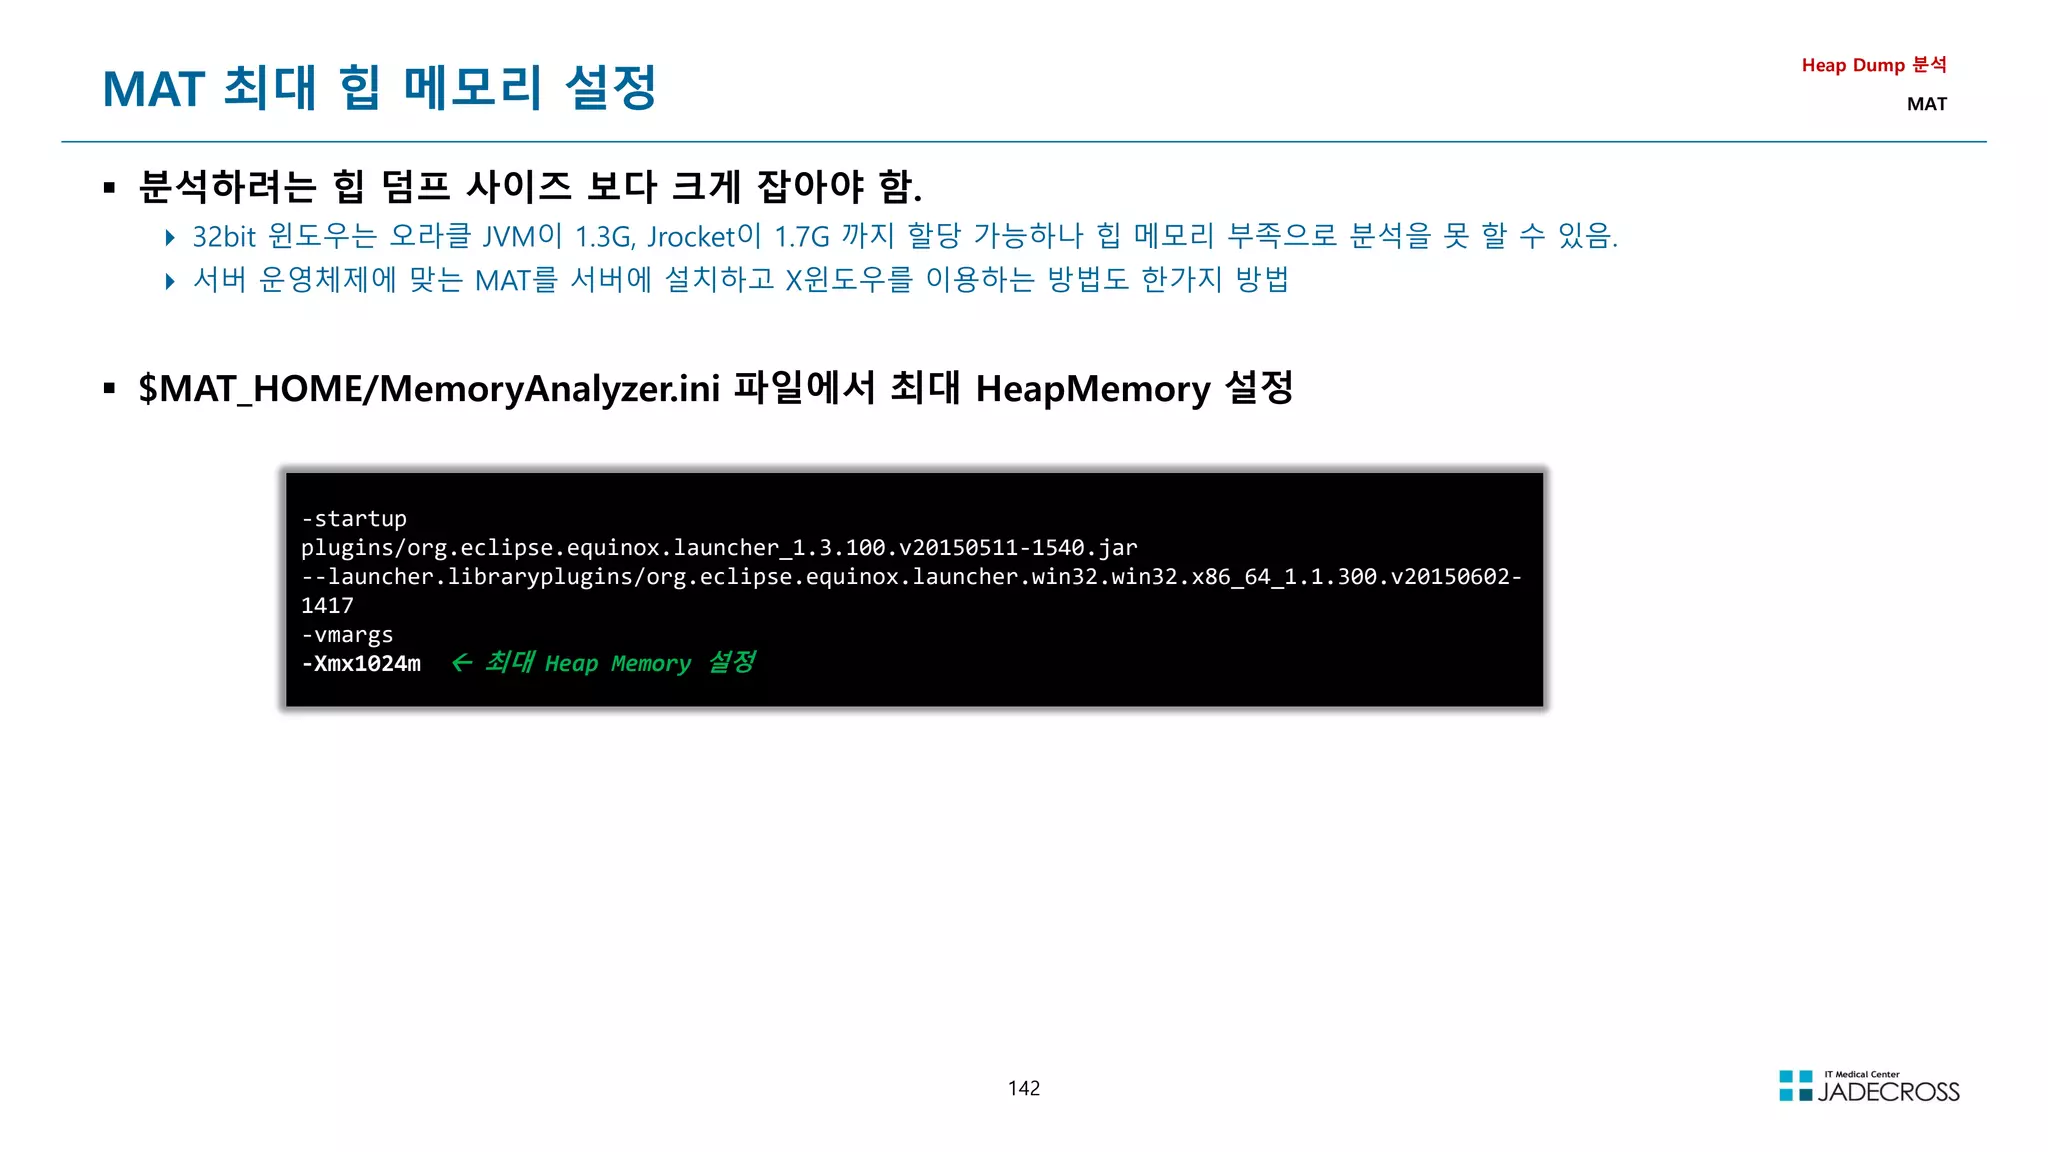
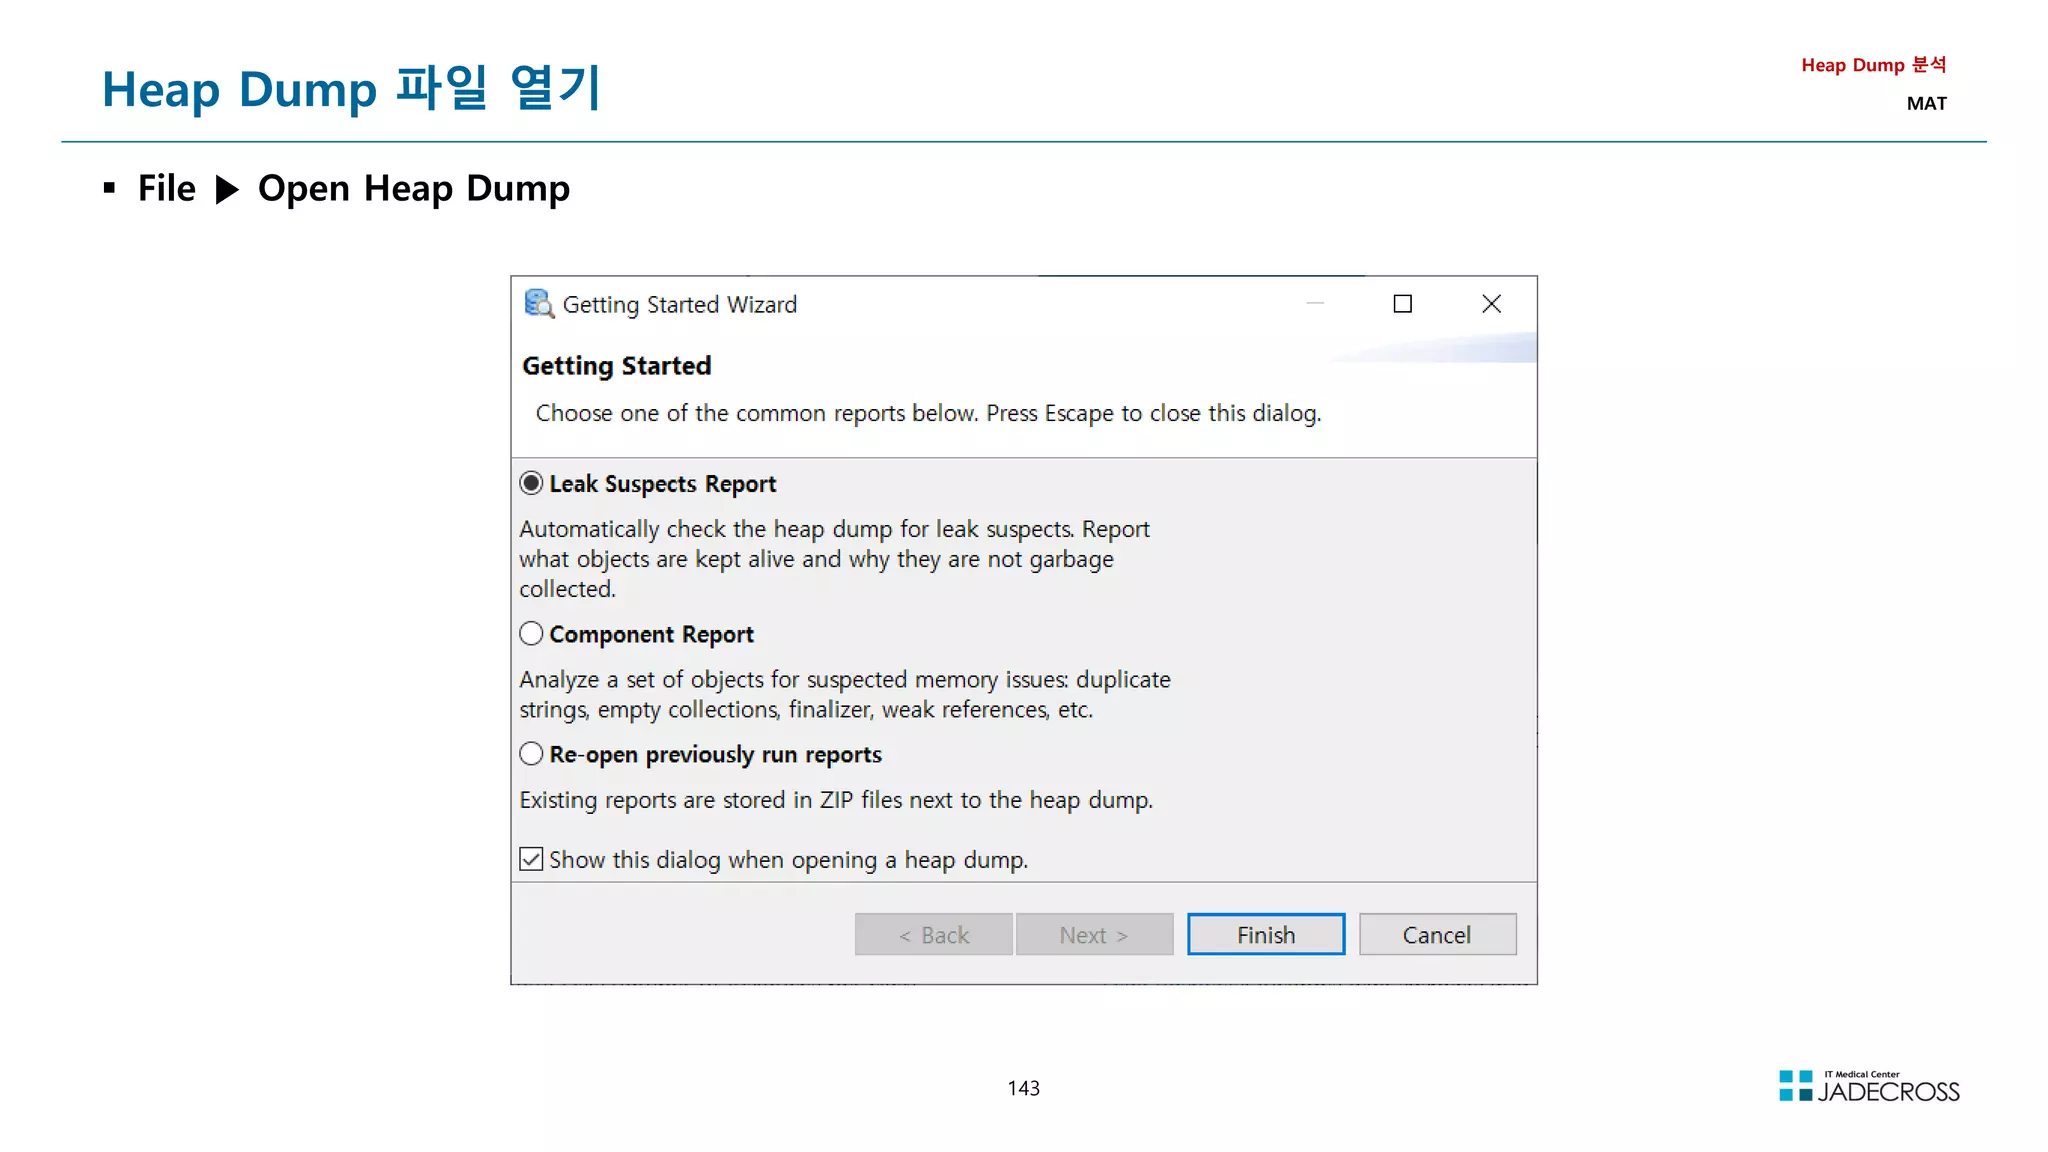
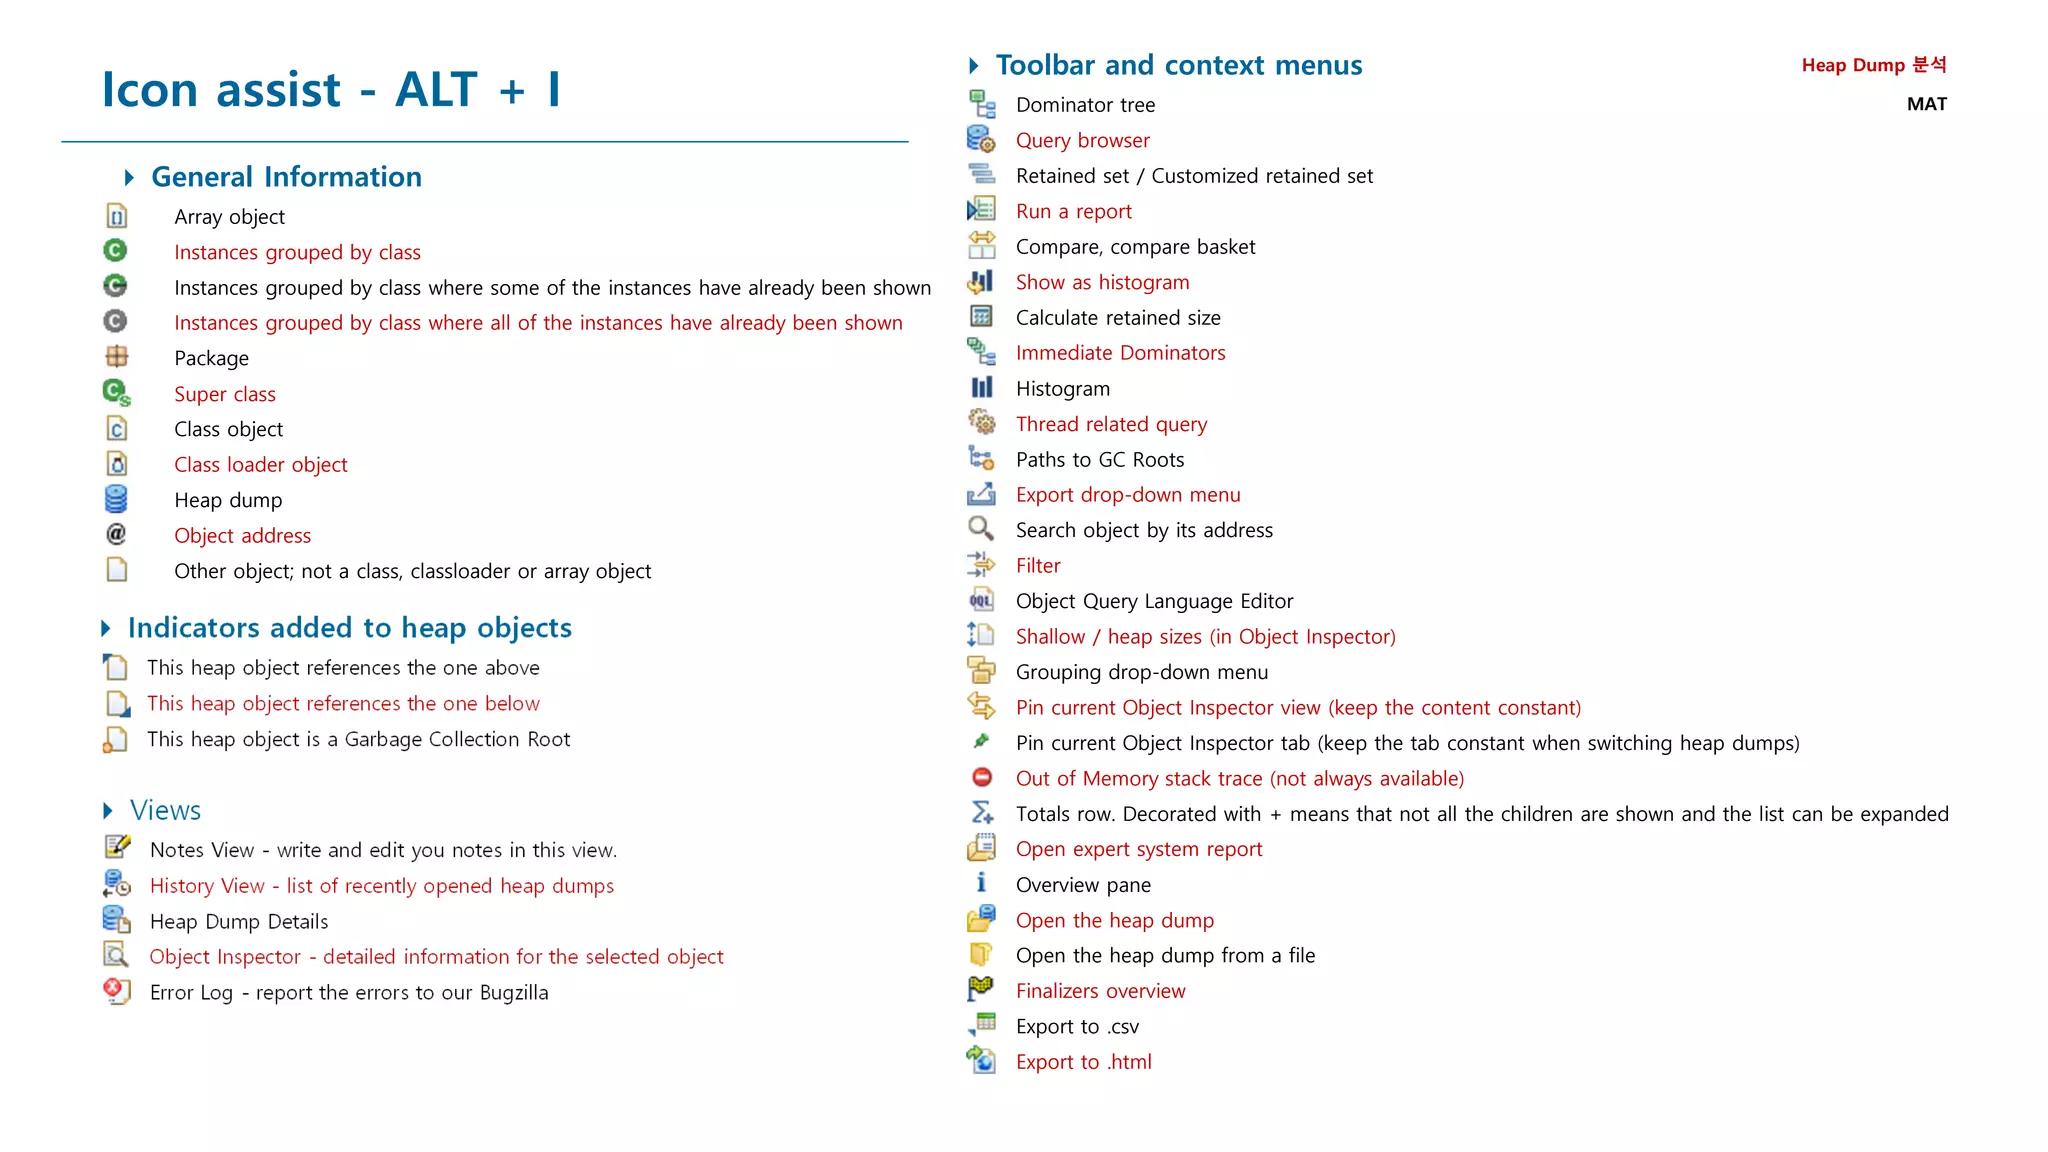
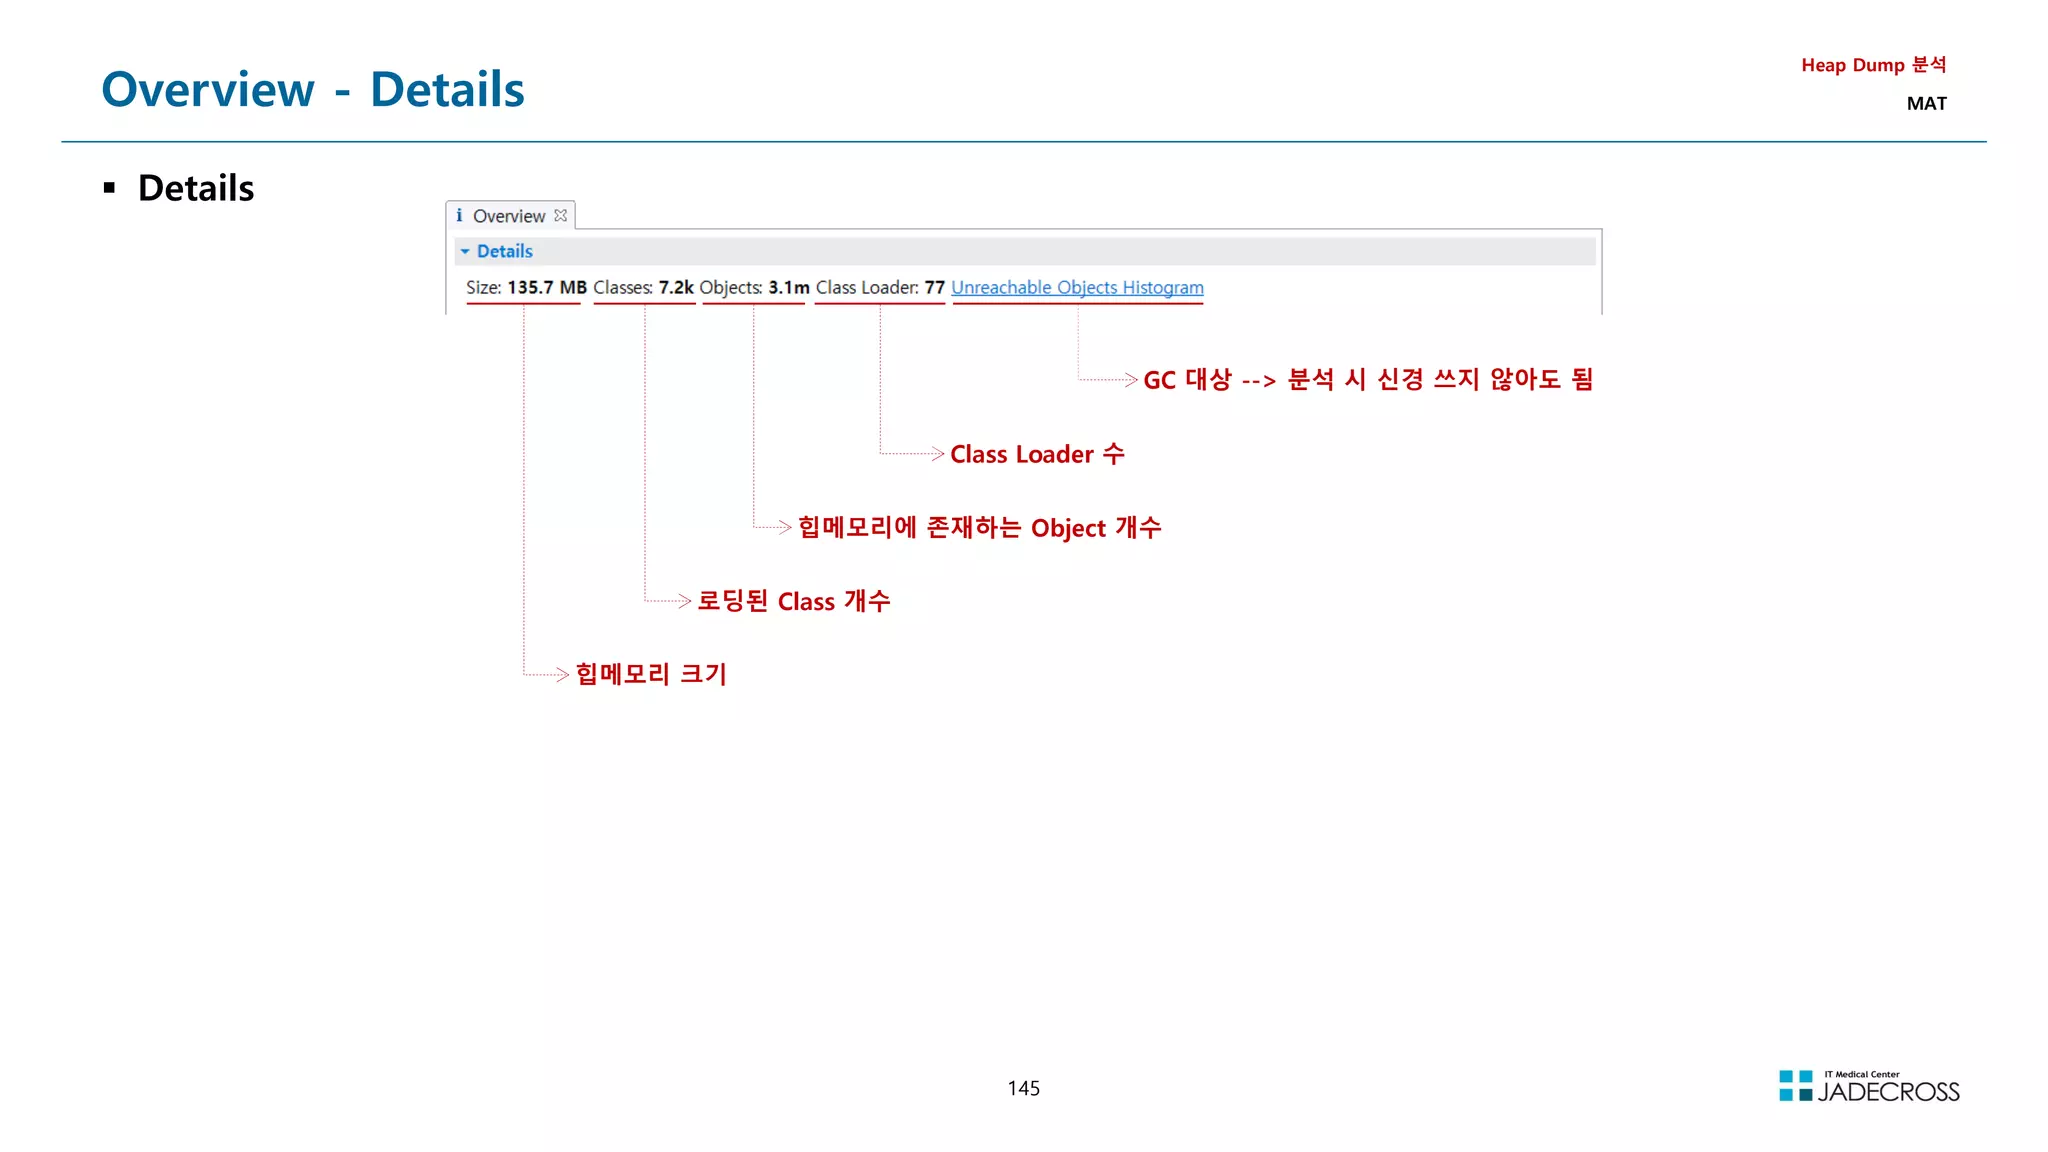
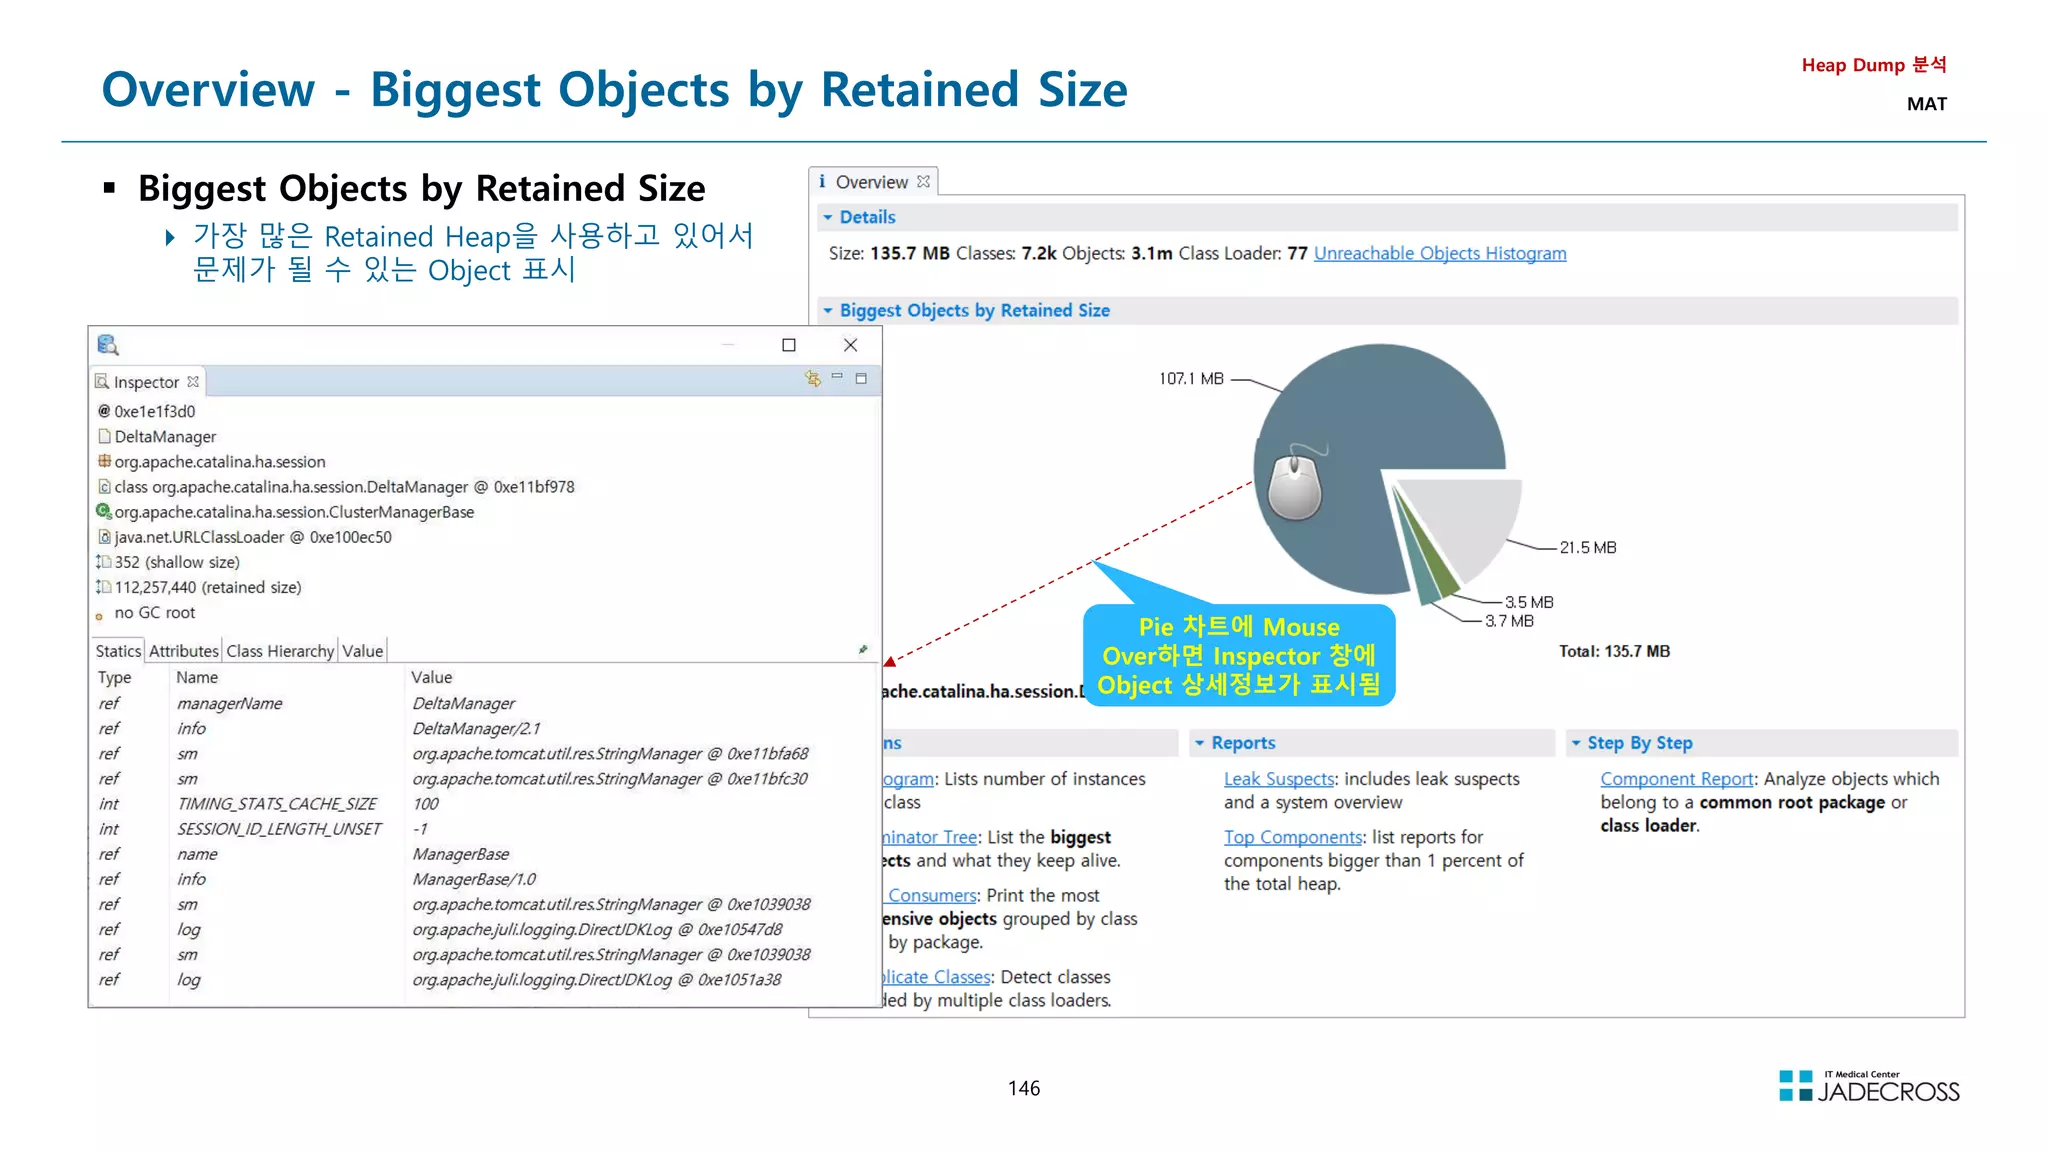
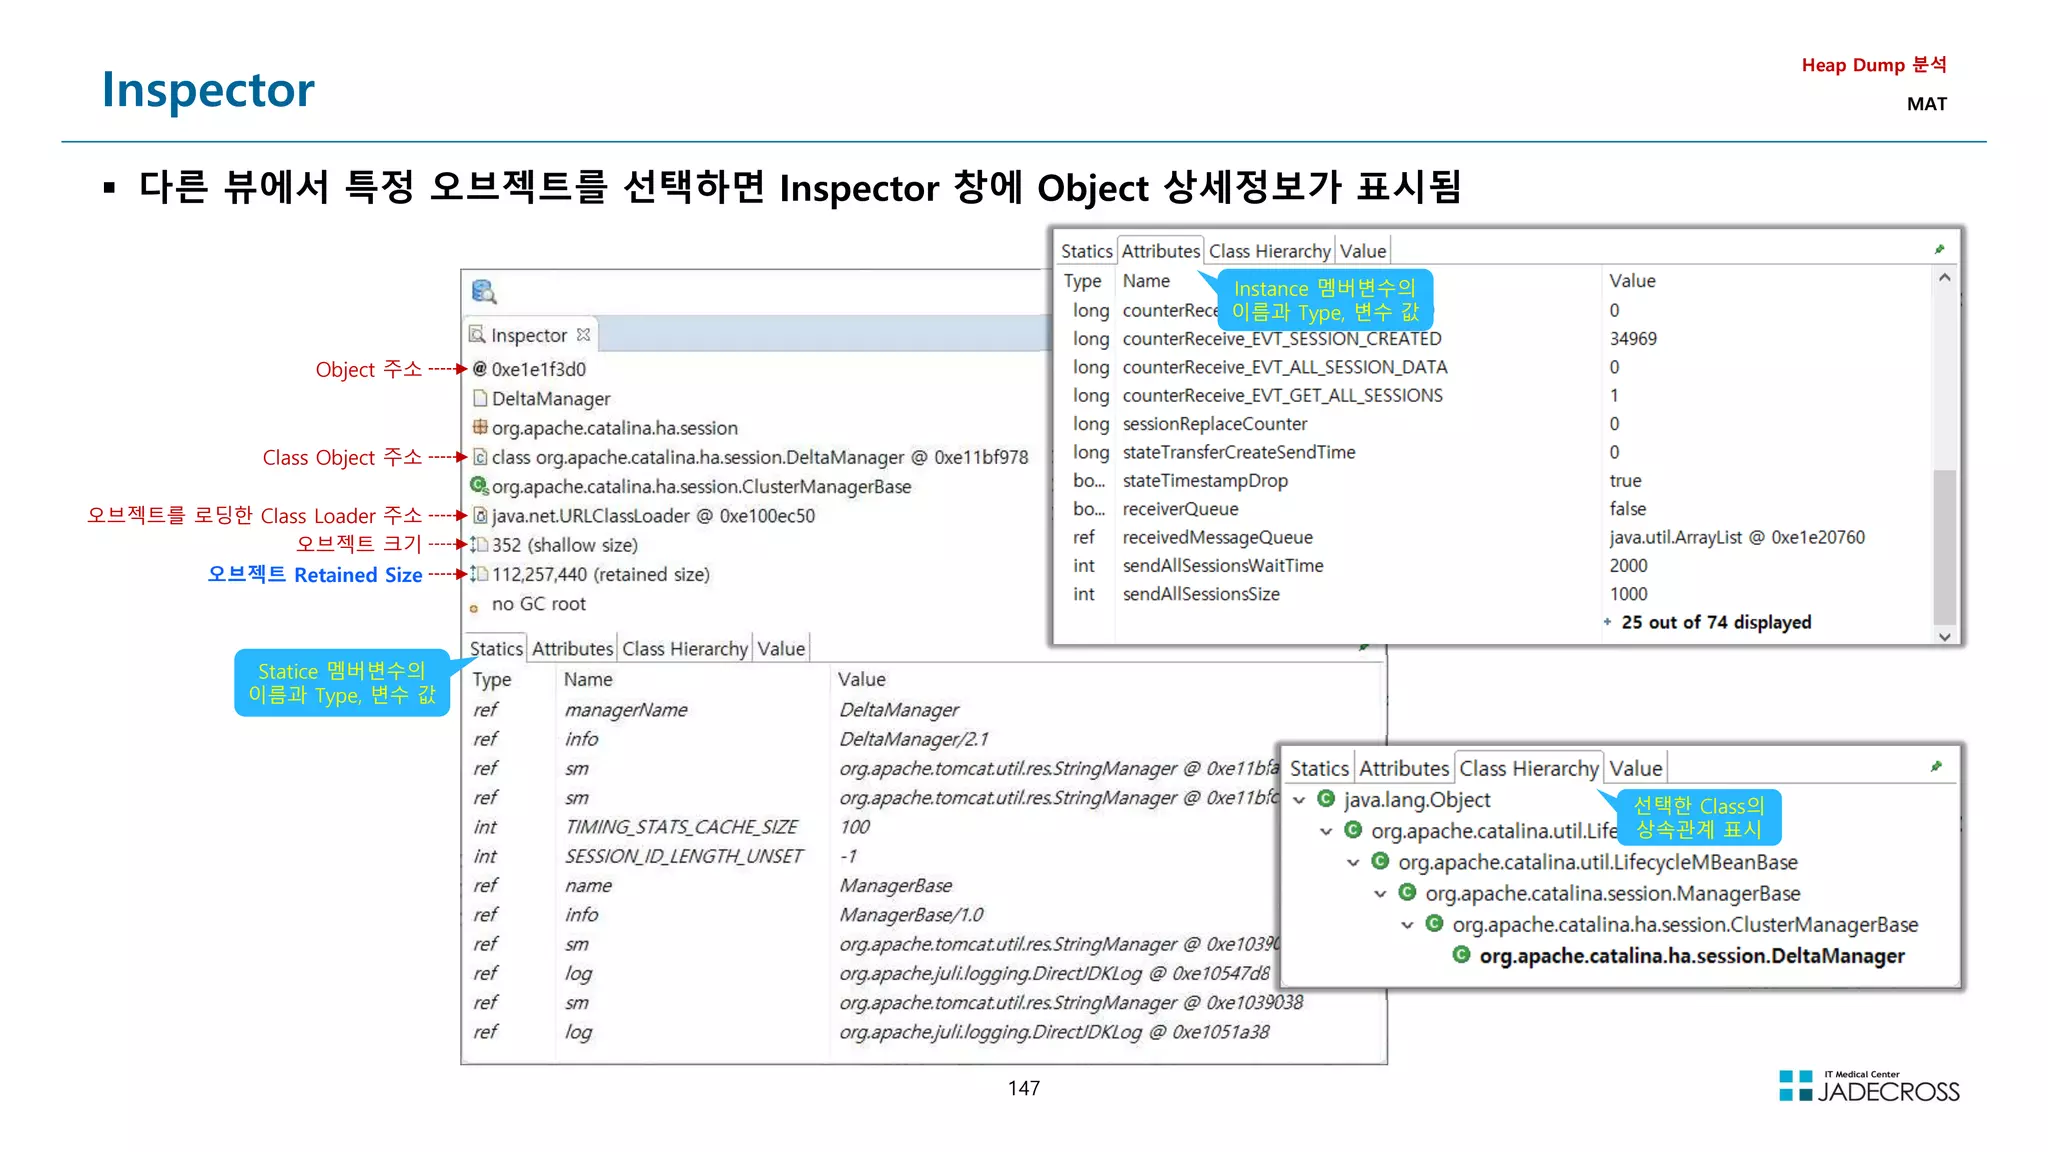
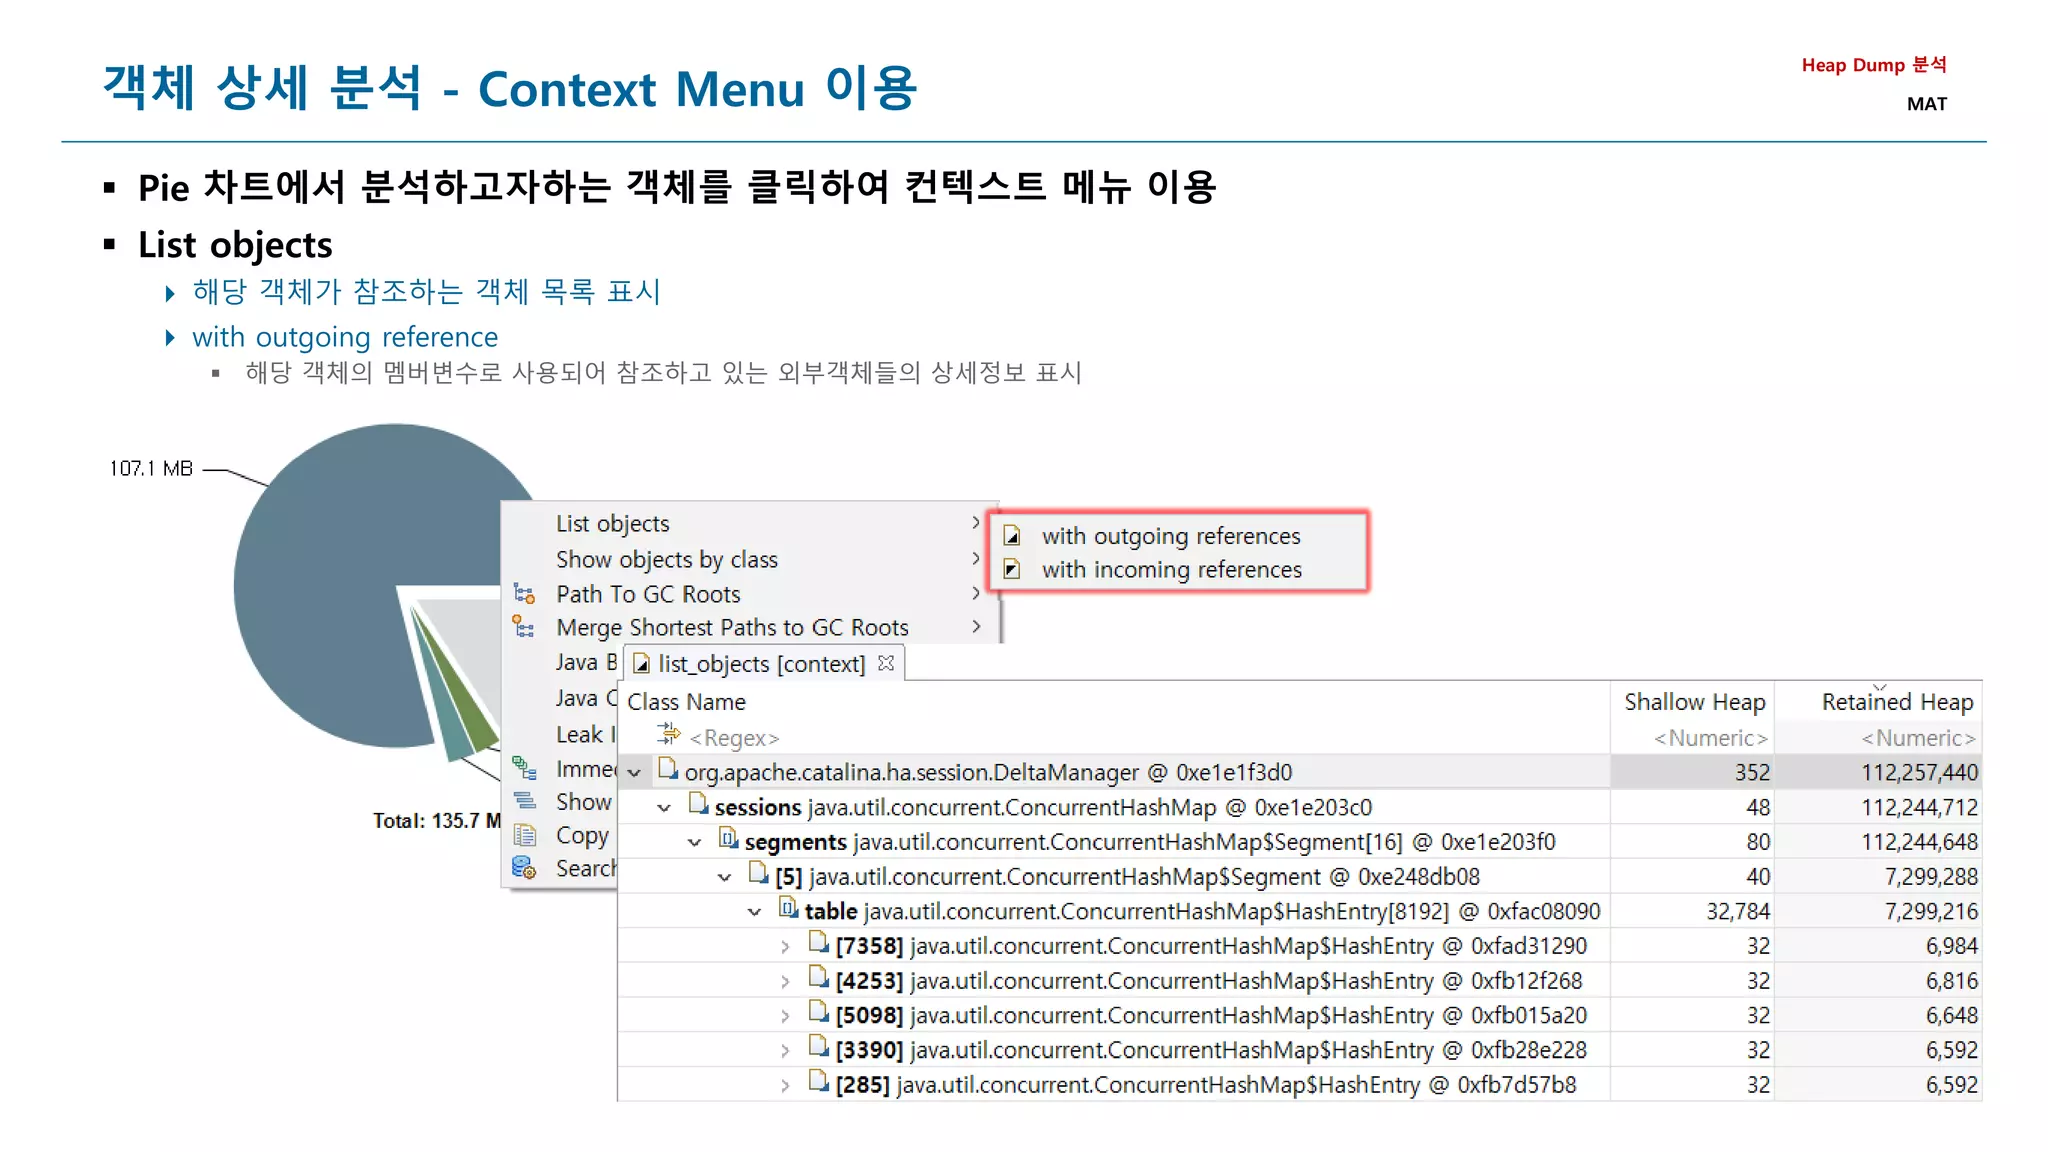
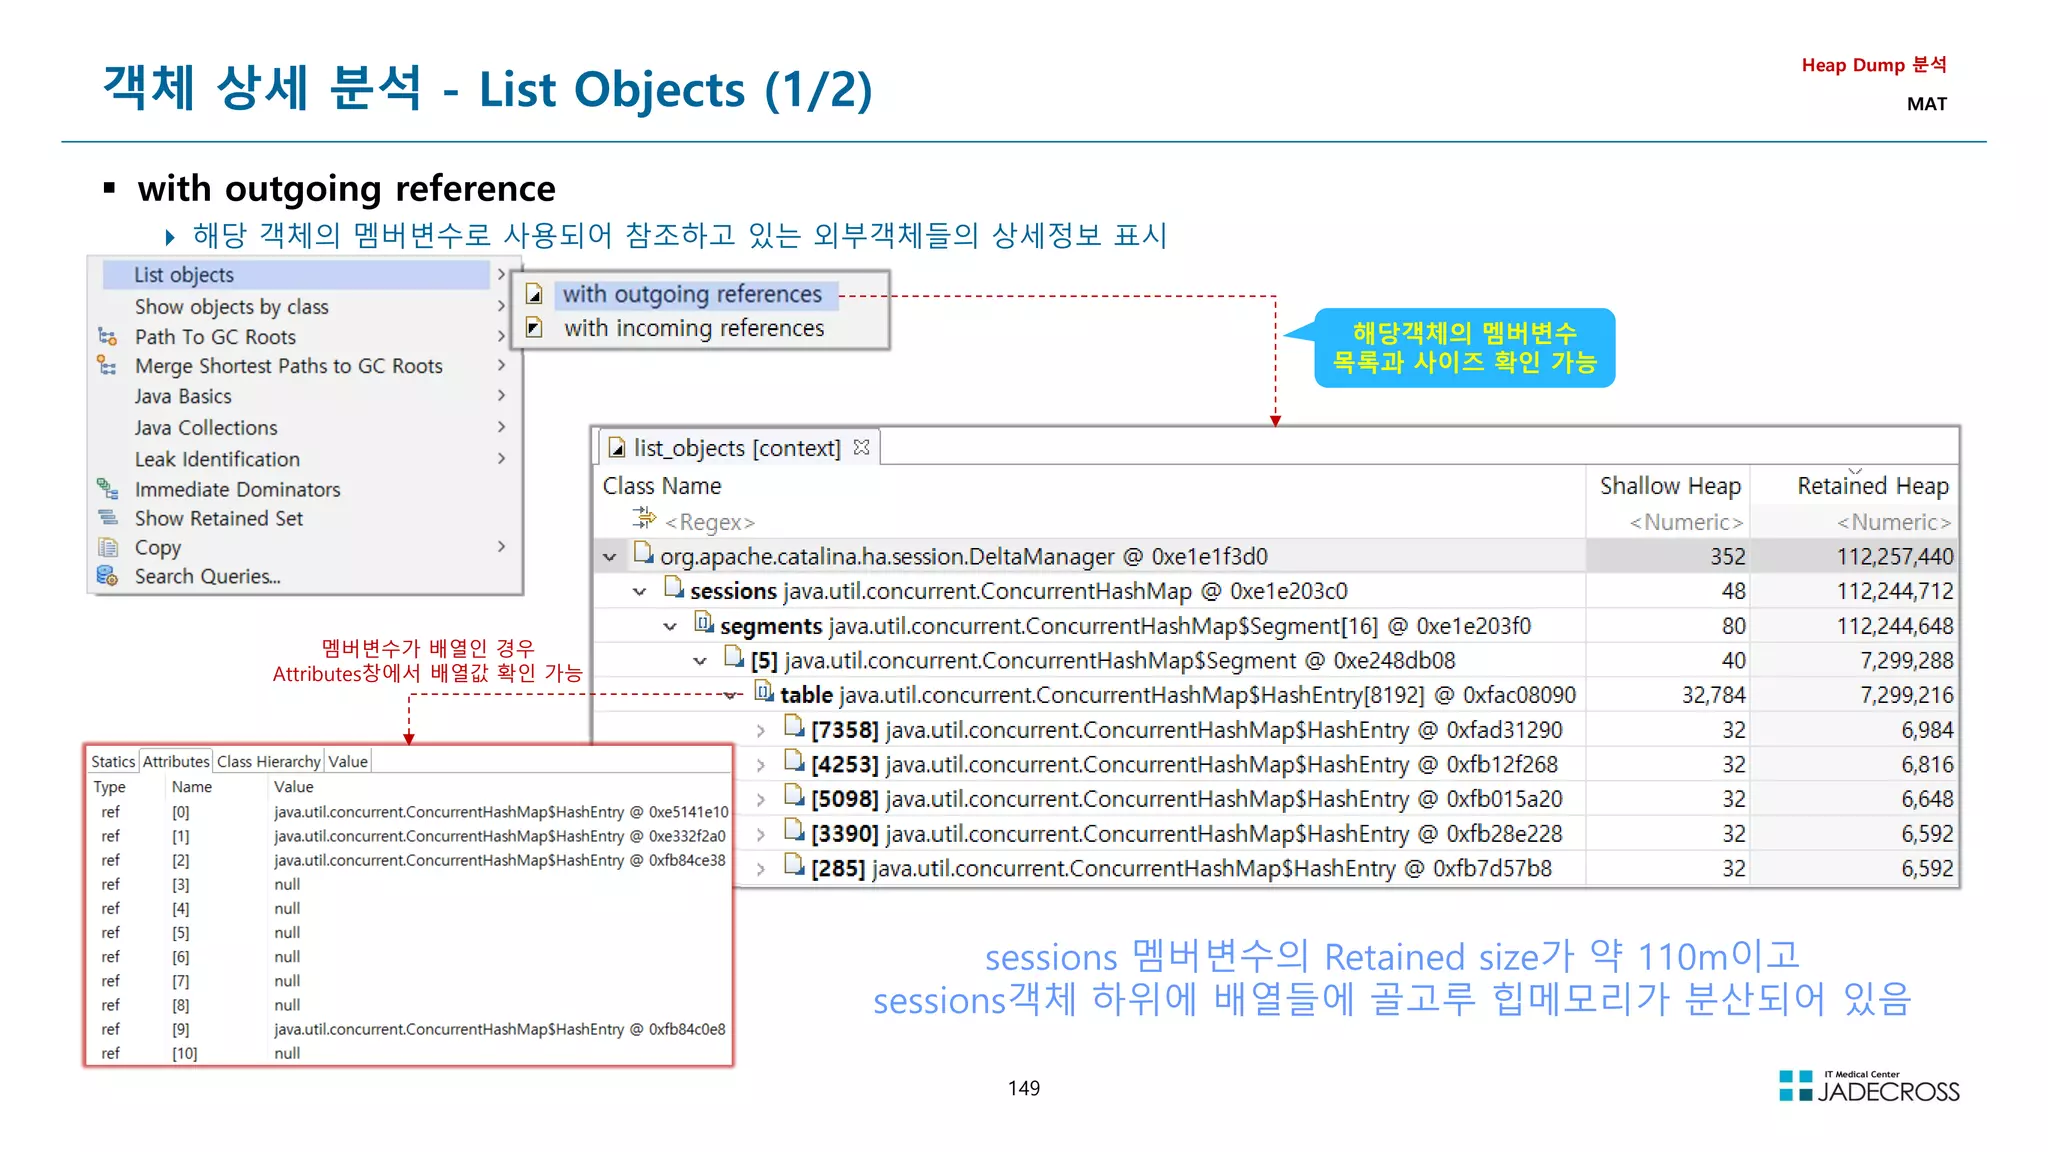
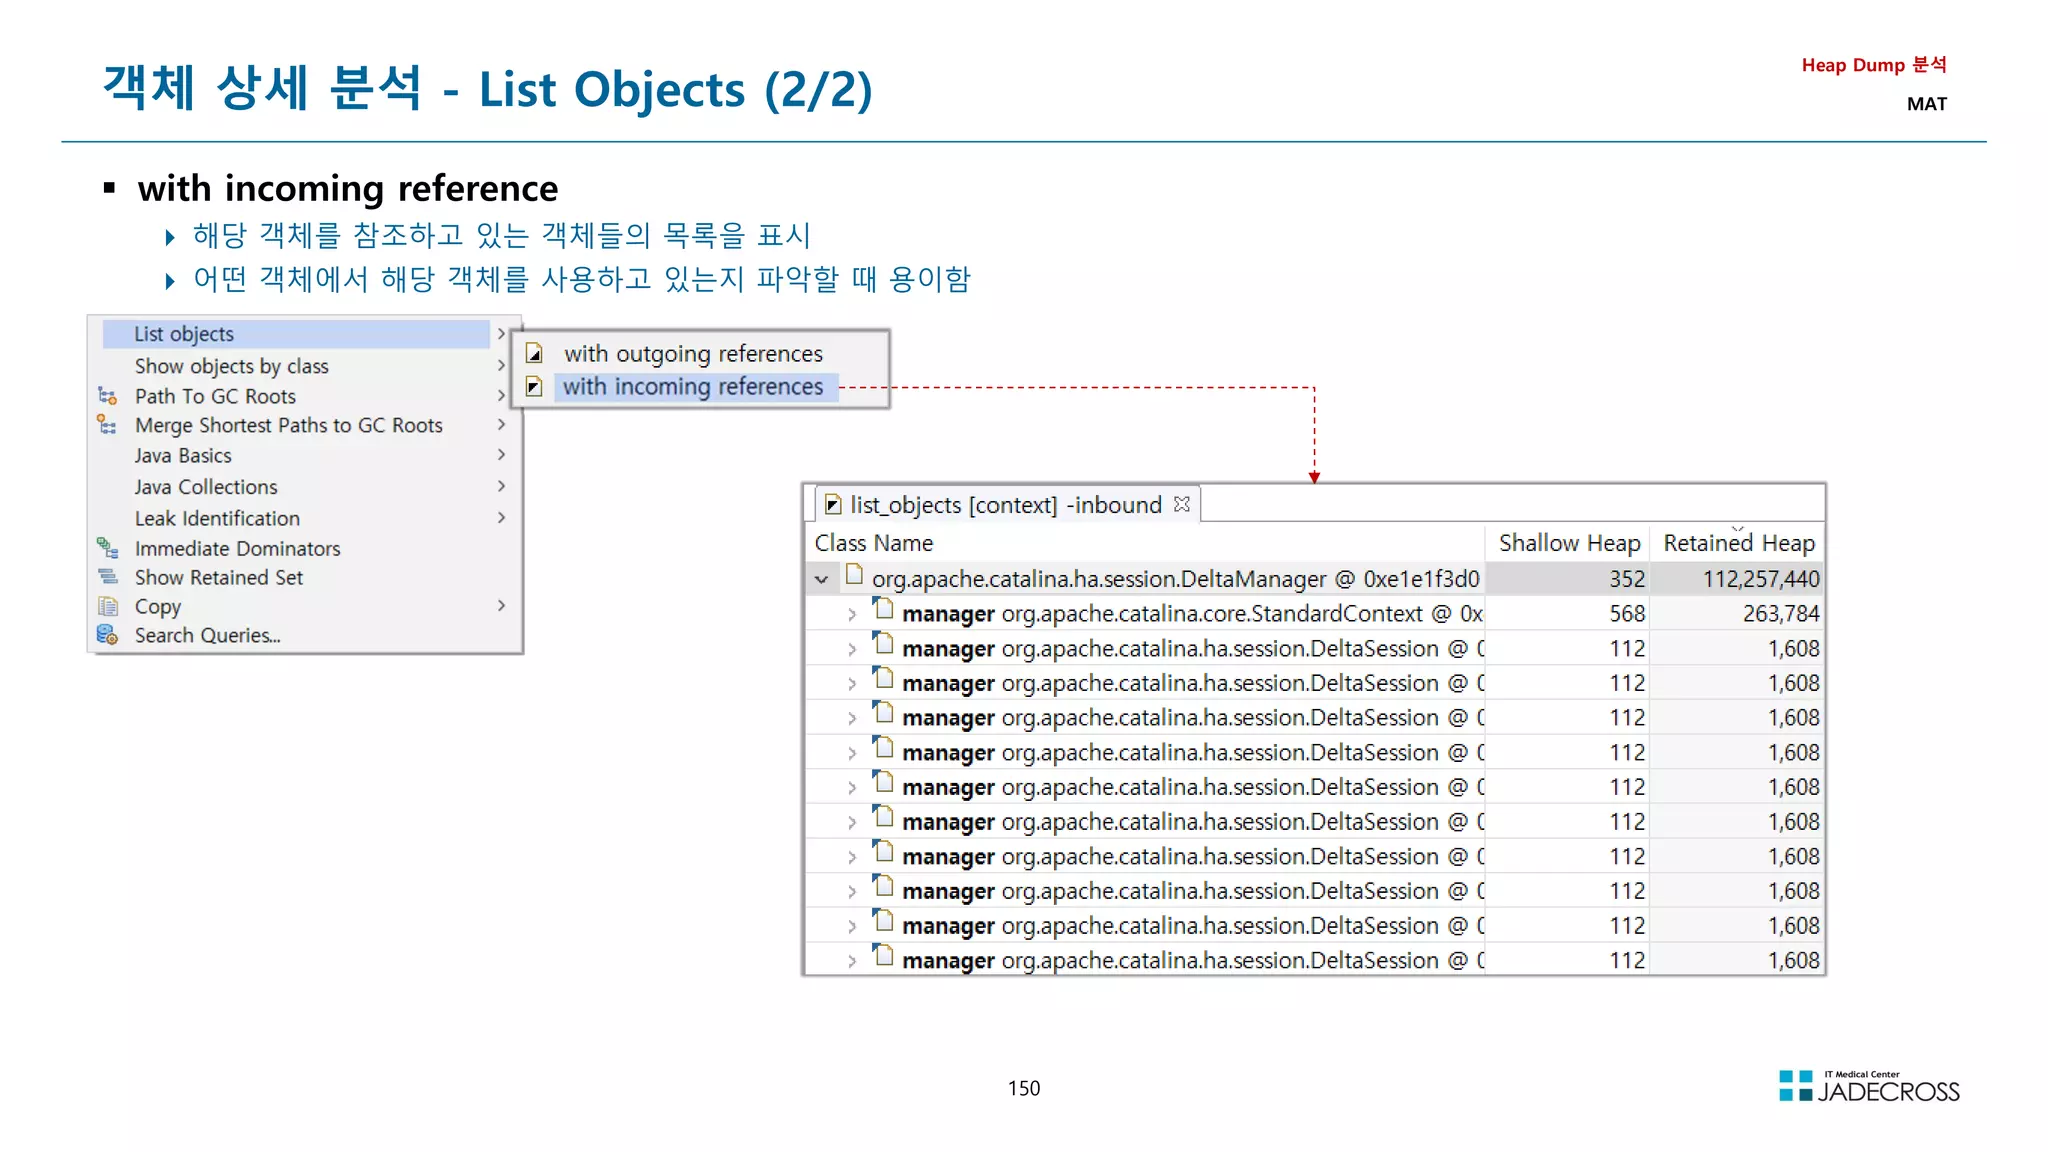
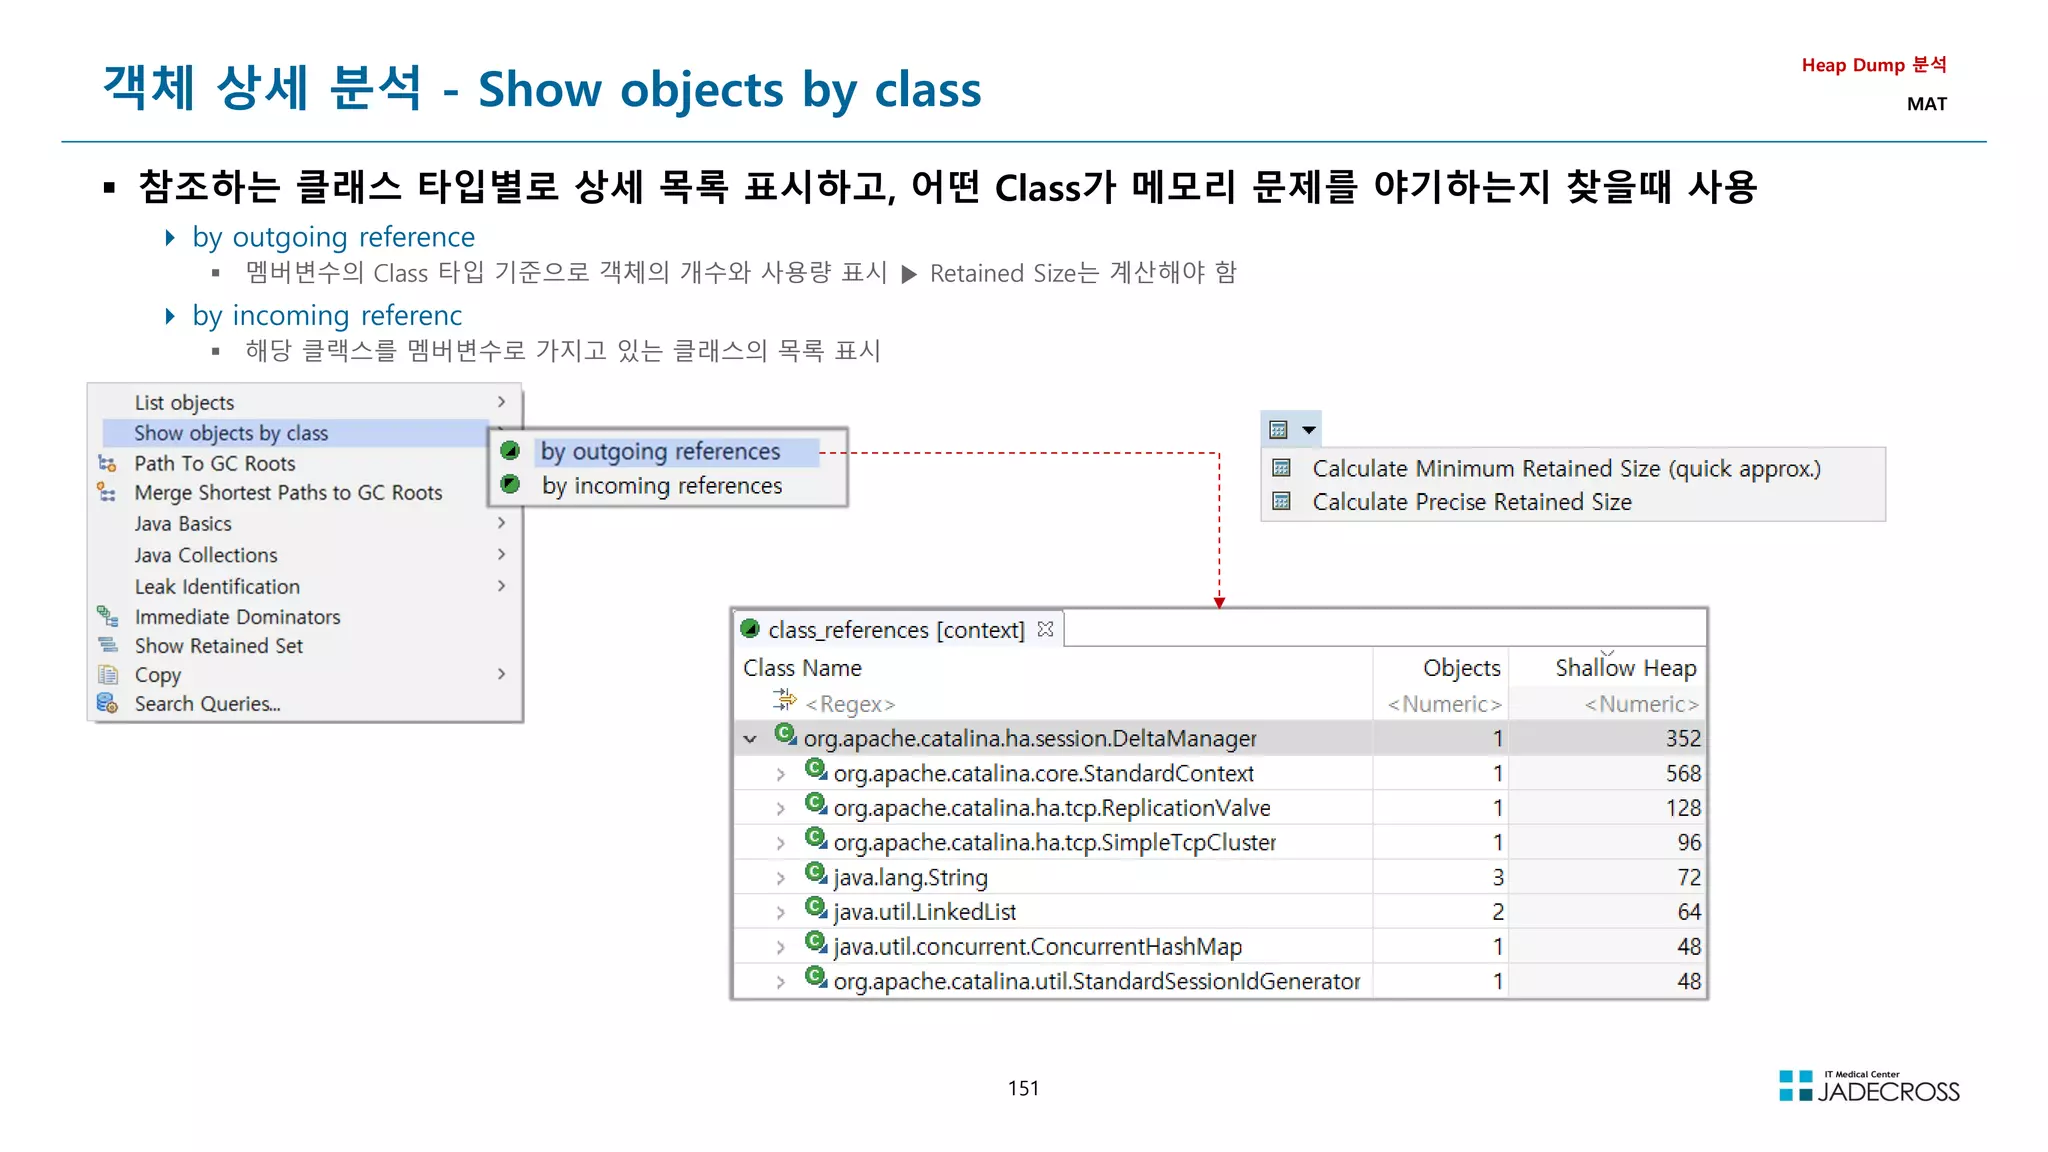
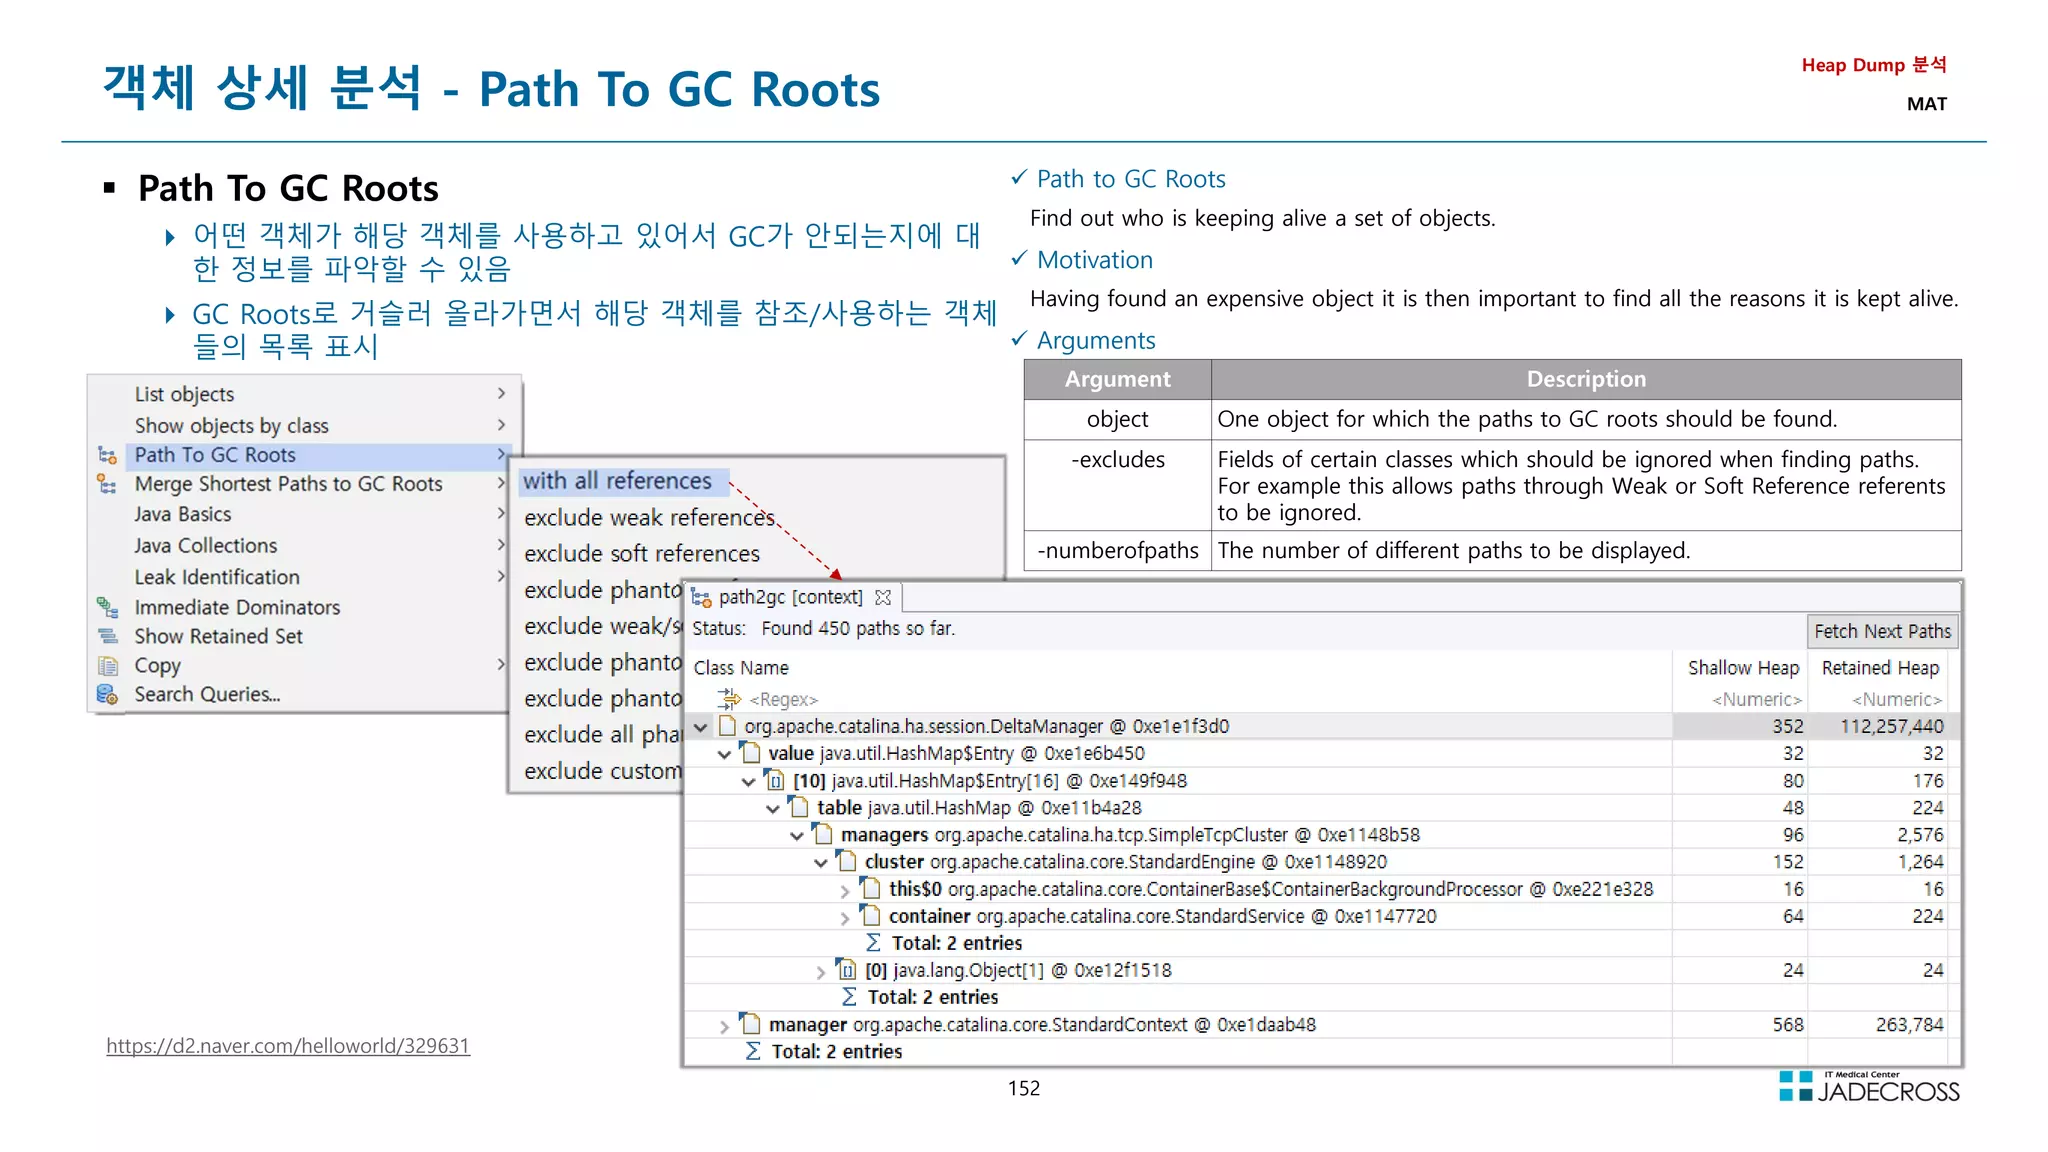
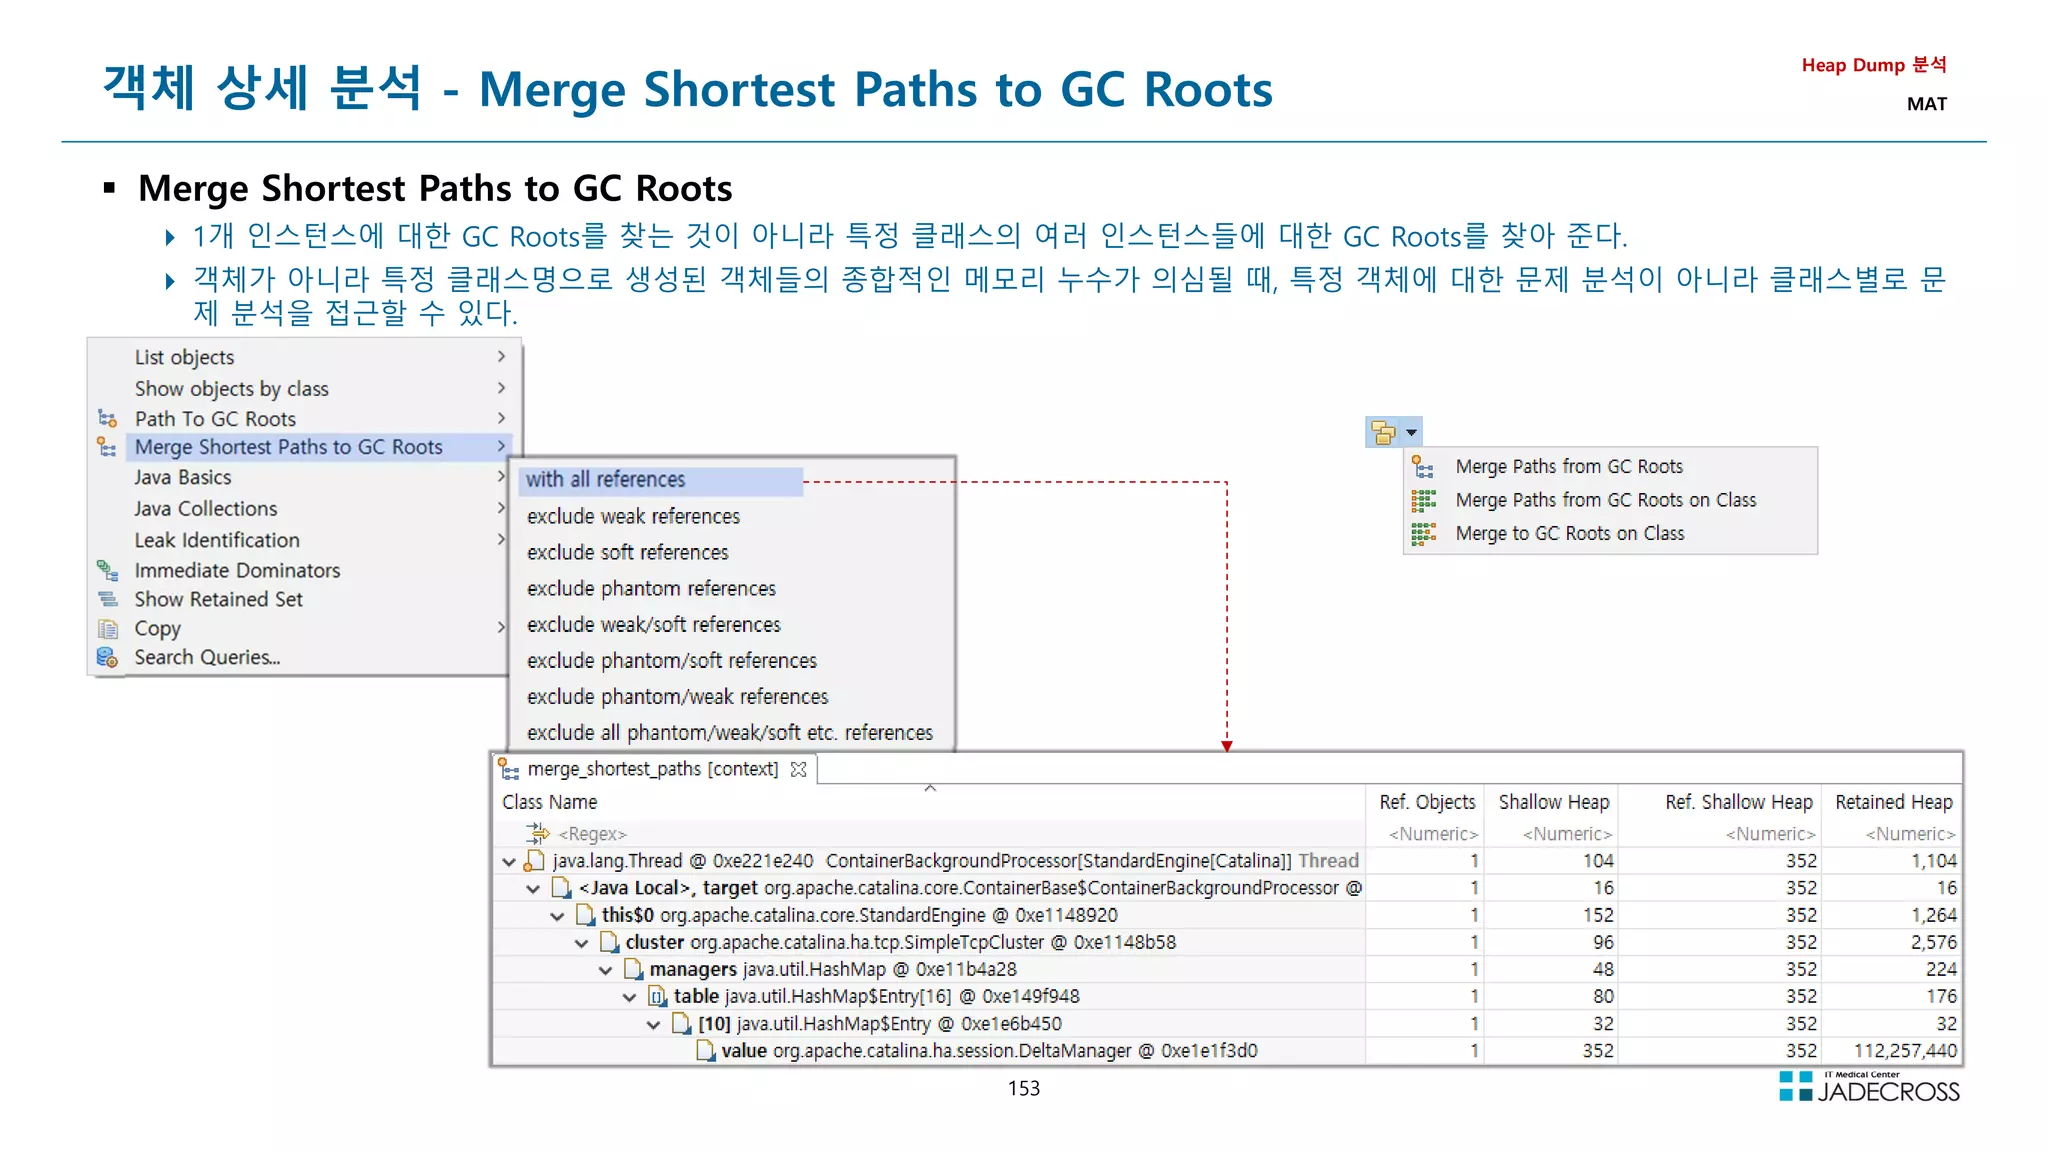
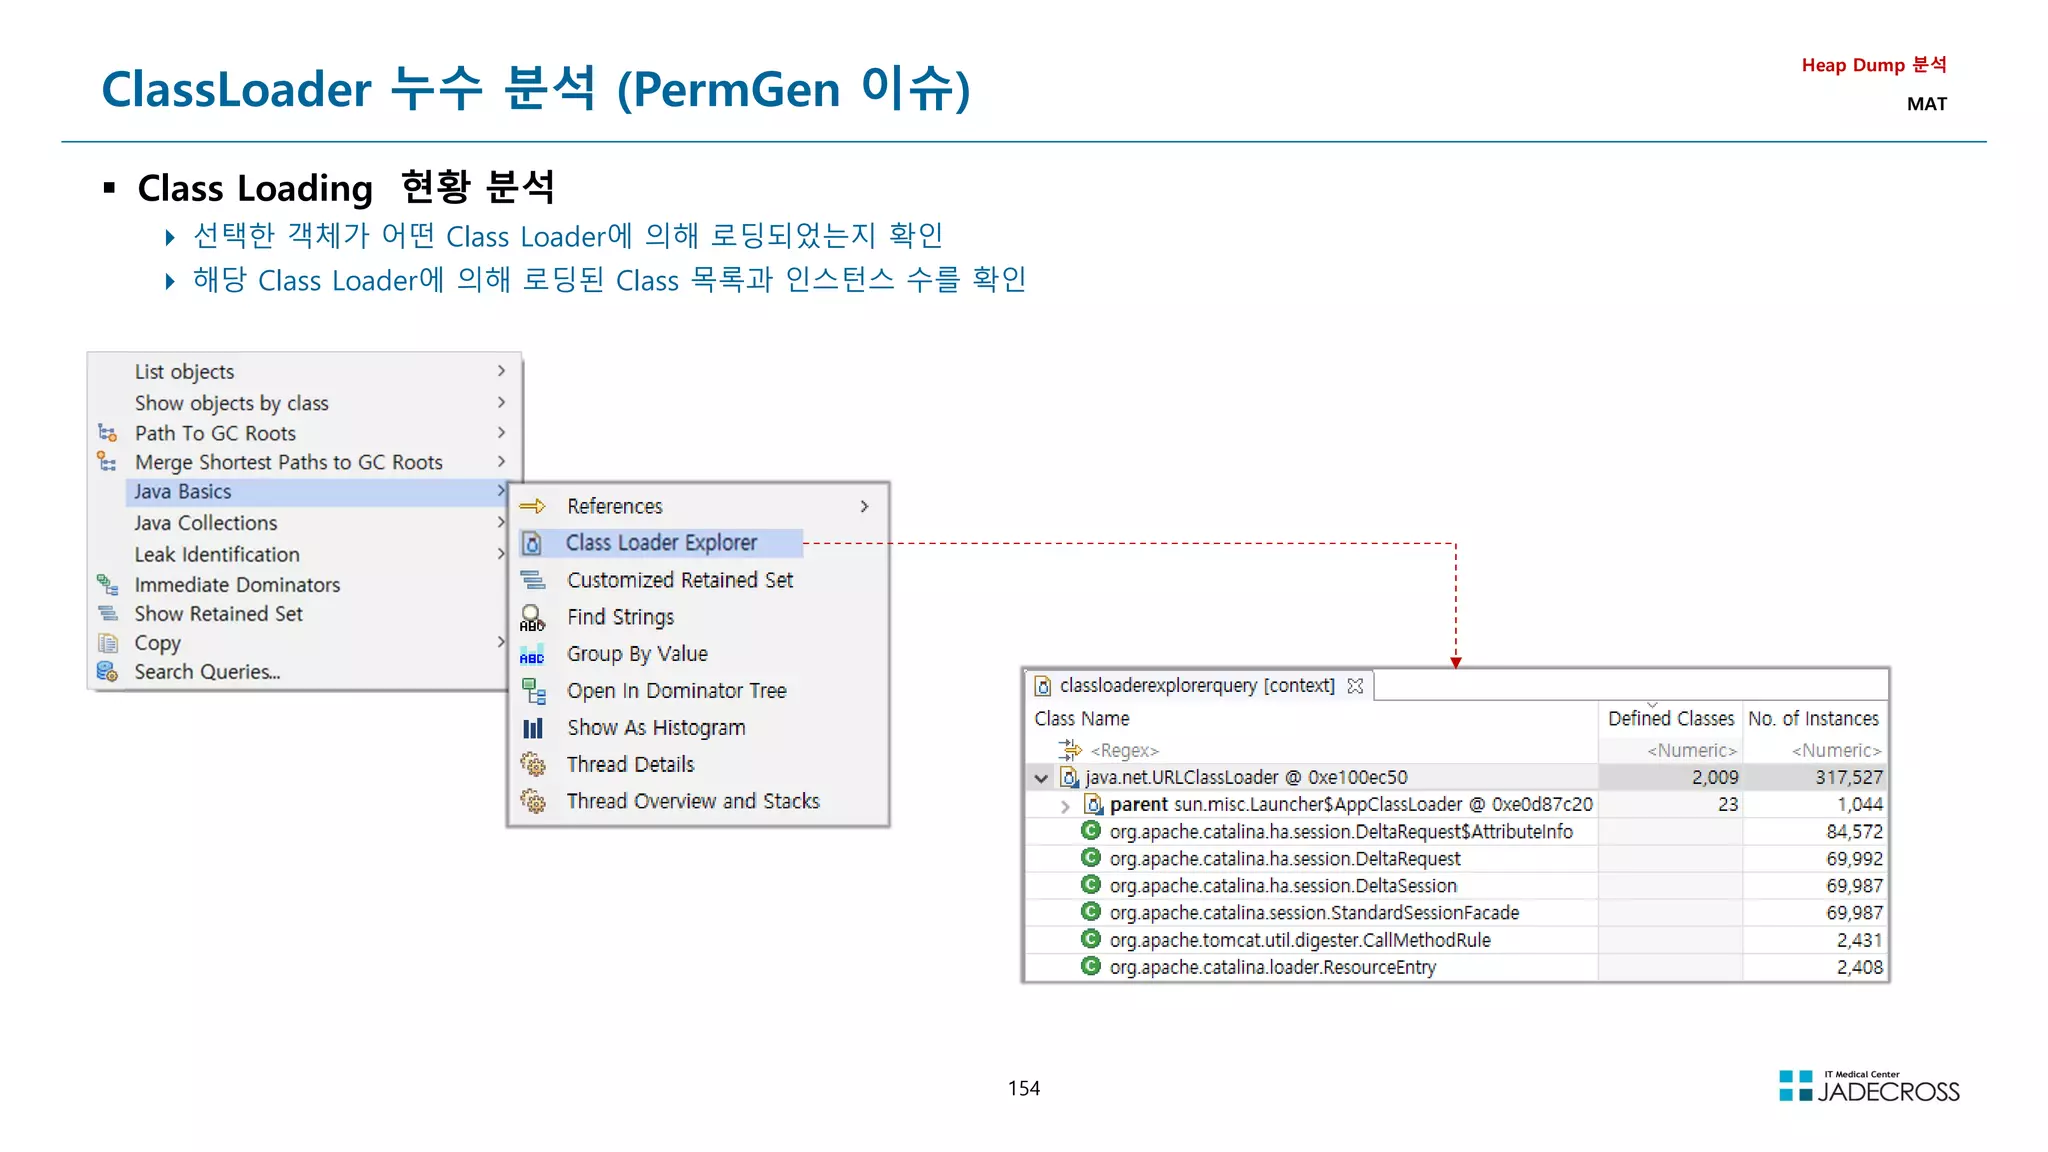
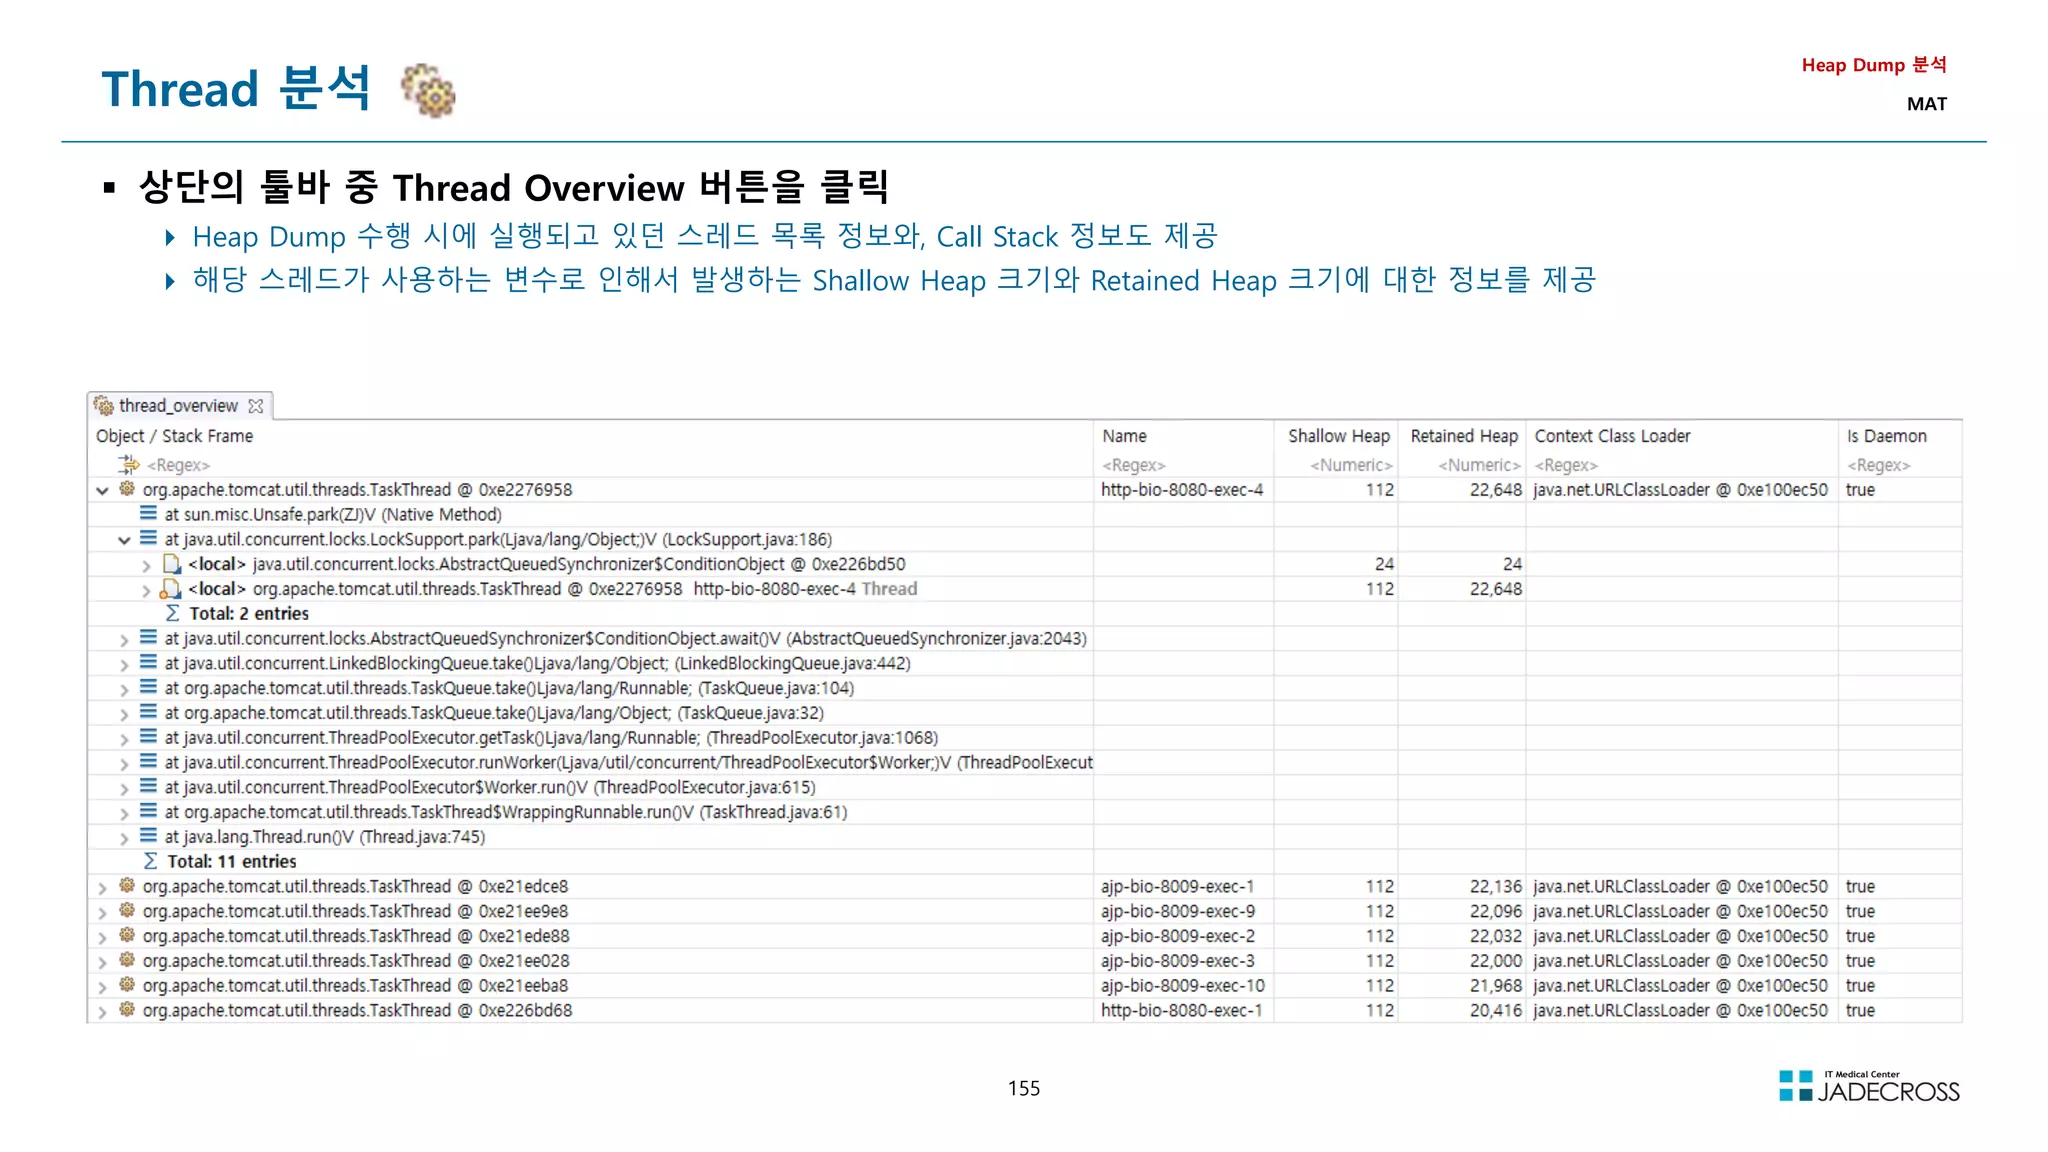
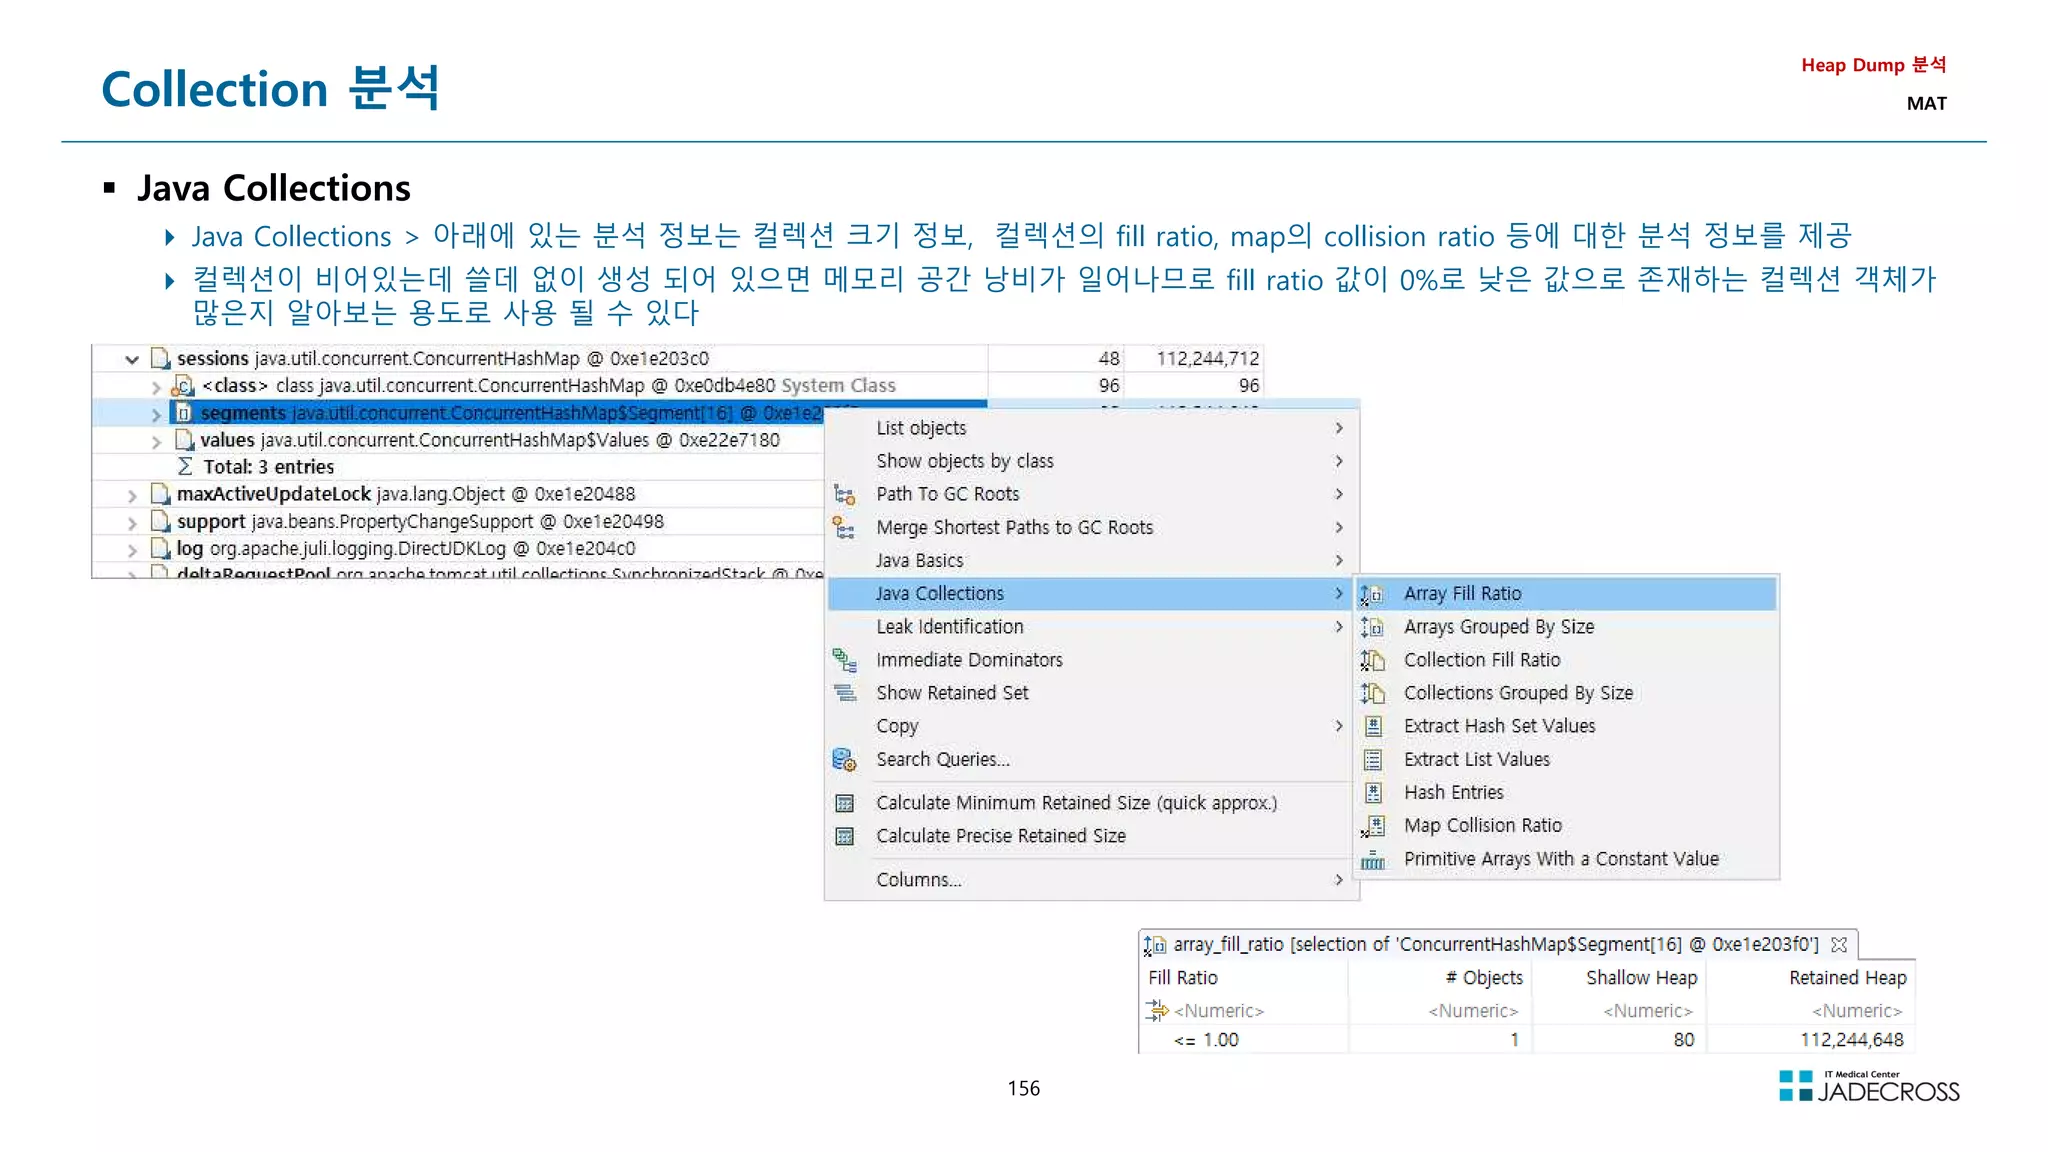
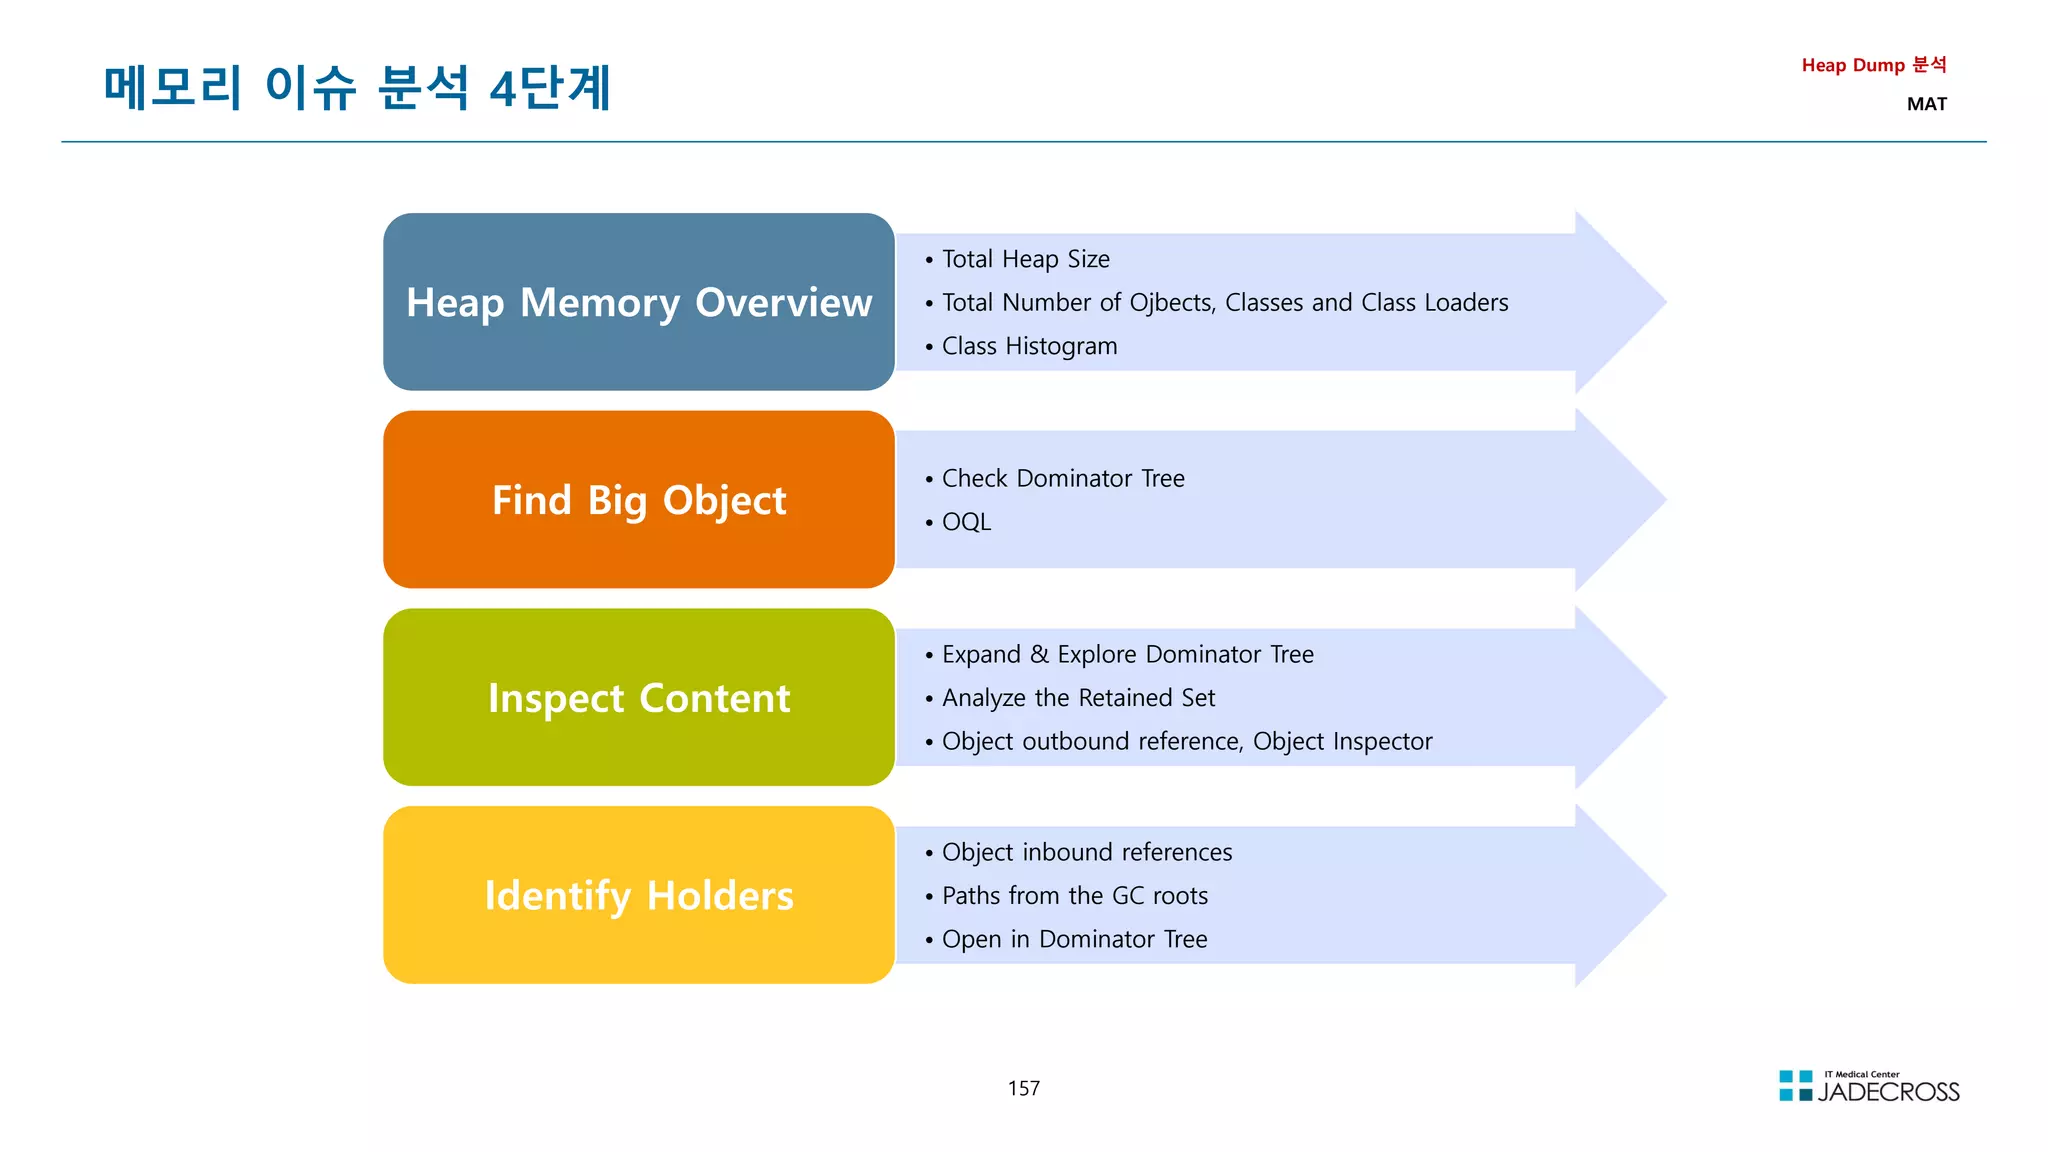
![158
LAB) Heap Dump 분석 : Heap OOM (1/4)
개요
오랫동안 살아있는 객체를 Heap에 조금씩 생성했을 Heap 메모리 변화와 OOM을 관찰한 후 원인을 Heap Dump를 이용하여 분석
Heap Dump 분석
com.jadecross.troubleshoot.memory.OomTab.java
private java.util.ArrayList list = new java.util.ArrayList();
/**
* Heap OOM 발생 - 한번 호출할때마다 25m Heap 사용
*/
private void genHeapOom() {
for (int i = 0; i 25000; i++) {
list.add(new byte[1000]);
}
}](https://image.slidesharecdn.com/jvm-230511085906-be6f1201/75/JVM_-pdf-158-2048.jpg)
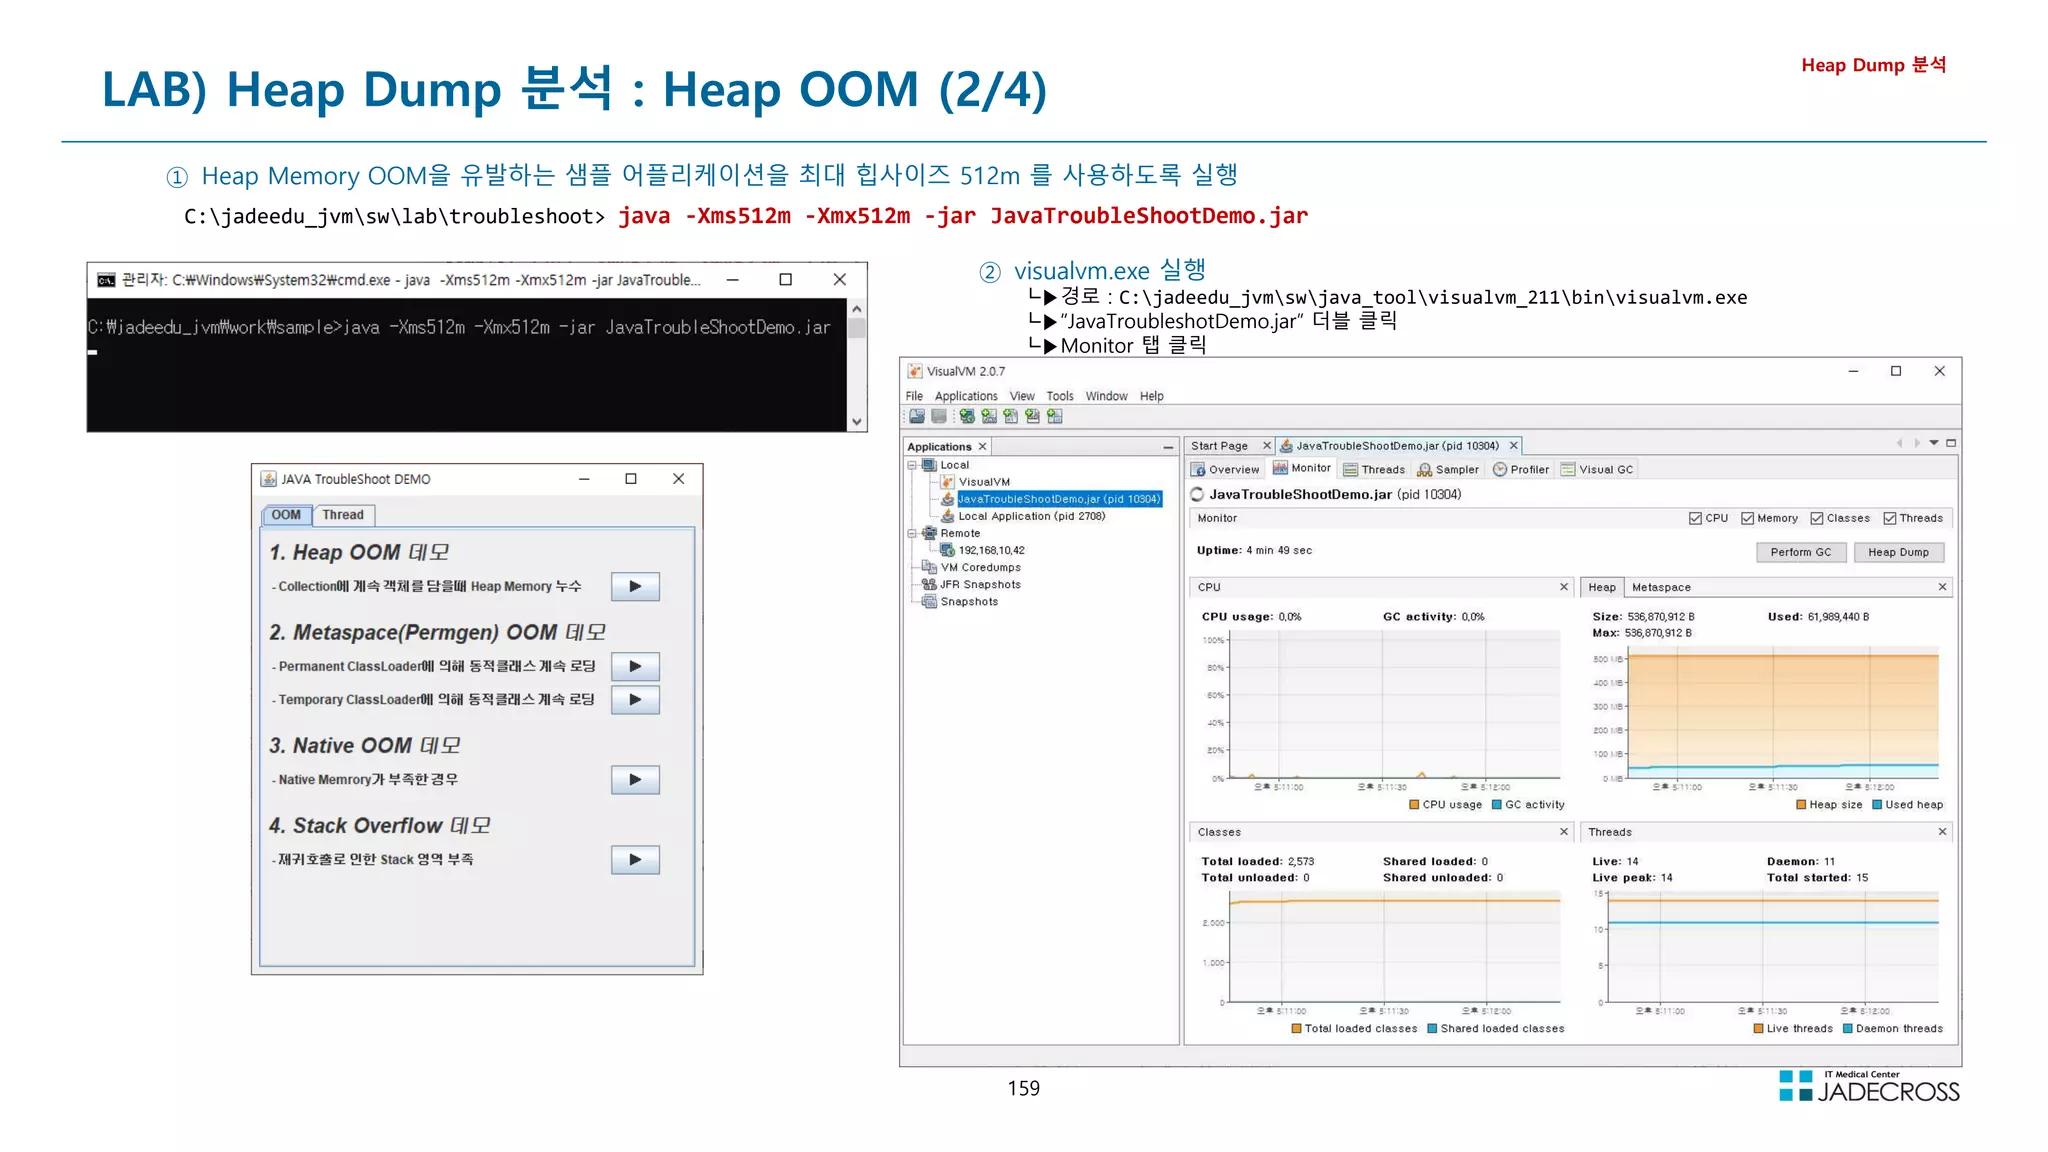
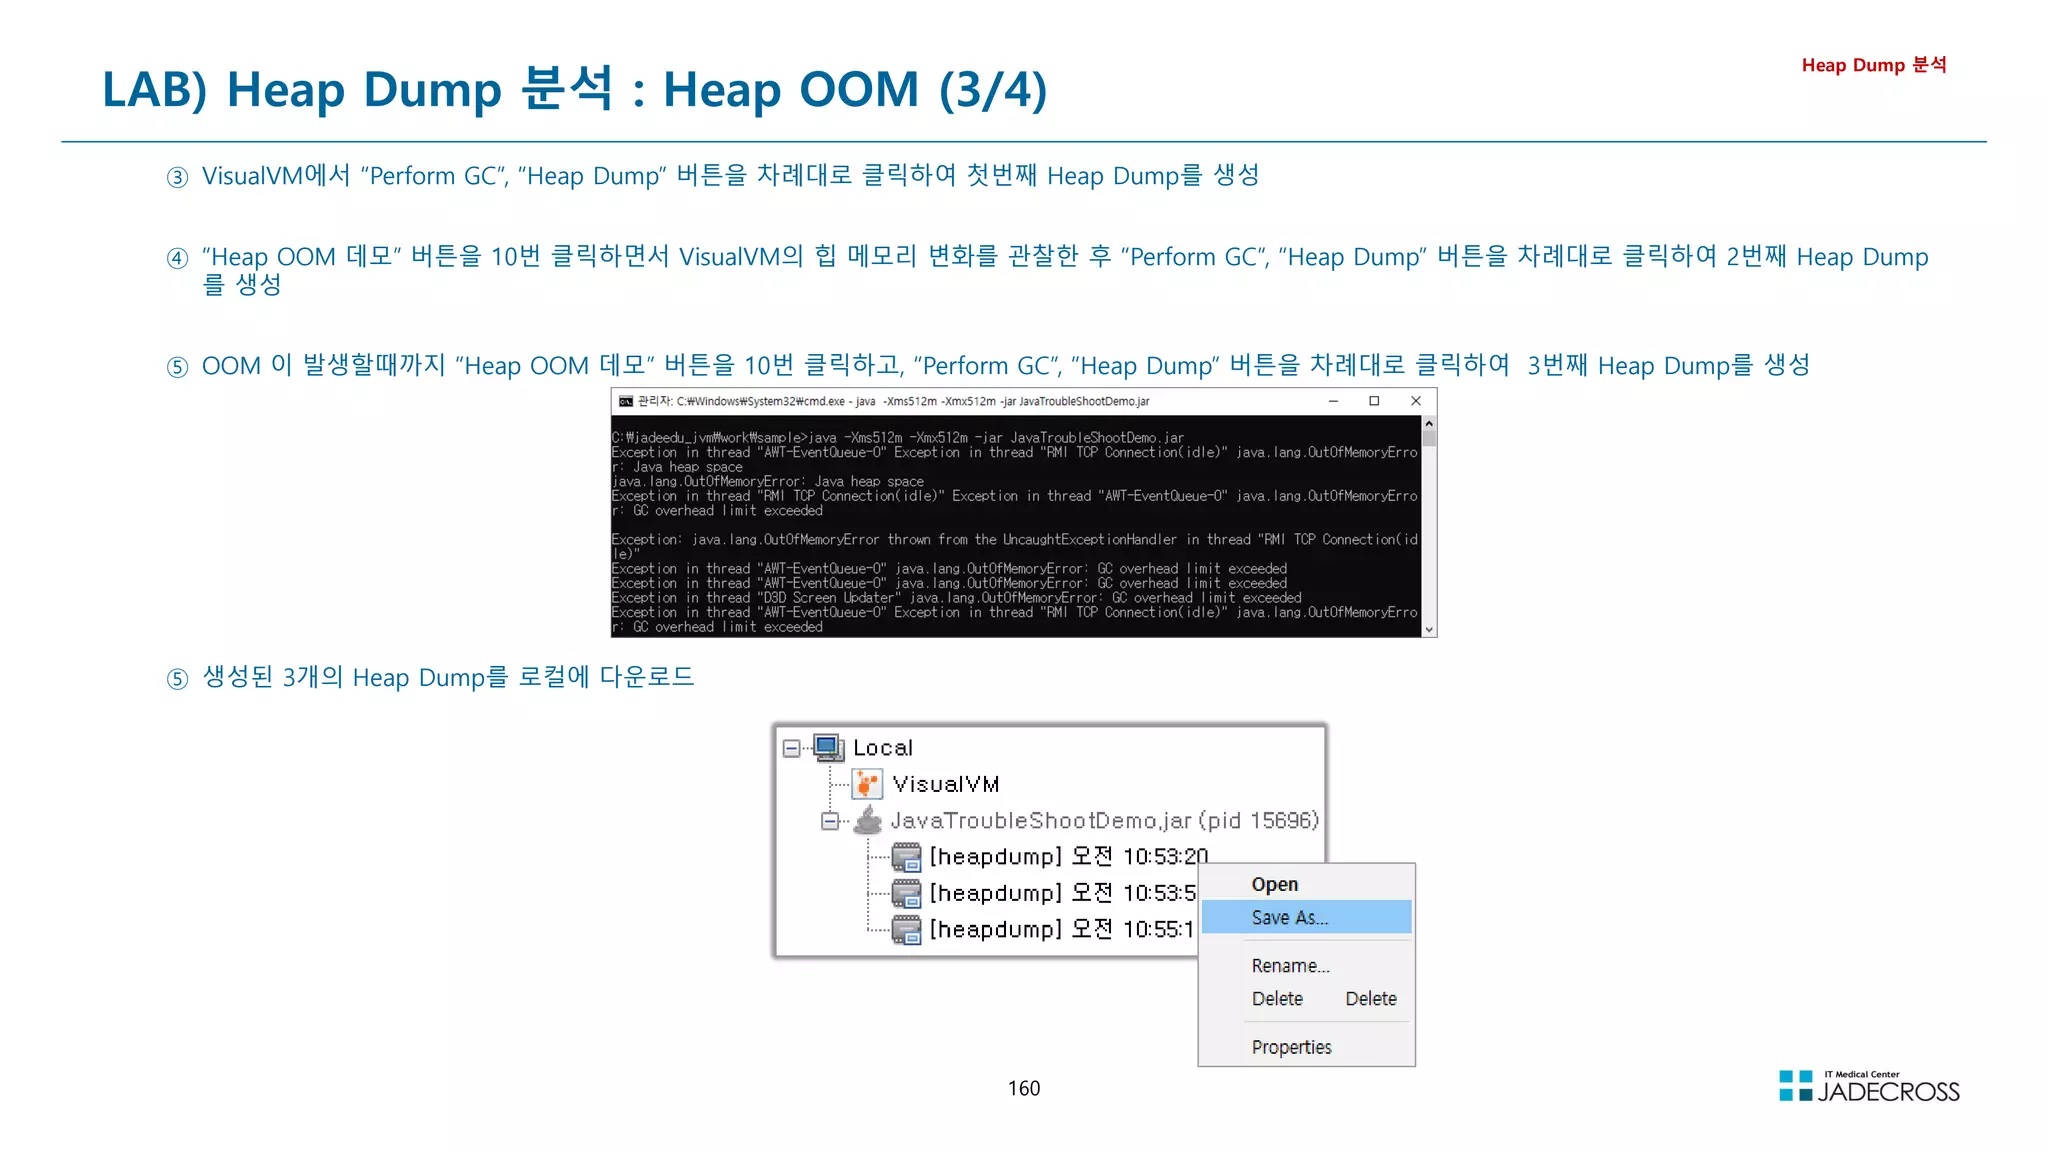
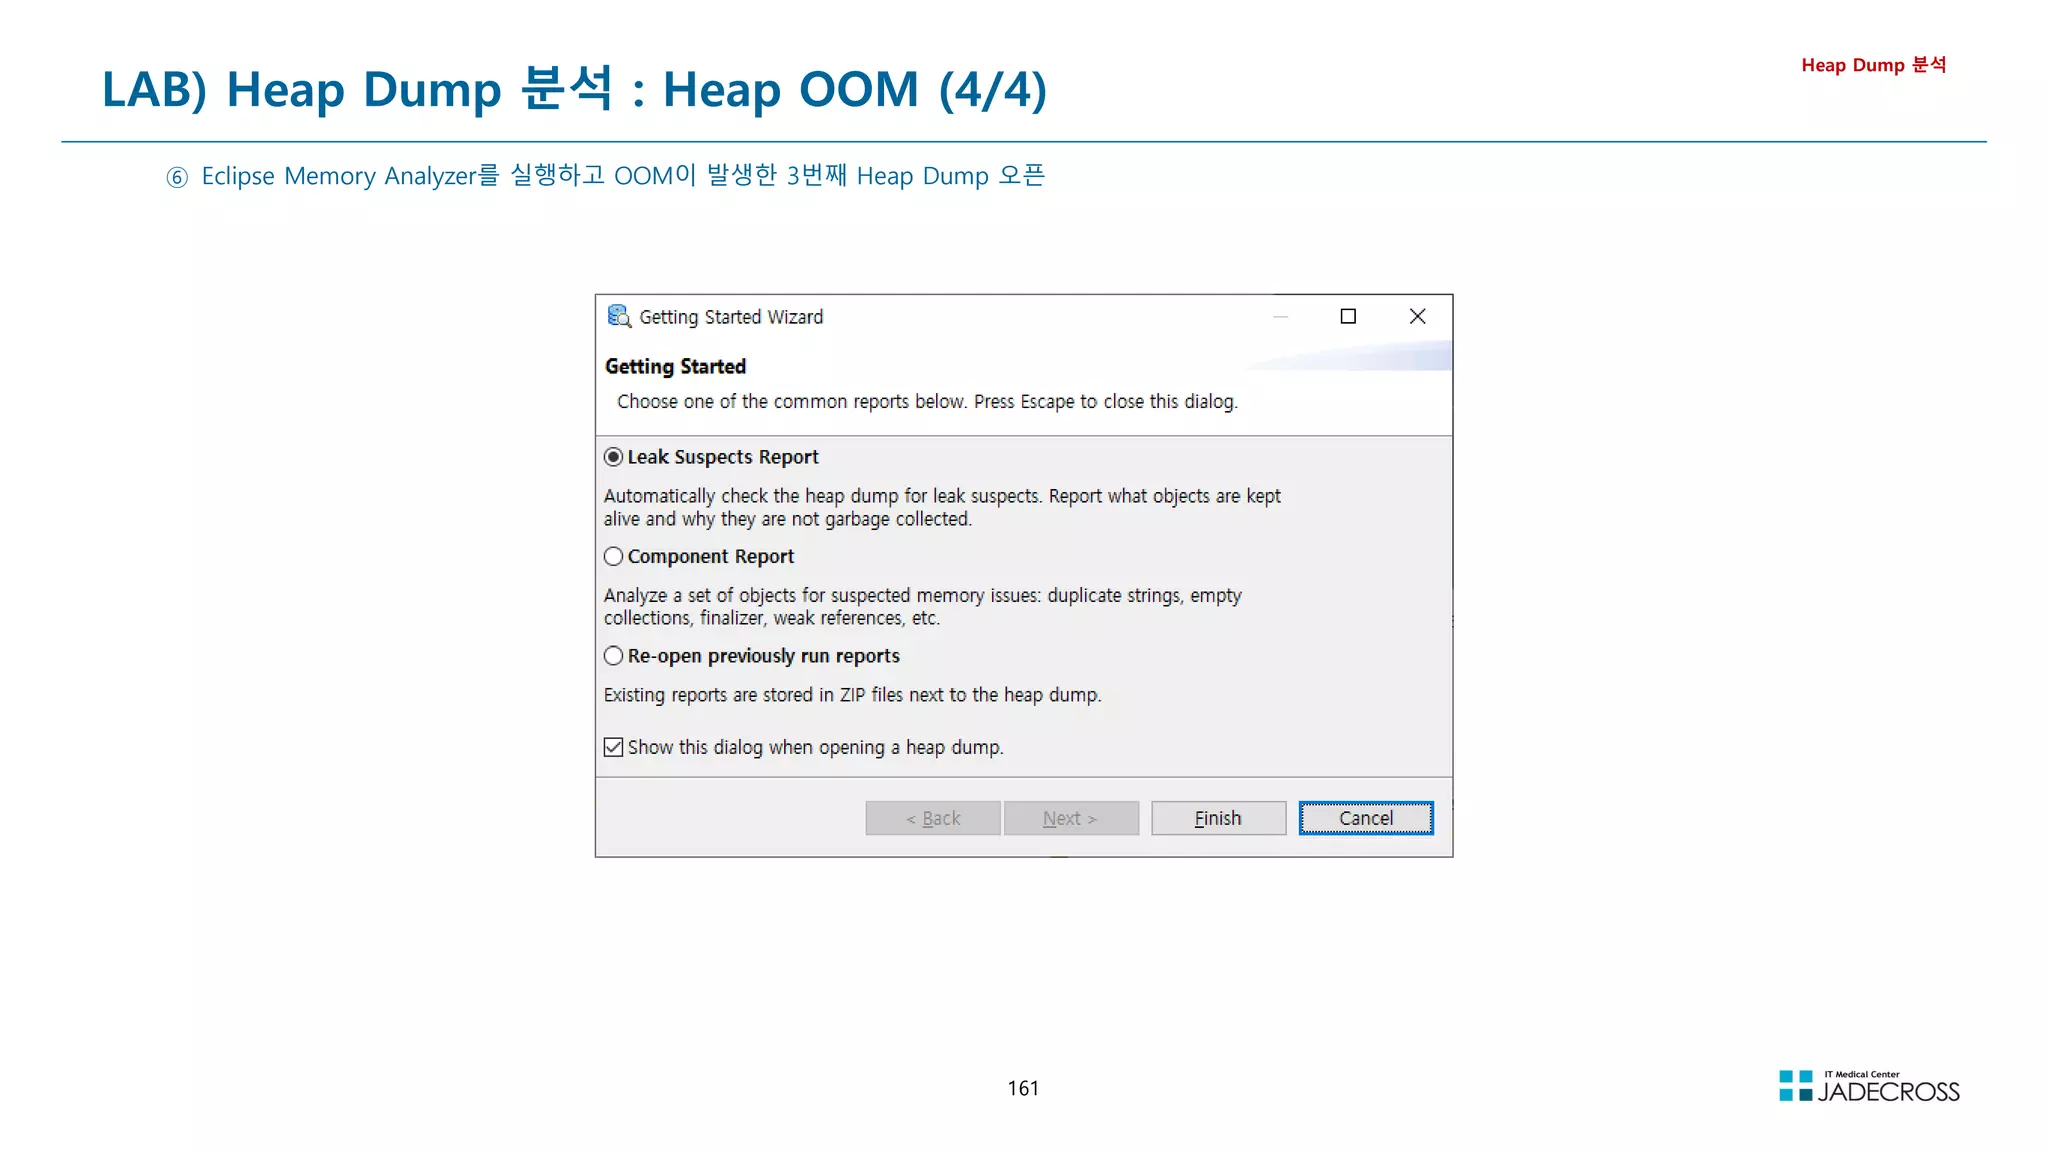
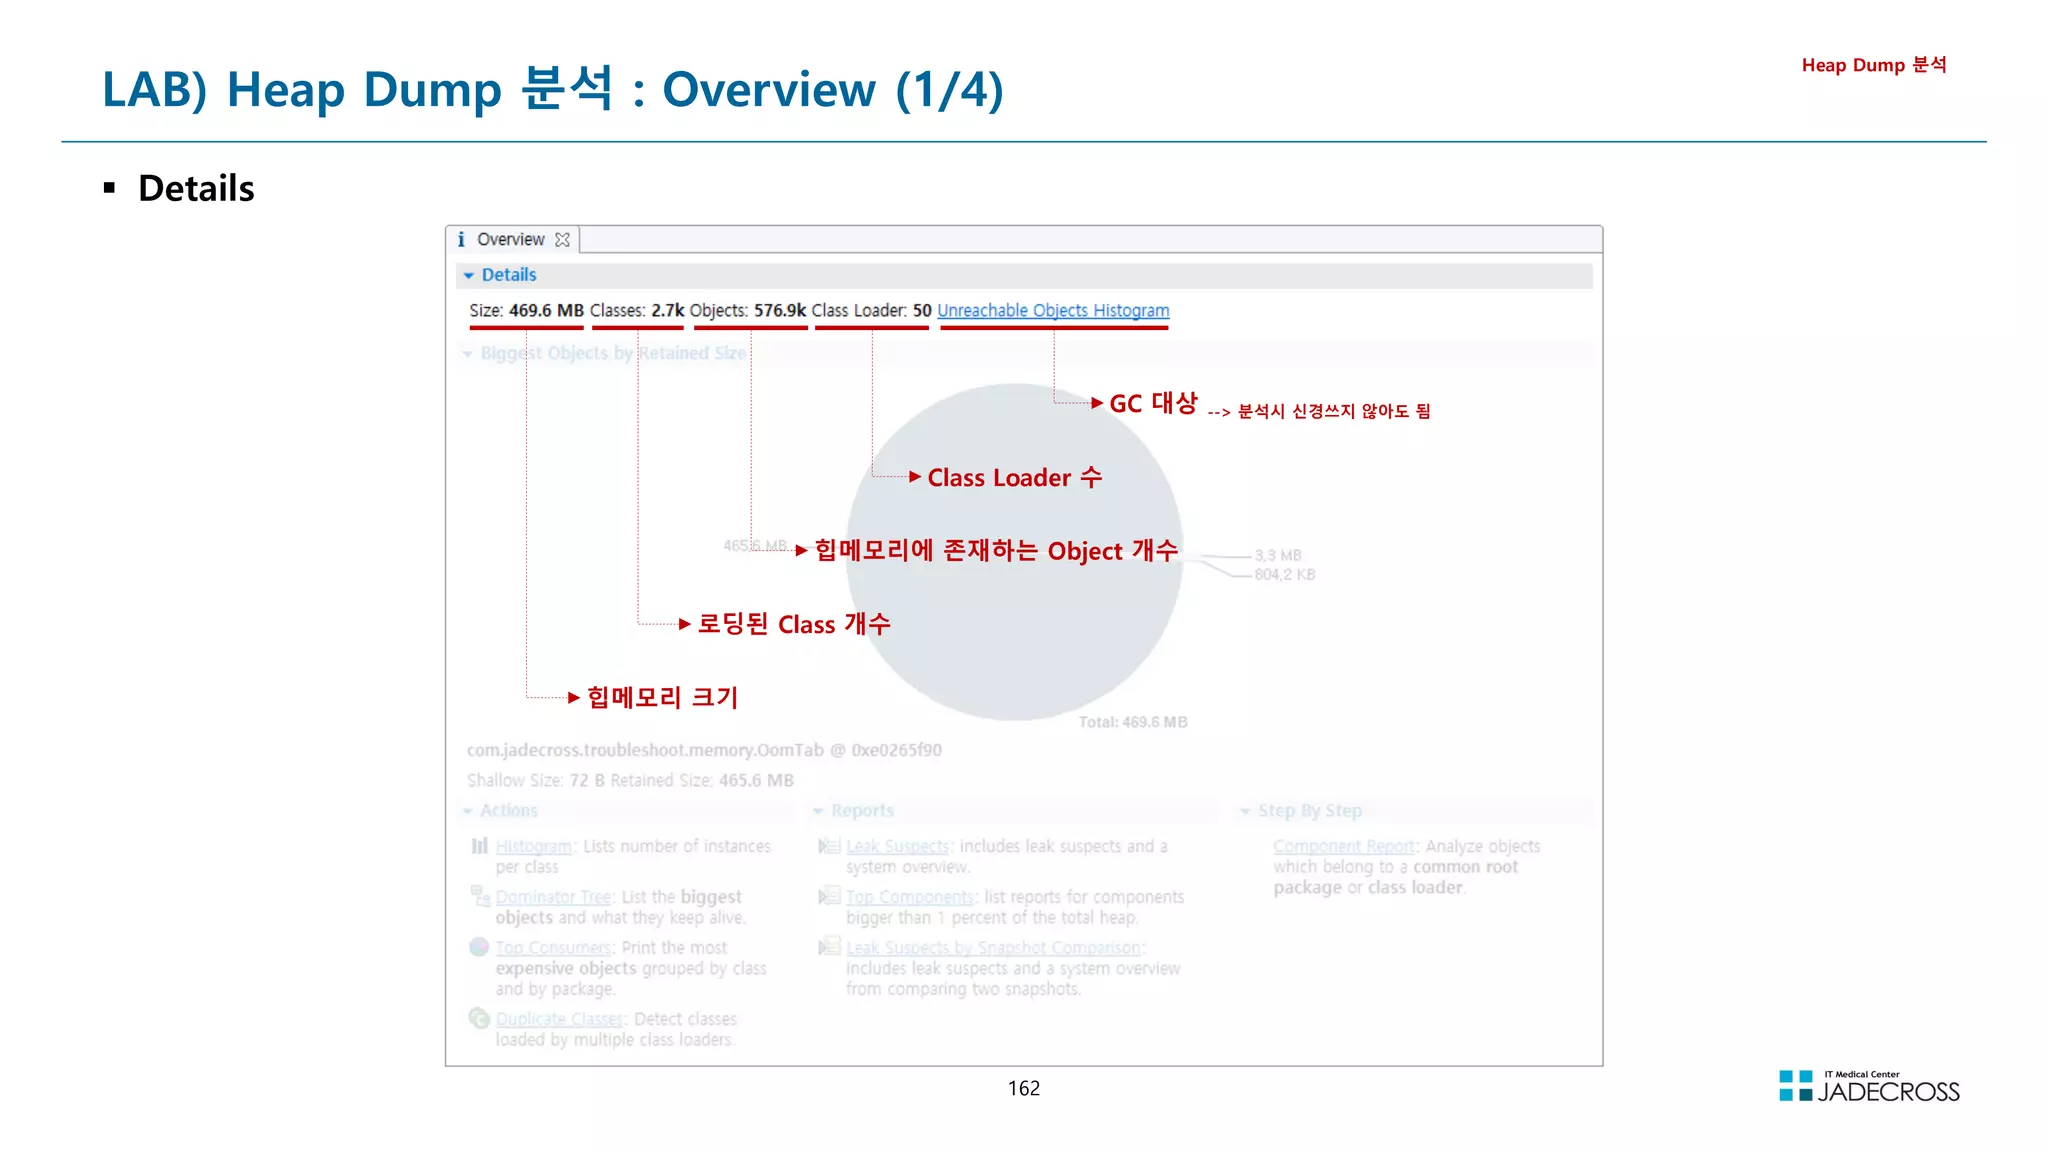
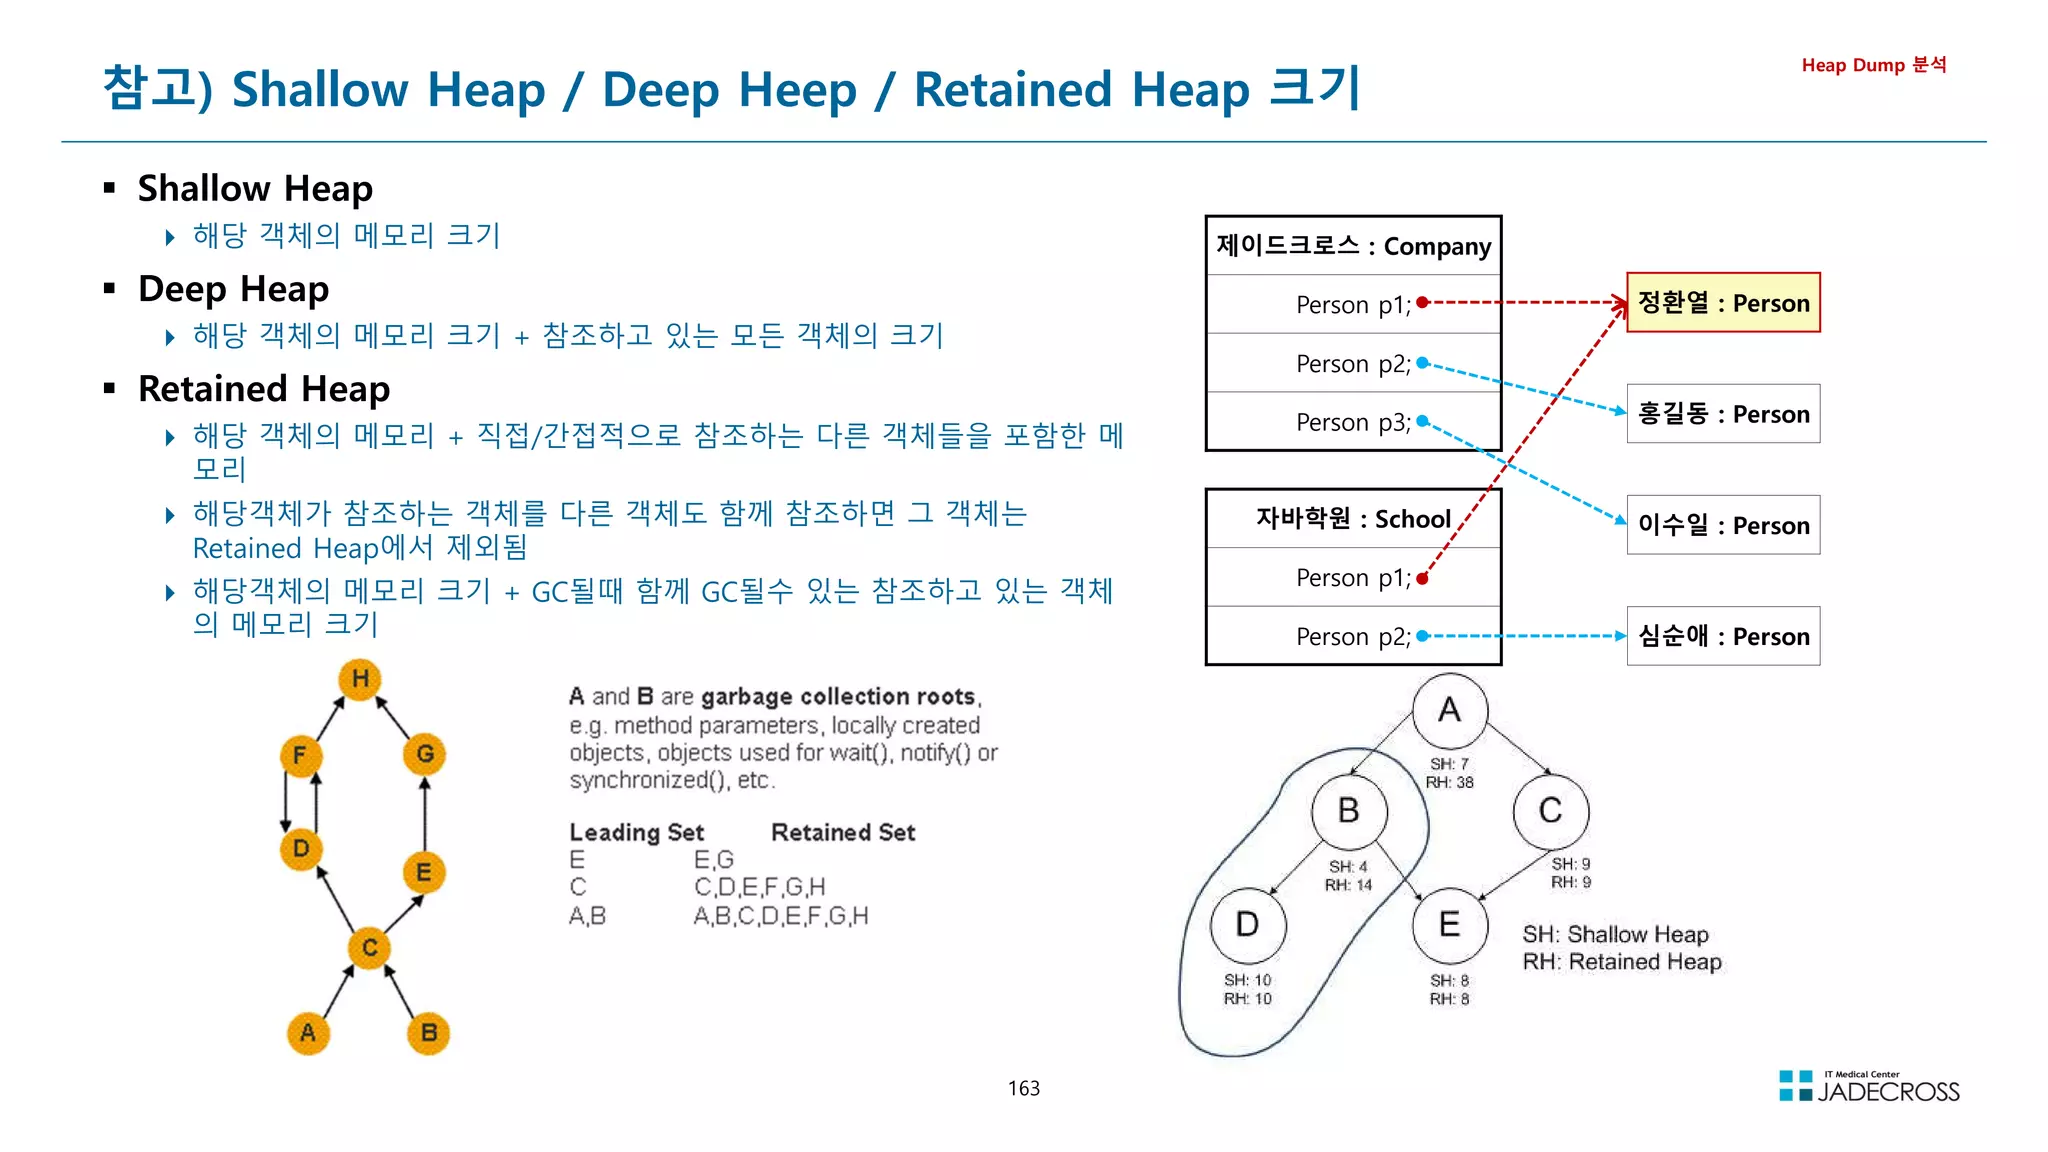
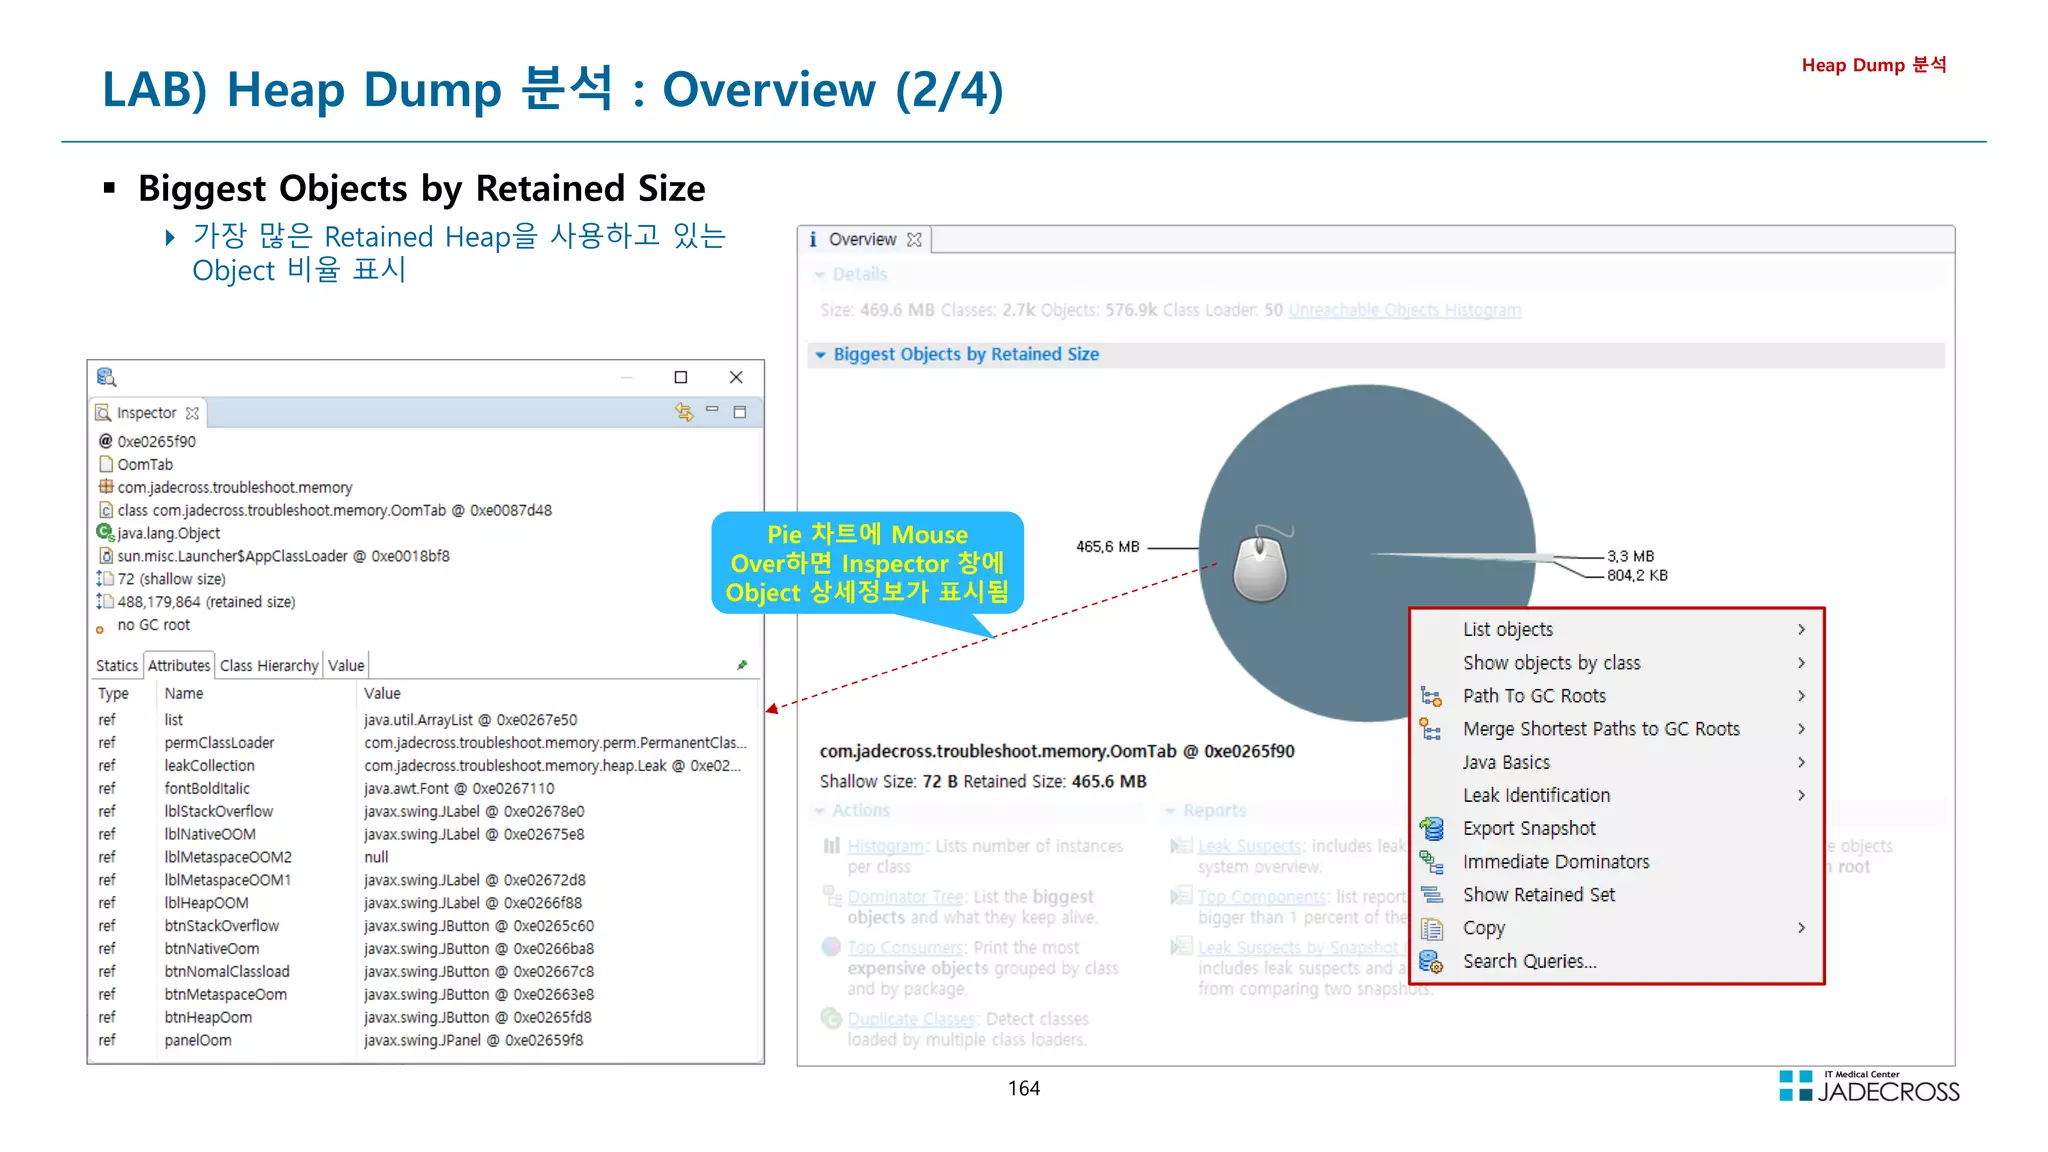
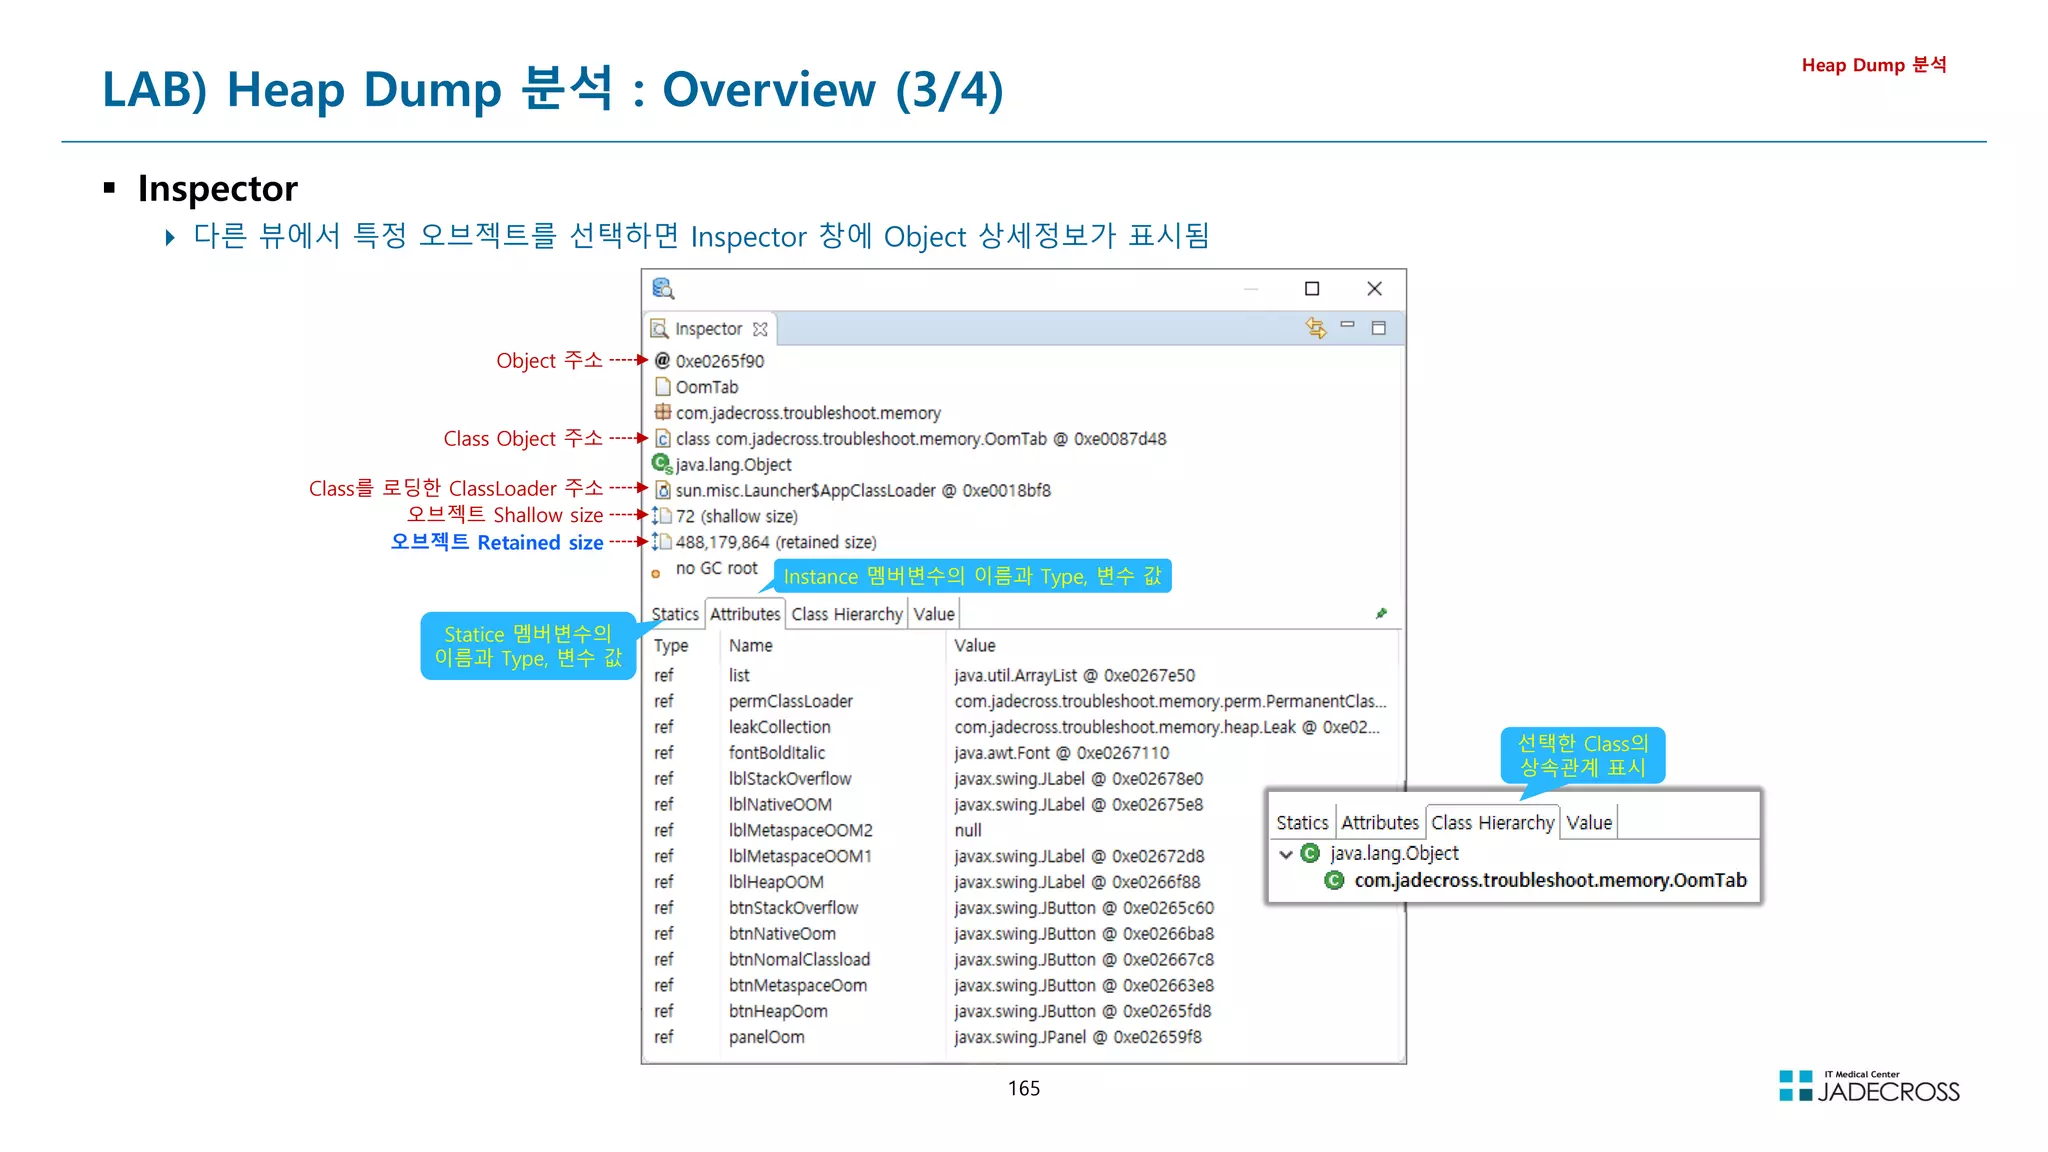
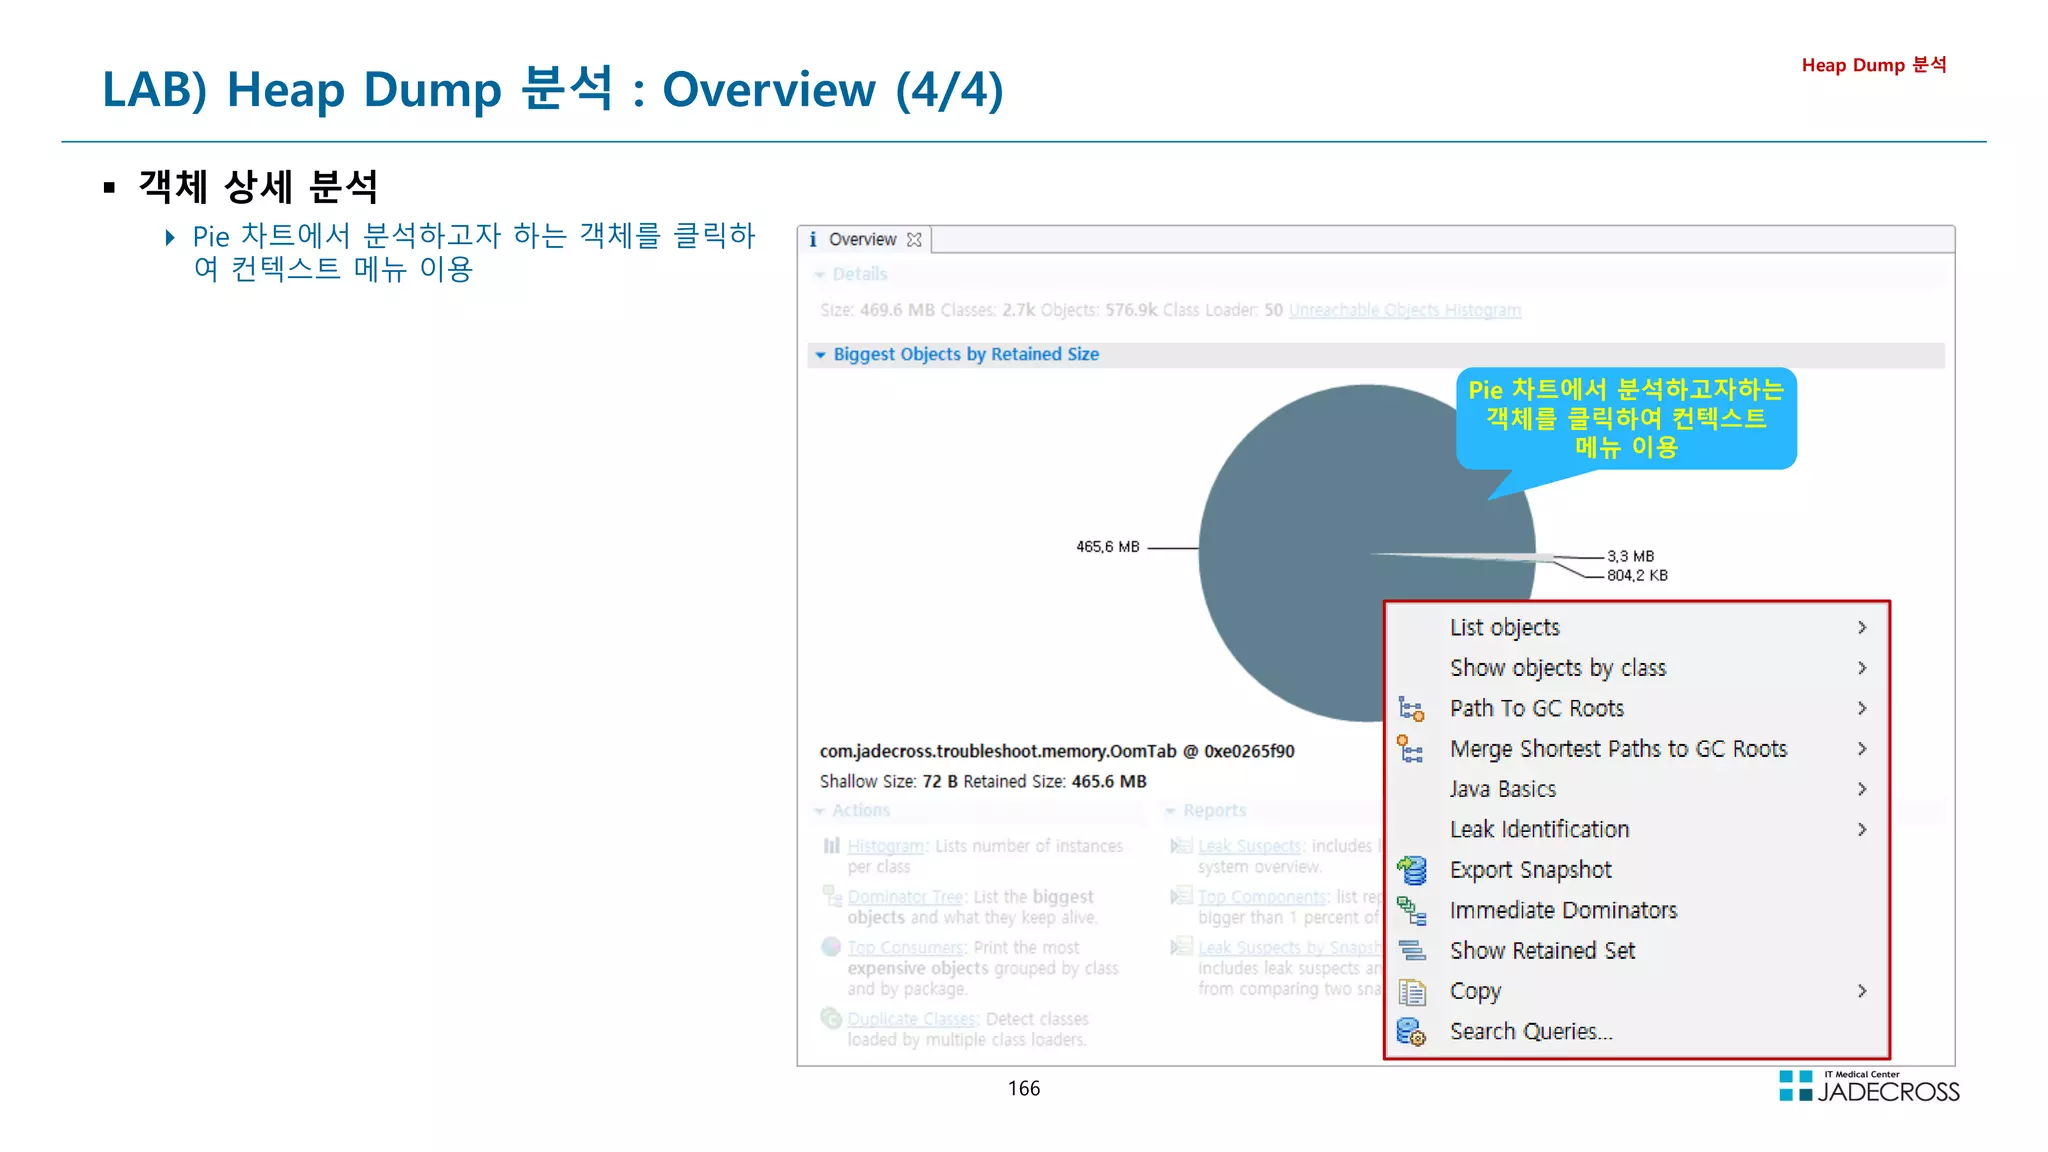
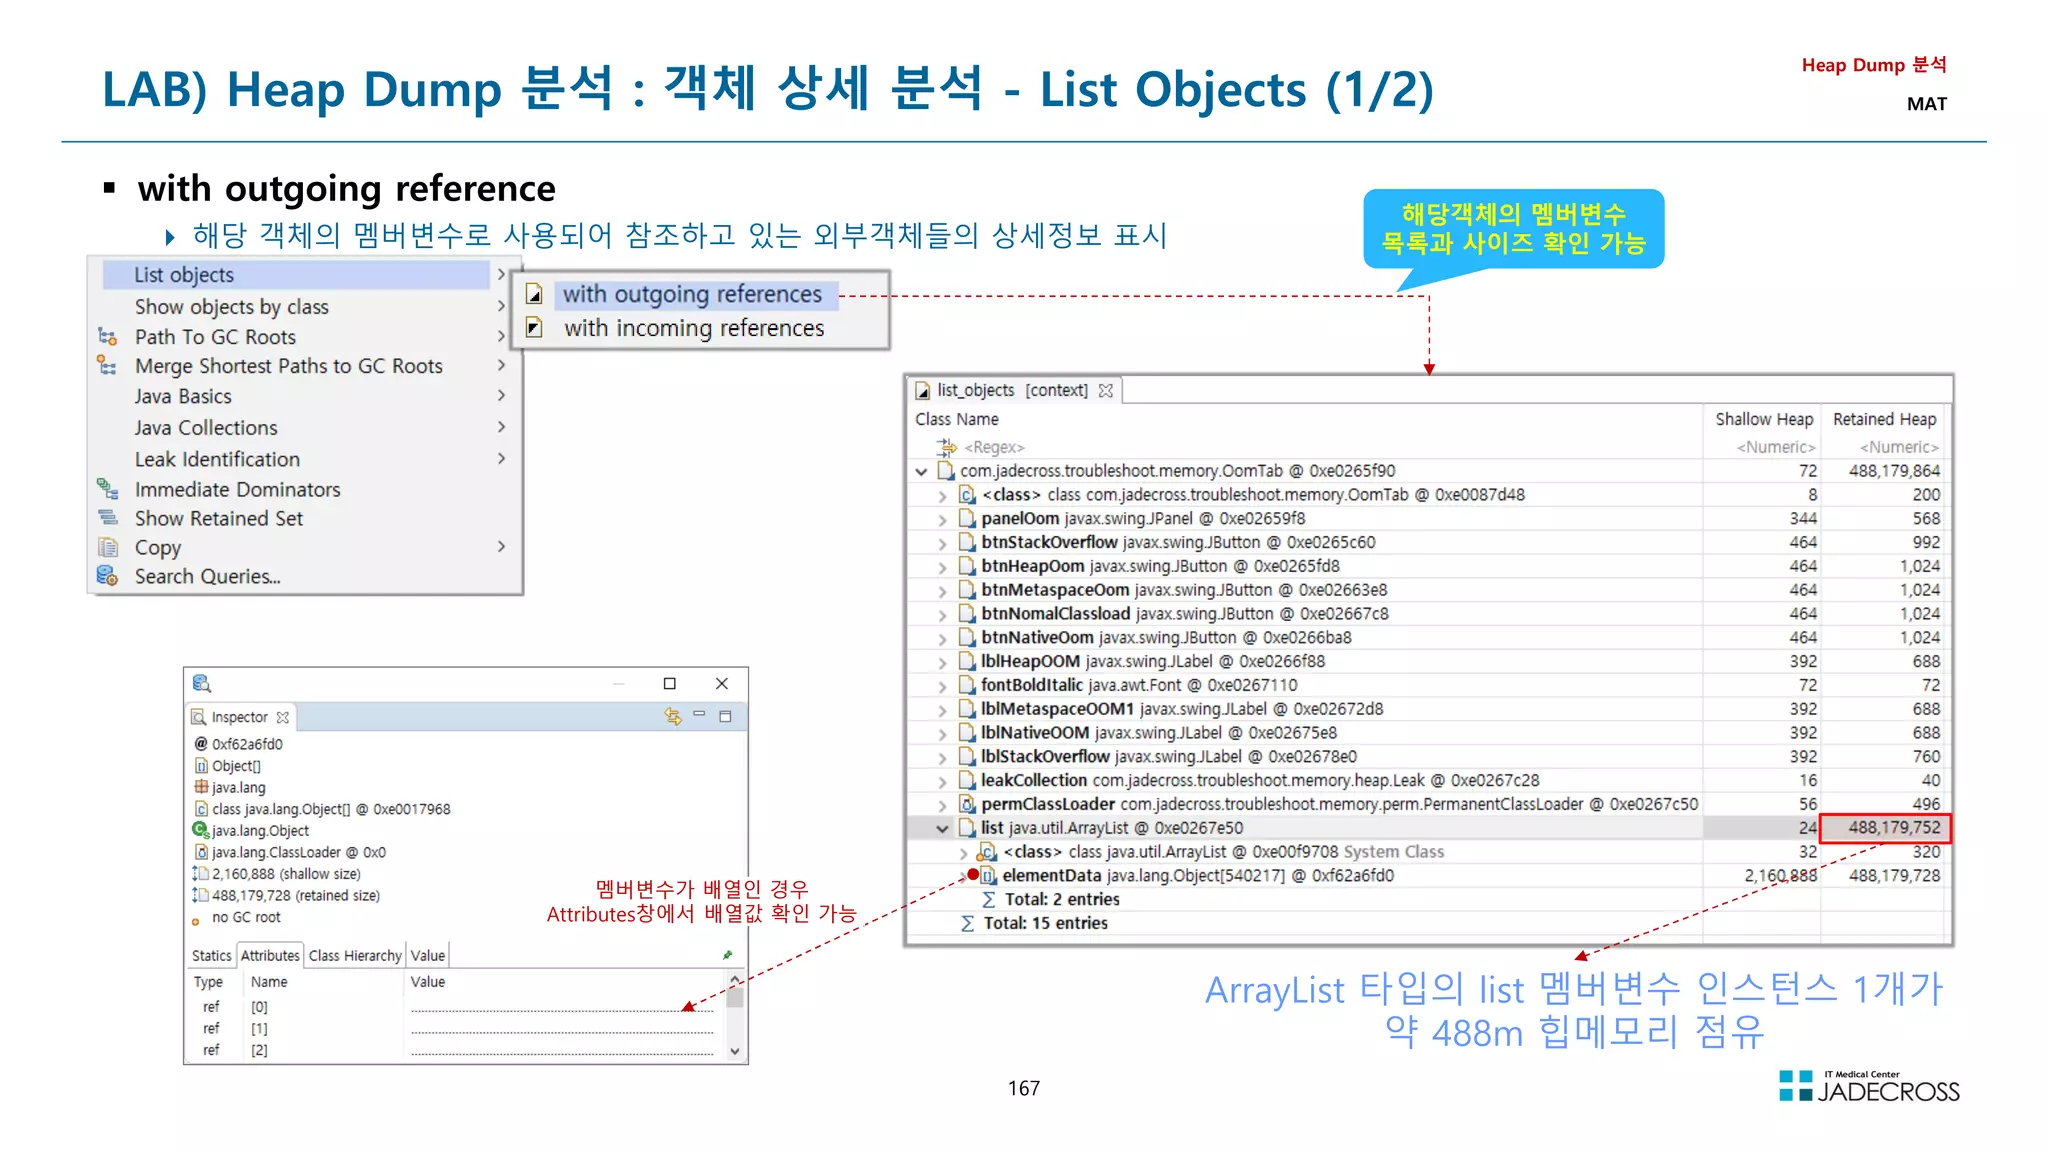
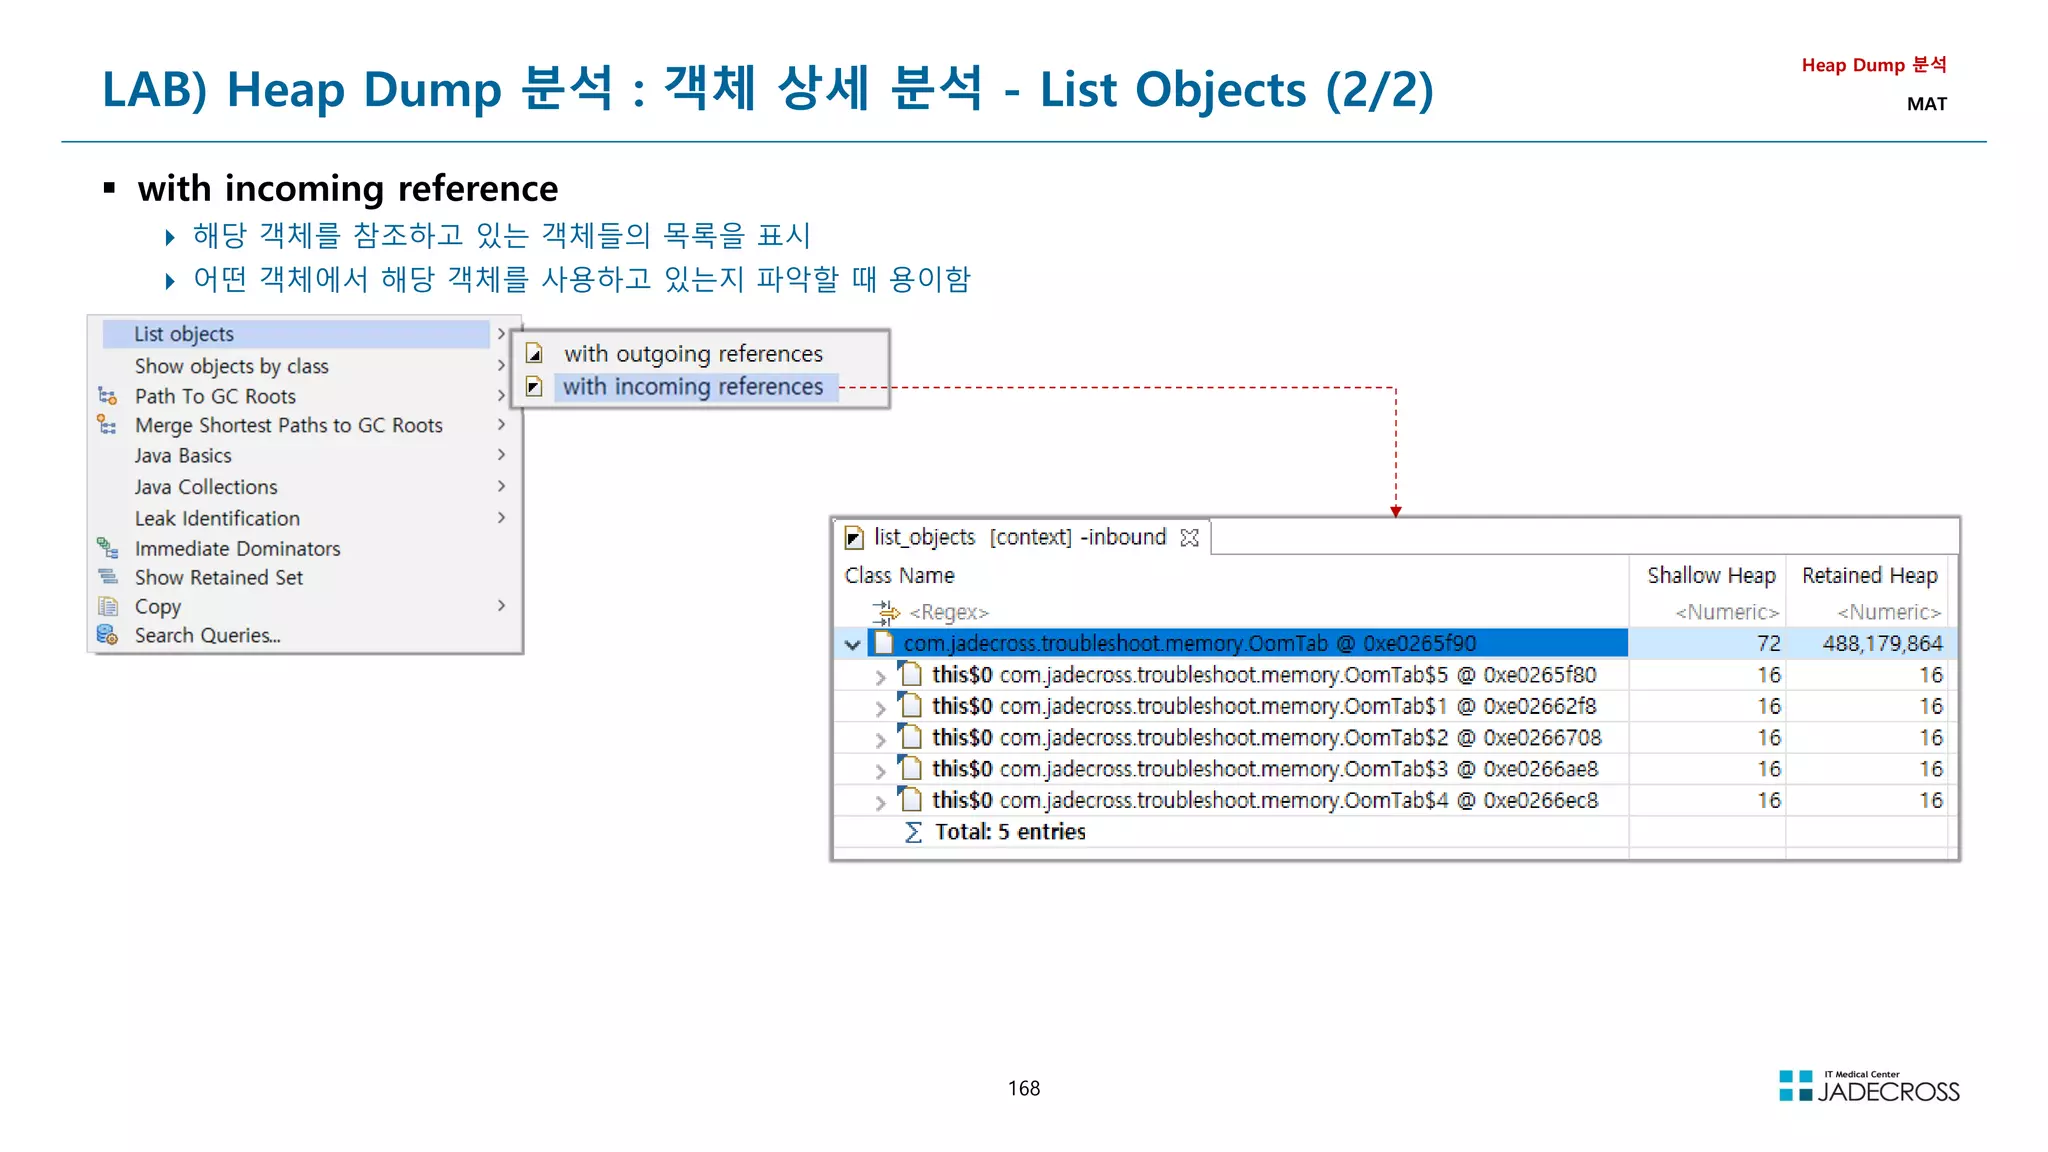
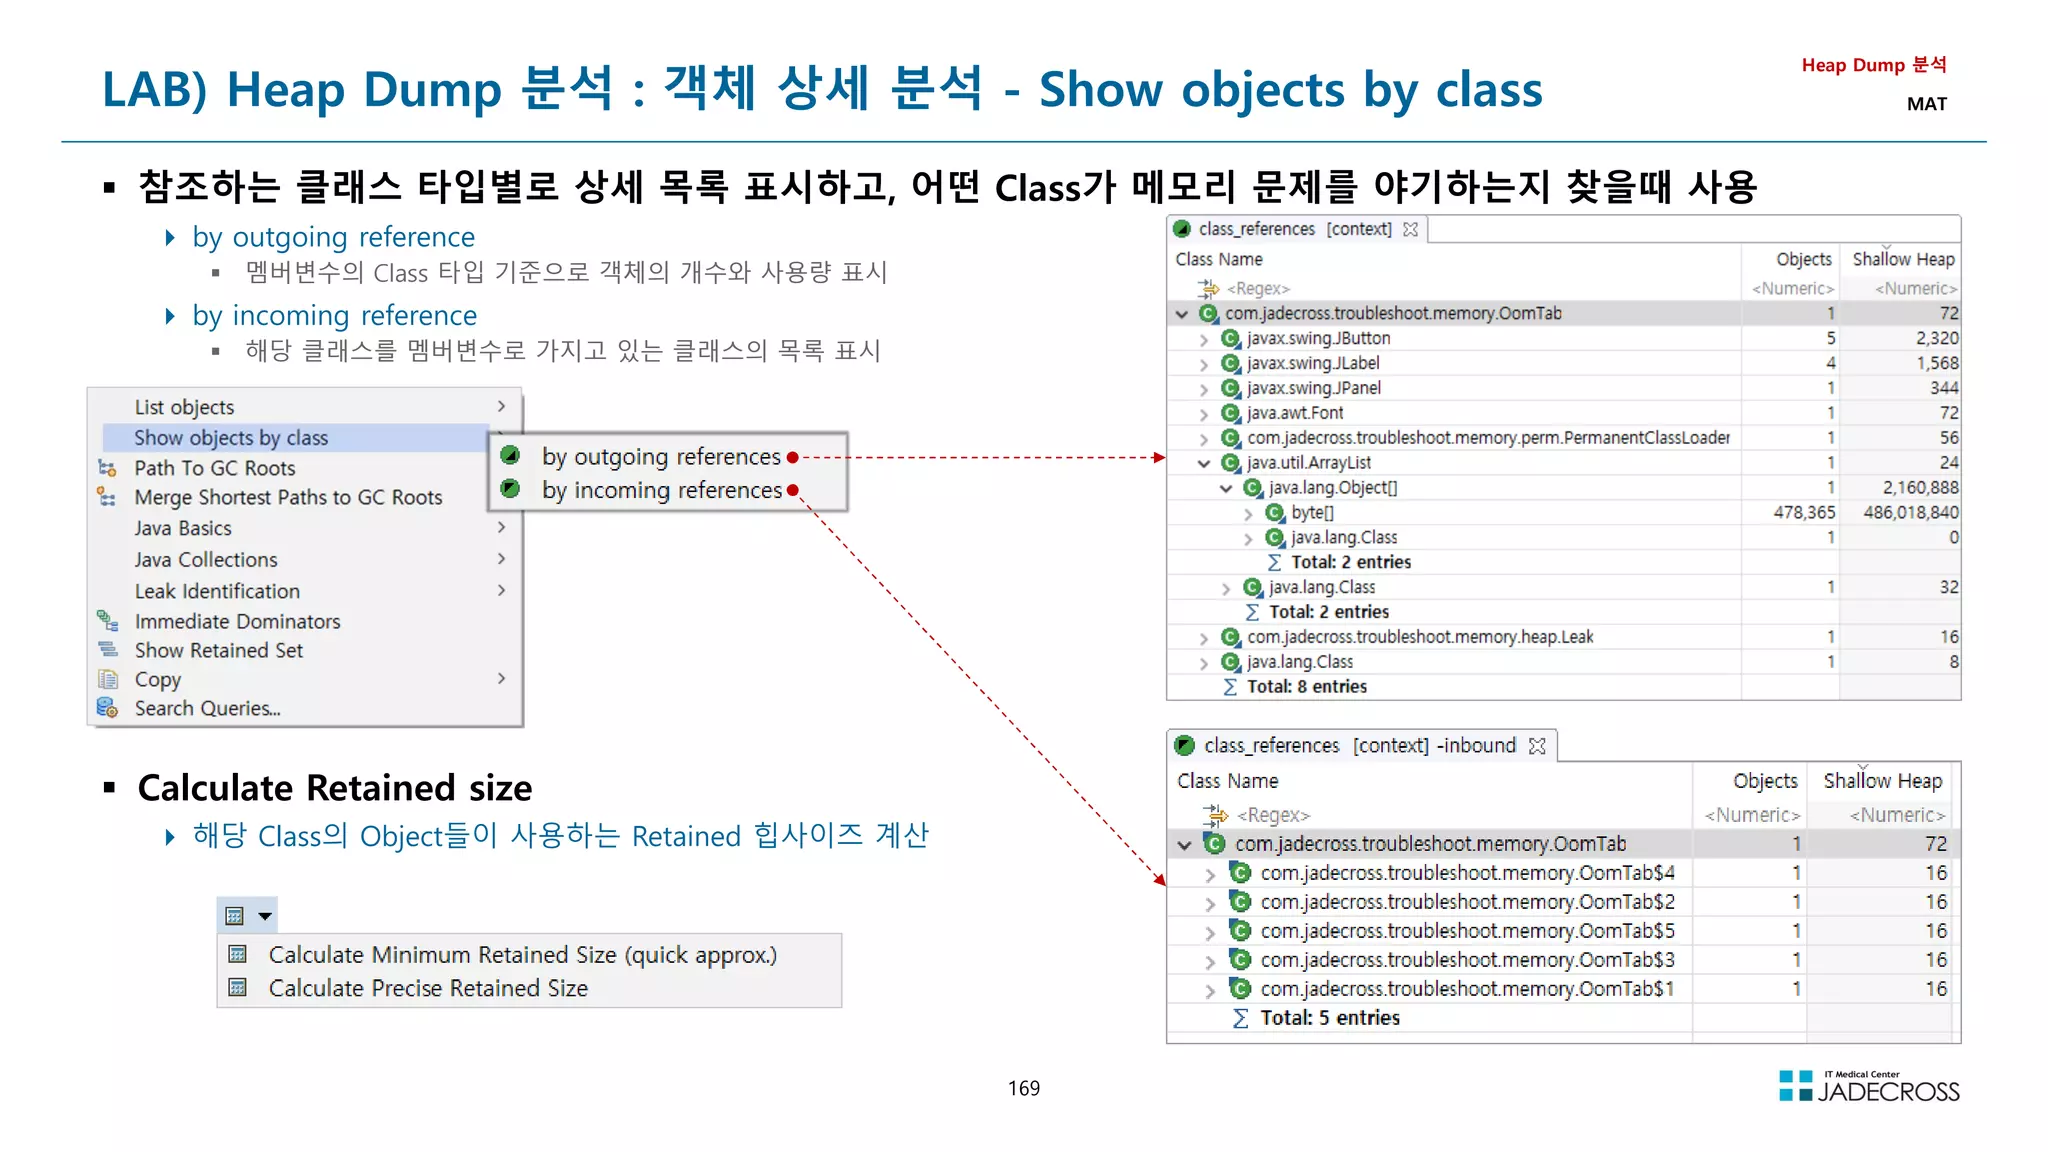
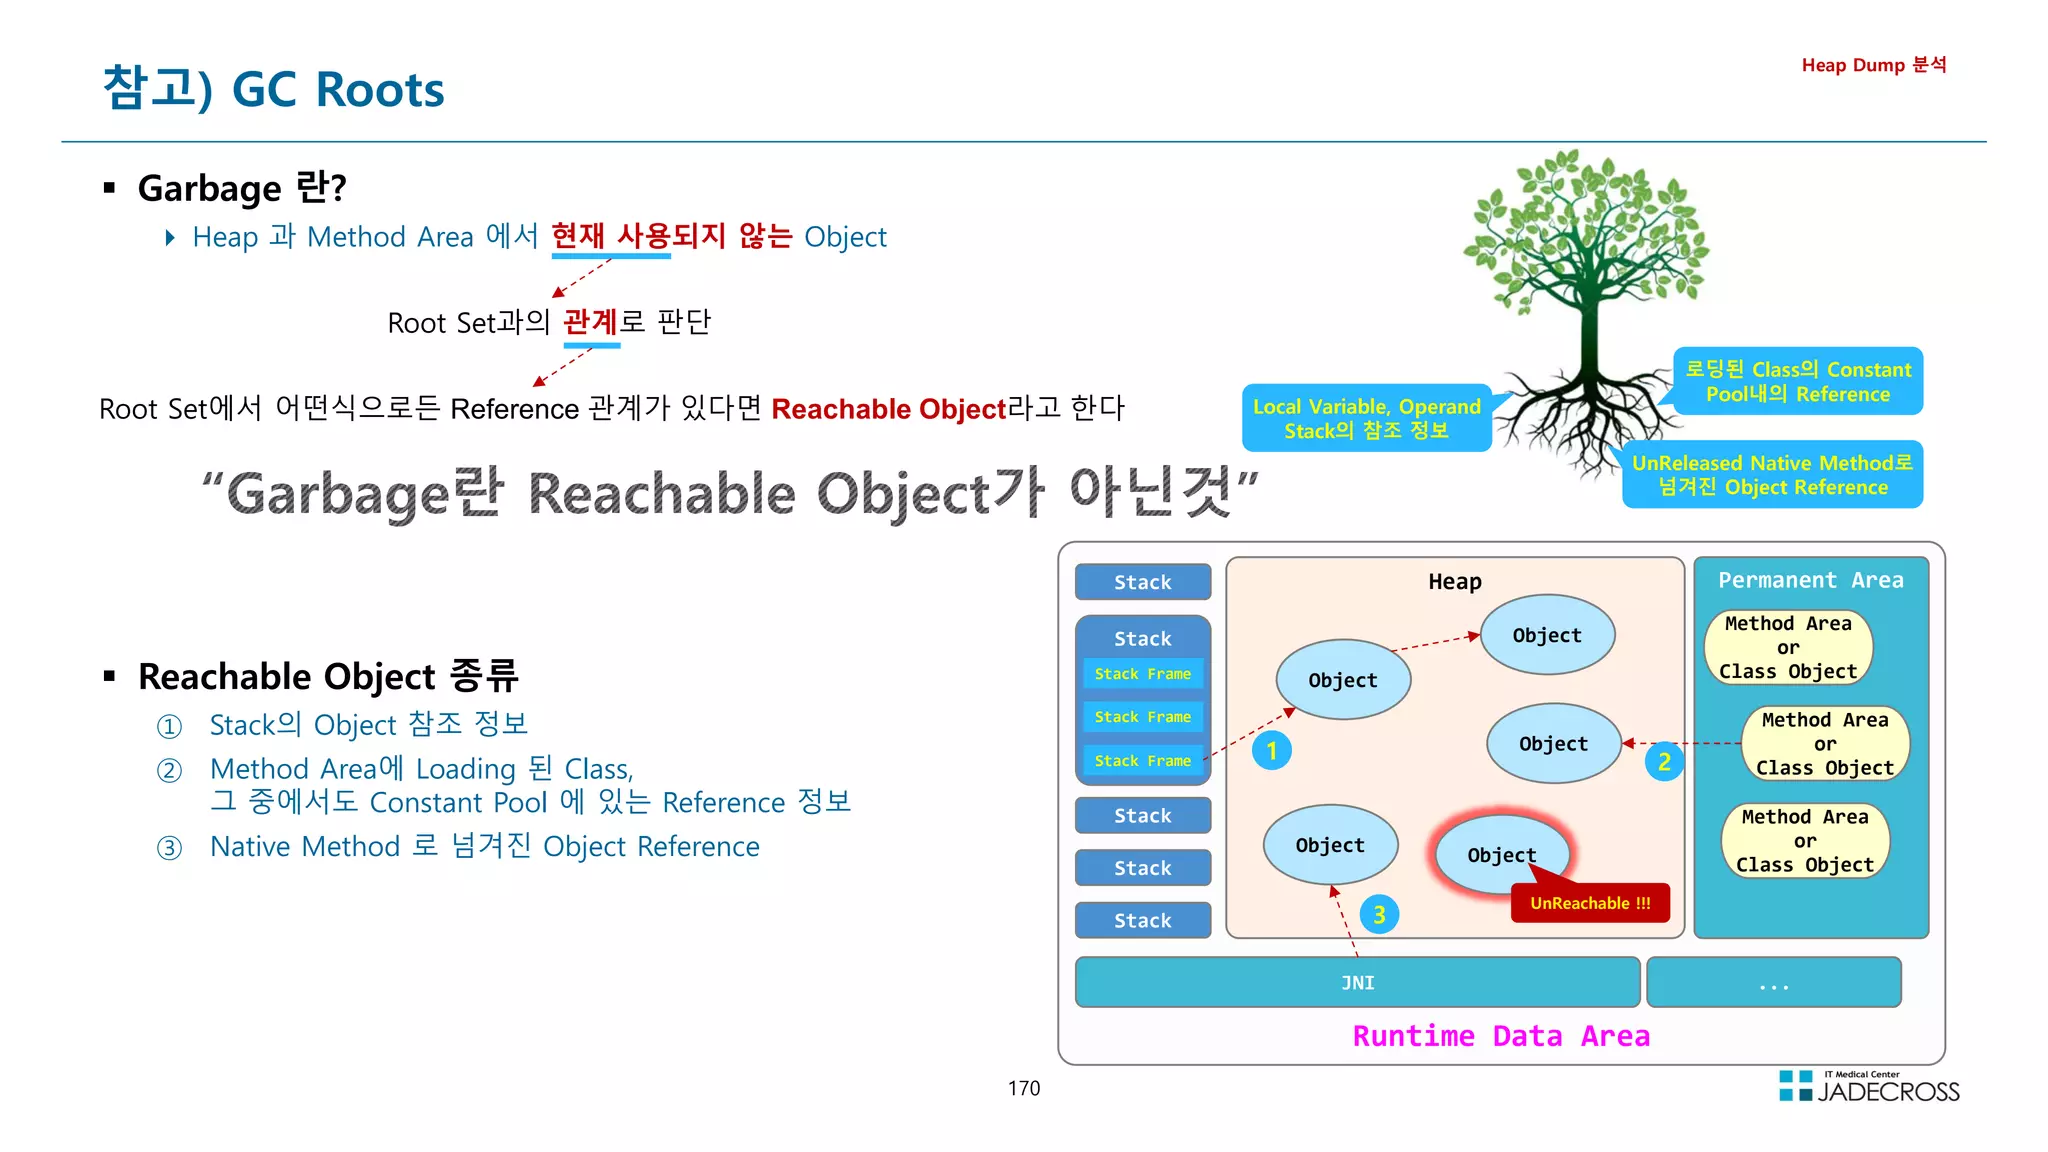
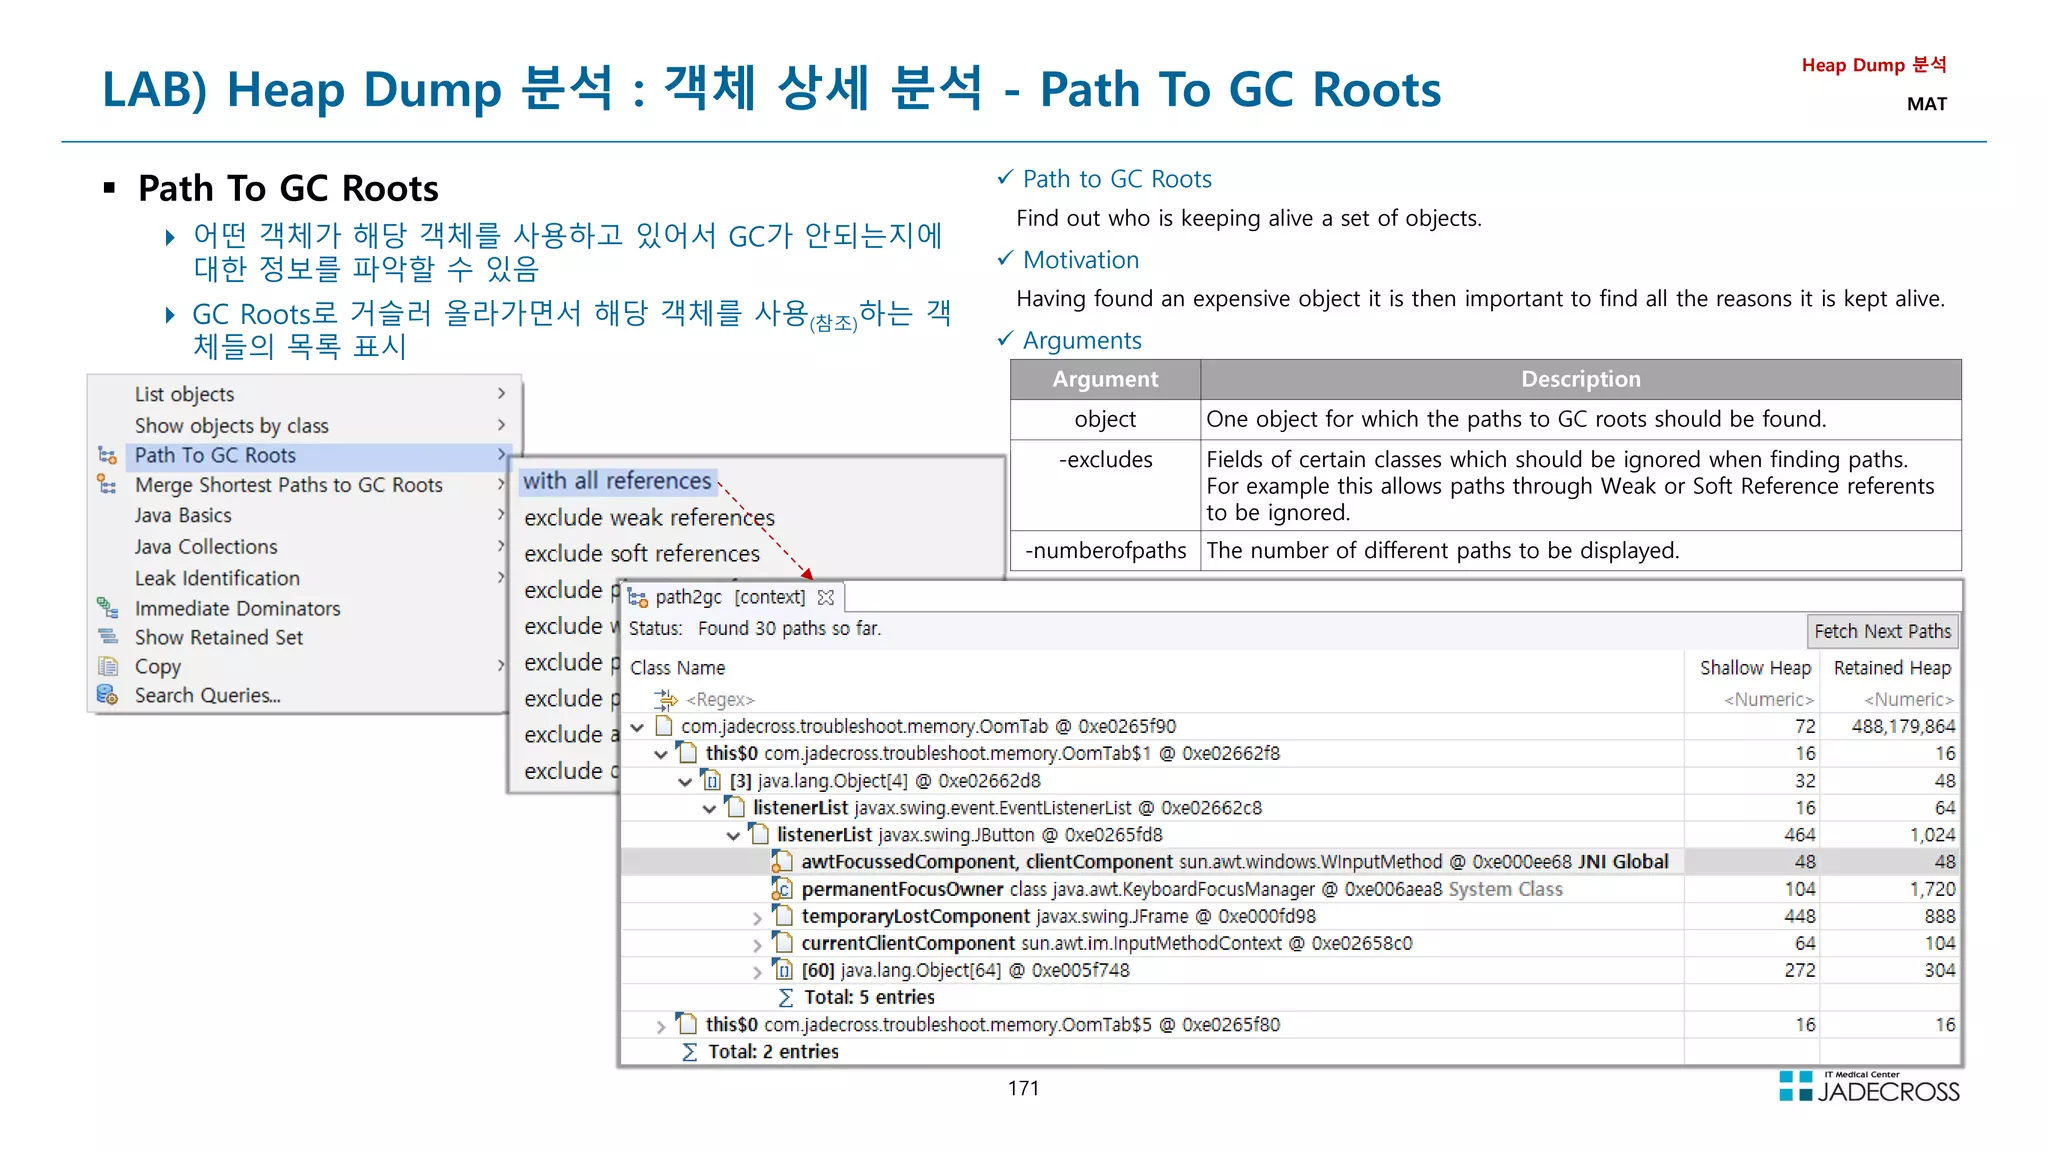
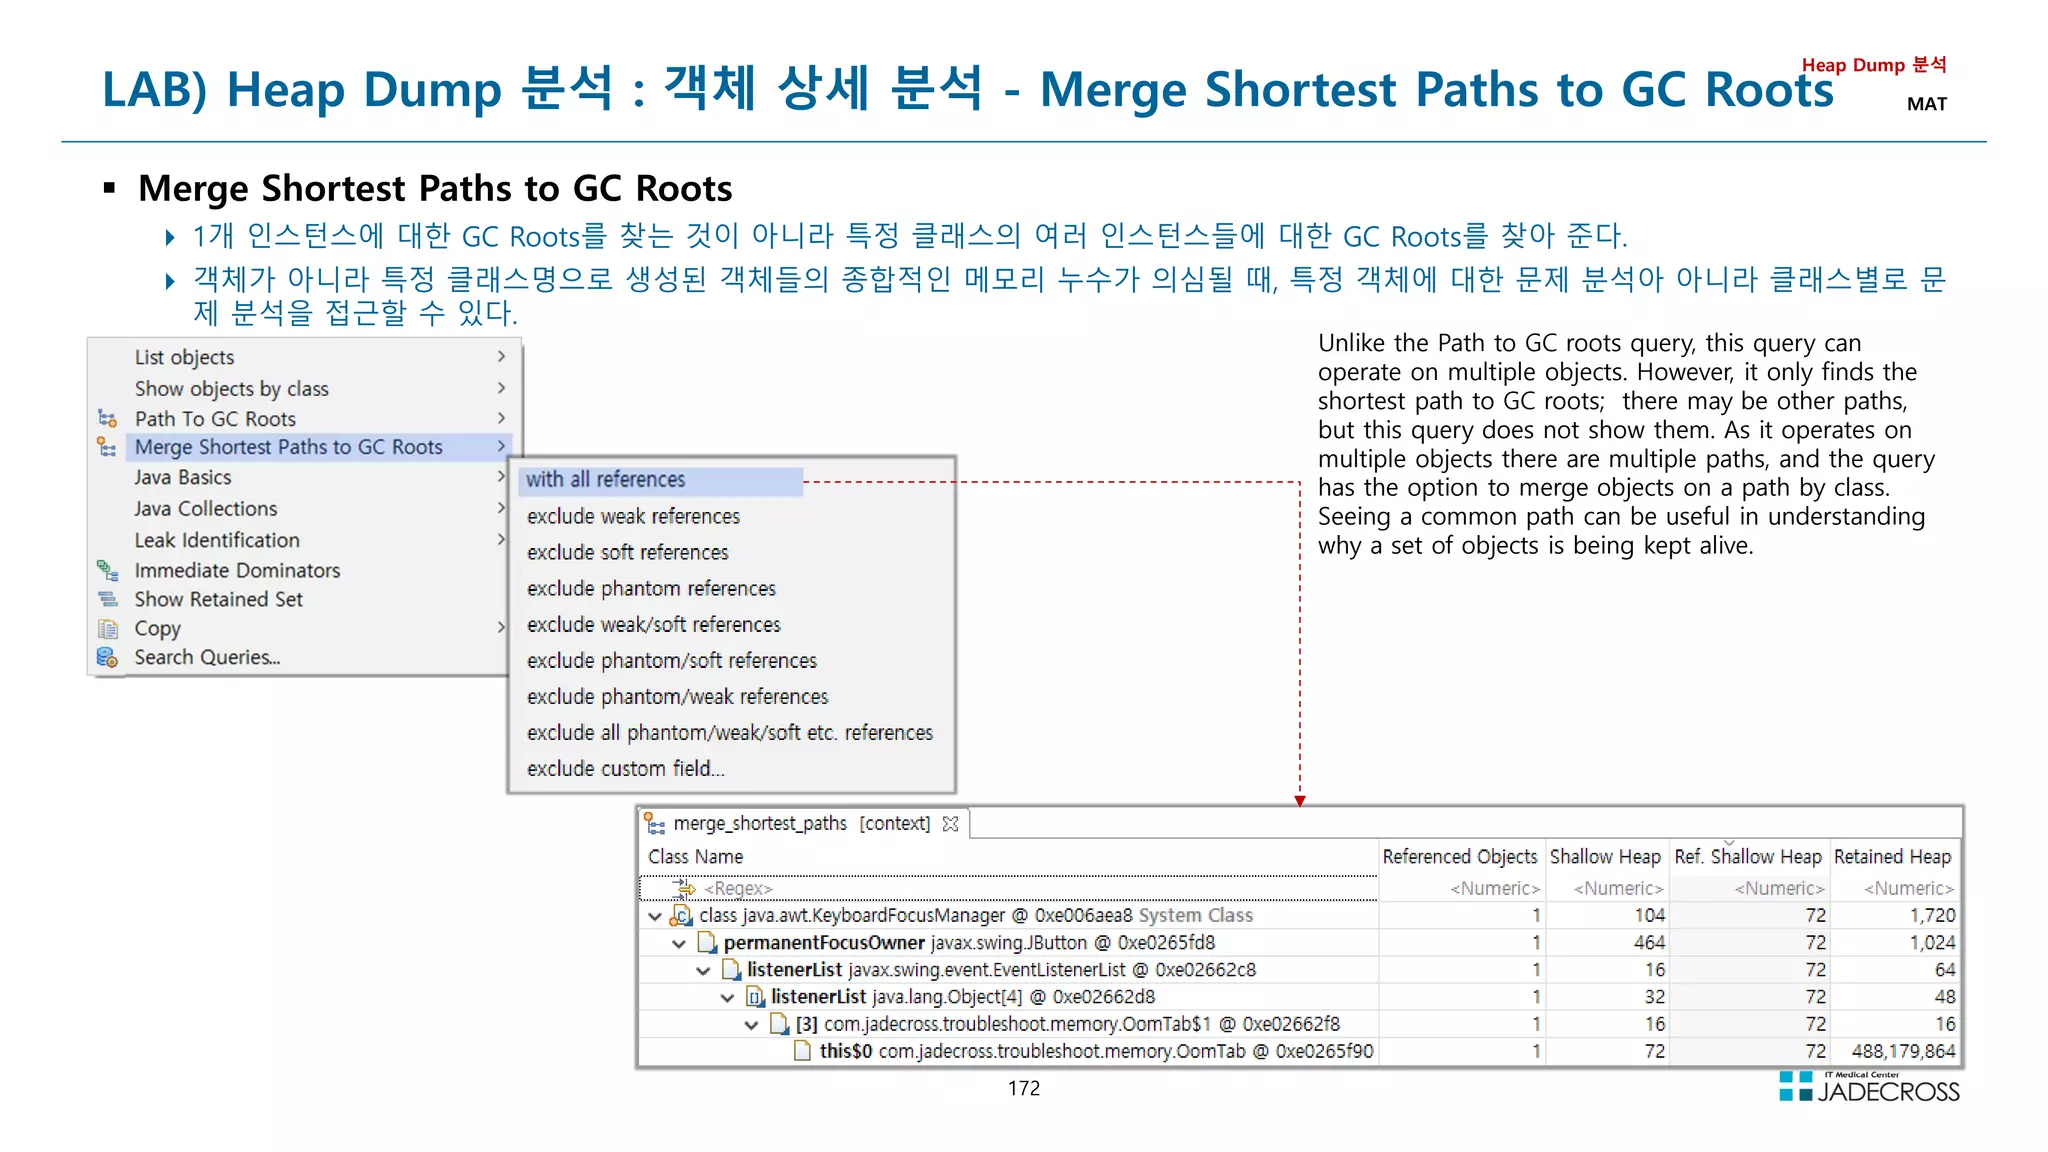
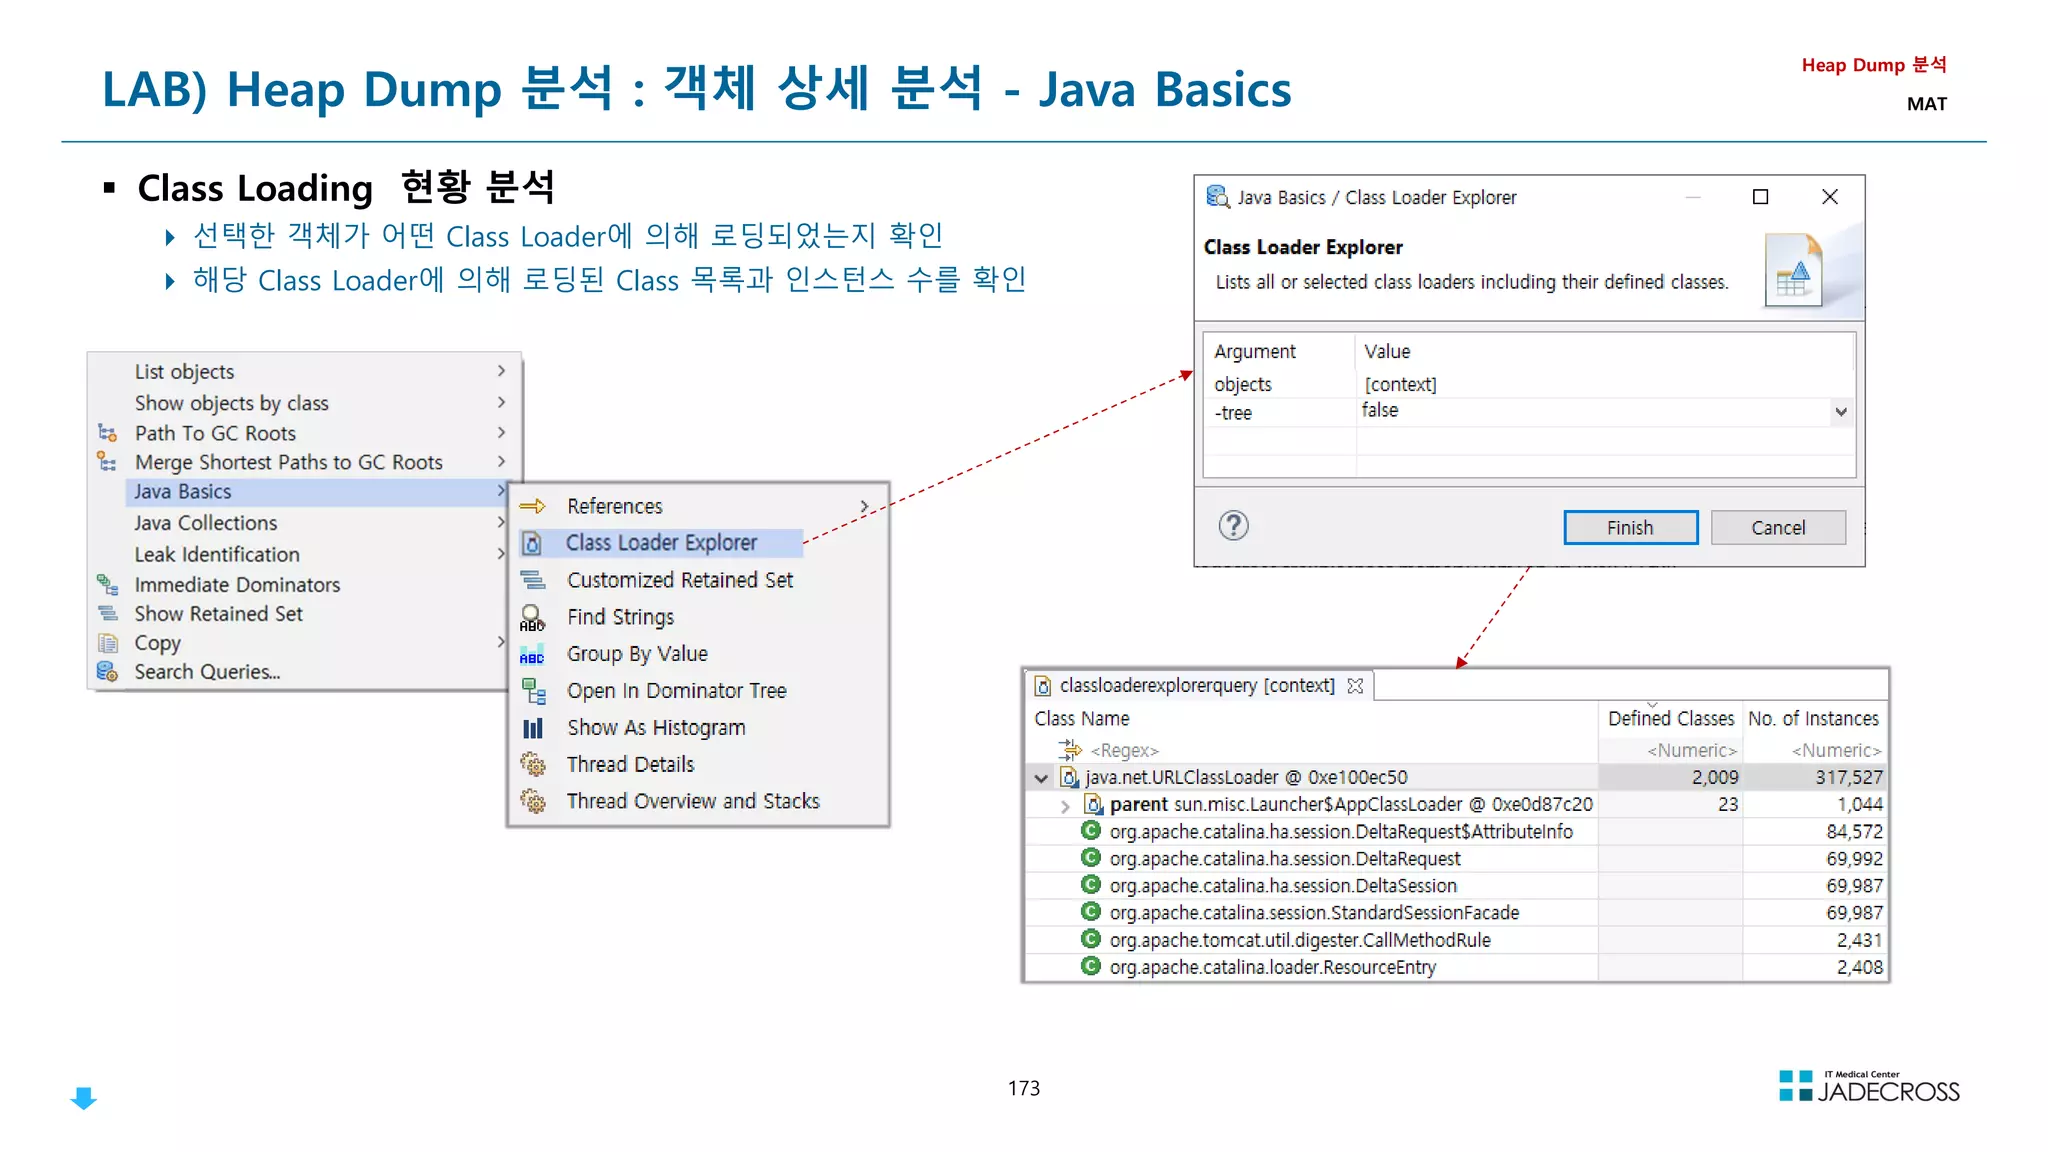
![175
Class Loader
Class Loader
Class는 참조되는 순간 동적으로 Load 및 Link가 이루어짐
Dynamic Loading + Dynamic Linking
JVM내에서 Dynamic Loading을 담당하는 주체가 Class Loader임
Class Loader
Java Application
(Real-Time) Operating System
Native
Method
Libraries
Class
Libraries Class Loader System
Execution
Engine
Run-time
Data Area
Garbage
Collector
Java
Threads
Native
Threads
JVM내로 Class를 Load하고
Link를 통해 적절히 배치하는
일련의 작업을 수행하는 모듈
LoadTime Dynamic Loading RunTime Dynamic Loading
Loading
시점
하나의 Class를 로딩하는 과정에서 관련된 Class들을 한꺼번에 로딩 Code를 실행하는 순간에 동적으로 로딩
샘플
public class Hello {
public static void main(String[] args) {
System.out.println(Hello World);
}
}
public class Hello {
public static void main(String[] args) throws ClassNotFoundException {
Class cl = Class.forName(args[0]);
}
}
설명
Hello class가 로딩되는 과정에서
Java.lang.String, java.lang.System Class가
동시에 로딩됨
Class.forName(args[0])를 호출하는 순간 args[0]에 해당하는 Class가 로딩
참고 Reflection의 기반이 되는 기술
Dynamic Loading 분류
Class의 Loading 시점에 따른 분류](https://image.slidesharecdn.com/jvm-230511085906-be6f1201/75/JVM_-pdf-175-2048.jpg)
![176
Namespace
Namespace
ClassLoader는 namespace를 하나씩 각각 가지고 있고, 자신이 Load한 Class의 Full Qualified Name 목록을 관리하고 있어서, 동일한 Class
를 중복해서 Loading 하지 않음
JVM내에서 동일한 Class란?
Full Qualified Name이 같아야 한다.
ClassLoader가 같아야 한다.
“ClassLoader Name + Package Name + Class Name” 까지 동일해야 같은 Class라고 인식
Class Loader
Full Qualified Name
= Package명 + Class 명
각 ClassLoader마다 Namespace를 따로 가지고 있음
ClassLoader가 Class를 Load할 때 JVM에 있는 모든 Class를 찾아다니며 Class 이름을 확인하는 대신 Namespace를 사용
Load한 Class의 Full Qualified Name을 Namespace에 저장
Symbolic Reference(객체의 이름으로 참조하는 방식)를 수행할 때 ClassLoader는 자신의 Namespace를 검색
참조되는 Class를 로딩한 ClassLoader가 참조하는 Class를 로딩 하도록 함
Namespace
Classloader 1
Classloader 1
com.jadecross.Person
com.jadecross.Person
com.jadecross.Person
com.jadecross.Person
public class Hello {
public static void main(String[] args) {
Class cl = Class.forName(com.jadecross.CodeVaccine);
}
}
* 같은 JVM내에서 같은 Class라도 ClassLoader만 다르다면 중복해서 Loading이 가능함
Namespace
Classloader 2
Classloader 2
com.jadecross.CodeVaccine
com.jadecross.CodeVaccine
Hello
Hello](https://image.slidesharecdn.com/jvm-230511085906-be6f1201/75/JVM_-pdf-176-2048.jpg)
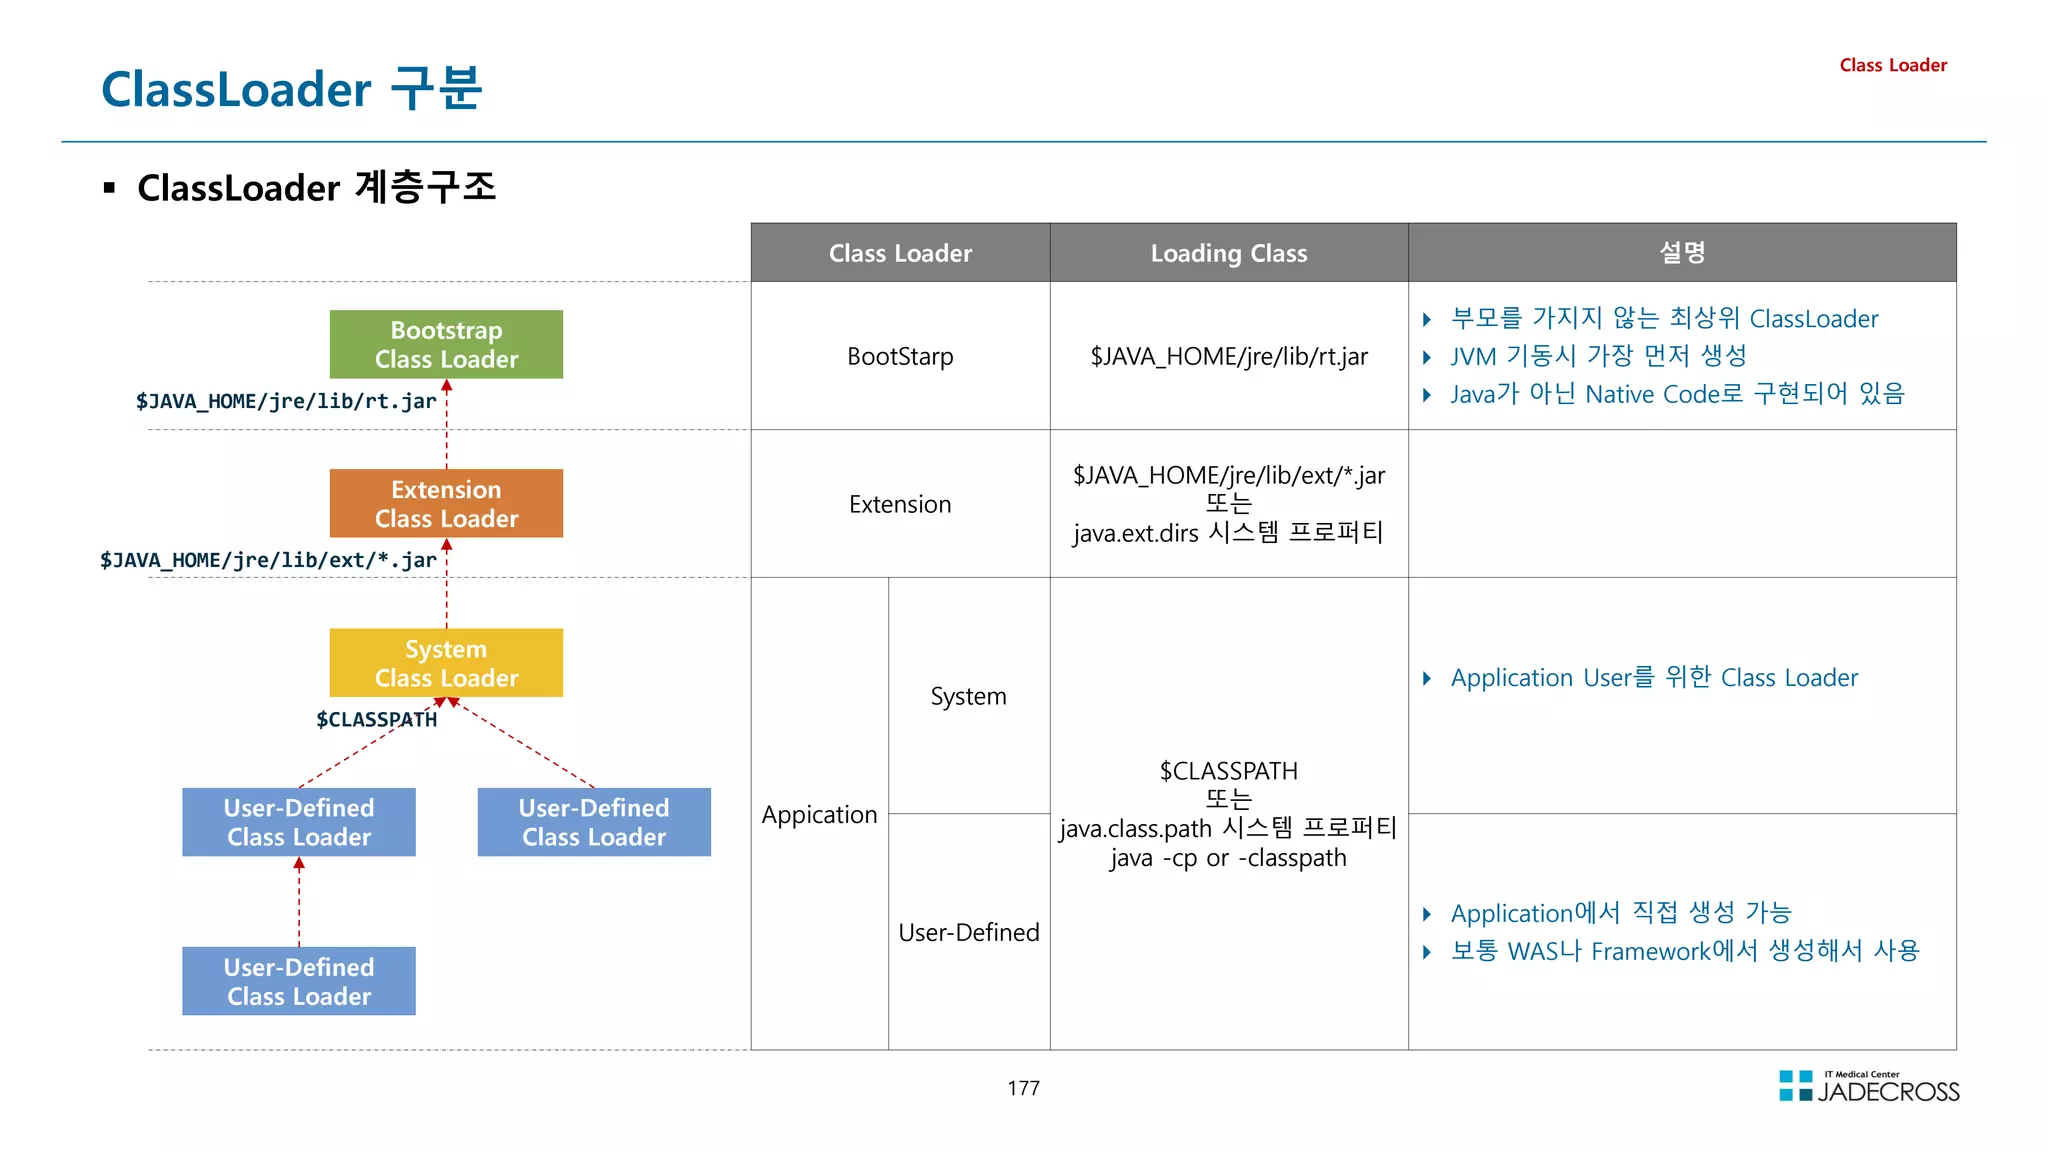
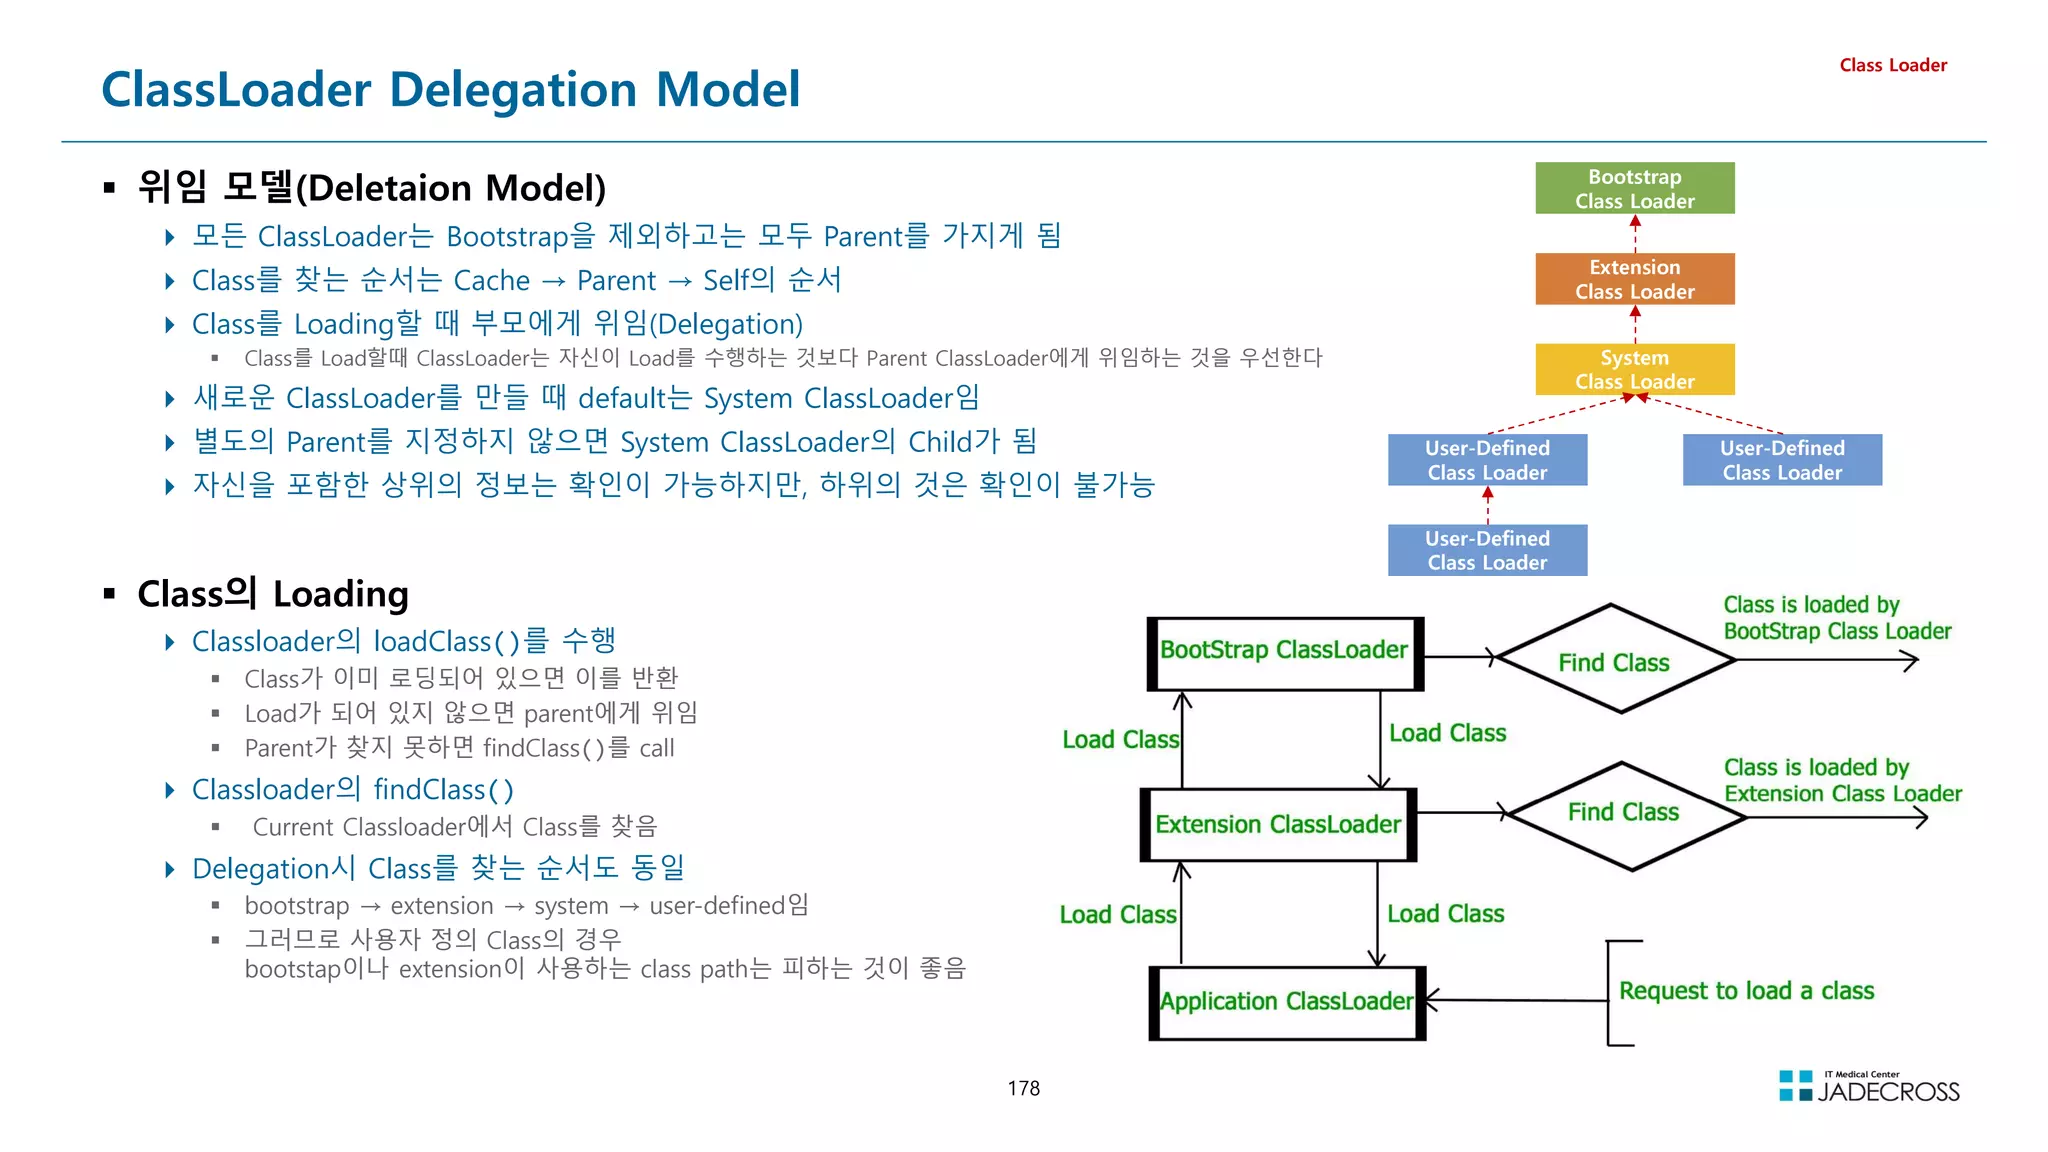
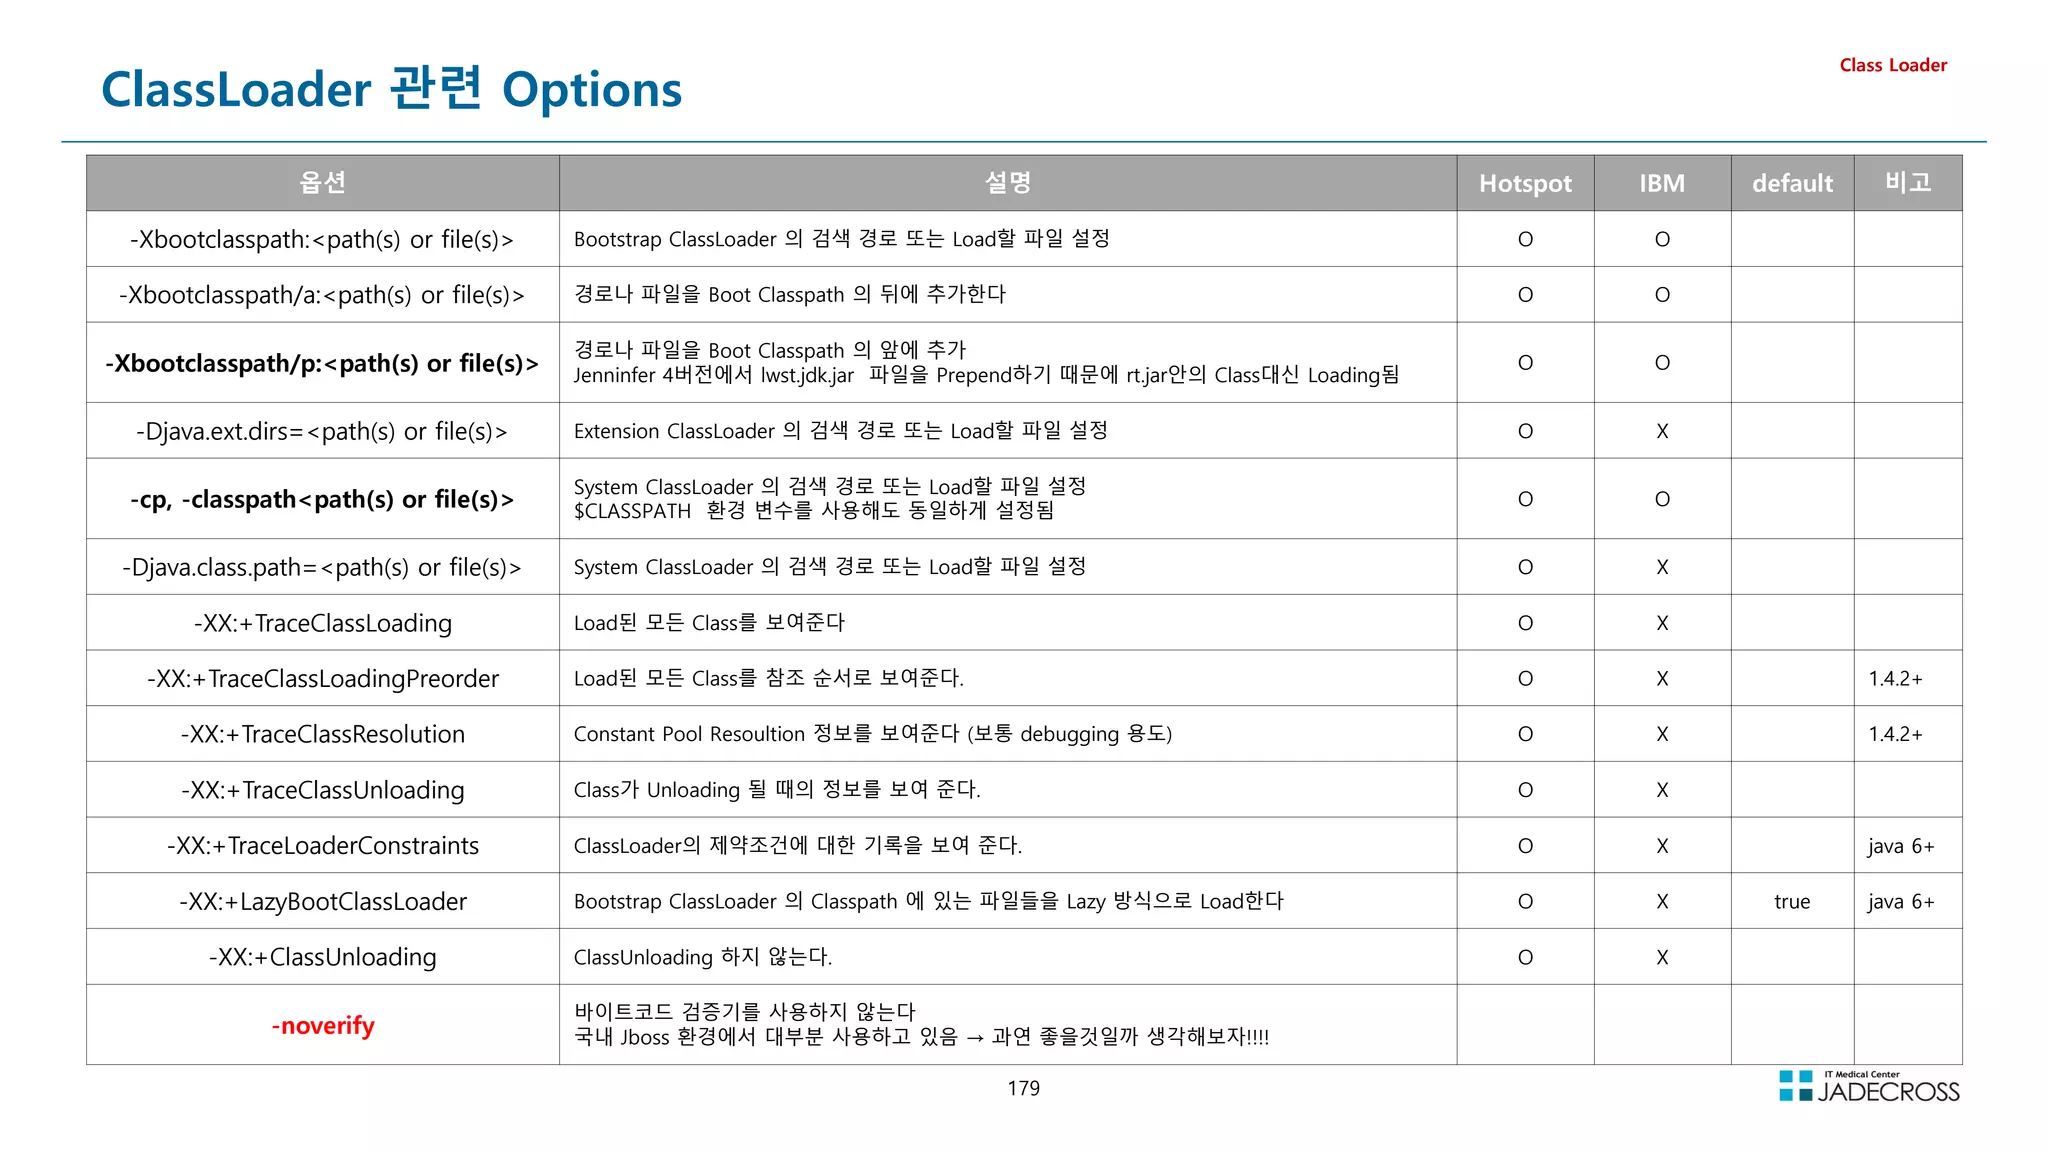
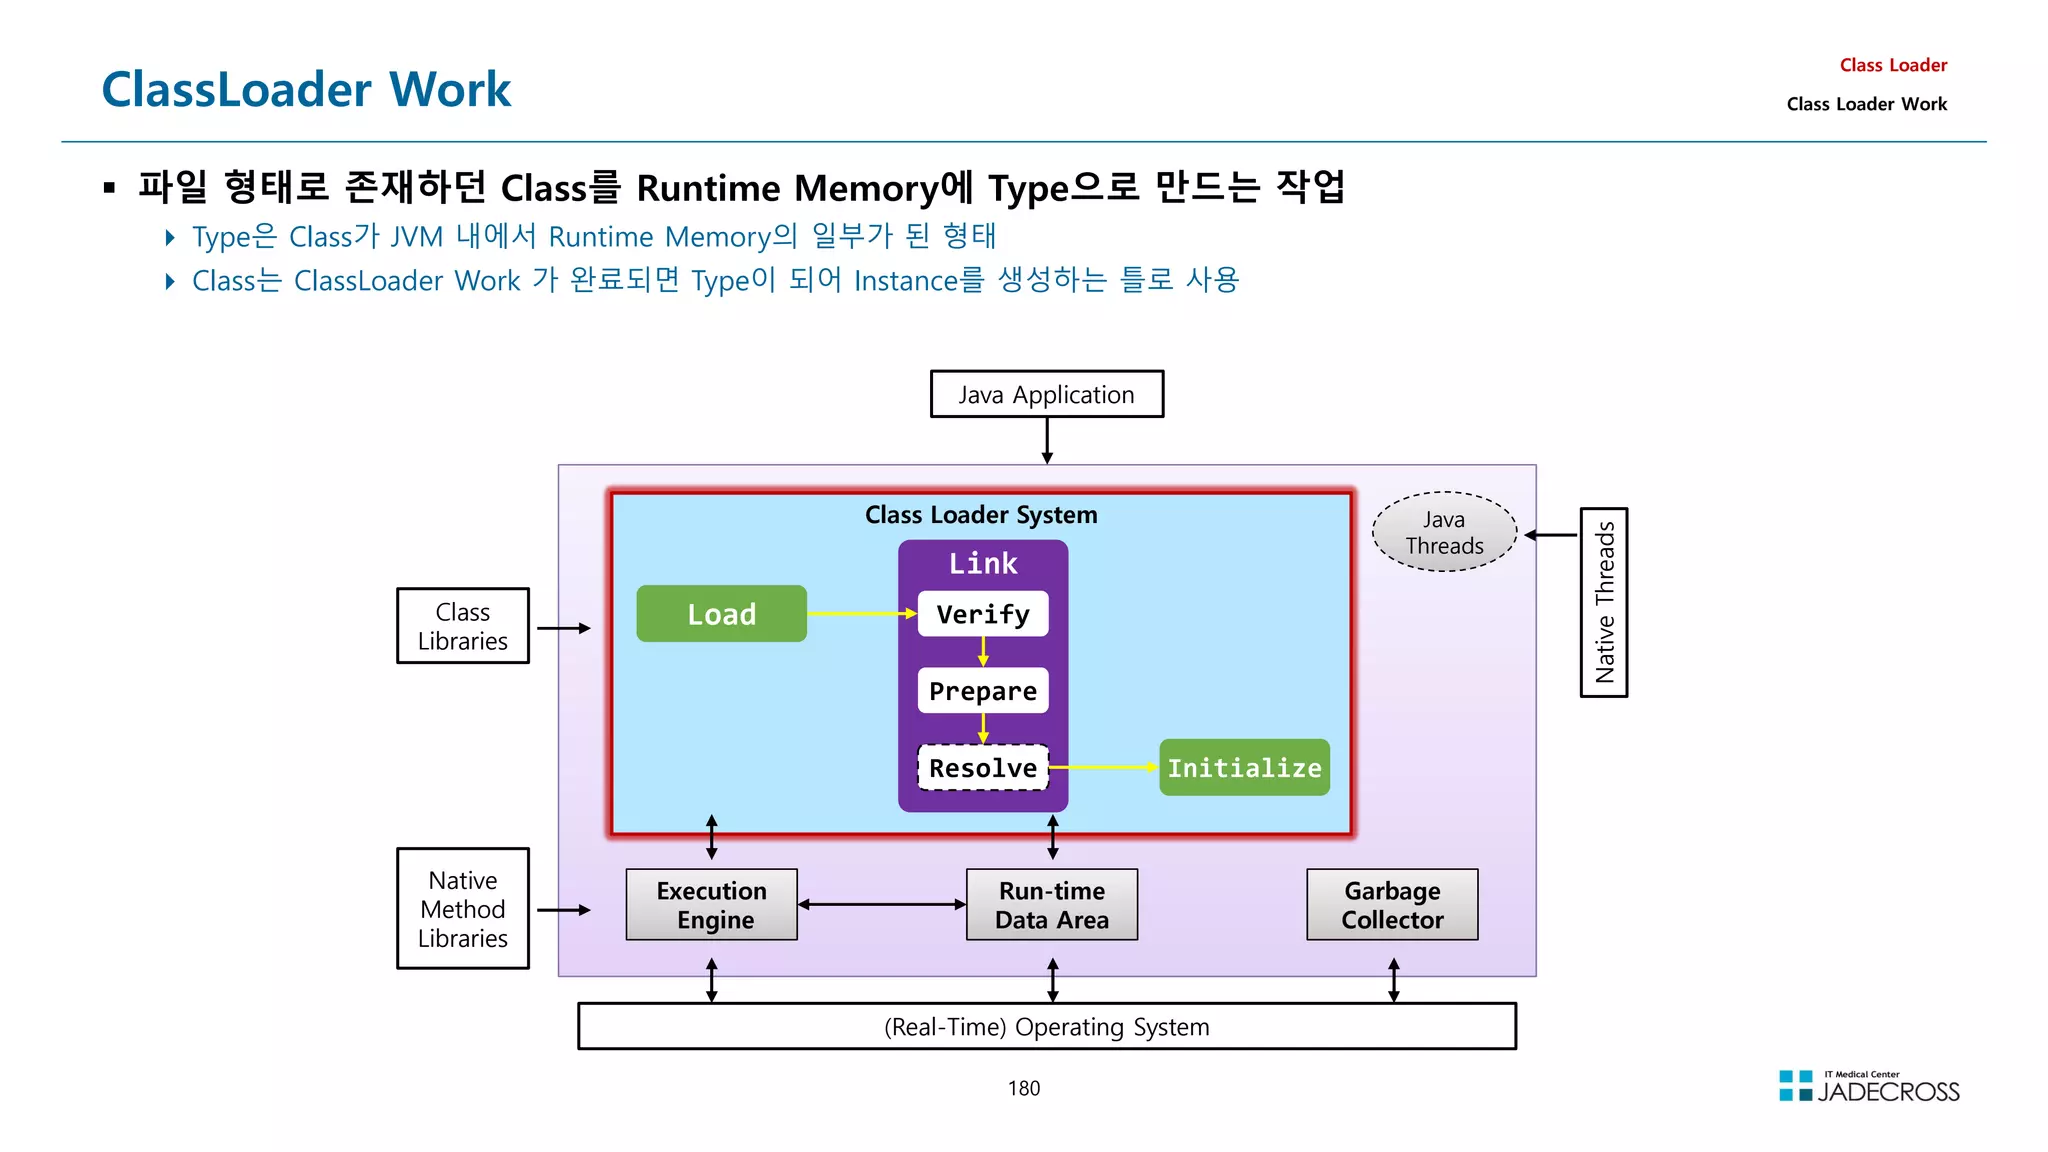
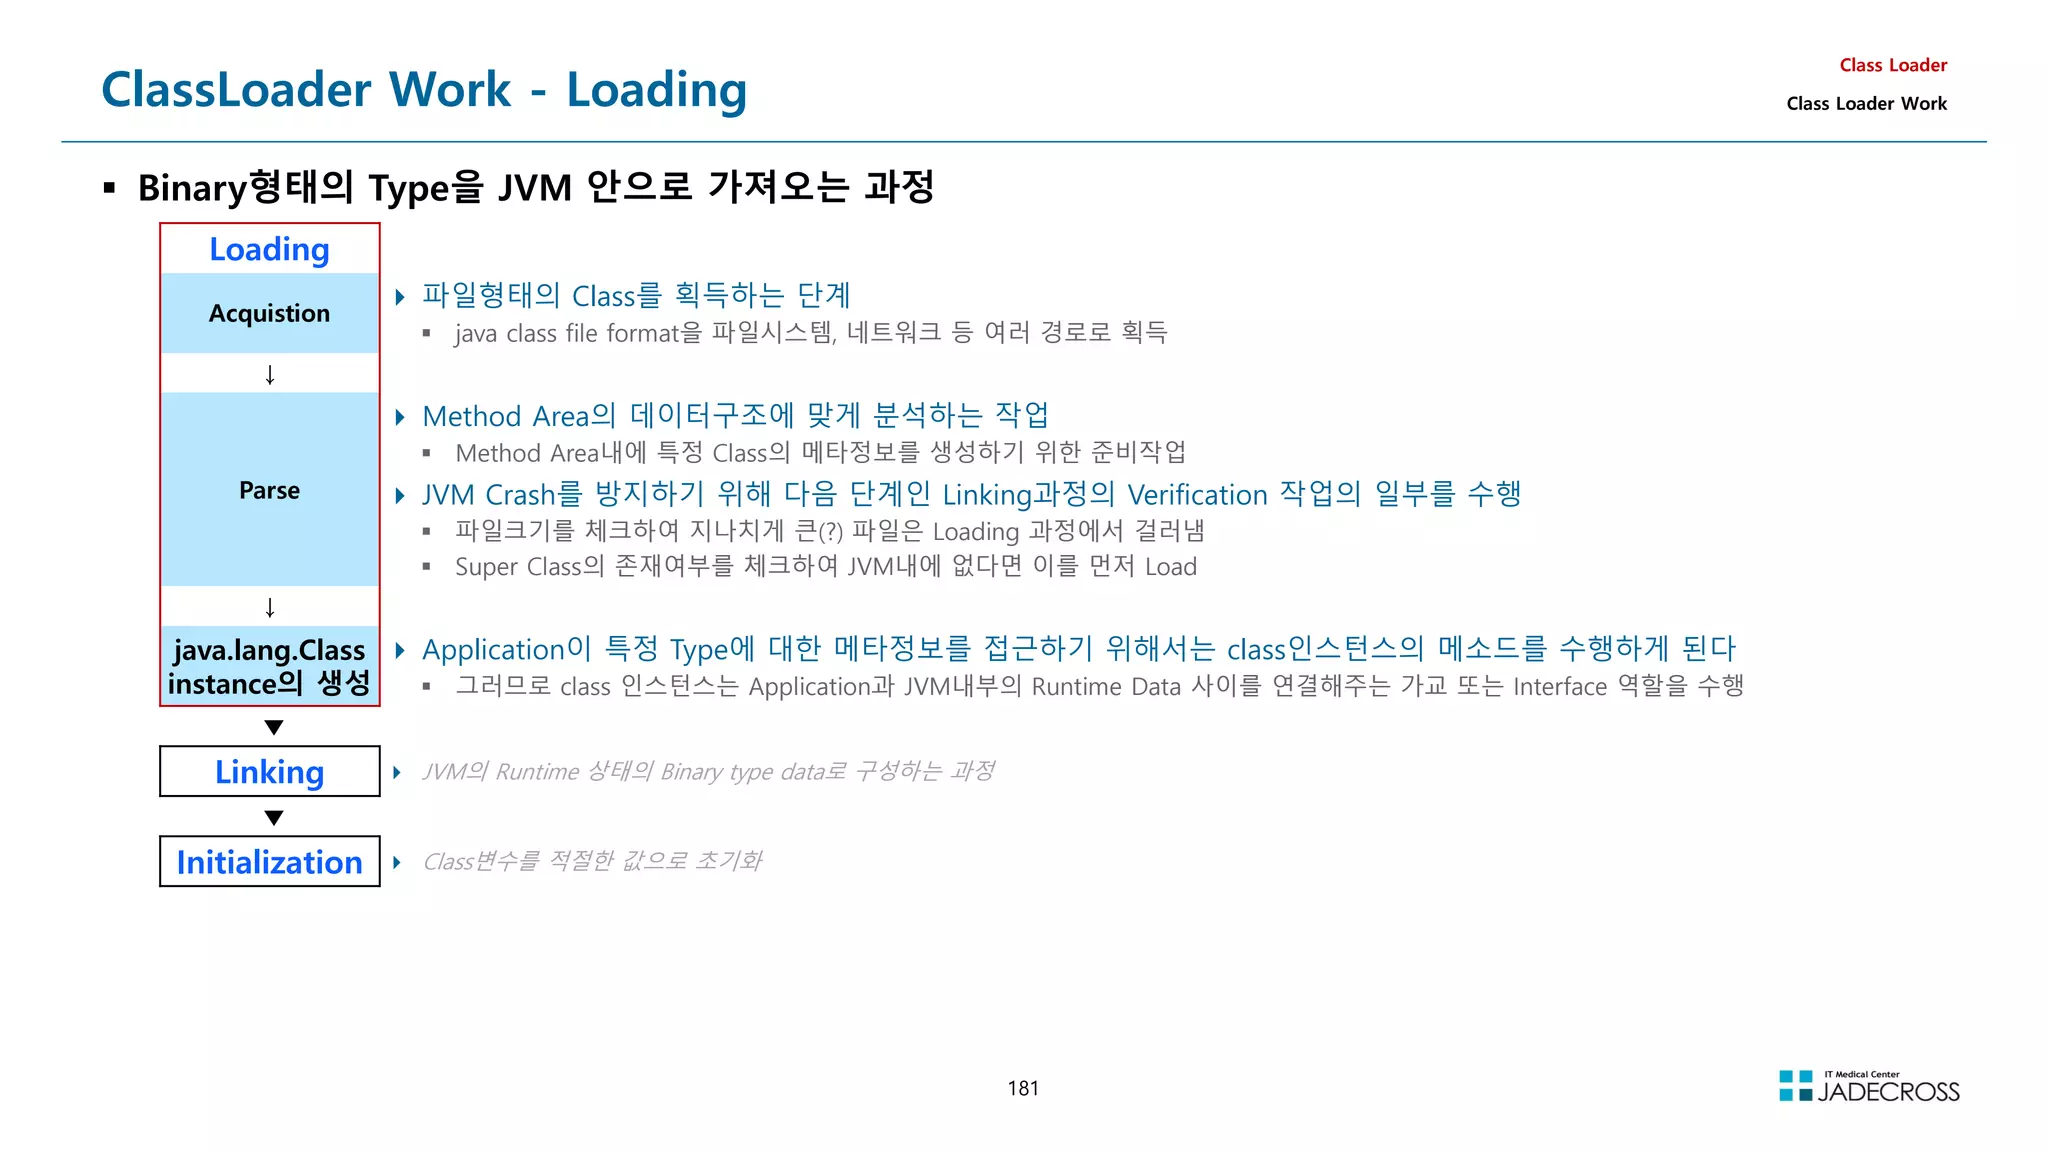
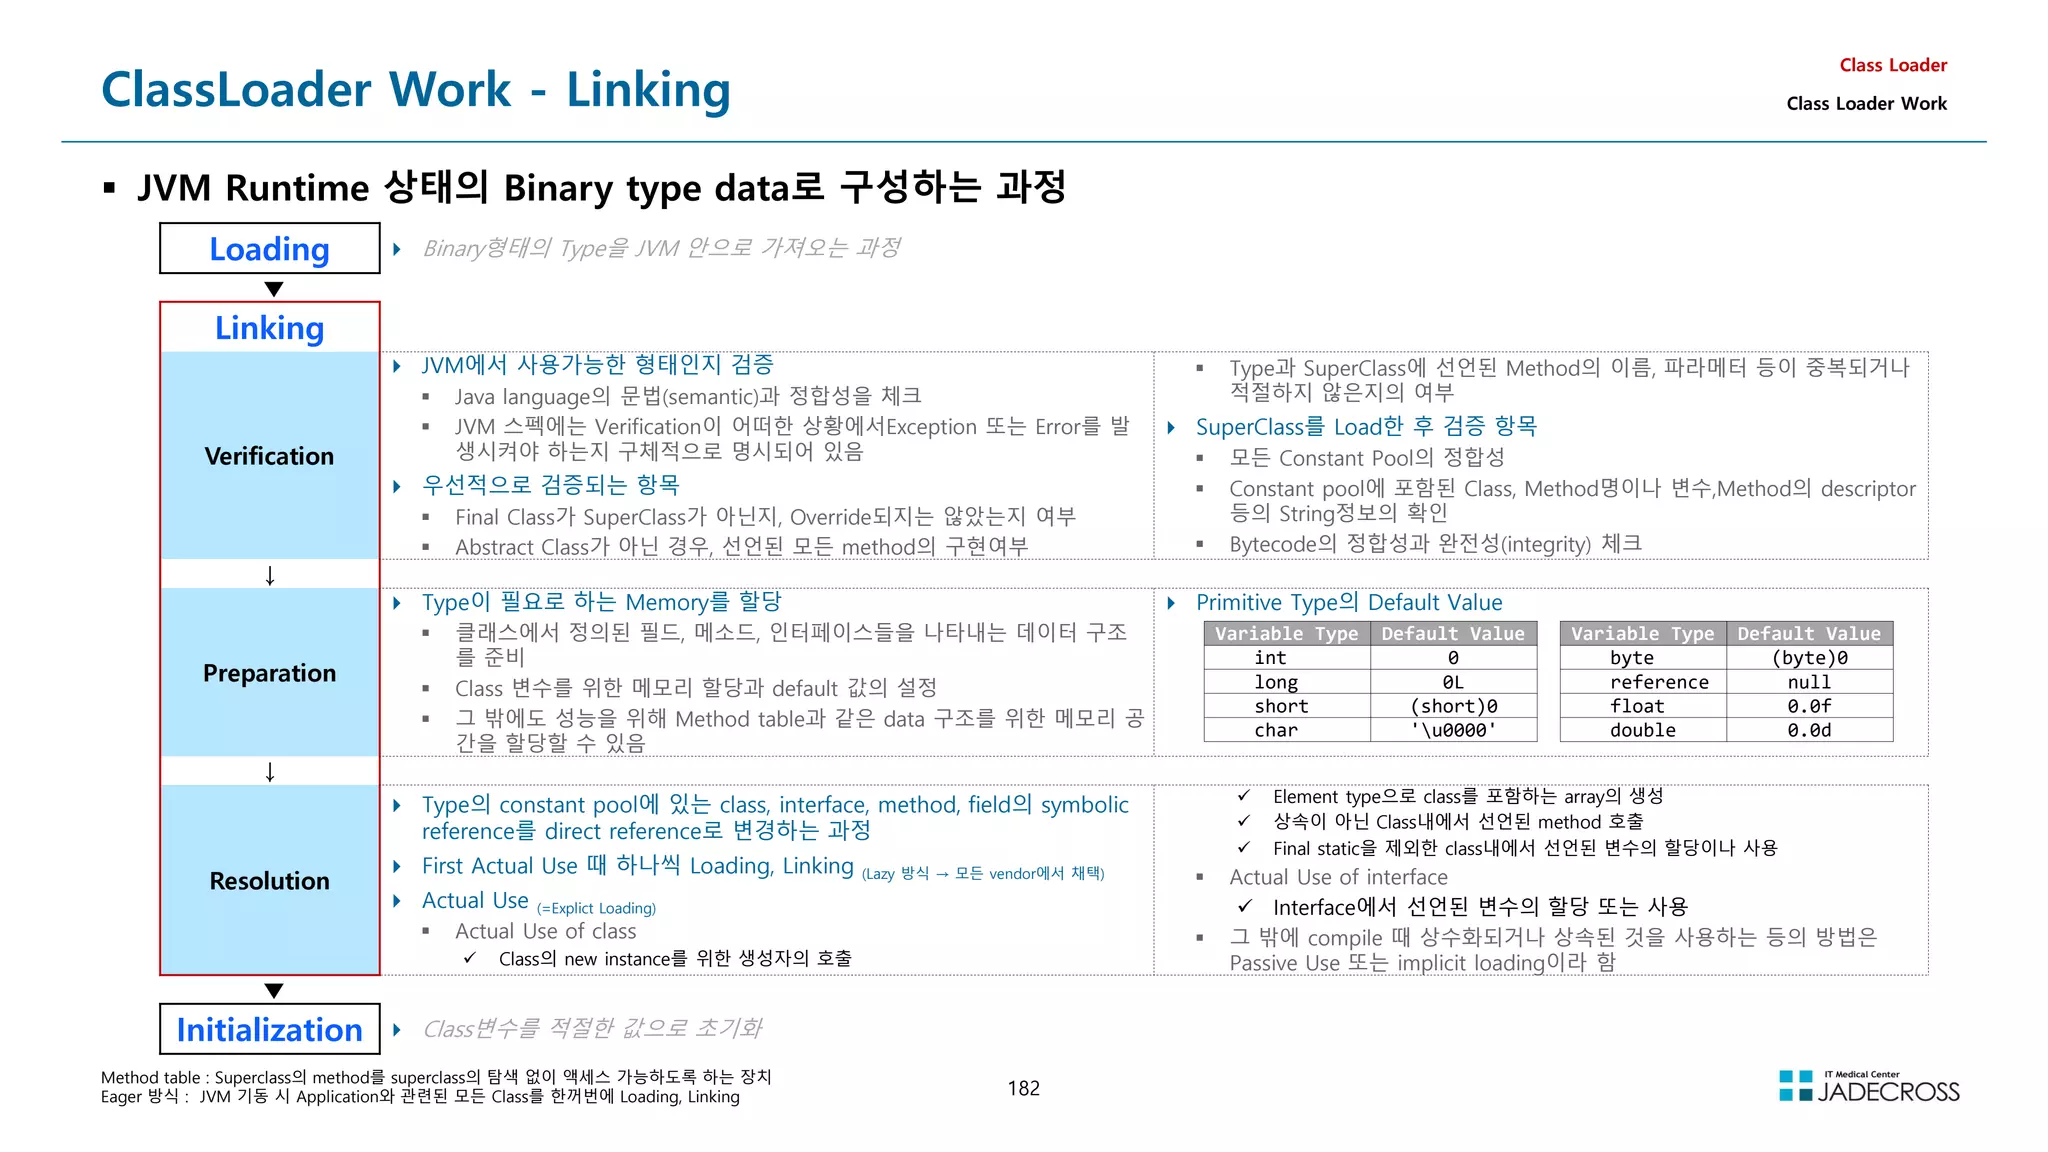
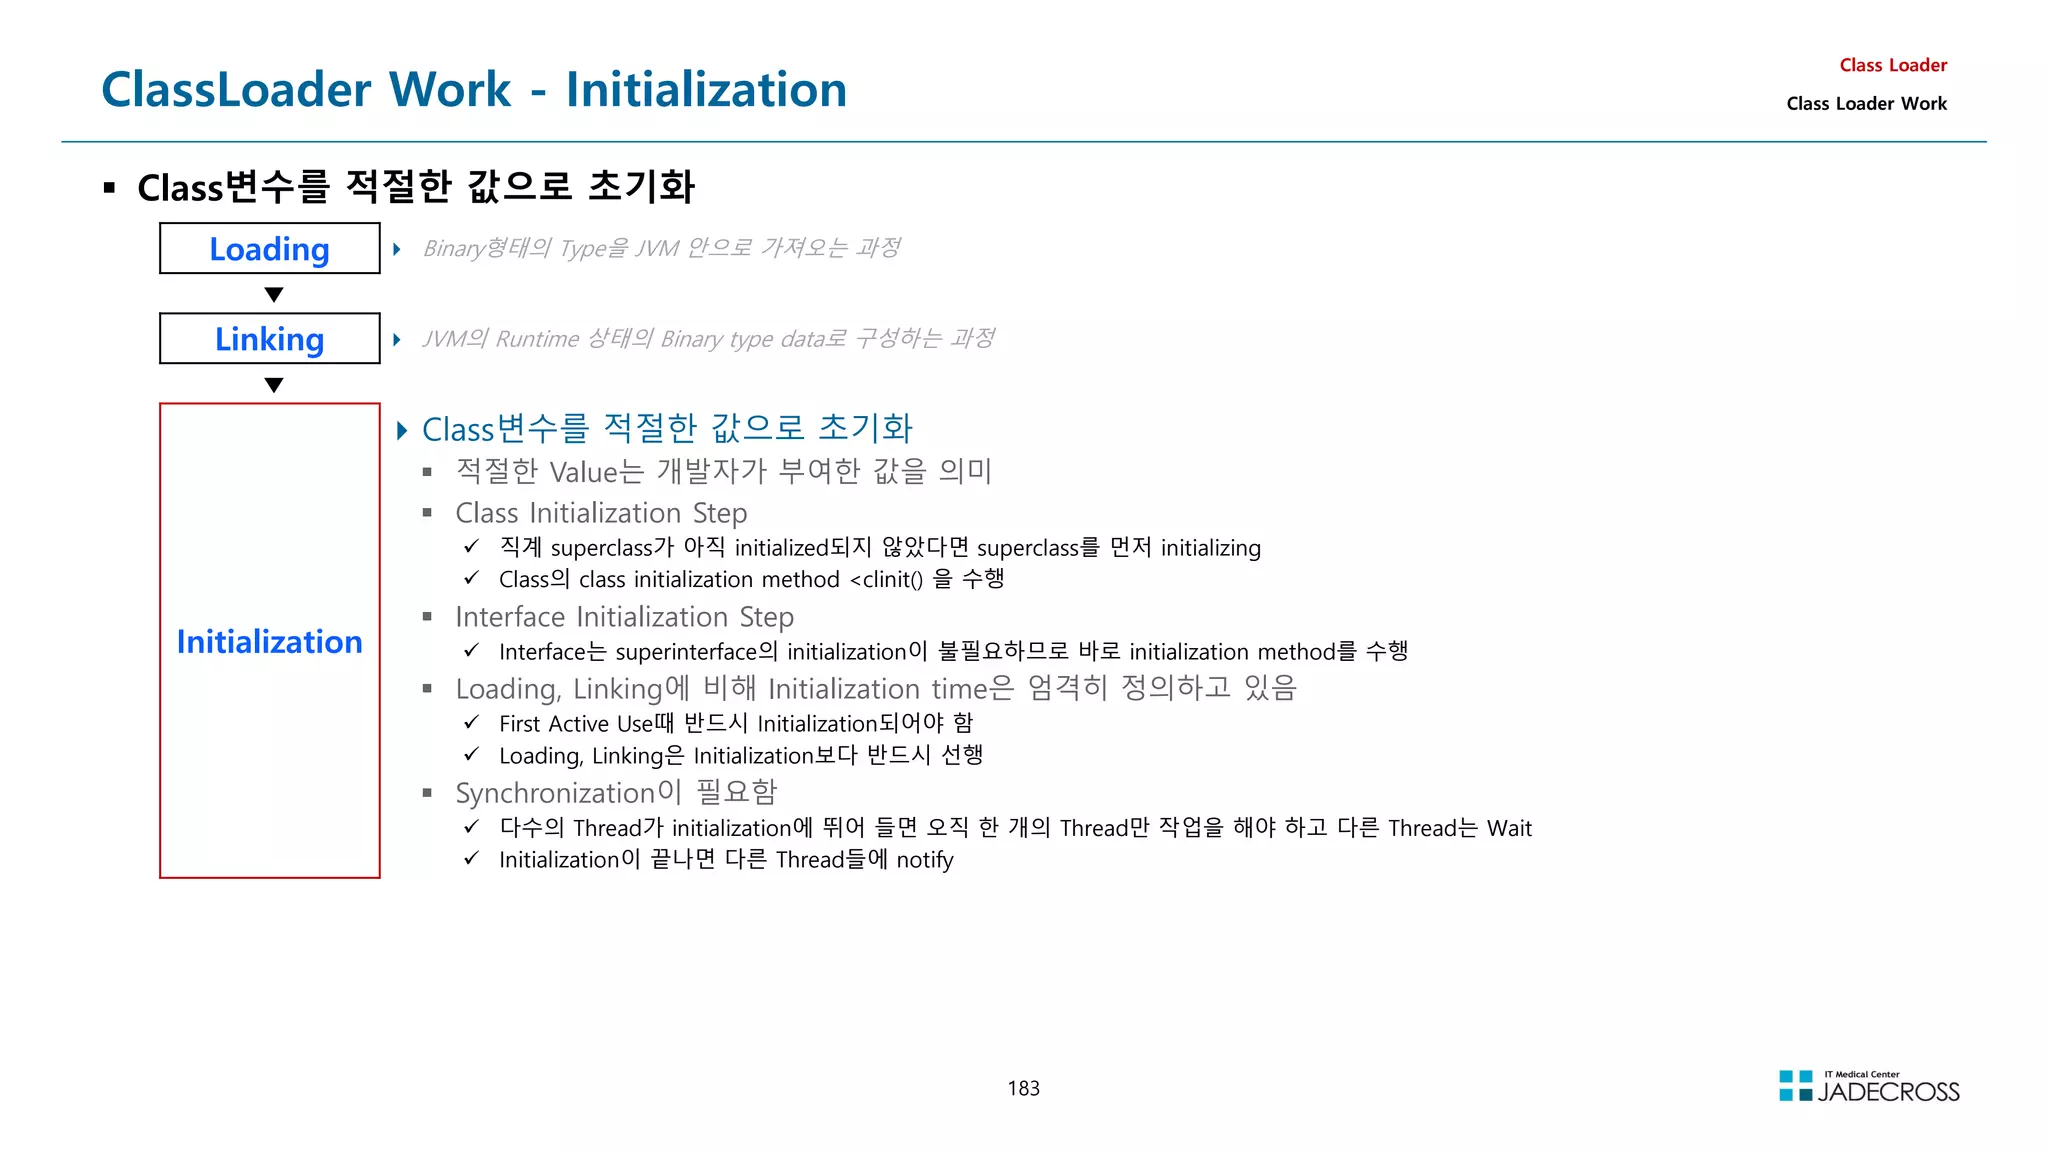
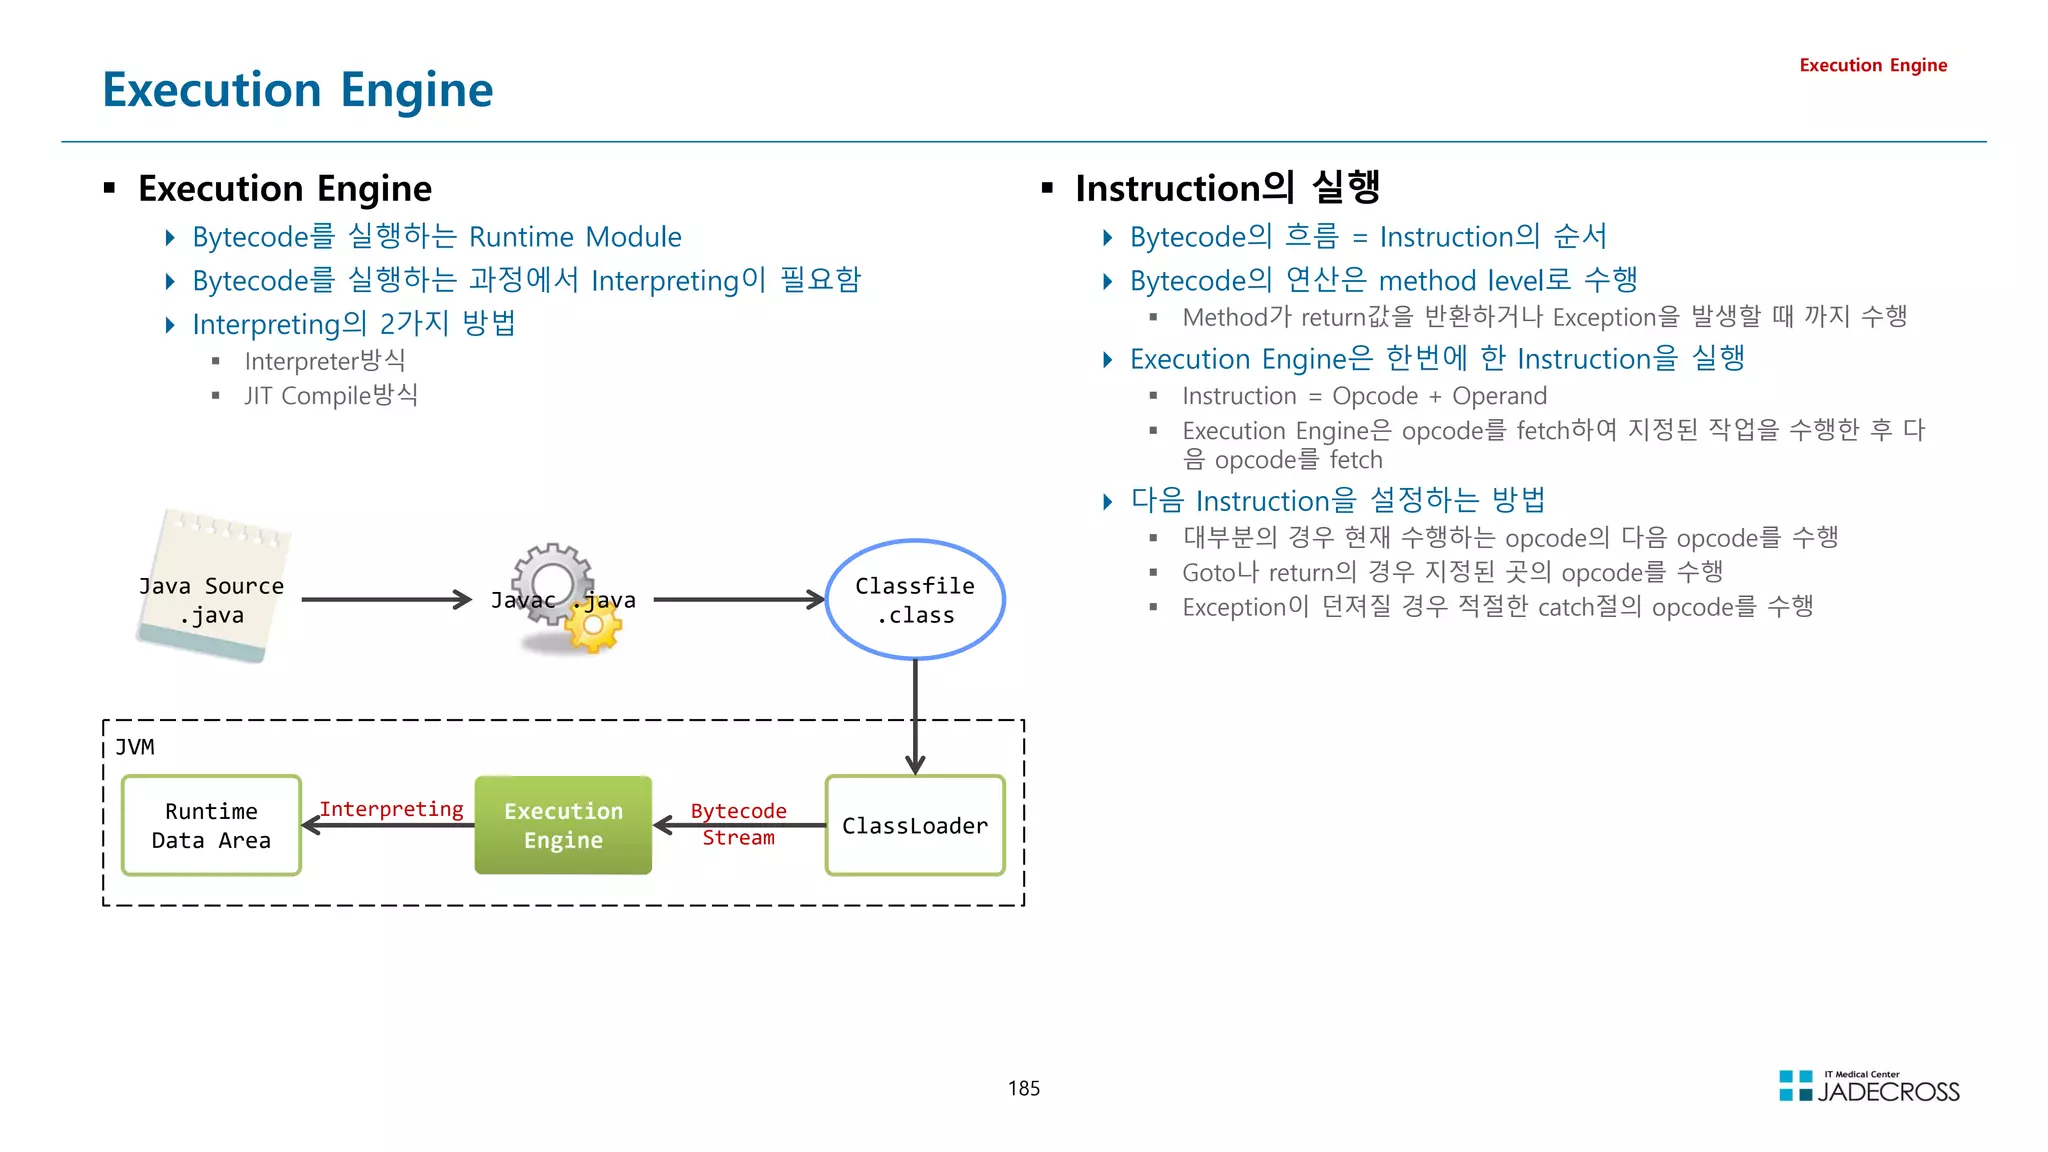
![186
Interpreter -vs- JIT Compiler
Execution Engine
.
Interpreter 방식 JIT Compiler 방식
Bytecode를 compile하지 않음
Bytecode를 하나씩 읽고 해석하여 실행하는 방식
Bytecode를 해석하는 시간은 짧아지나 실행하는 시간은 길어짐
초창기 JVM은 모든 Bytecode를 interpreter방식으로 처리
Load된 Class에 대해 Interpreter방식으로 동작을 하다가 반복 수행을 감지하게 되면 적절한 시점(Just In
Time)에 JIT Compiler가 동작하여 실행속도를 향상시키는 방식 → Lazy Fasion
Bytecode로 부터 native code를 생성해낸뒤 실행
Native code로 compile하는 시간이 길어짐
Native Code의 실행시간은 매우 빠르며 기본적으로 Cache가 되기 때문에 반복 호출시 이득이 큼
여러 번 호출이 되지 않는다면 Interpreter보다 성능이 떨어지게 됨
source code byte code native code
int a;
int b;
int c = a + b;
iload_0
iload_1
iadd
ld [$fp-0] , $r0
st $r0, [$sp+0]
ld [$fp-4] , $r1
st $r1, [$sp+4]
ld [$sp+0] , $r0
ld [$sp+0] , $r1
add $r0, $r1, $r2
st $r2, [$sp+0]
class A{
a.f1();
a.f3();
}
Heap
ptr
Object A
f1()
f2()
f3()
f4()
…
Method Table
JIT
byte
code
native
code
f1()
f3()
f1()
f3()](https://image.slidesharecdn.com/jvm-230511085906-be6f1201/75/JVM_-pdf-186-2048.jpg)
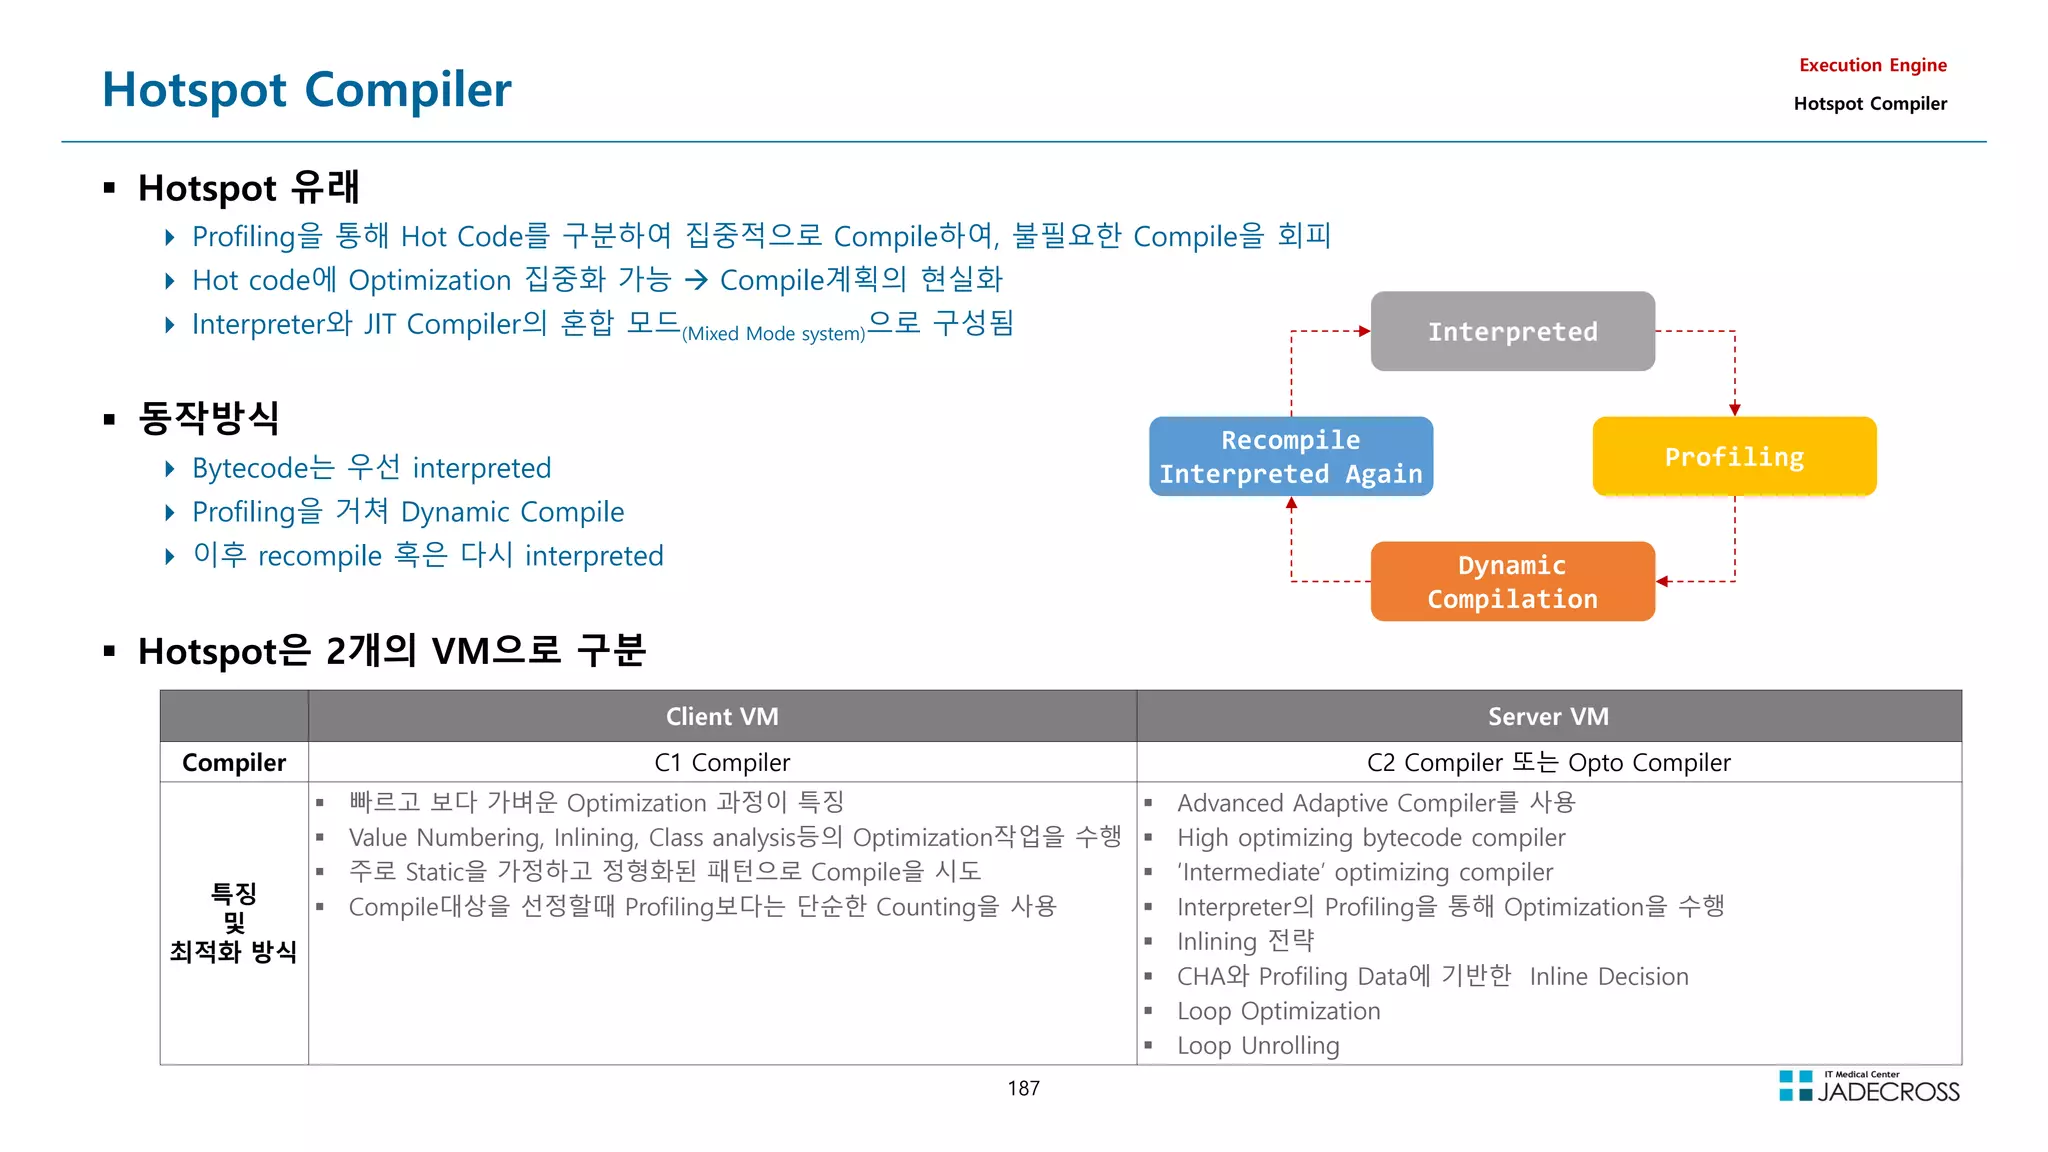
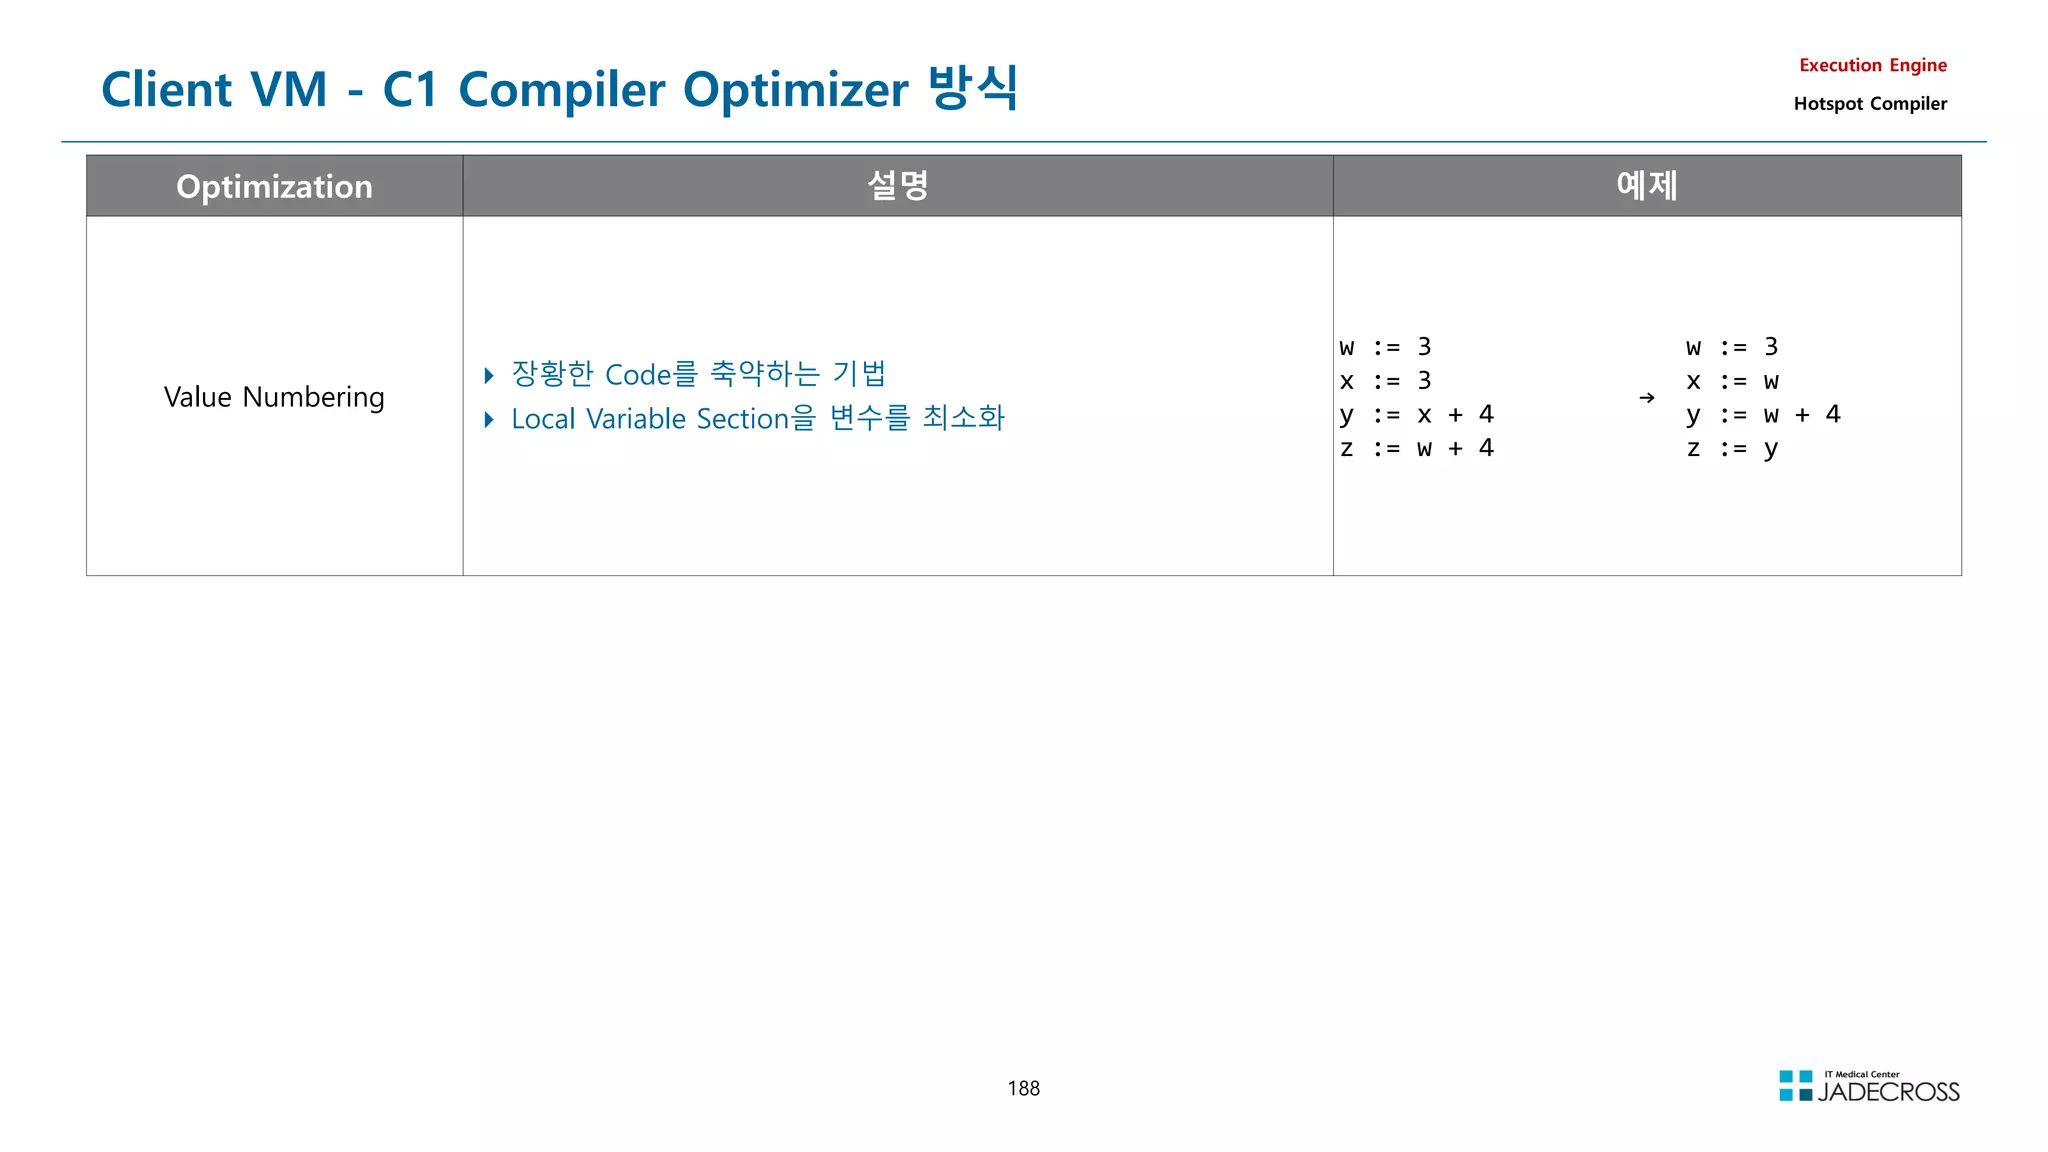
![189
Server VM - C2 Compiler Optimizer 방식 (1/2)
Execution Engine
Hotspot Compiler
Optimization 설명 예제
CSE
Common Sub-expression Elimination
결과가 같은 공통식 또는 부분식이 있을때 공통된 부분을 줄이는 방식
a = b * c + g;
d = b * c * d;
e = b * c;
→
tmp = b * c;
a = tmp + g;
d = tmp * d;
e = tmp;
Loop Unrolling
Loop를 예측 가능하도록 풀어 놓은것
Loop를 실행하는데 소요되는 비용을 최소화
for (int i; i 3;
i++);
array[i] = i;
→
array[0] = 0;
array[1] = 1;
array[2] = 2;
On Stack Replacement
Hotspot JVM 이 자랑하는 Optimization 기법
보통 Loop 내에서 임계 값 이상의 반복수행이 감지되면 Loop가 완료될 때까지 Code 를
Interpreter 에 맡기고 다음 번 수행 때 Compile 을 수행하게 되는데, OSR최적화는 Loop 도
중 Interpreted code를 Compiled code로 대체
public class OnStackReplace {
public static void main(String[] args) {
long before = System.currentTimeMillis();
int sum = 0;
for (int i = 0; i 10 * 1000 * 1000; i++) {
sum += Math.sqrt(i);
}
long after = System.currentTimeMillis();
System.out.println(Elapsed : + Long.toString(after - before));
System.out.println(Sum : + Integer.toString(sum));
}
}
단점 : OSR을 사용하는 경우, Loop Hoisting, Array-Bounds Check Elimination, Loop
Unrolling 등의 다른 Optimization 이 생략되기 때문에 오히려 최적화의 정도가 감소될 수
있음
main method는 1회만 수행
그러나 main내에 천만 회의 loop가 수행
10,000회 부터 compile
그러나 main은 여전히 interpreting
14,000회 부터 OSR 동작
loop중에도 Compile code사용](https://image.slidesharecdn.com/jvm-230511085906-be6f1201/75/JVM_-pdf-189-2048.jpg)
![190
Server VM - C2 Compiler Optimizer 방식 (2/2)
Execution Engine
Hotspot Compiler
Optimization 설명
Array-bounds Check
Elimination
Array를 접근할 때마다 Range Check를 하지 않음
Automatic Bounds Checking
Array 인덱스가 경계범위 (Array-Bounds)를 벗어나게 되면 ArrayOutOfBound Exception 을 발생시키는데, Heap의 Array Object Header에 있
는 Length 정보를 매번 확인해야 하므로 수행속도가 저하되게 됨
Optimization 단계에서 Array Index를 상수화하여 최소, 최대 사이에 값이 오는지를 연산하여 검증
Dead Code Elimination
수행되지 않는 code는 Compile시 삭제
public class OnStackReplace {
public static void main(String[] args) {
long before = System.currentTimeMillis();
int sum = 0;
for (int i = 0; i 10 * 1000 * 1000; i++) {
sum += Math.sqrt(i);
}
long after = System.currentTimeMillis();
System.out.println(Elapsed : + Long.toString(after - before));
}
}
Code Hoisting Loop 내에서 매번 동일한 값을 내는 Code를 Loop 바깥으로 들어내는(Hoist) 것
for (i = 0; i 1000; i++)
z[i] = cos(x) + i * sin(x);
→
c = cos(x);
s = sin(x);
for (i=O; i 1000 ; i++)
z[i]=c + i*s
Code Hoisting 을 거치게 되면 cos(x) 와 sin(x) 은 Loop가 시작되기도 전에 각각 c와 s라
는 변수로 치환되어 Loop 내에서 상수처럼 사용되므로 효율적인 수행이 가능해진다
Deoptimization
Hotspot에만 있는 기능으로, 사용빈도가 떨어진 Compiled Code를 폐기하고 다시 Interpreter 모드로 수행되도록 하는 최적화
Optimization과 반대되는 이 기능은 자원을 최적화하여 배치한다는 측면에서 시스템 전반의 Optimization 이라고도 할수 있음](https://image.slidesharecdn.com/jvm-230511085906-be6f1201/75/JVM_-pdf-190-2048.jpg)
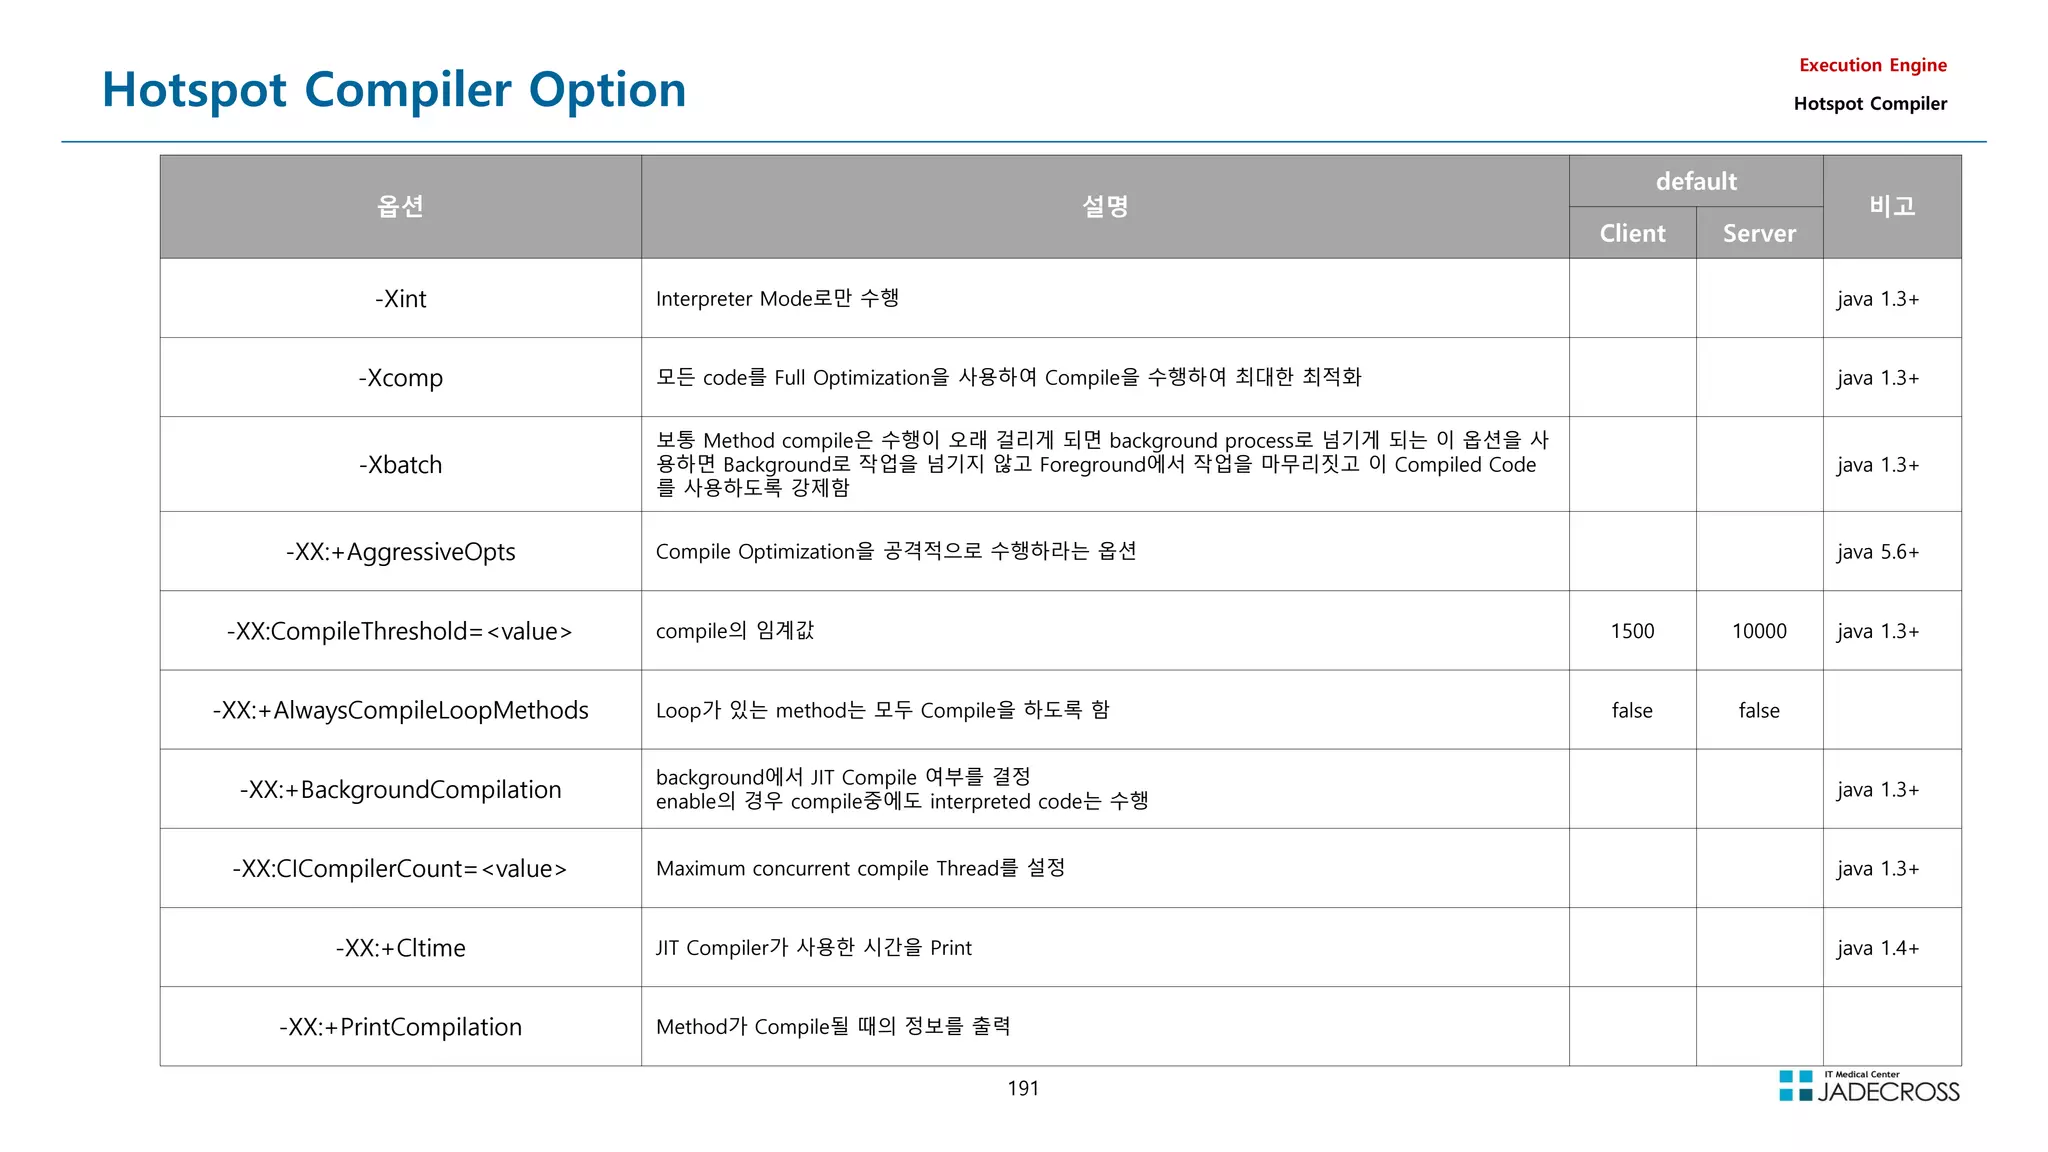
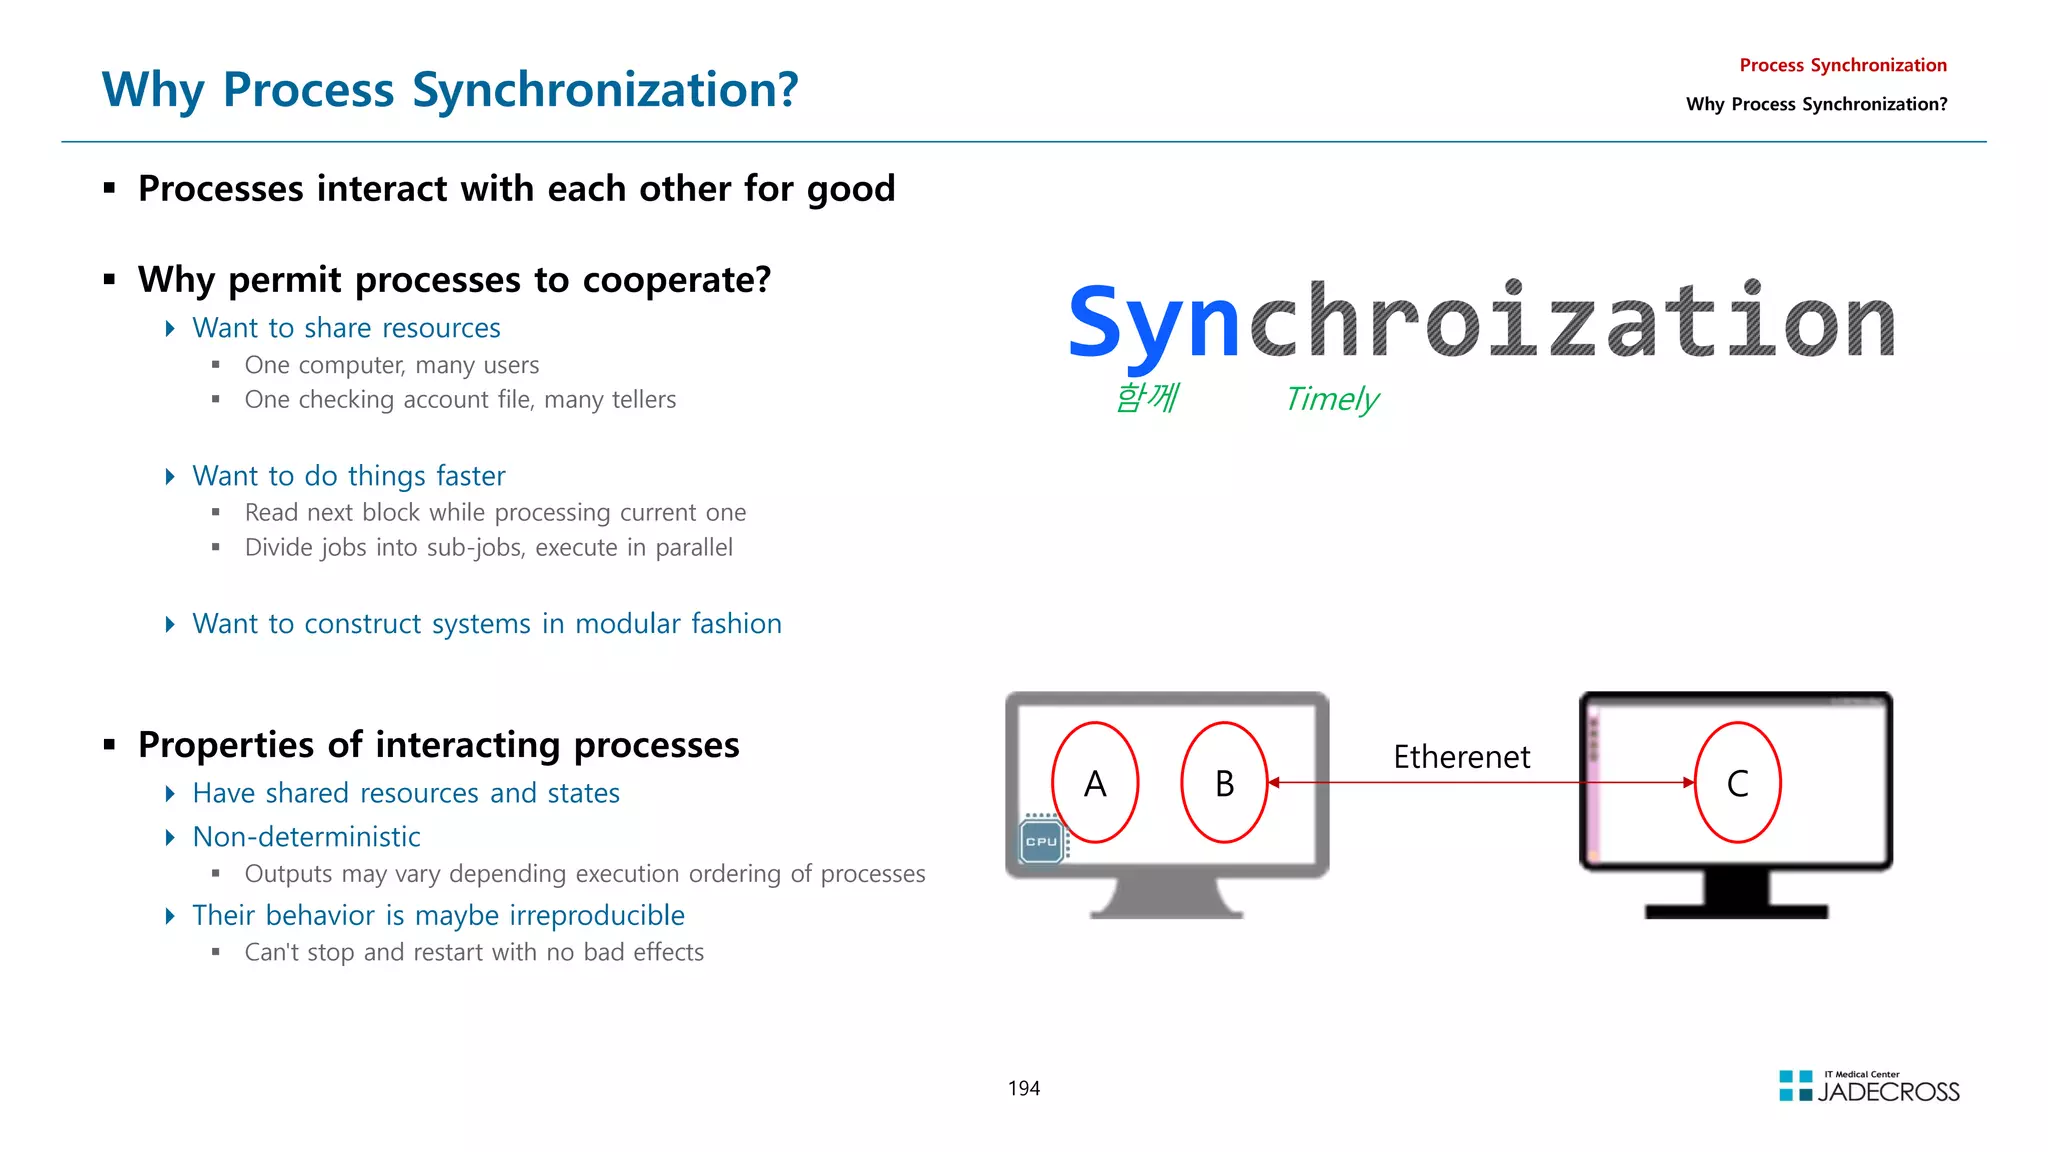
![195
Uncontrolled Task Interactions (1/3)
Data sharing problem instance
Interrupt routines and task code may share one or more variables that
they can use to communicate with each other
This may cause a data sharing problem - a sort of synchronization
problem
Such a task is referred to as non-reentrant code
Reentrant Code (재진입 가능 코드)
여러 Process들에 의해 동시에 호출되거나, 이전 호출이 완료되기 전에
반복 호출되어도 올바르게 수행되는 코드
Example
nuclear reactor monitoring system
Process Synchronization
Why Process Synchronization?
전역변수
static int iTemperatures[2];
Interrupt Service Routine
void interrupt vReadTemperatures(void){
iTemperatures[0] = !!; // Read in value from H/W
iTemperatures[1] = !!; // Read in value from H/W
}
User Process
void main(void){
int iTemp0, iTemp1;
while(TRUE){
iTemp0 = iTemperatures[0];
iTemp1 = iTemperatures[1];
if(iTemp0 != iTemp1)
!!; // set off howling alarm
}
}
Interrupt 발생](https://image.slidesharecdn.com/jvm-230511085906-be6f1201/75/JVM_-pdf-195-2048.jpg)
![196
Uncontrolled Task Interactions (2/3)
Atomic Operation
더 이상 분리할 수 없는 하나의 단위로 처리해야하는 Operation
Process Synchronization
Why Process Synchronization?
전역변수
static int iTemperatures[2];
Interrupt Service Routine
void interrupt vReadTemperatures(void){
iTemperatures[0] = !!; // Read in value from H/W
iTemperatures[1] = !!; // Read in value from H/W
}
User Process
void main(void){
int iTemp0, iTemp1;
while(TRUE){
iTemp0 = iTemperatures[0];
iTemp1 = iTemperatures[1];
if(iTemp0 != iTemp1)
!!; // set off howling alarm
}
}
User Process
void main(void){
while(TRUE){
if(iTemperatures[0] != iTemperatures[1])
!!; // set off howling alarm
}
} The same bug as in previous page!
The problem is that the statement
that compares iTemperatures[0] with
iTemperatures[1] can be interrupted](https://image.slidesharecdn.com/jvm-230511085906-be6f1201/75/JVM_-pdf-196-2048.jpg)
![197
Uncontrolled Task Interactions (3/3)
Solution
Disable interrupts
Process Synchronization
Why Process Synchronization?
전역변수
static int iTemperatures[2];
Interrupt Service Routine
void interrupt vReadTemperatures(void){
iTemperatures[0] = !!; // Read in value from H/W
iTemperatures[1] = !!; // Read in value from H/W
}
User Process
void main(void){
int iTemp0, iTemp1;
while(TRUE){
iTemp0 = iTemperatures[0];
iTemp1 = iTemperatures[1];
if(iTemp0 != iTemp1)
!!; // set off howling alarm
}
}
User Process
void main(void){
int iTemp0, iTemp1;
while(TRUE){
disable(); // Disable interrupts using array
iTemp0 = iTemperatures[0];
iTemp1 = iTemperatures[1];
enable();
if(iTemp0 != iTemp1)
!!; // set off howling alarm
}
}
non-interruptible
operations
Process와 Interrupt Service Routine간의
Interaction은 해결되었는데,
Process와 Process간의 Interaction의
동기화는 어떻게?](https://image.slidesharecdn.com/jvm-230511085906-be6f1201/75/JVM_-pdf-197-2048.jpg)
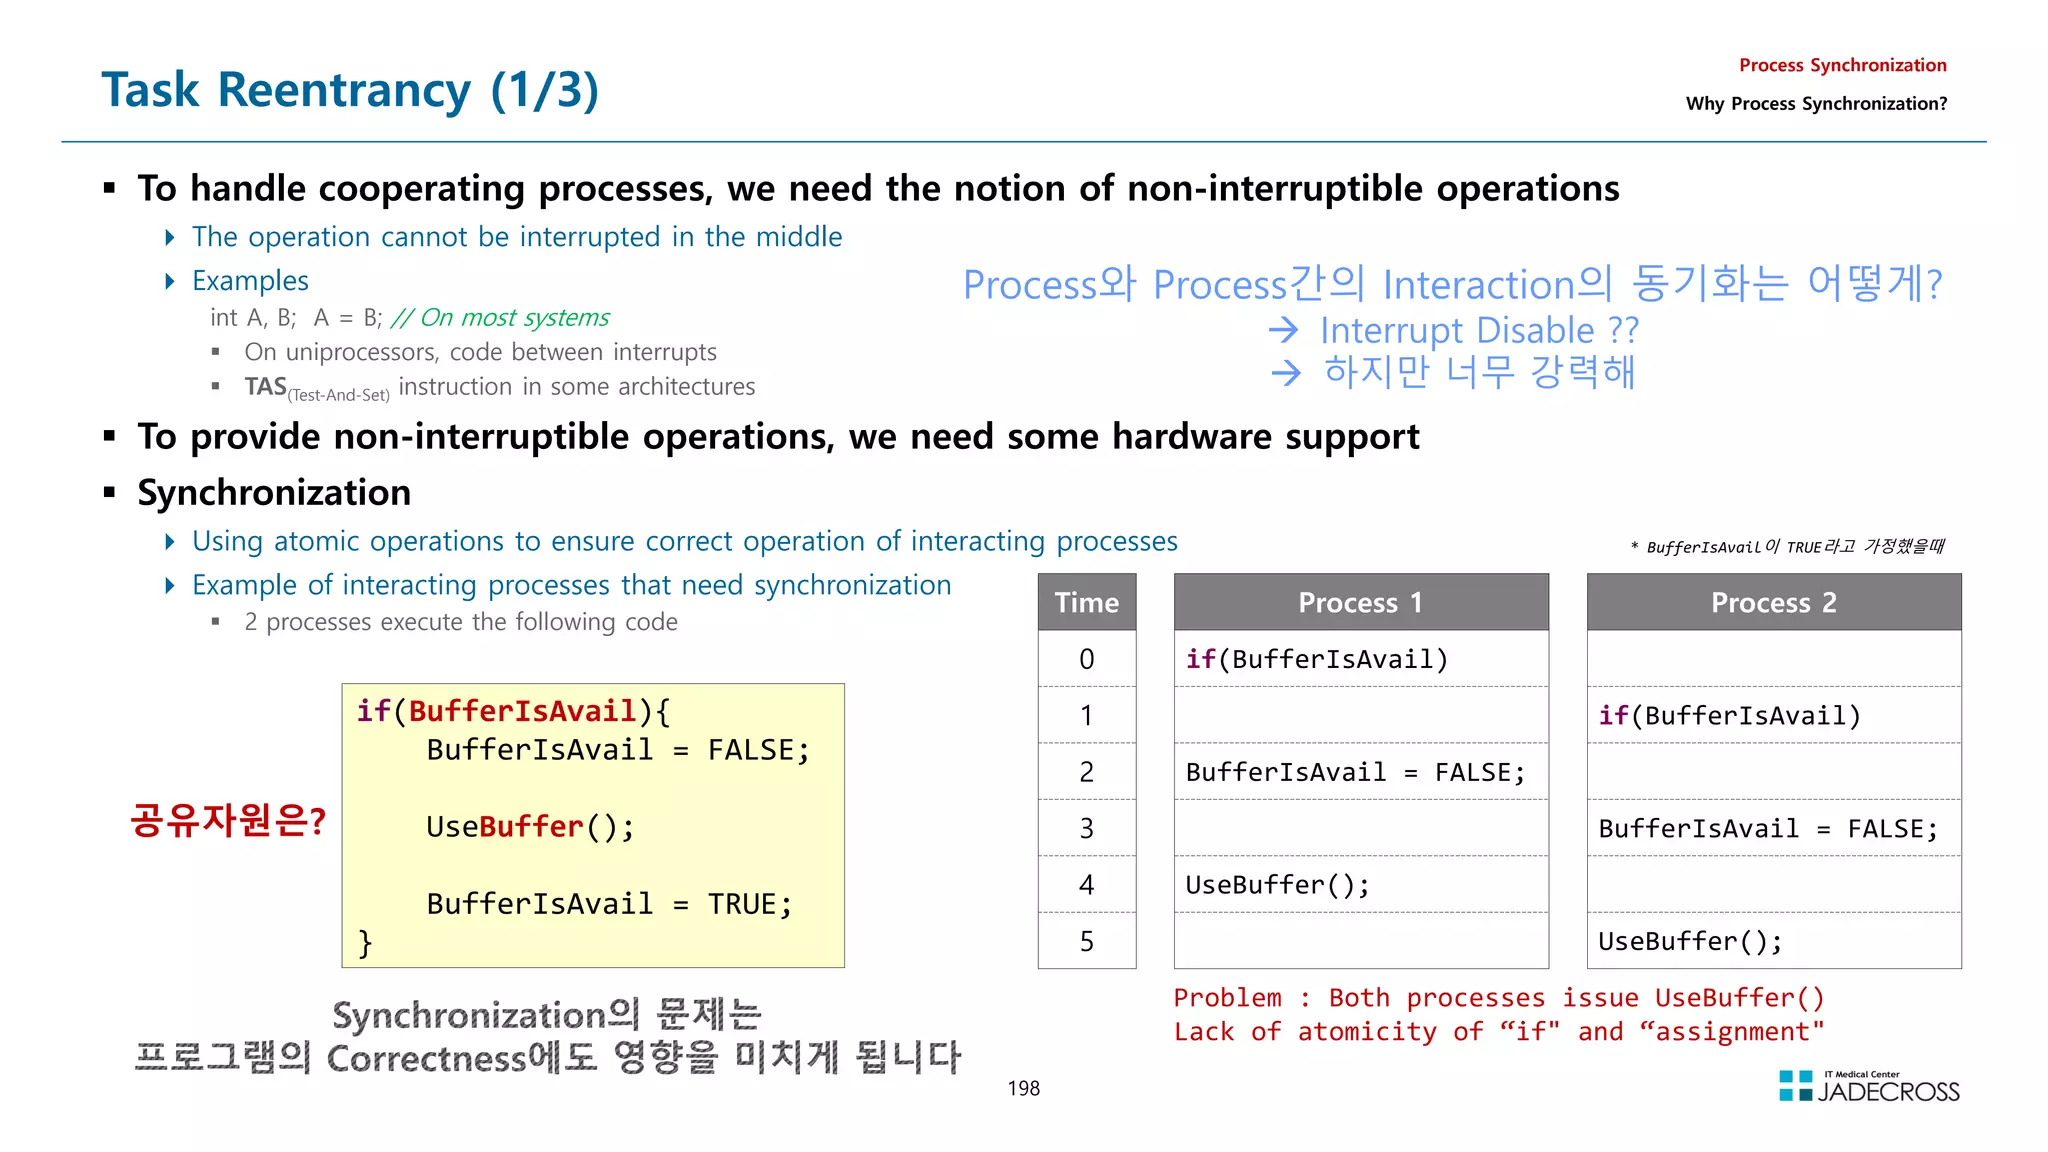
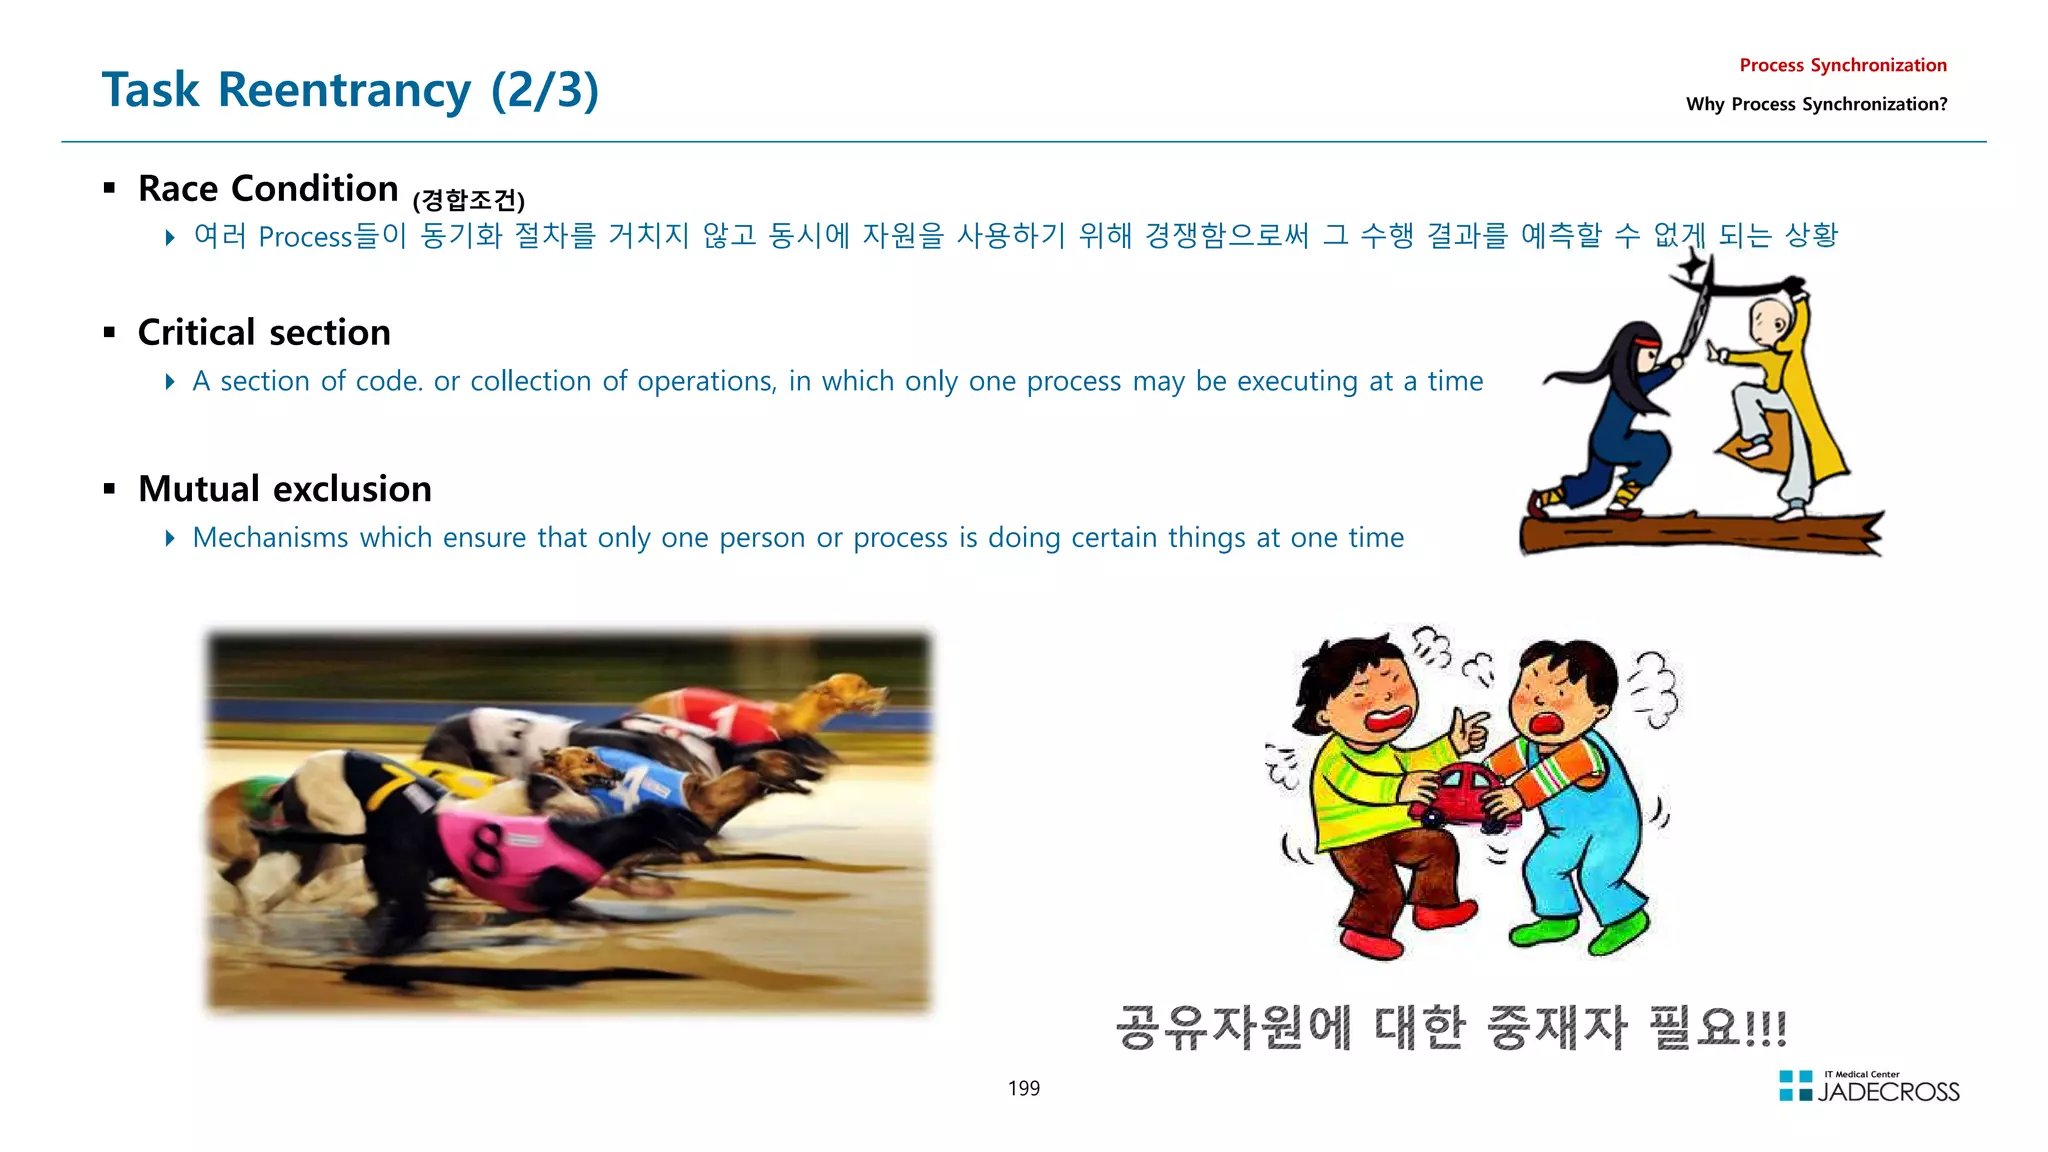
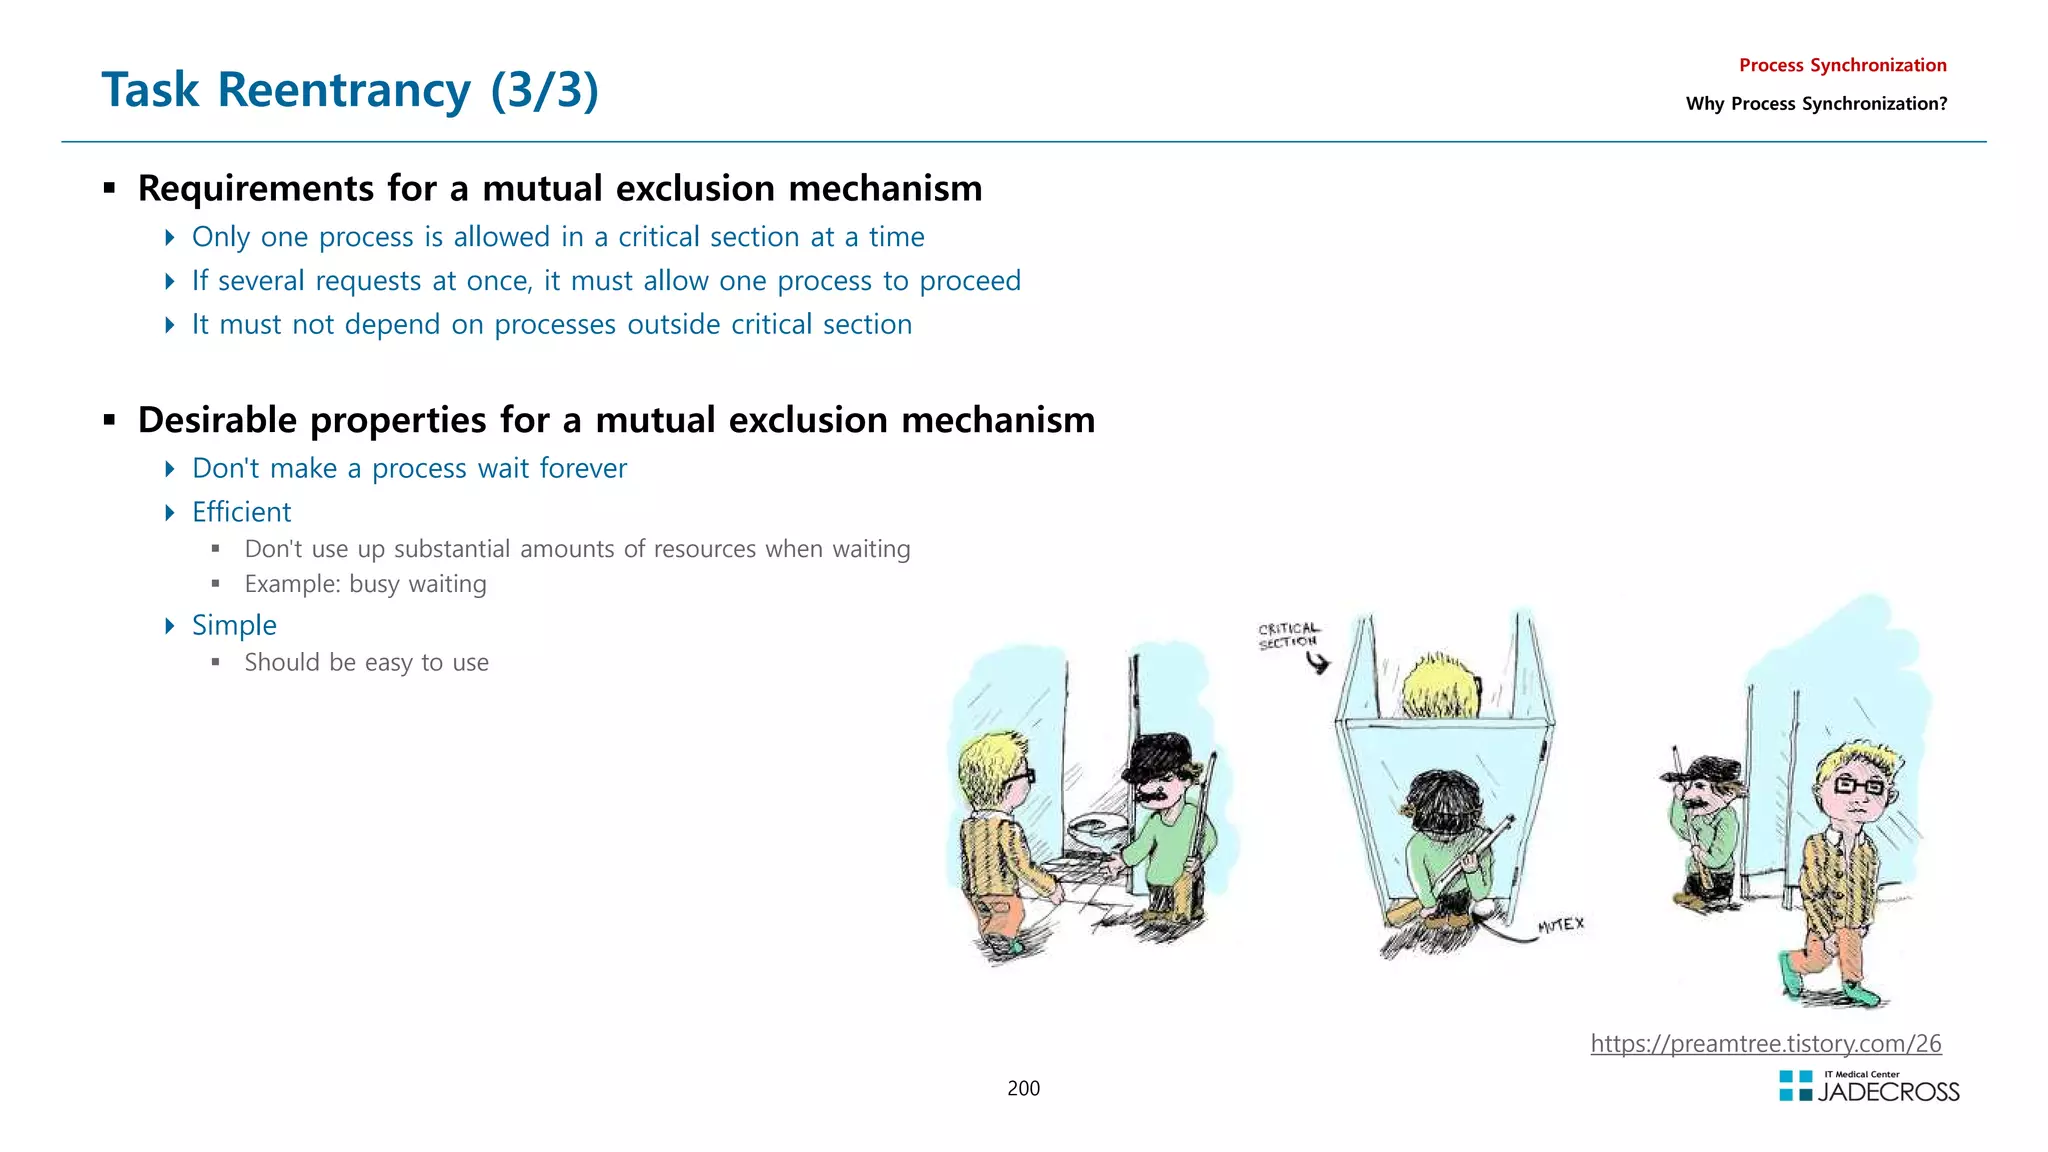
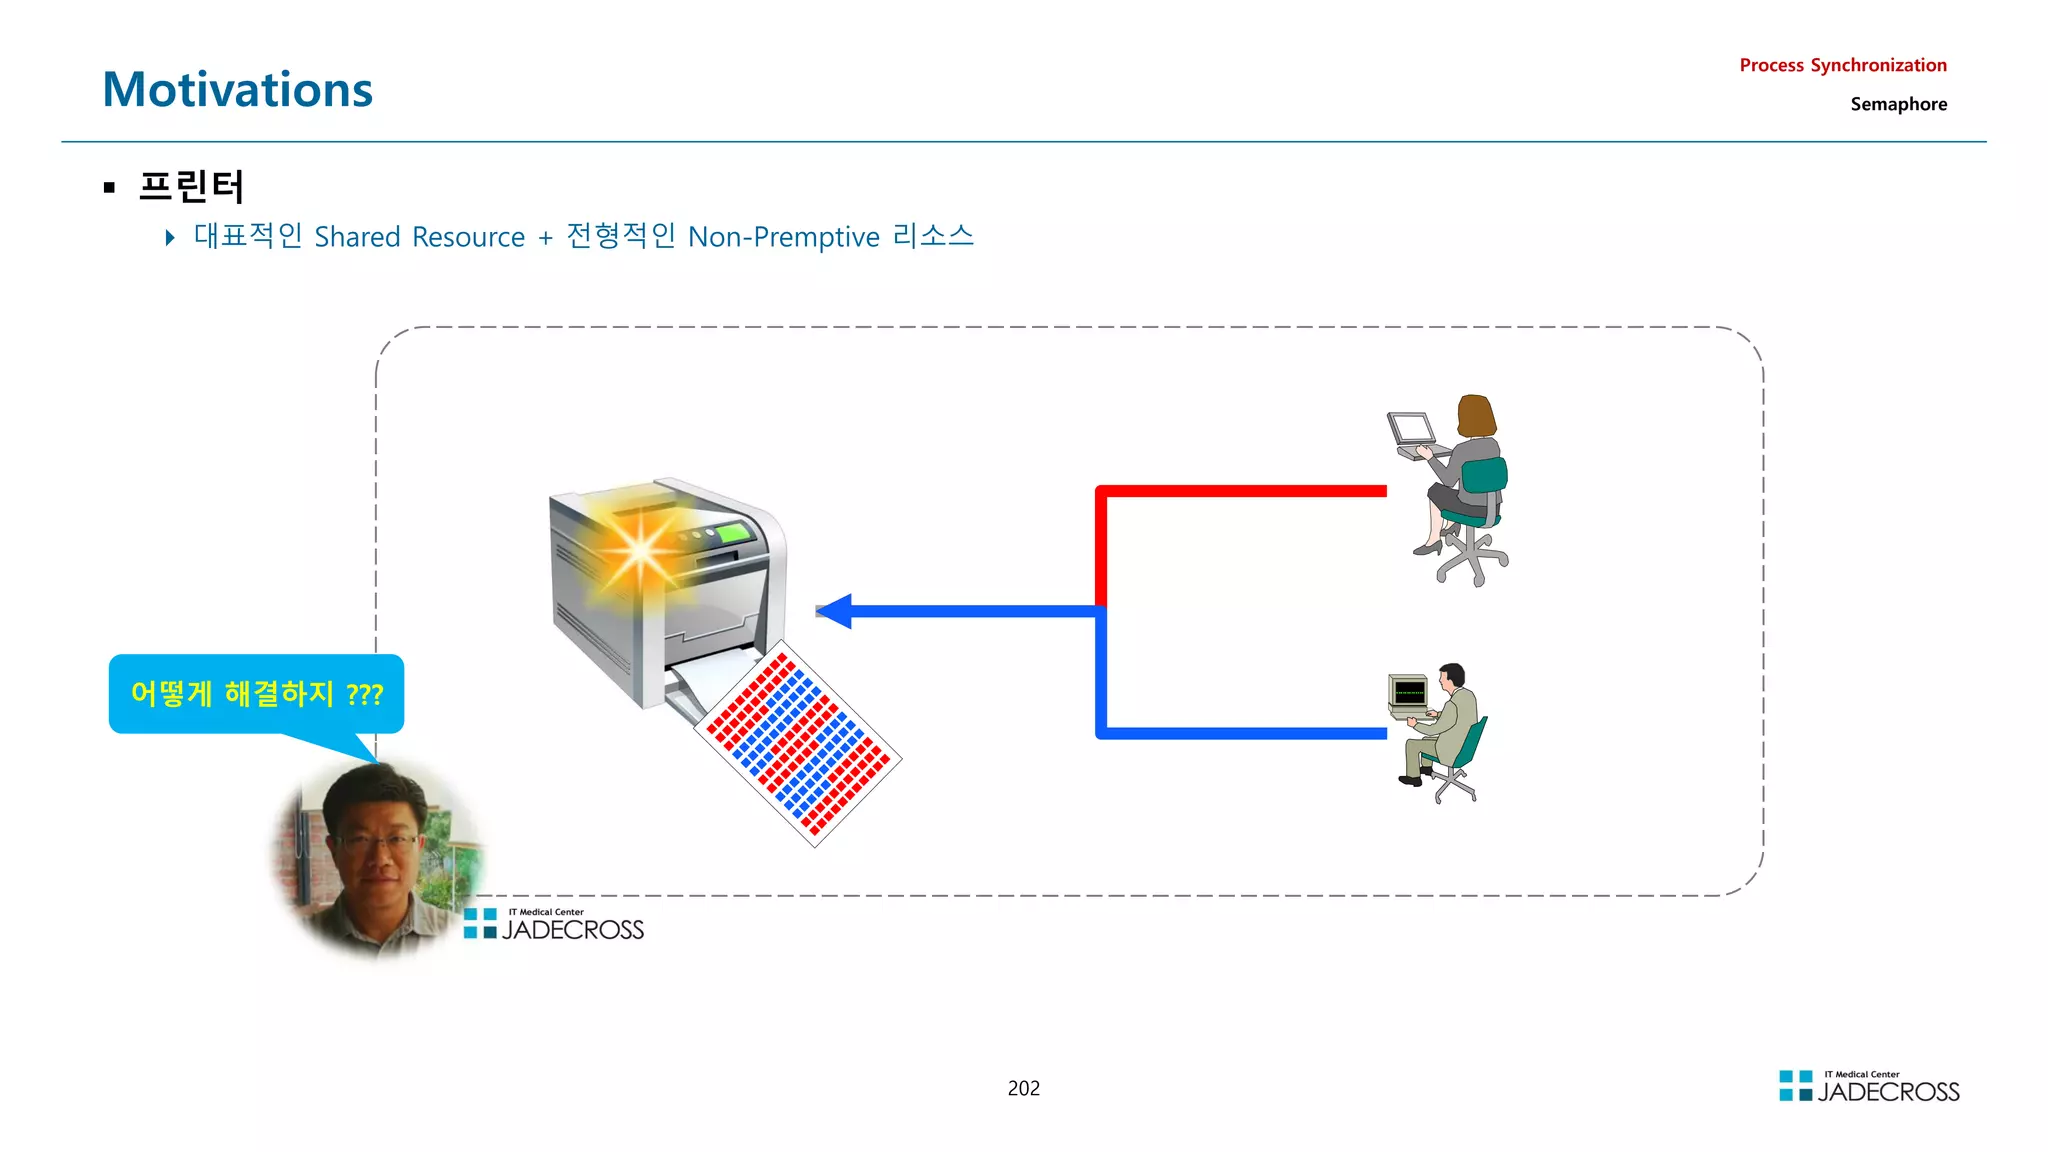
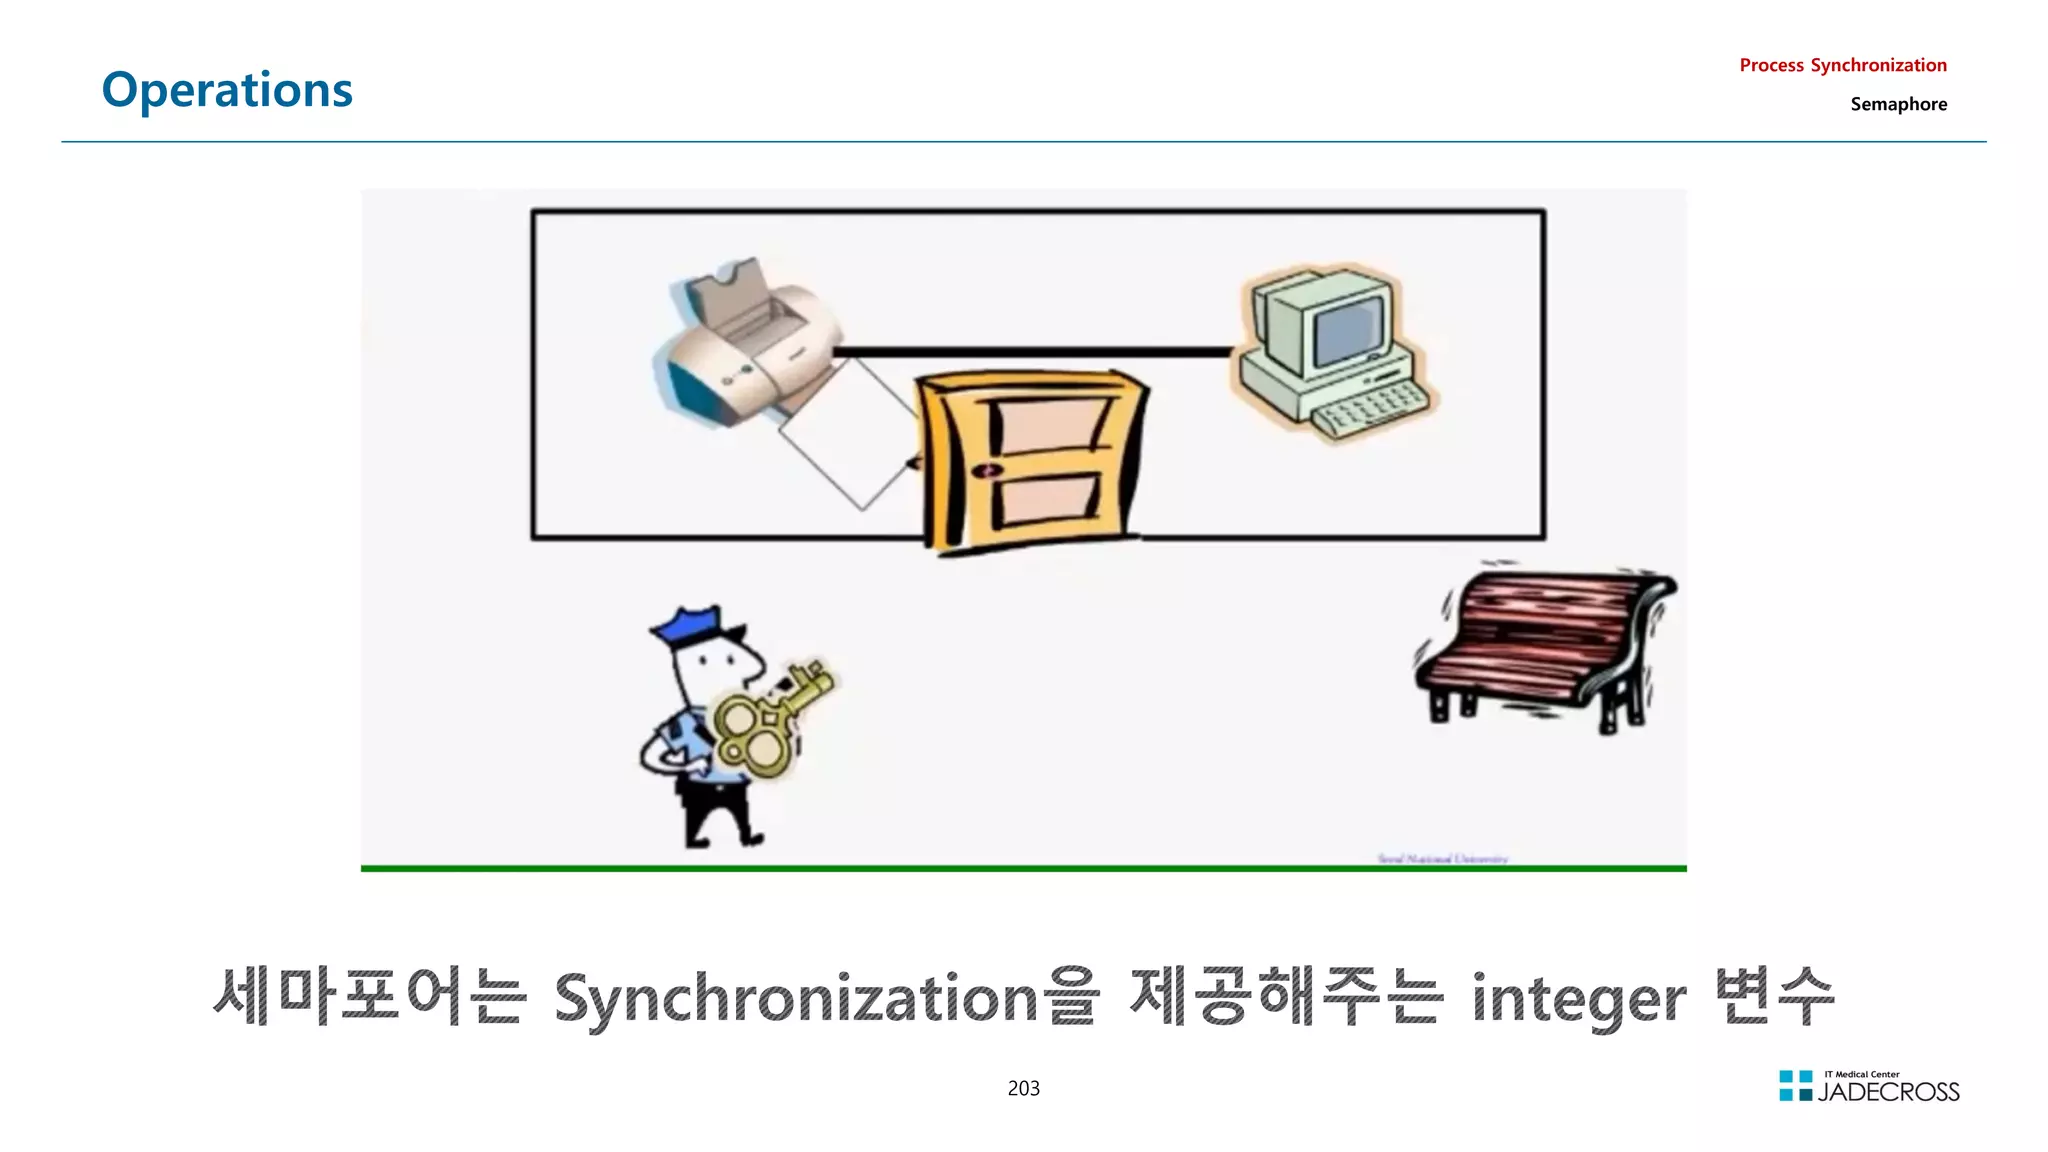
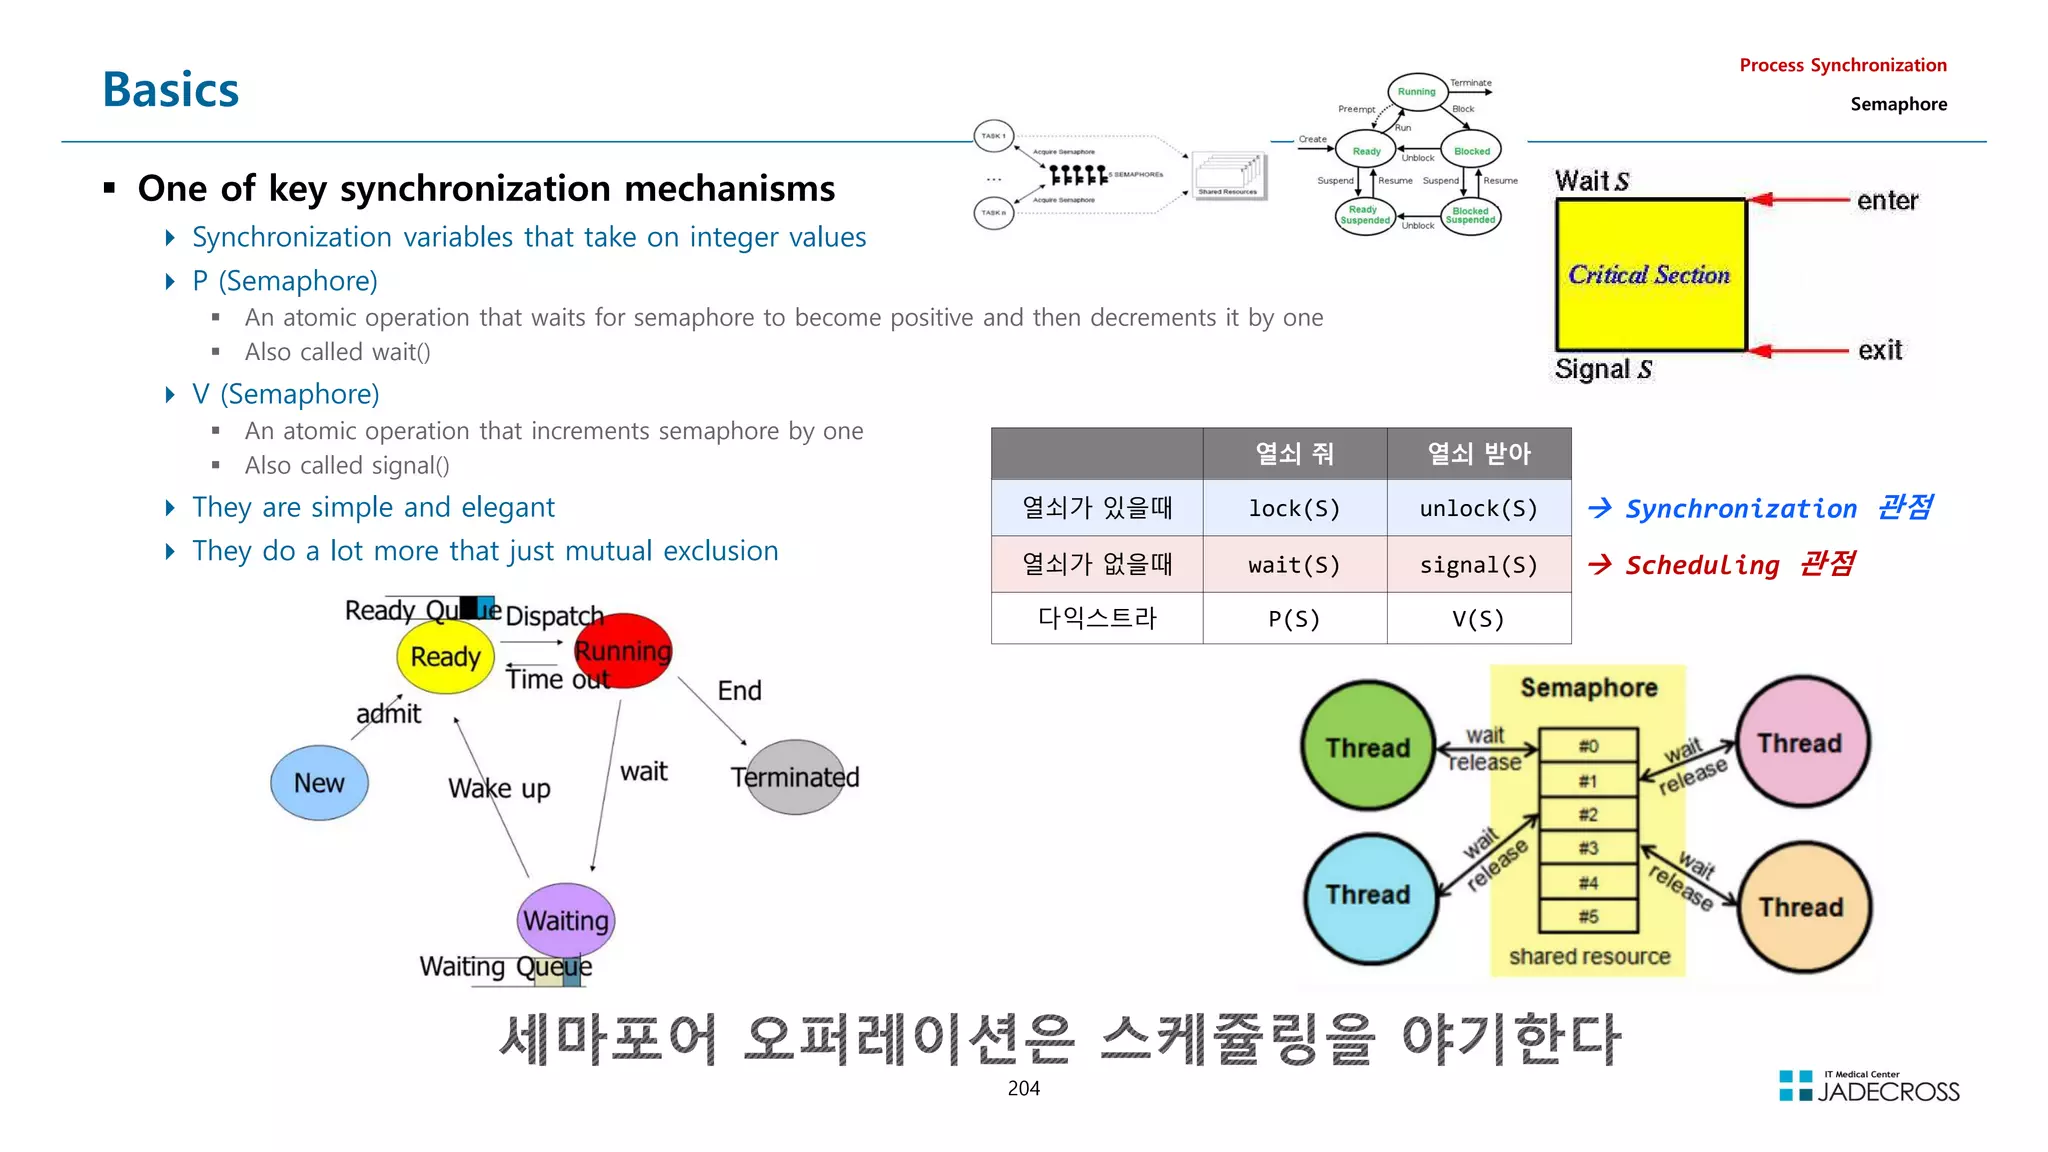
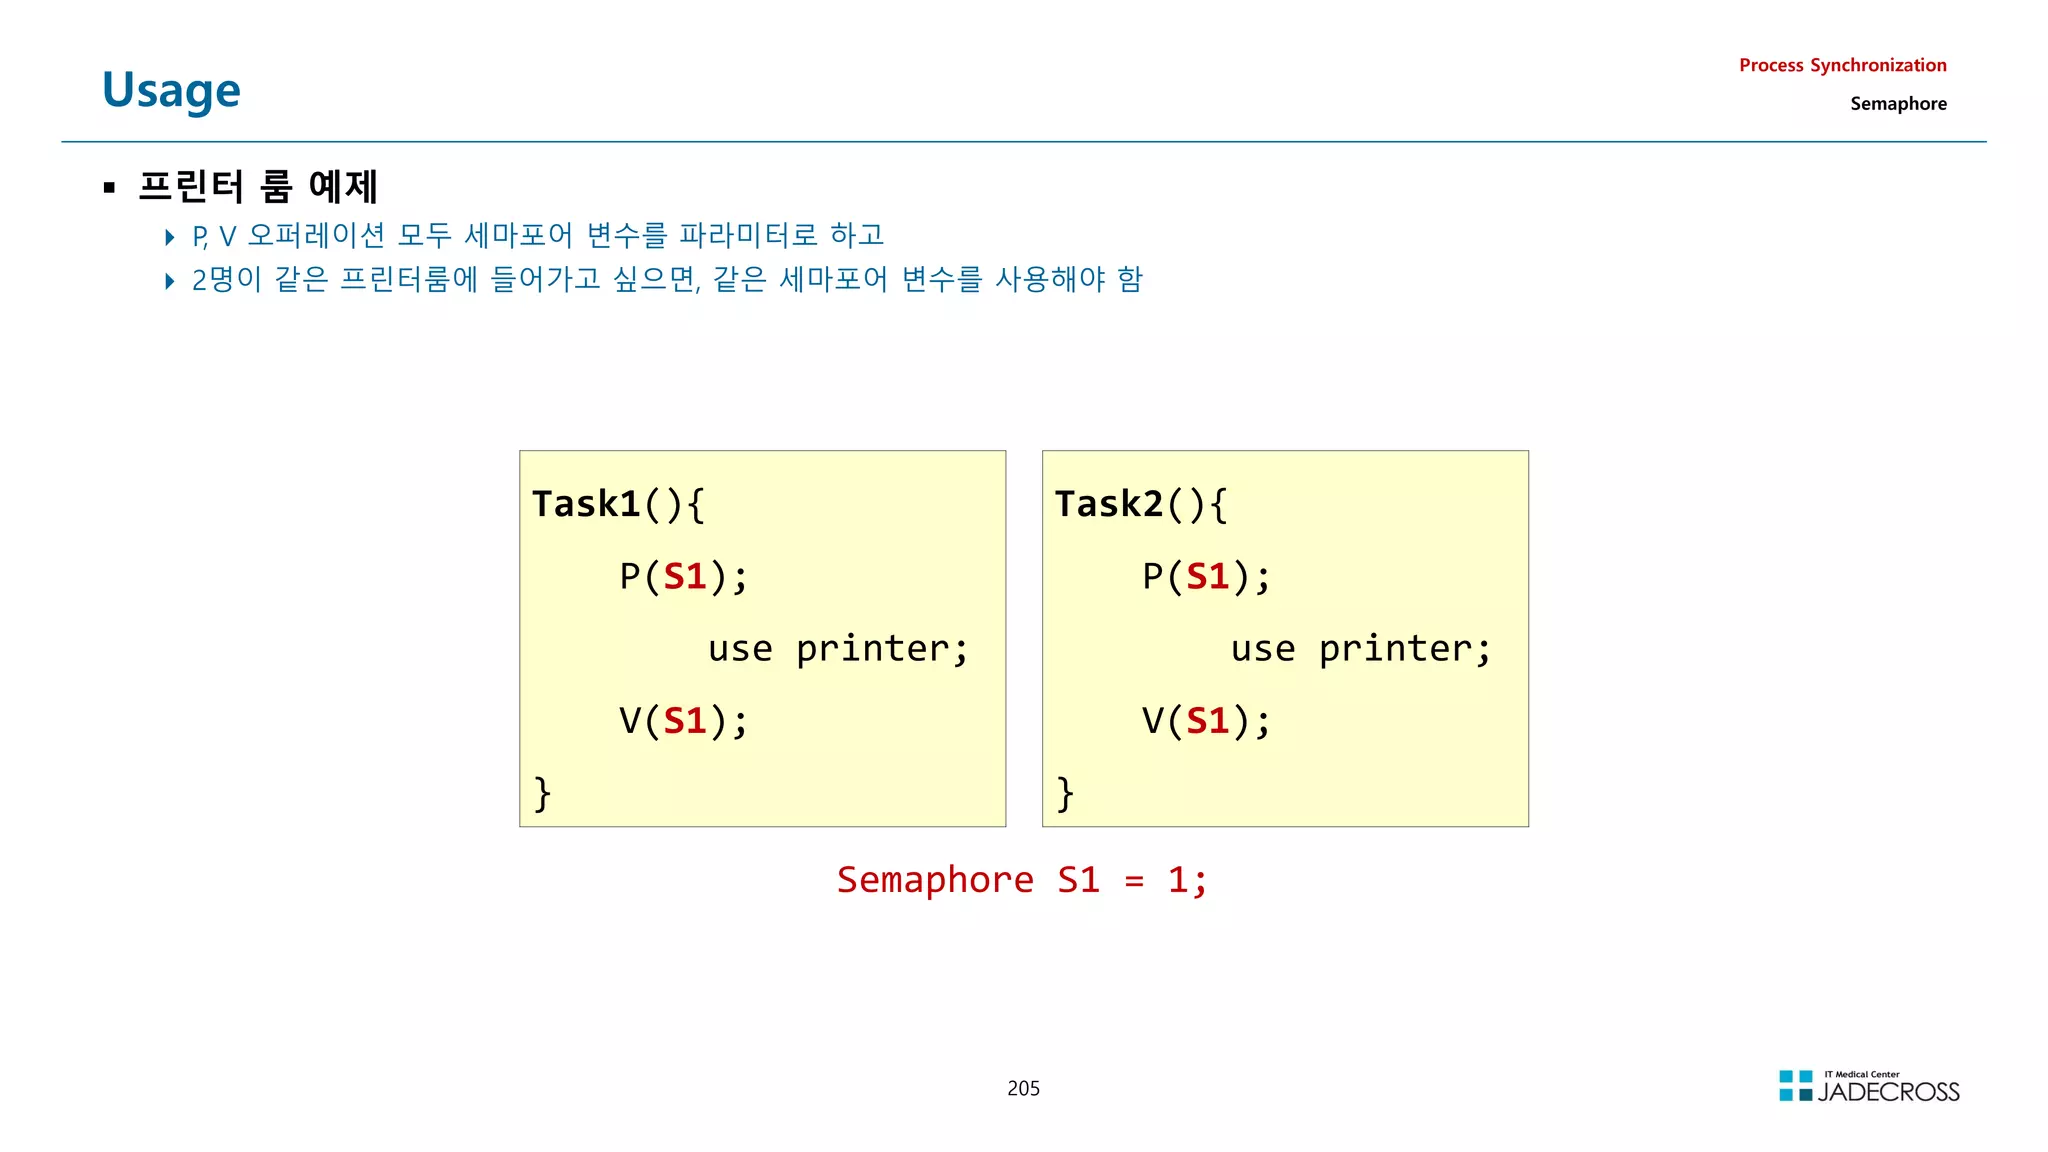
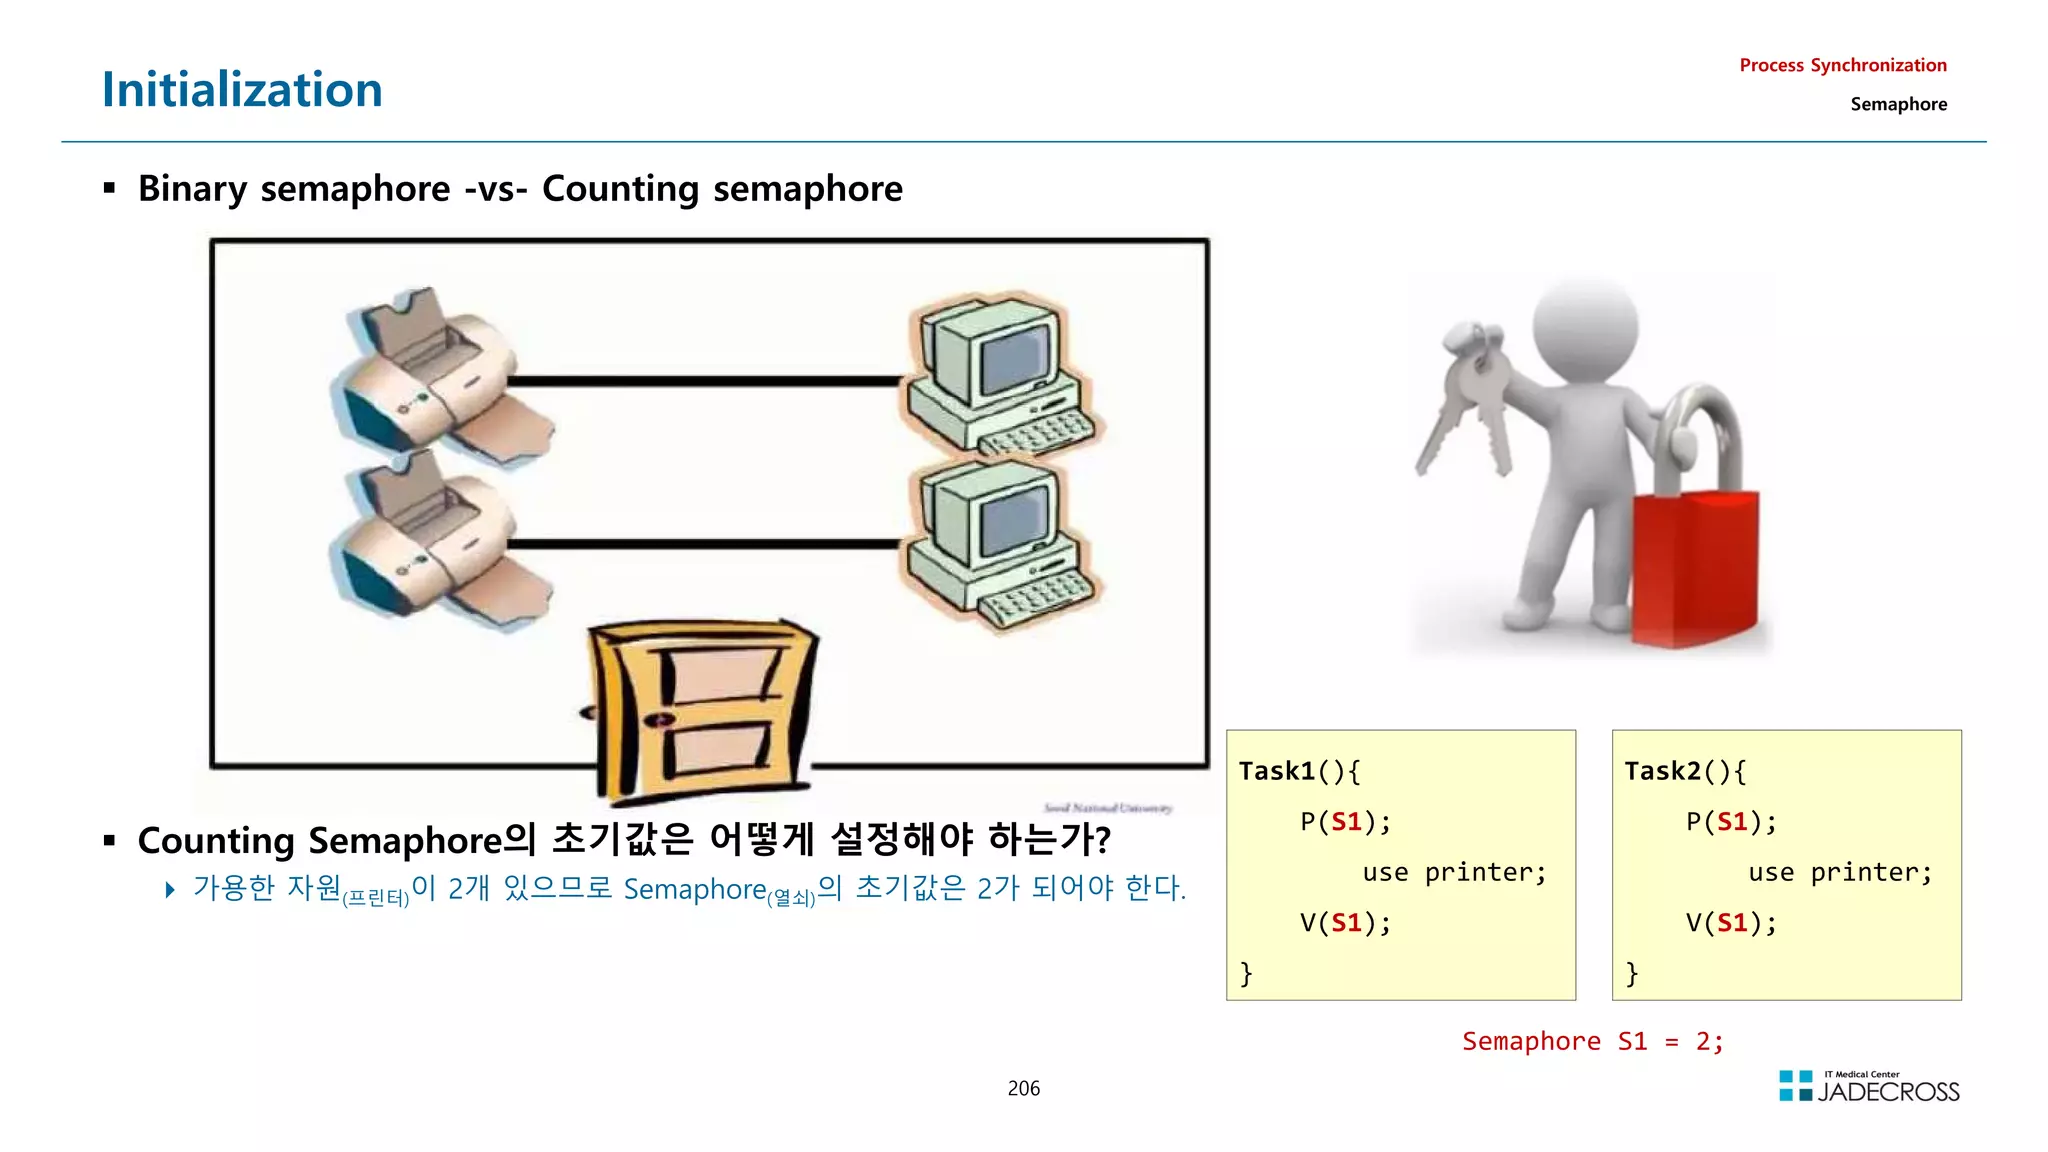
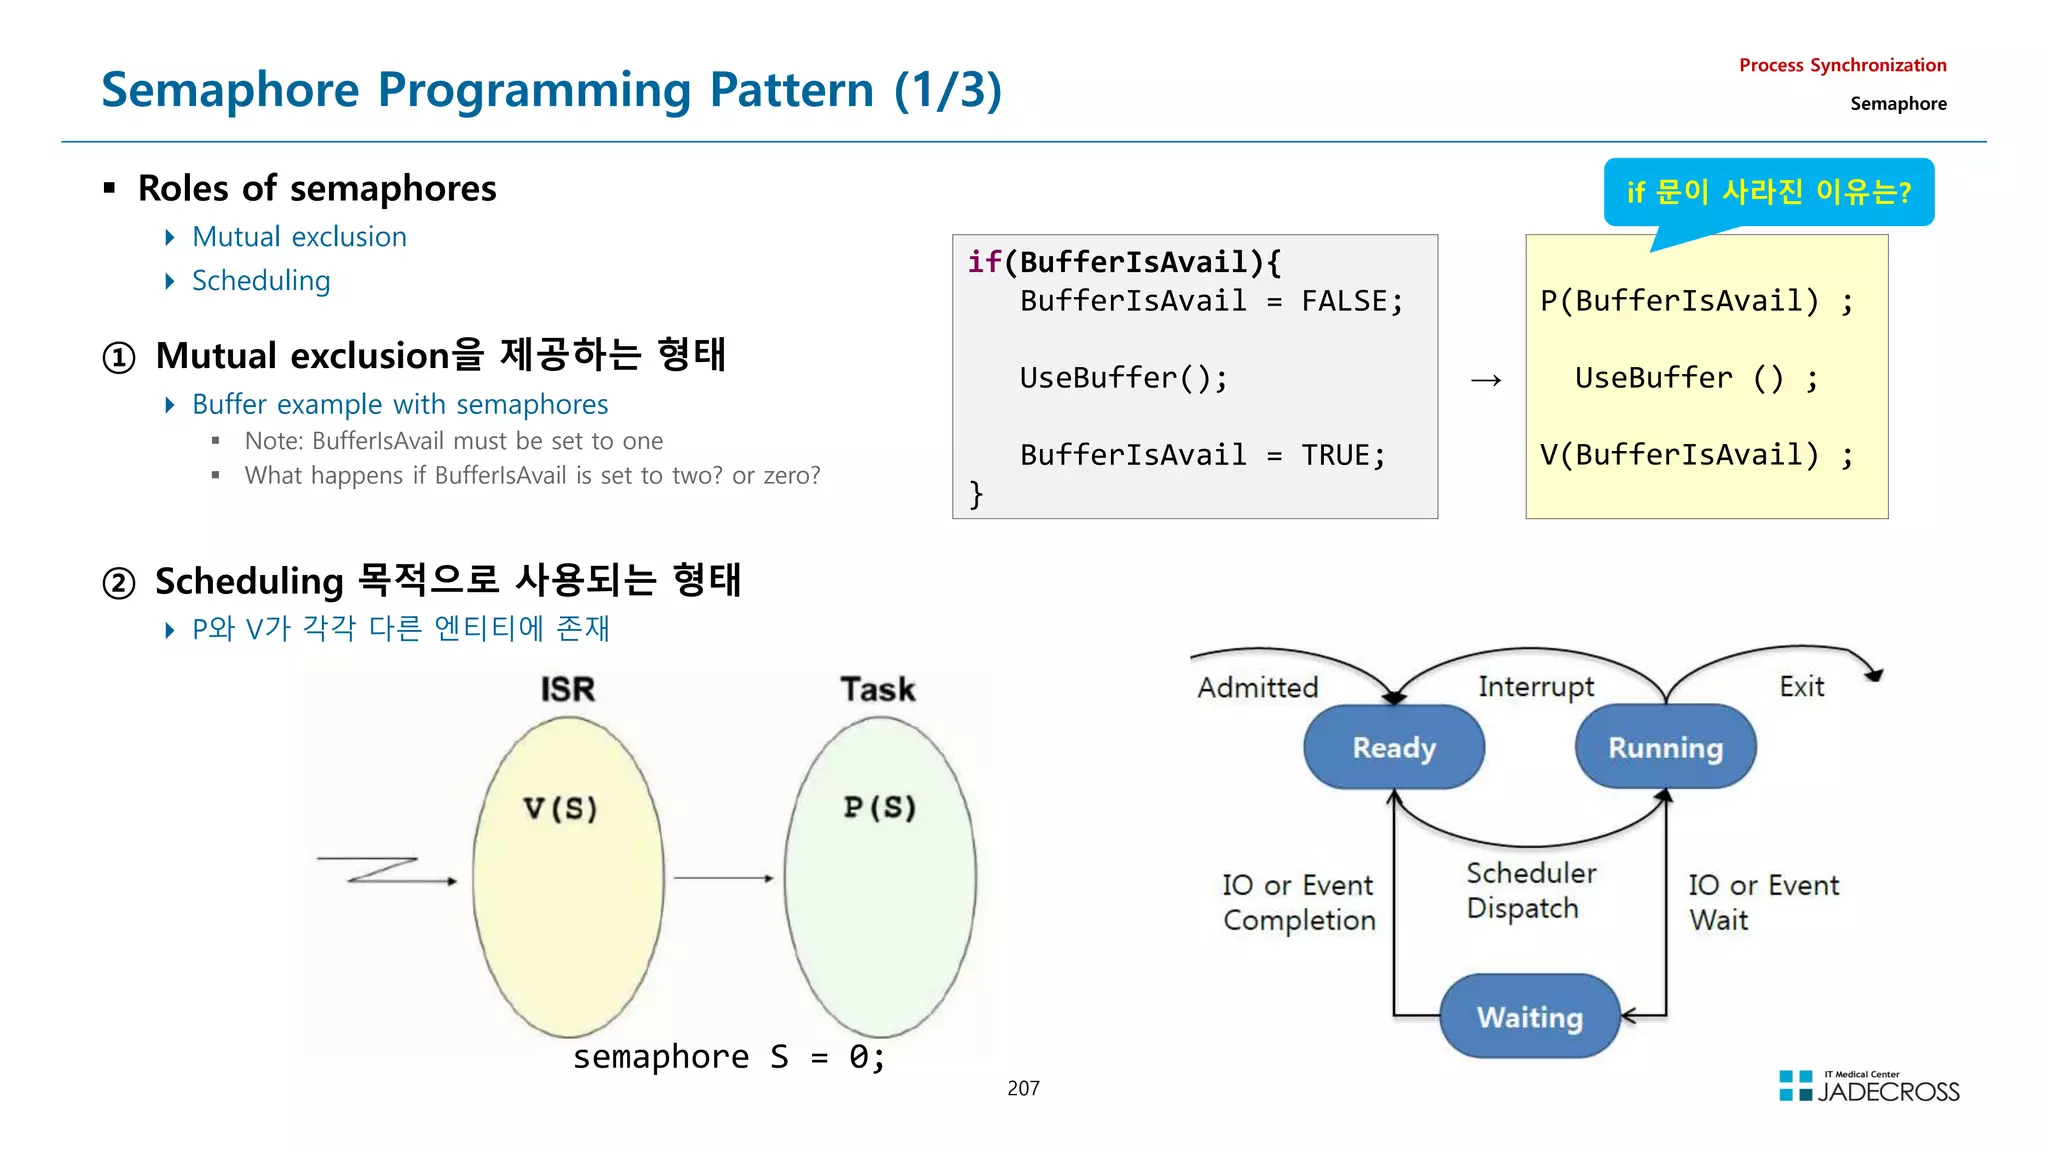
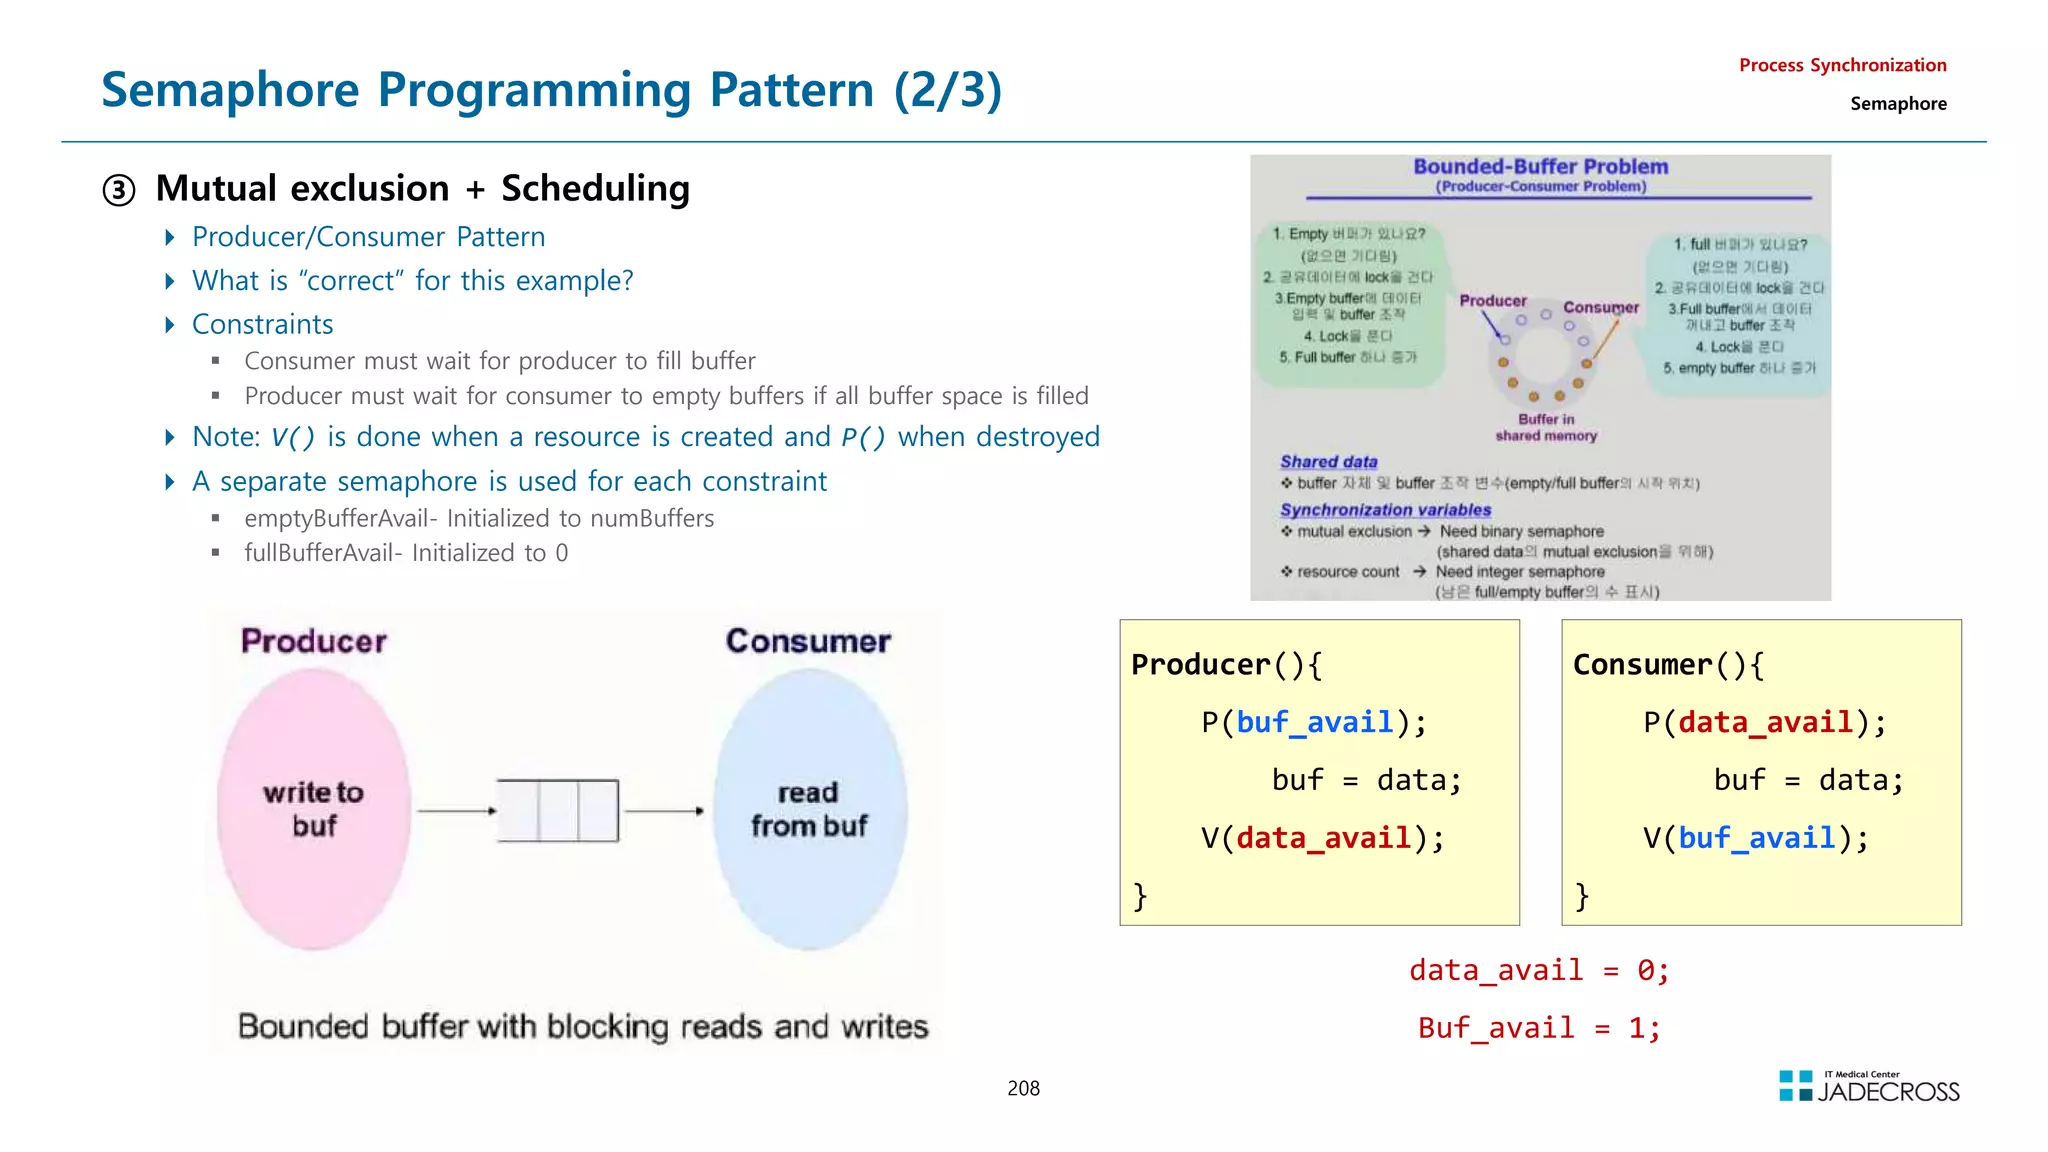
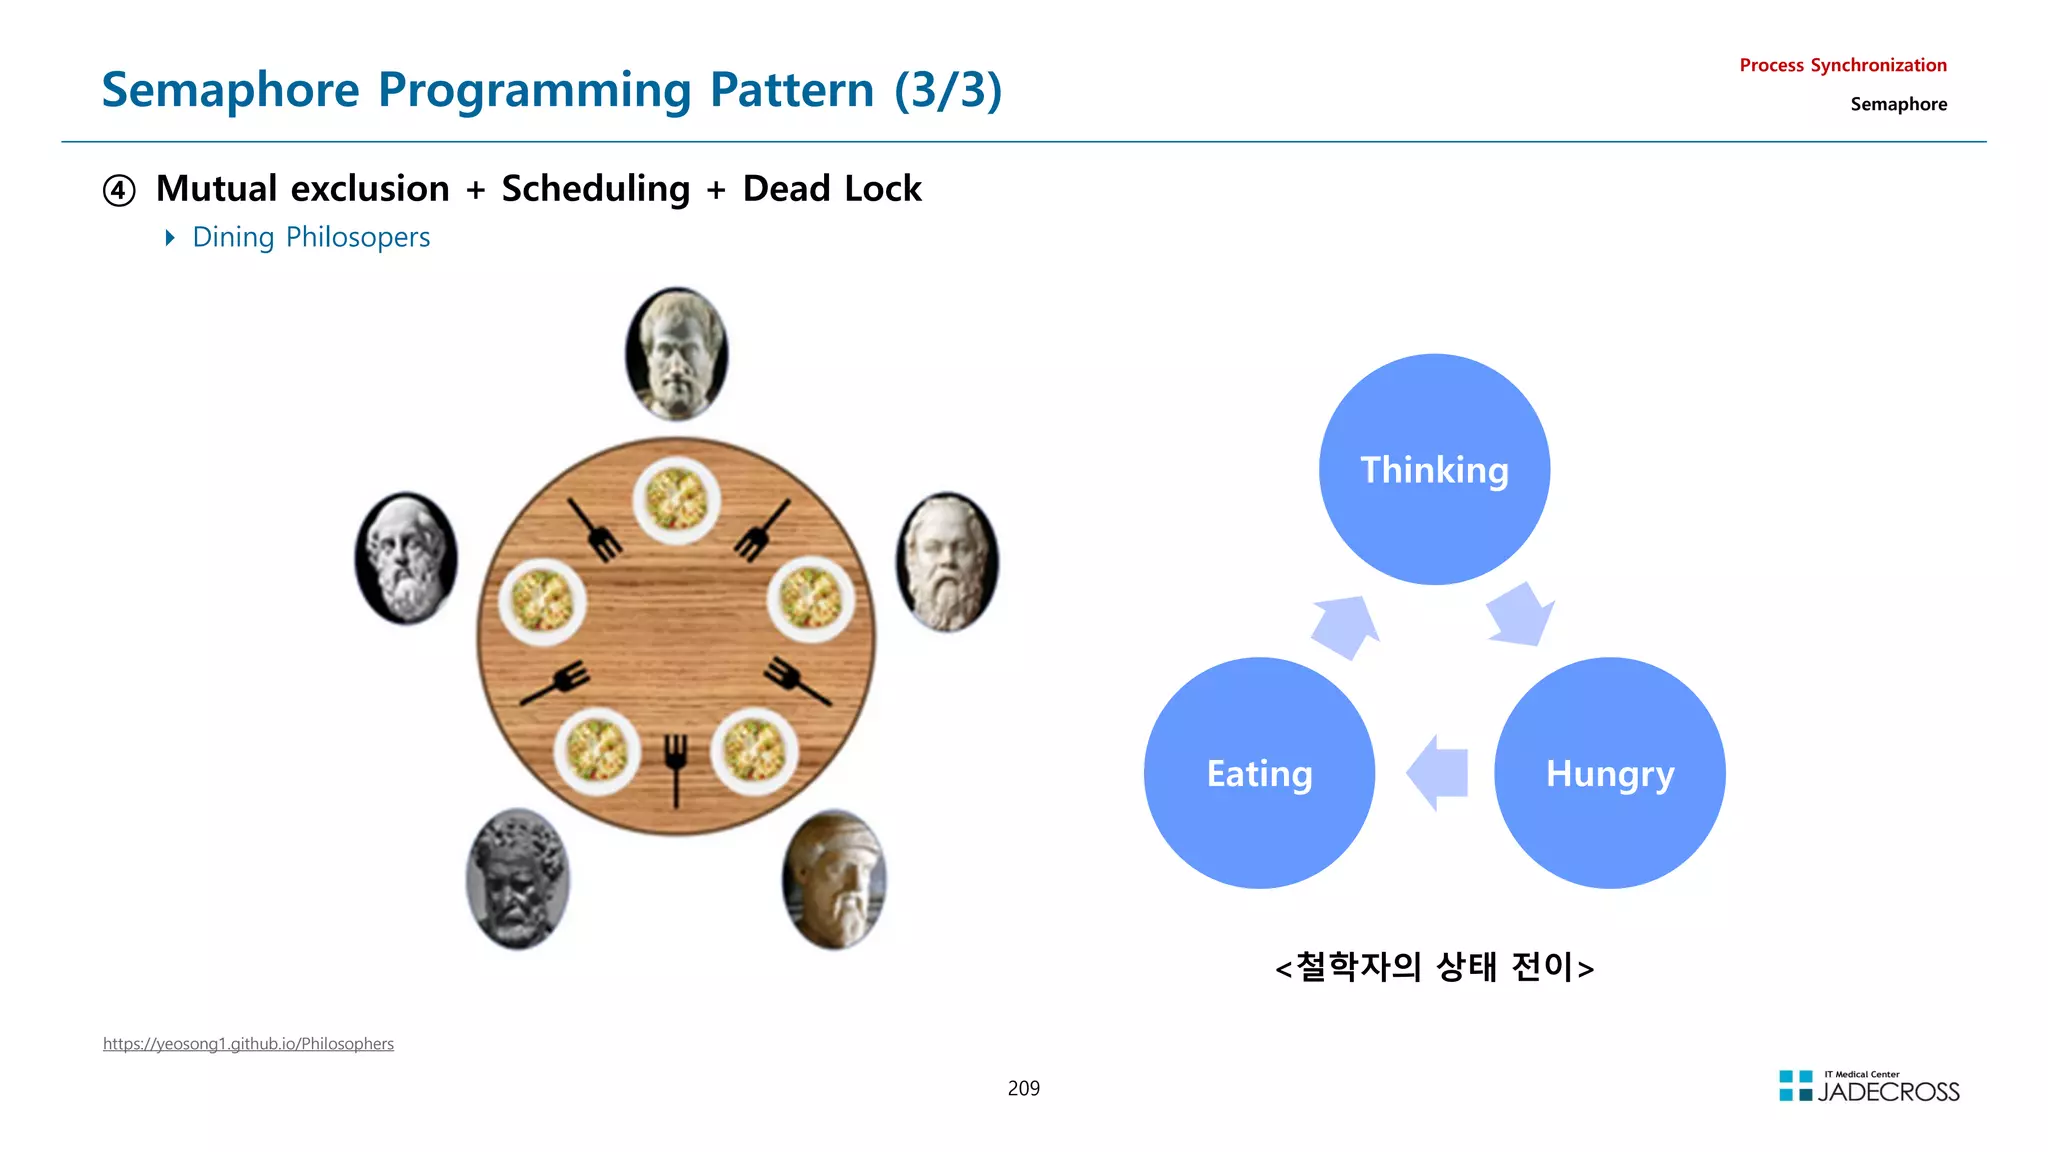
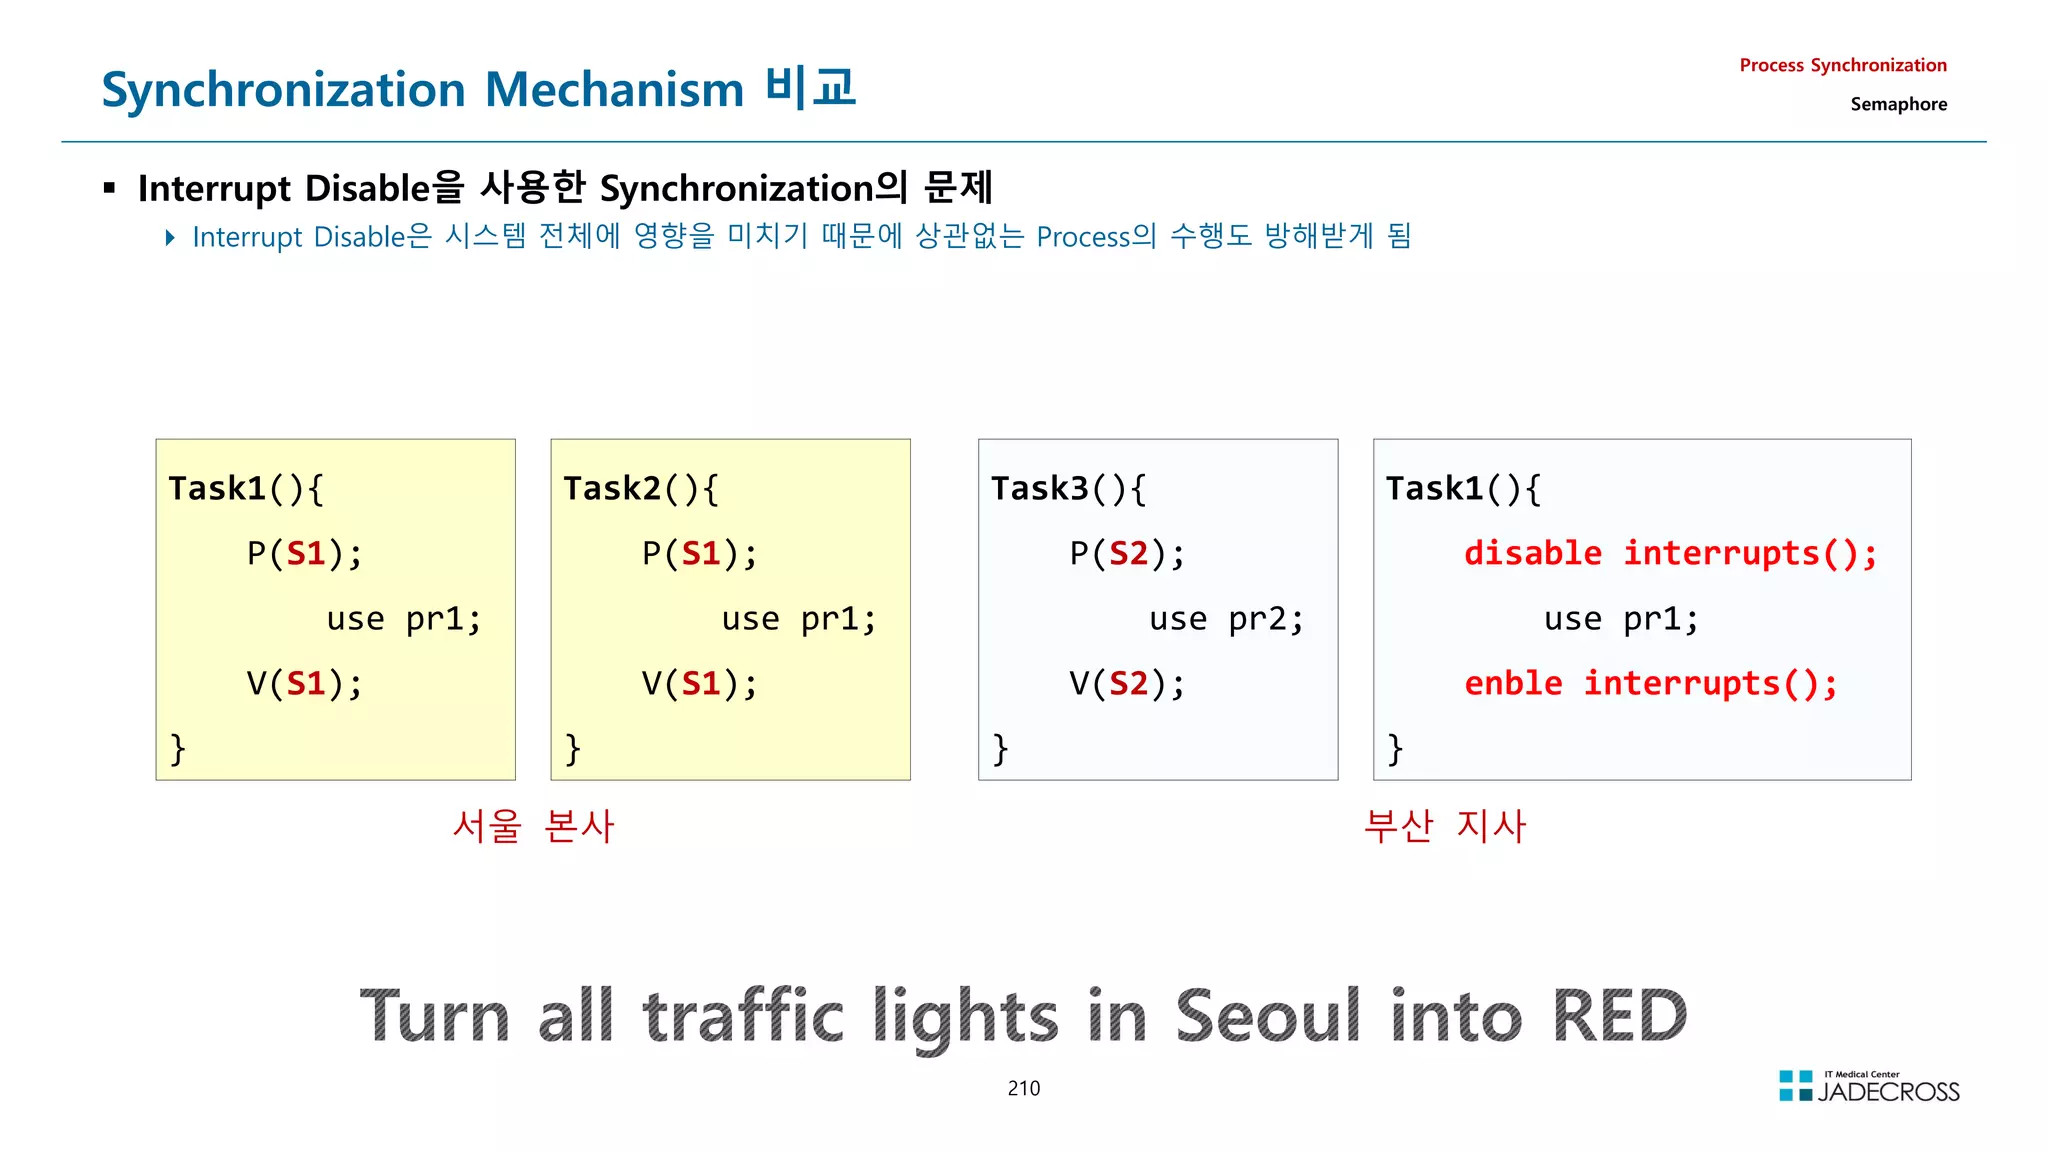
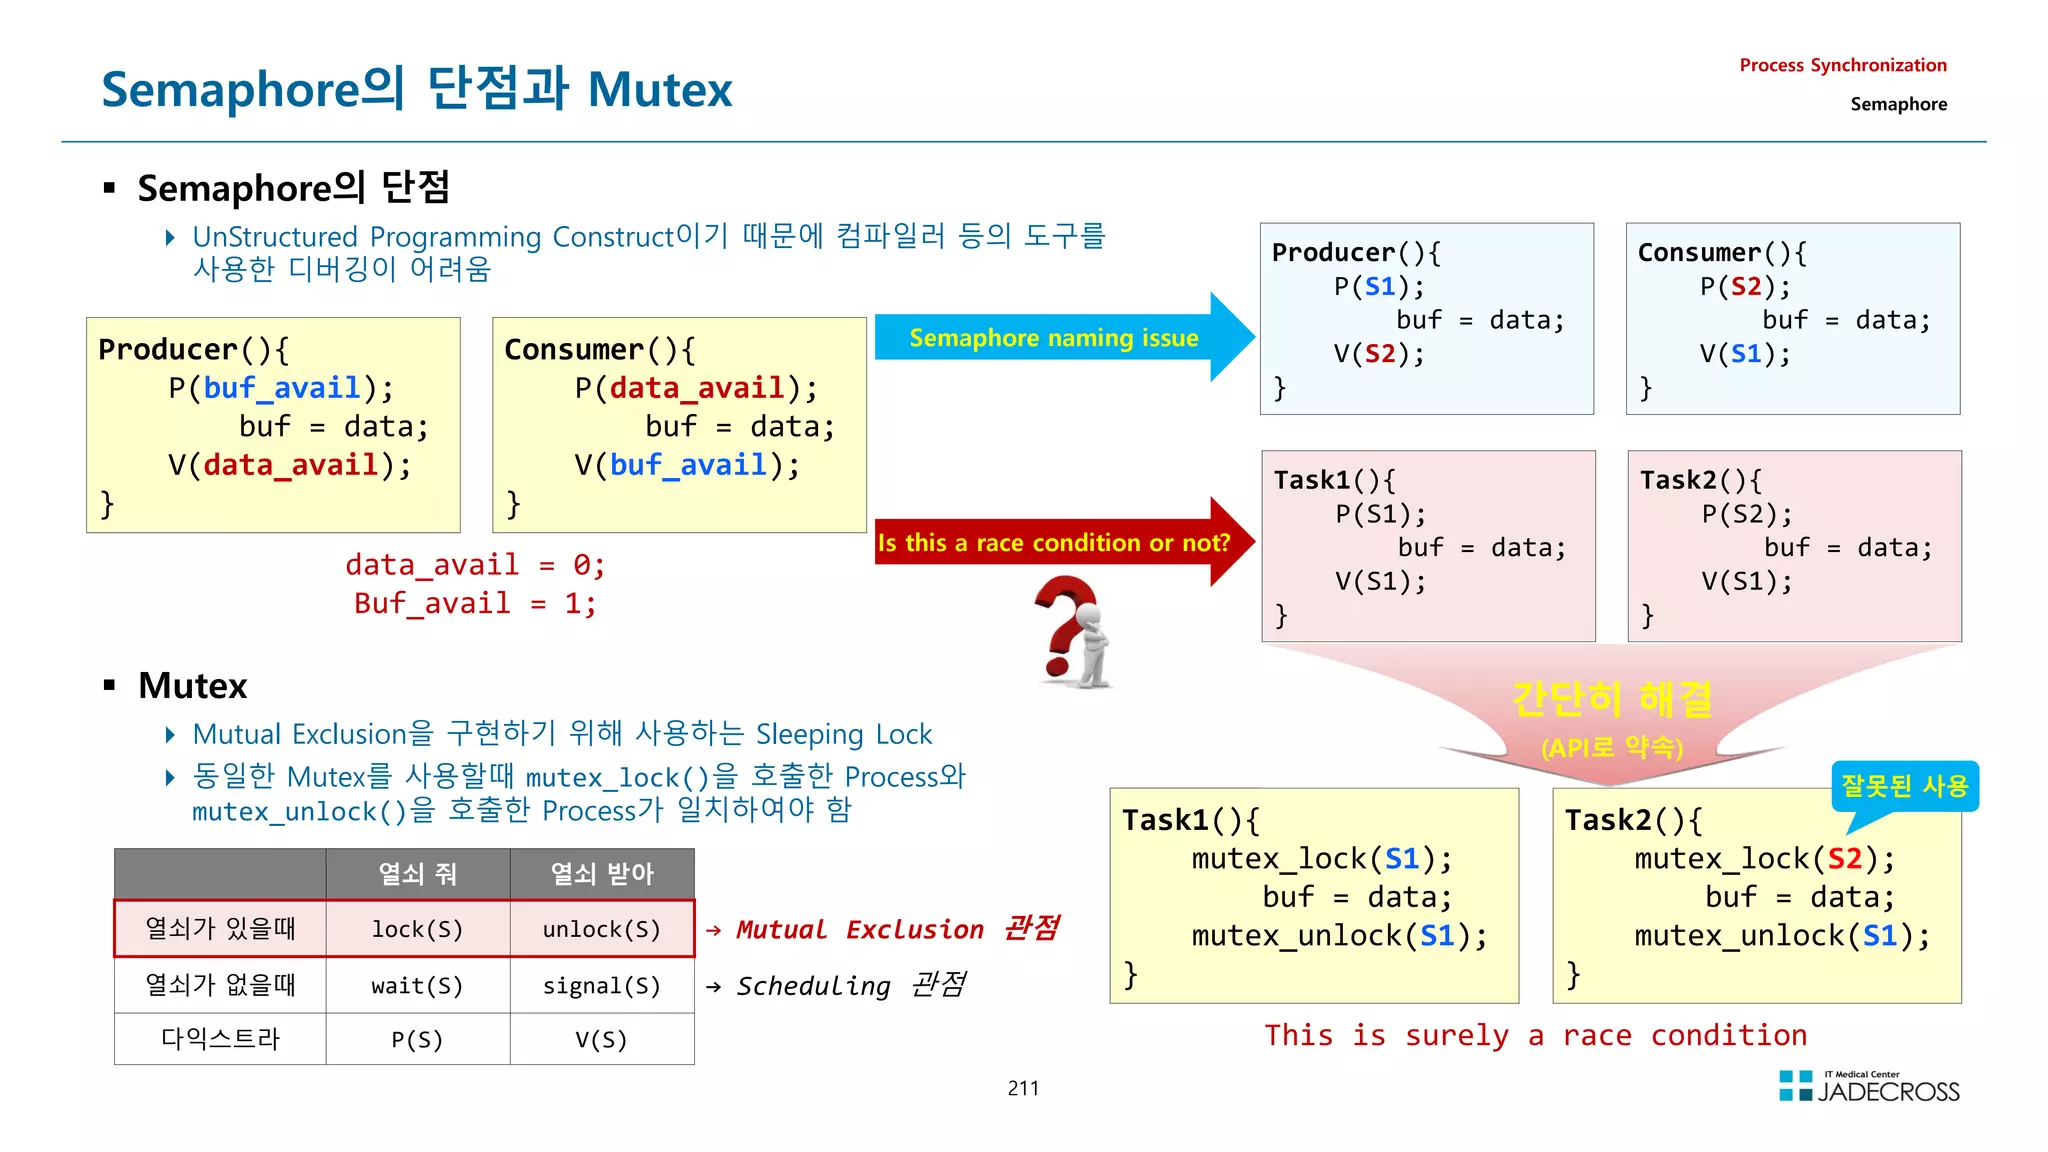
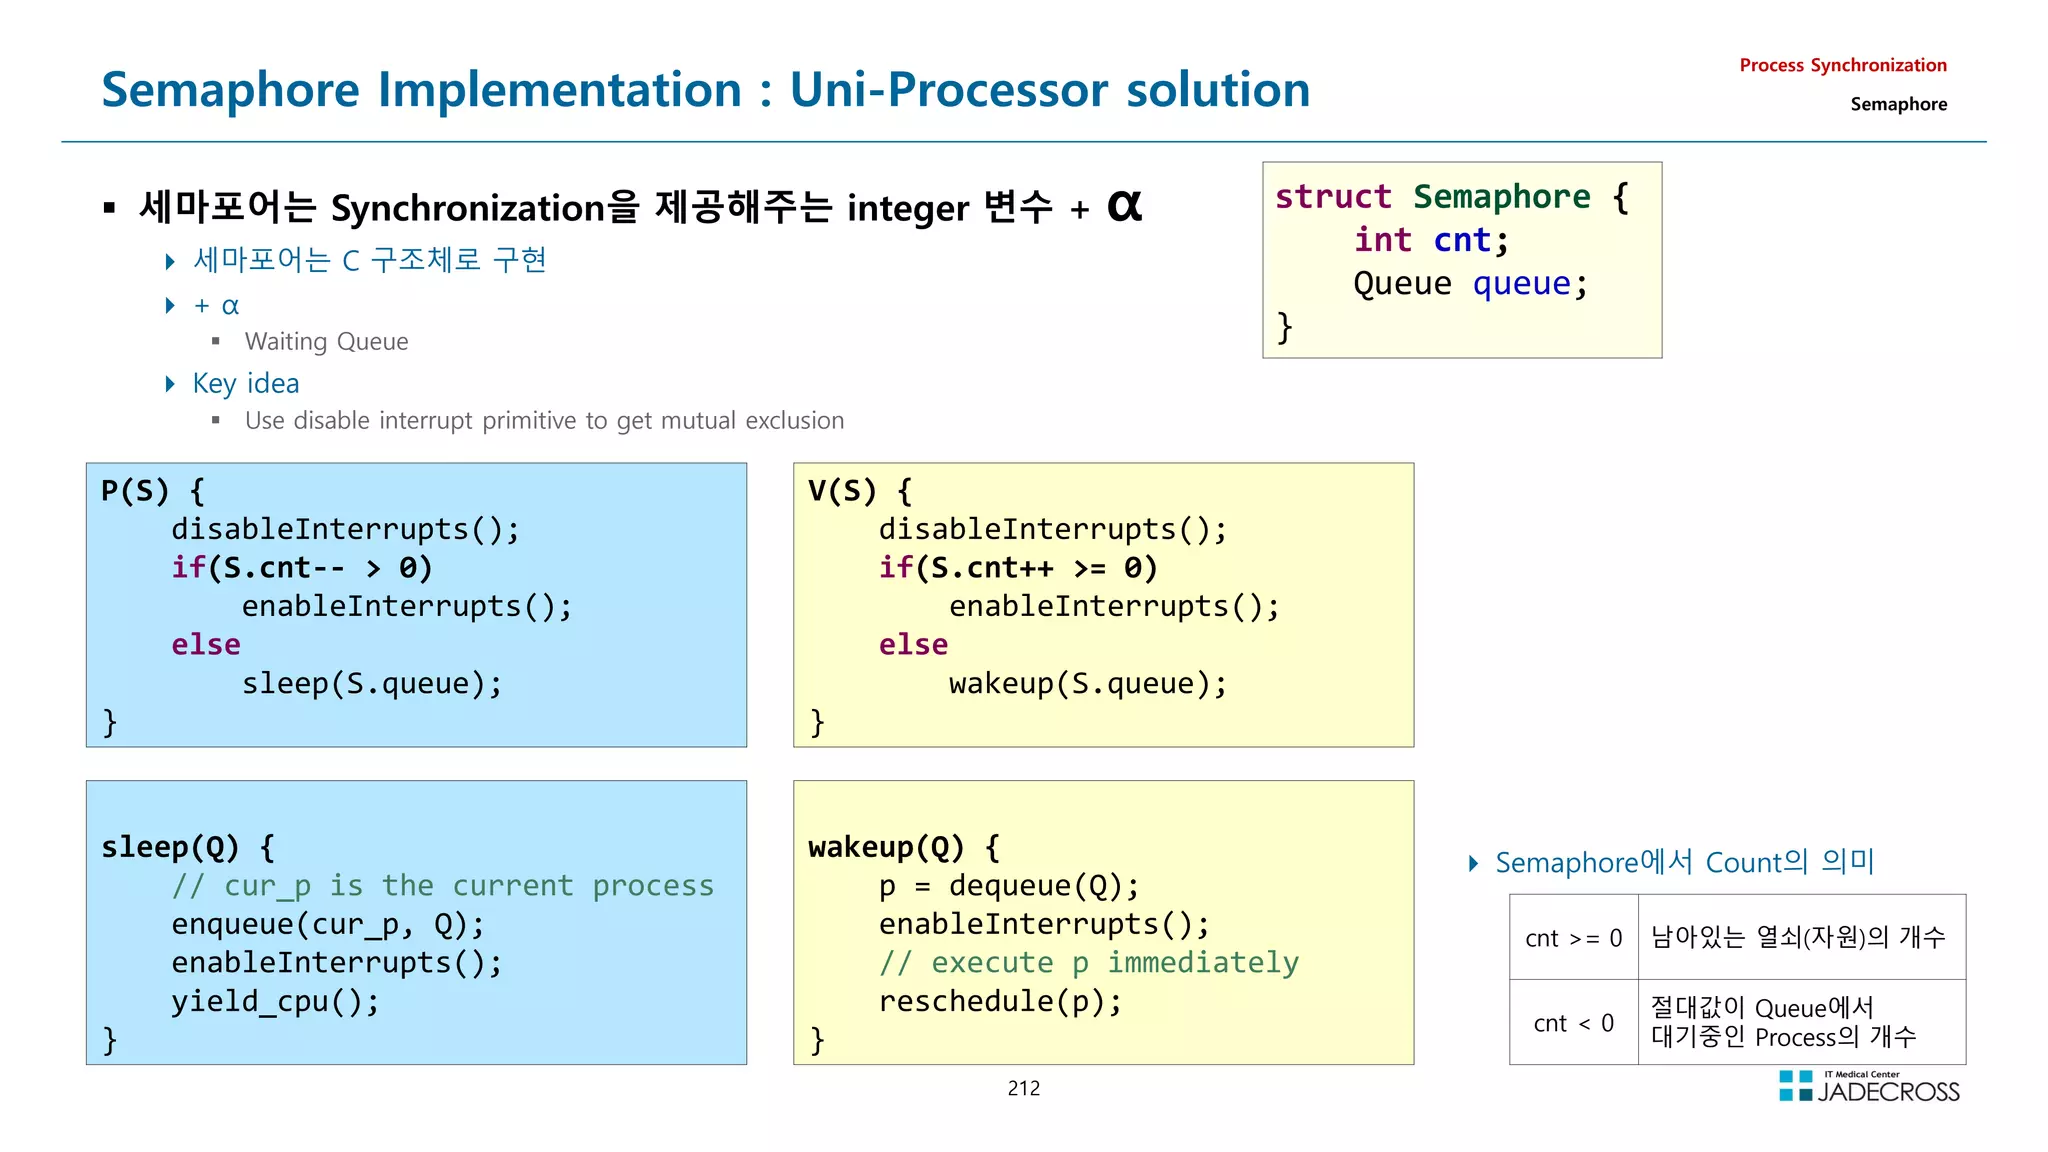
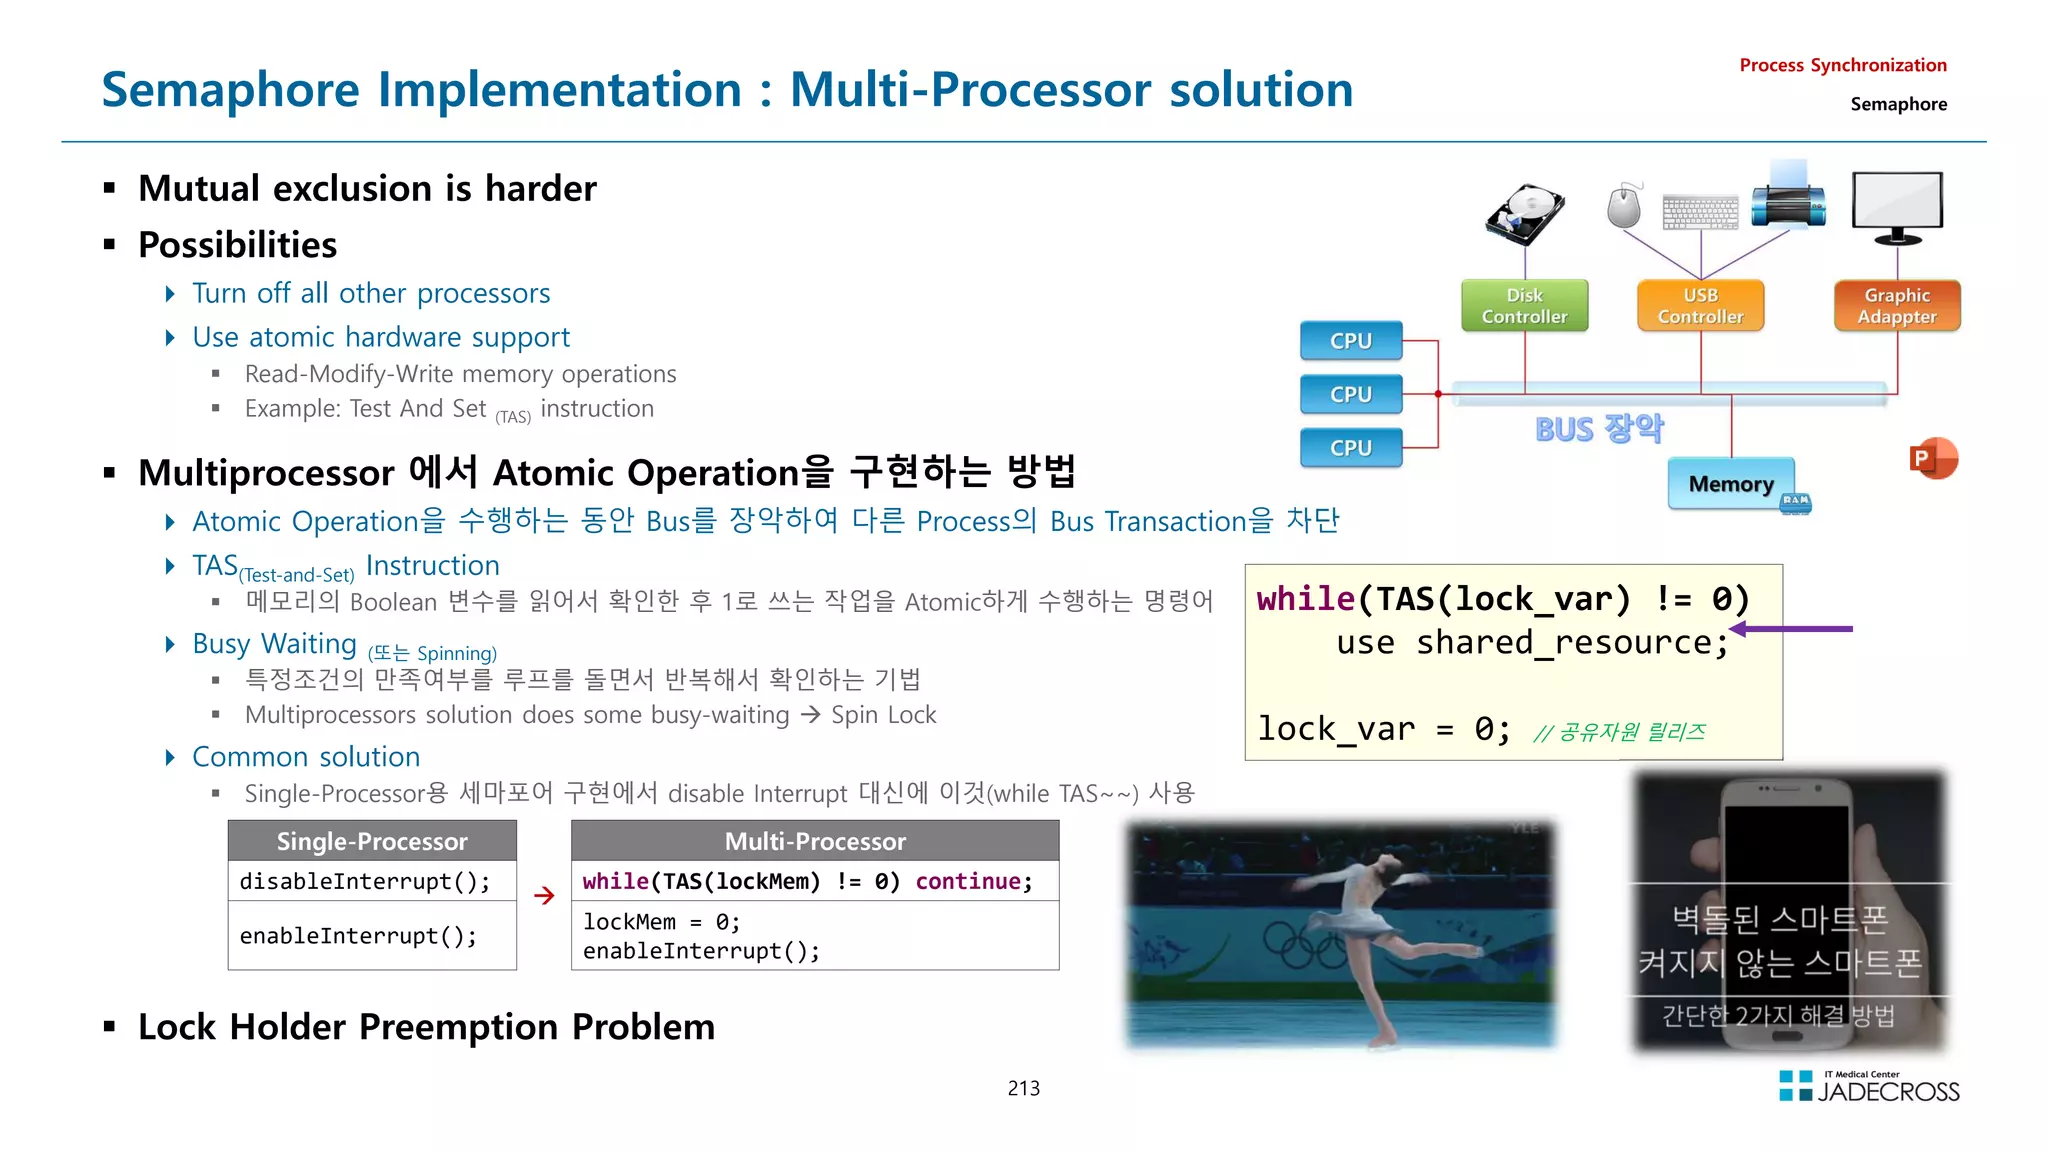
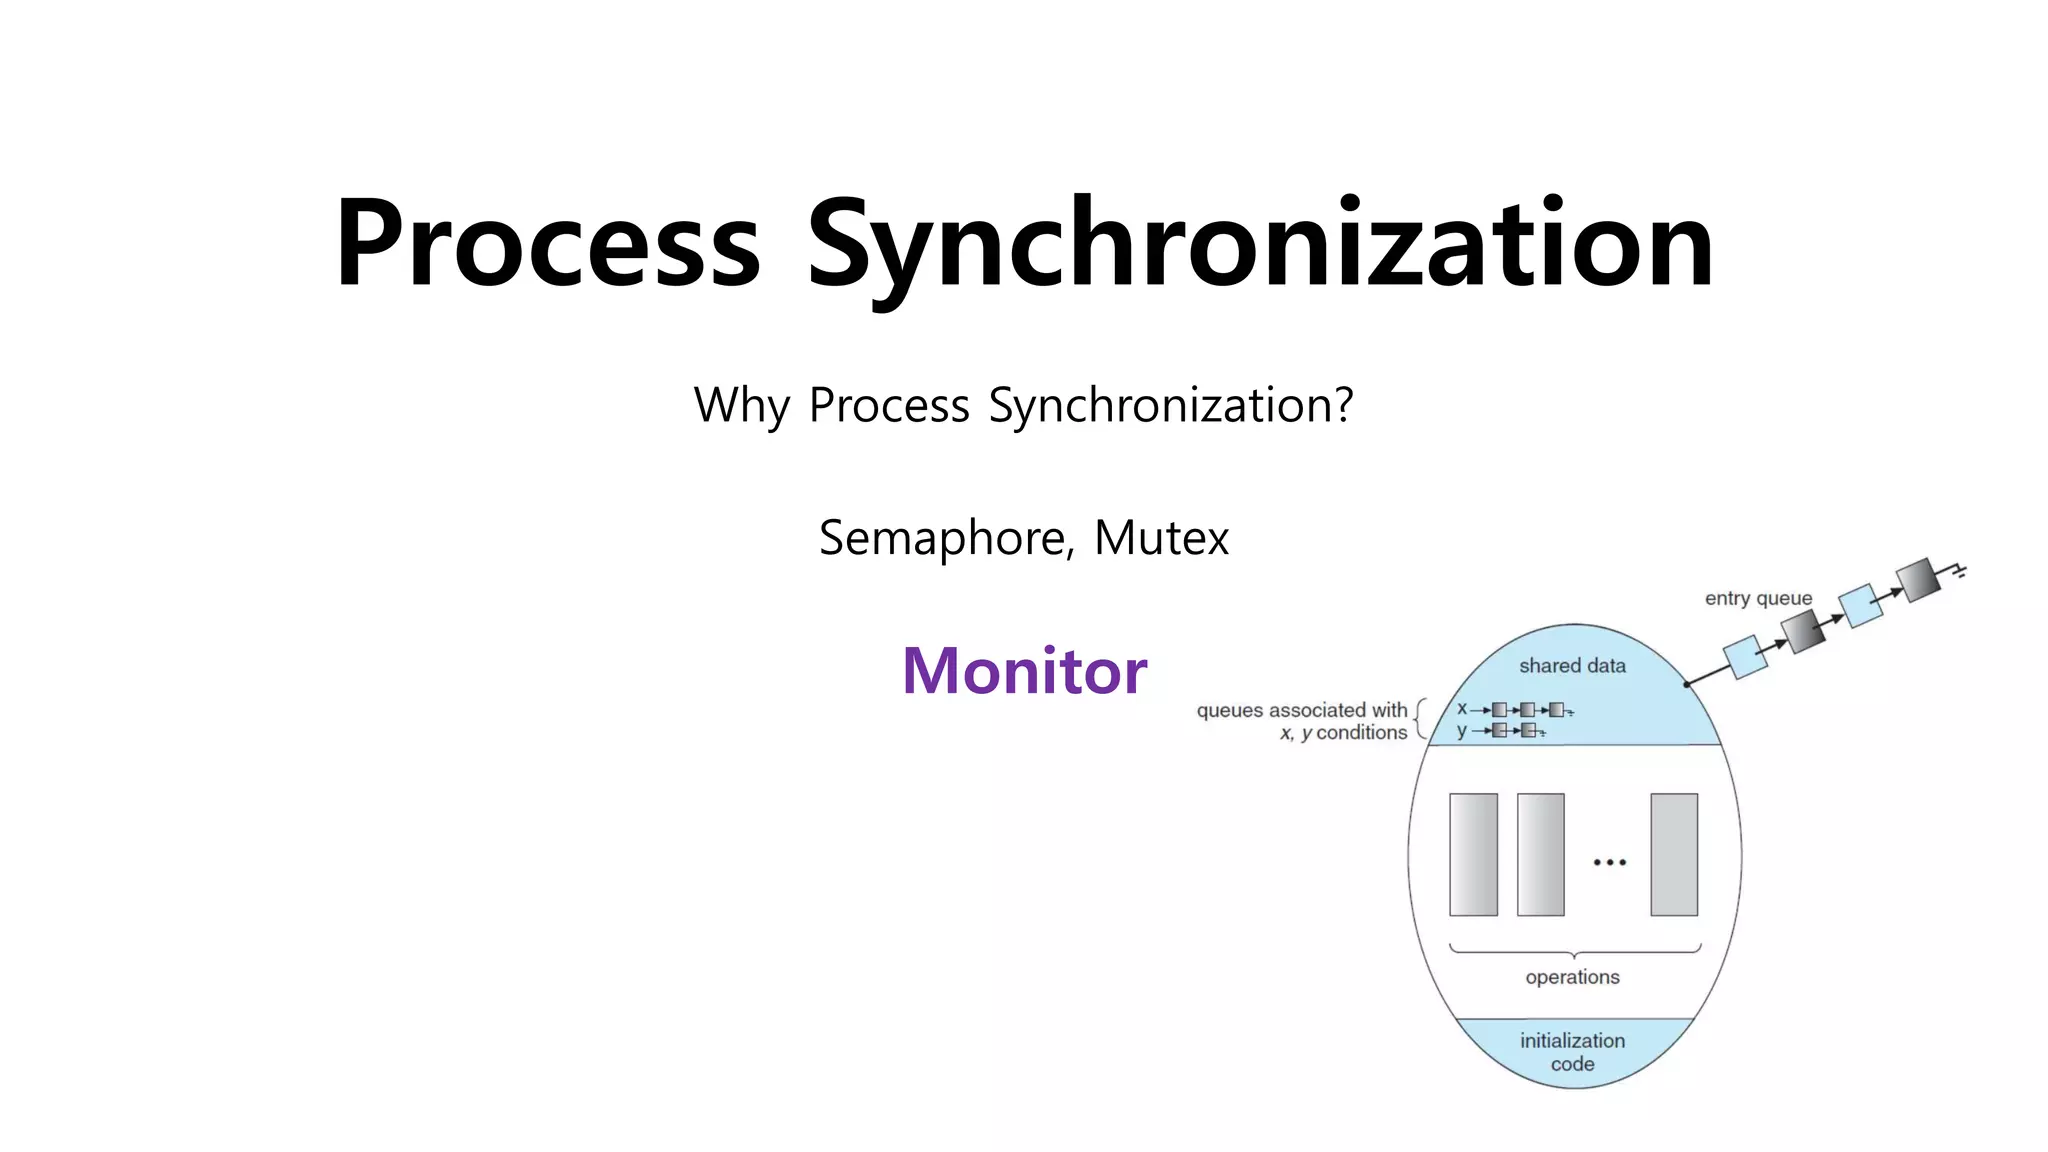
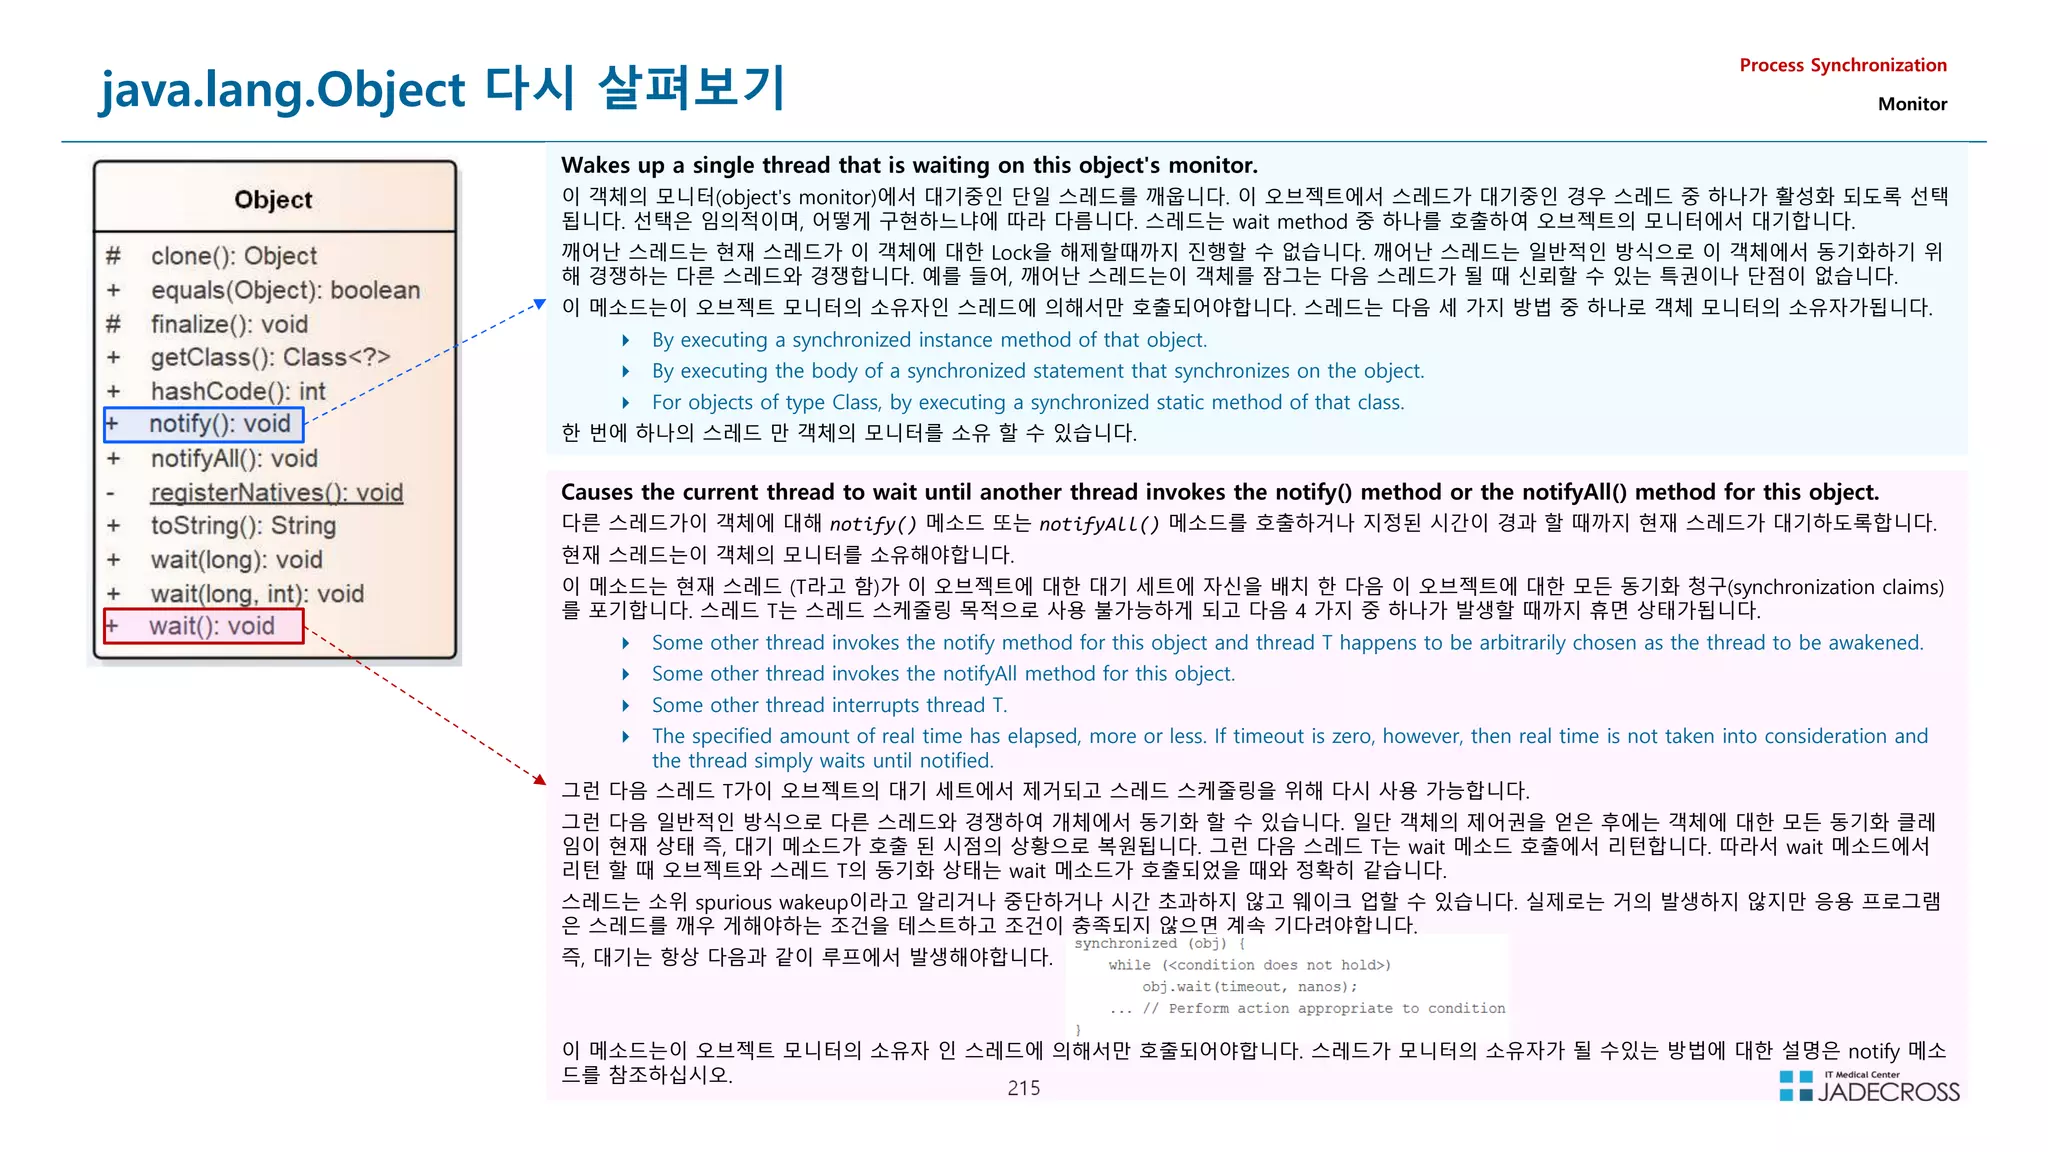
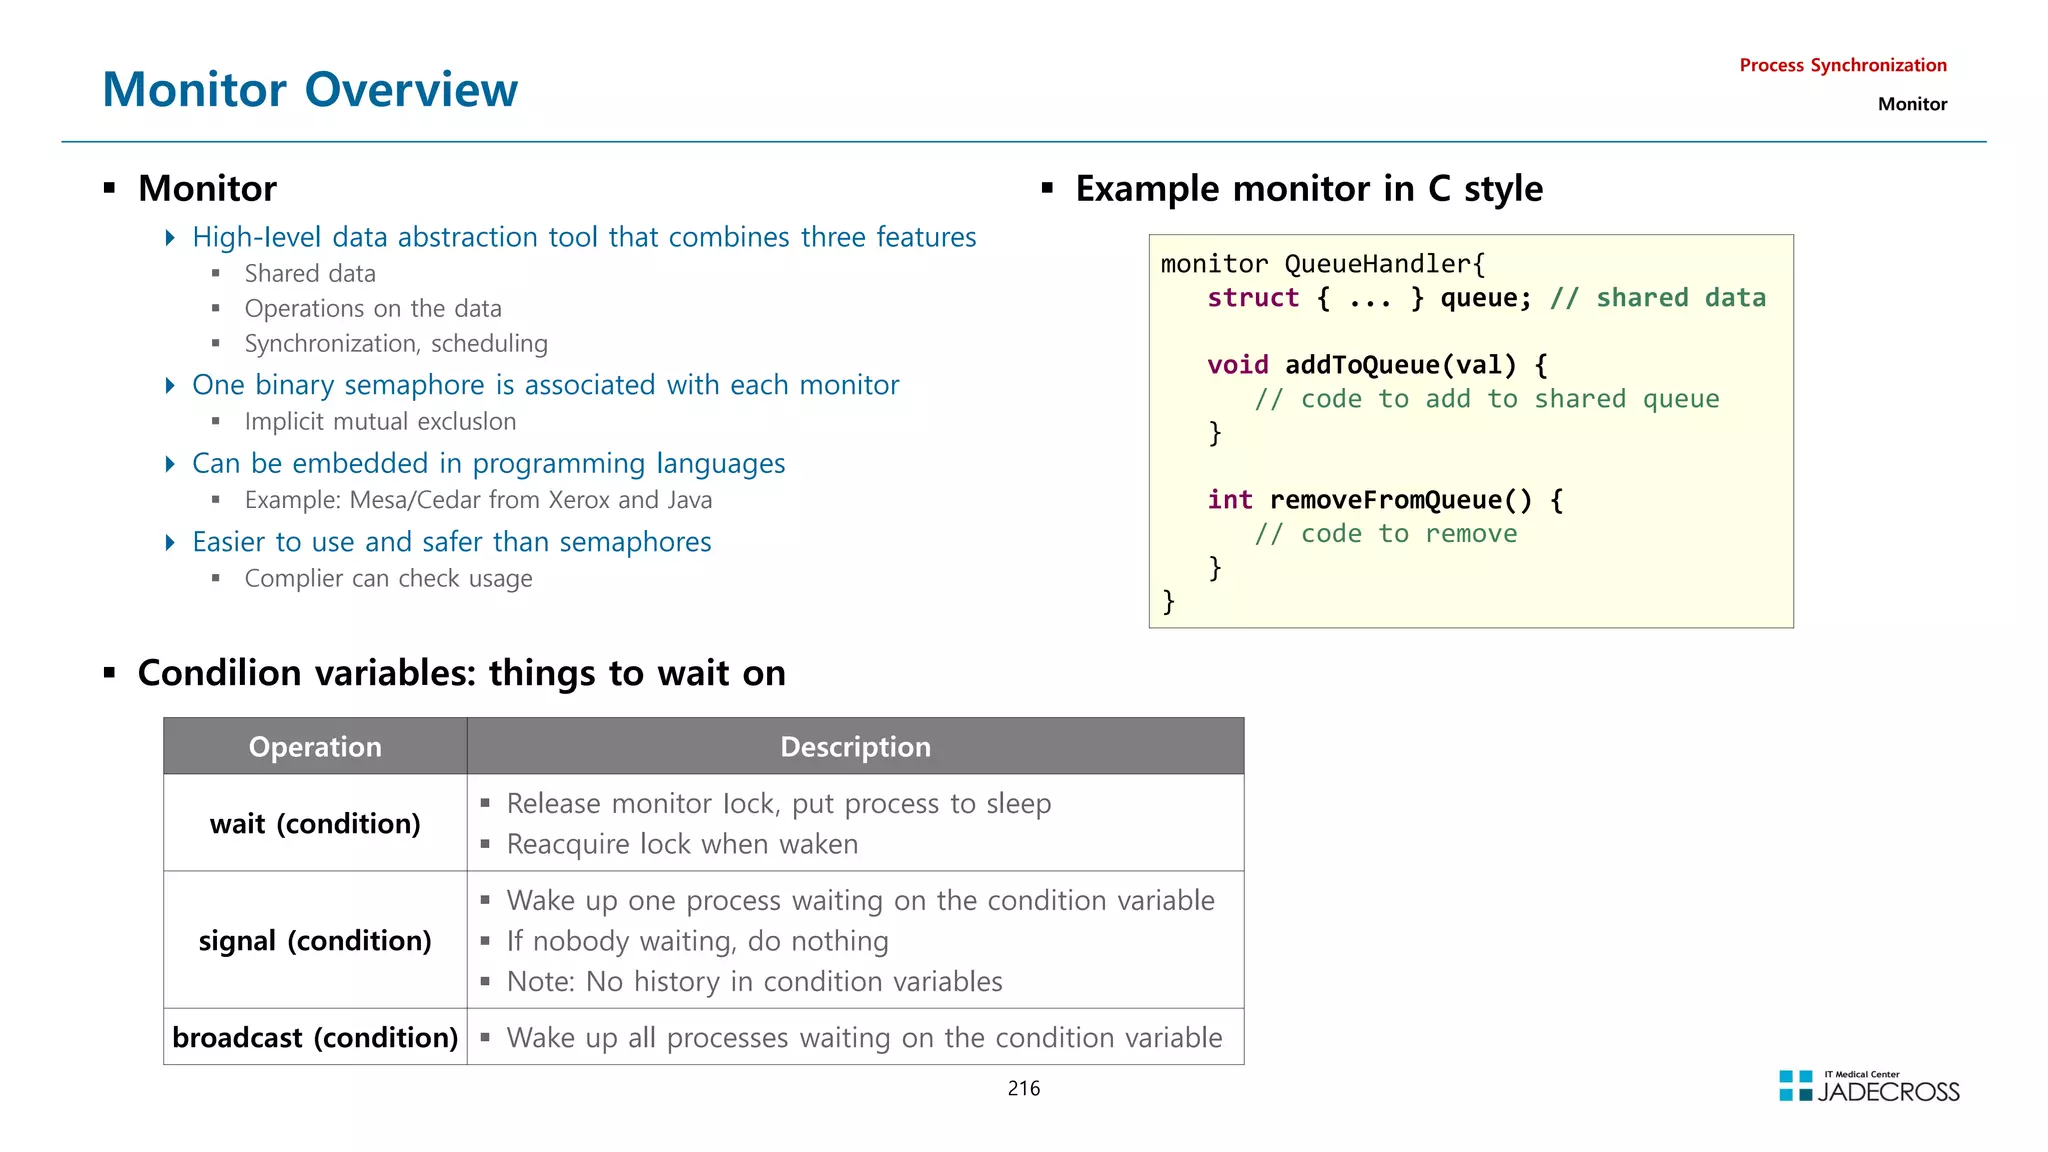
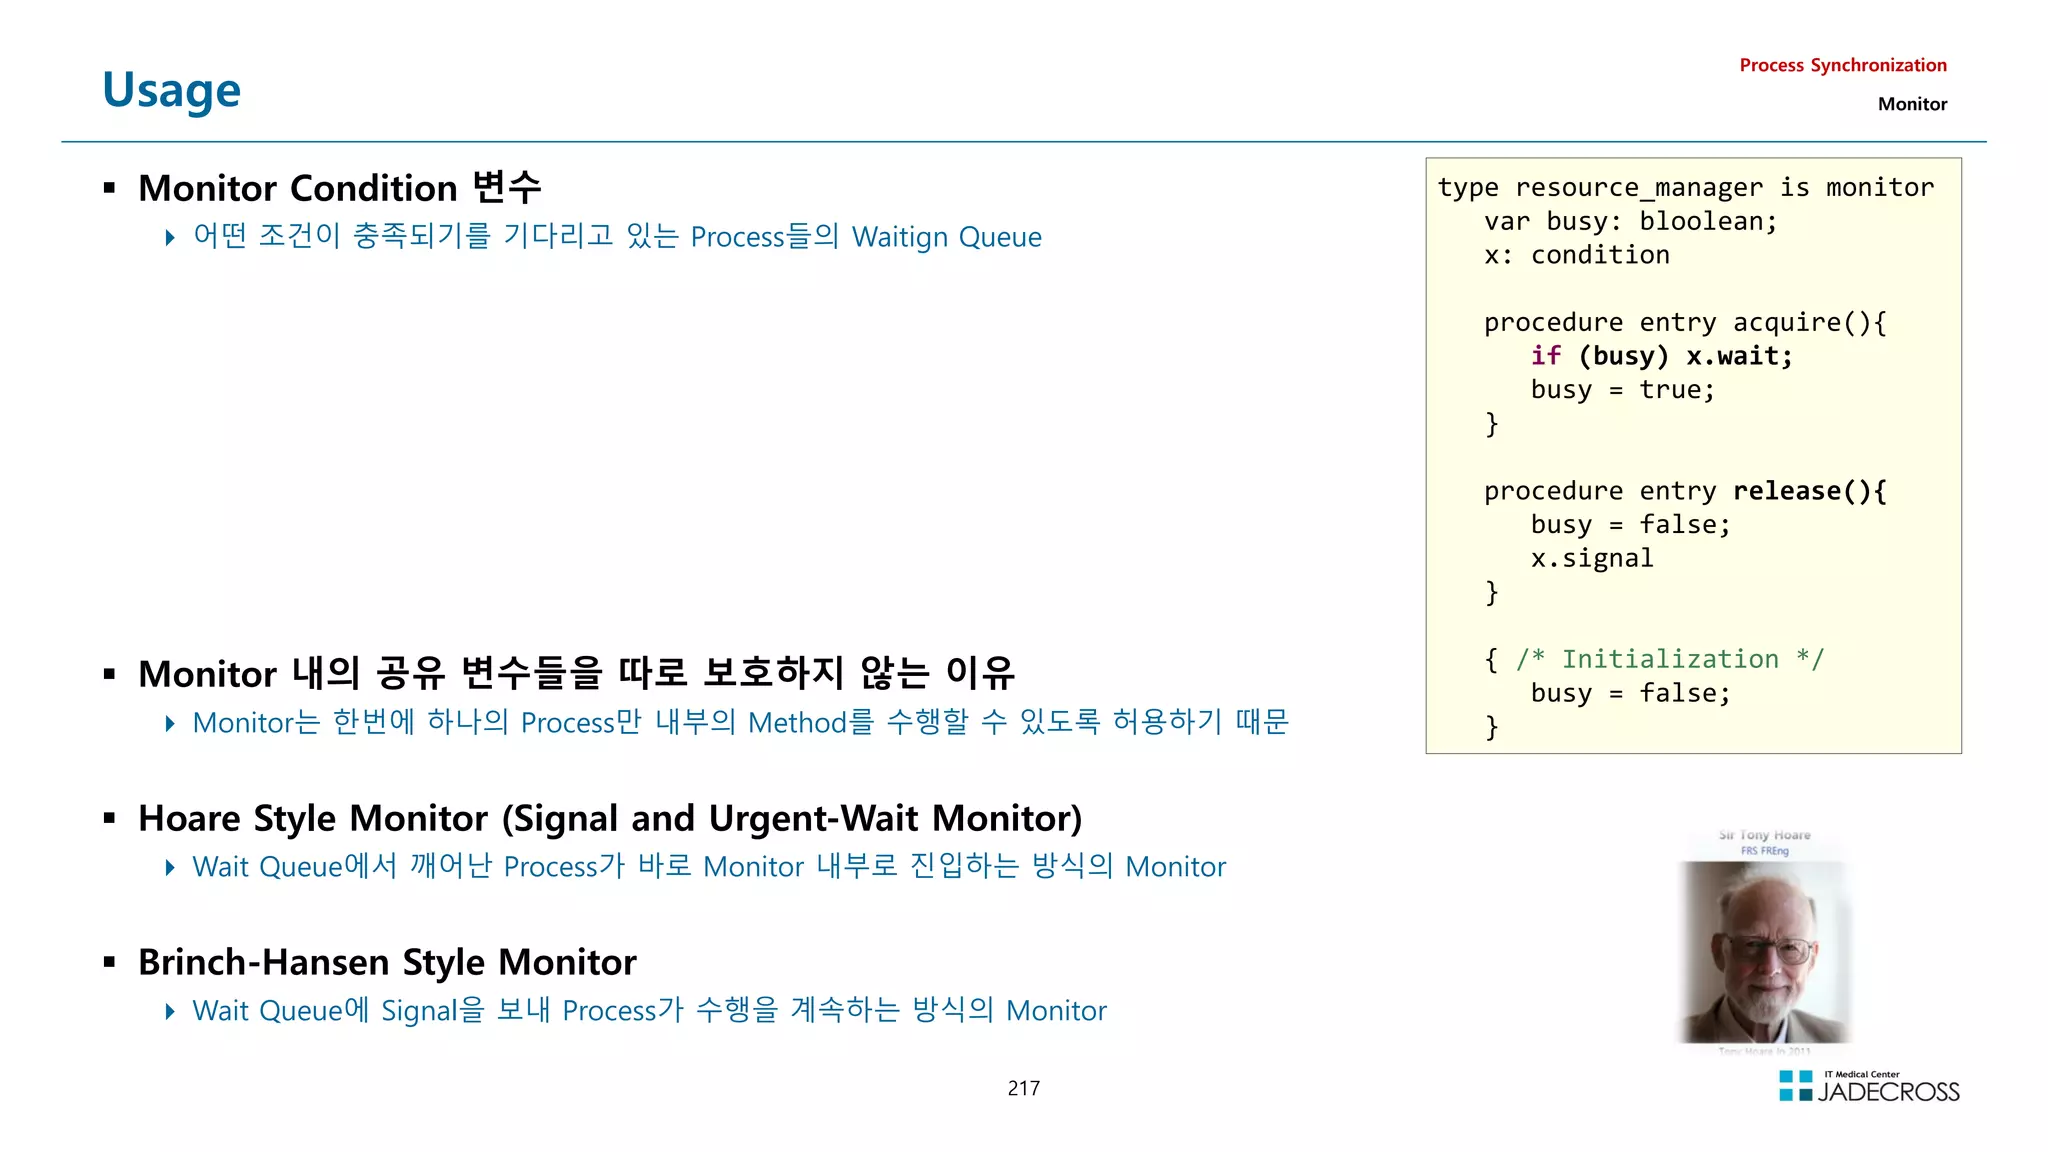
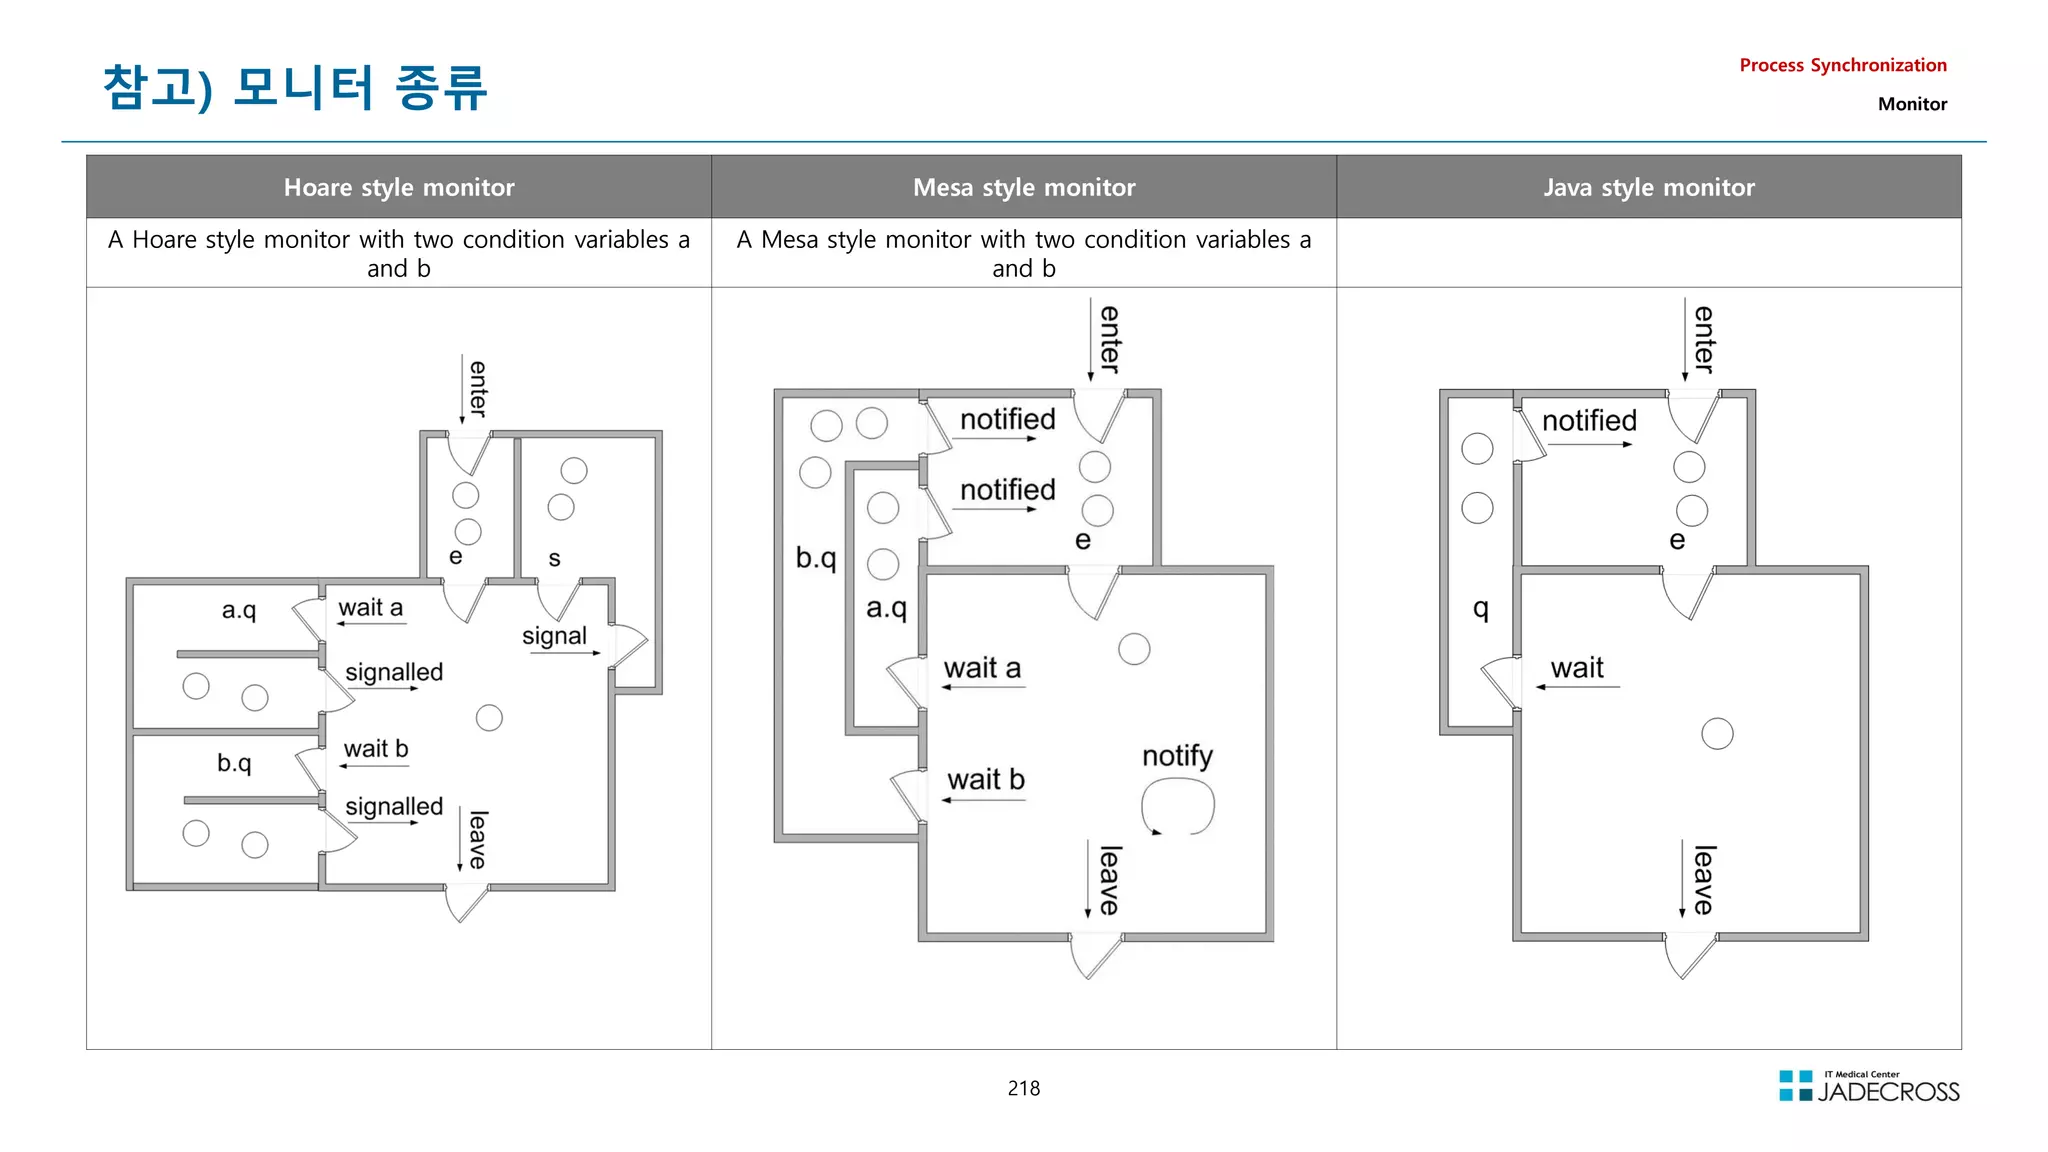
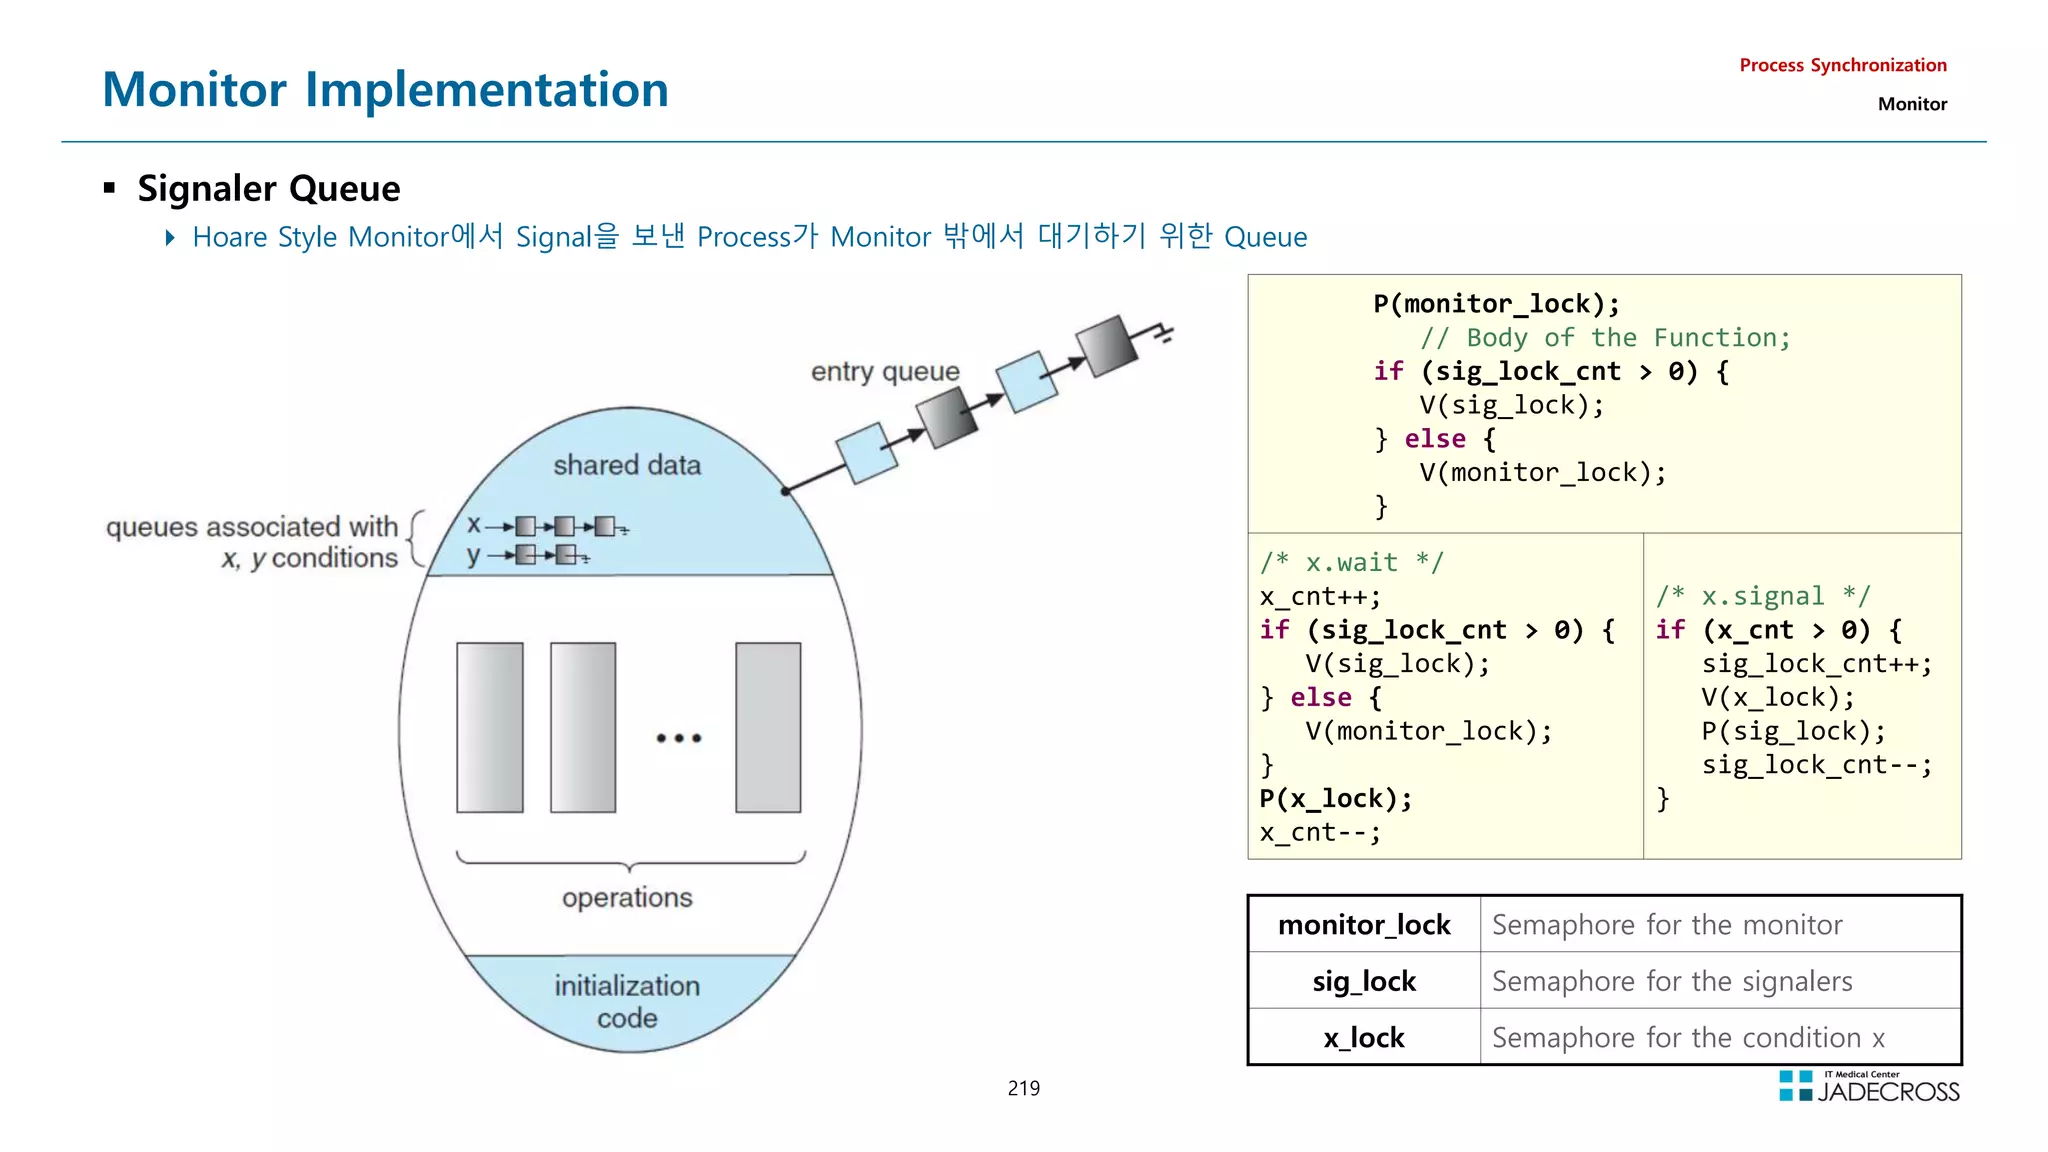
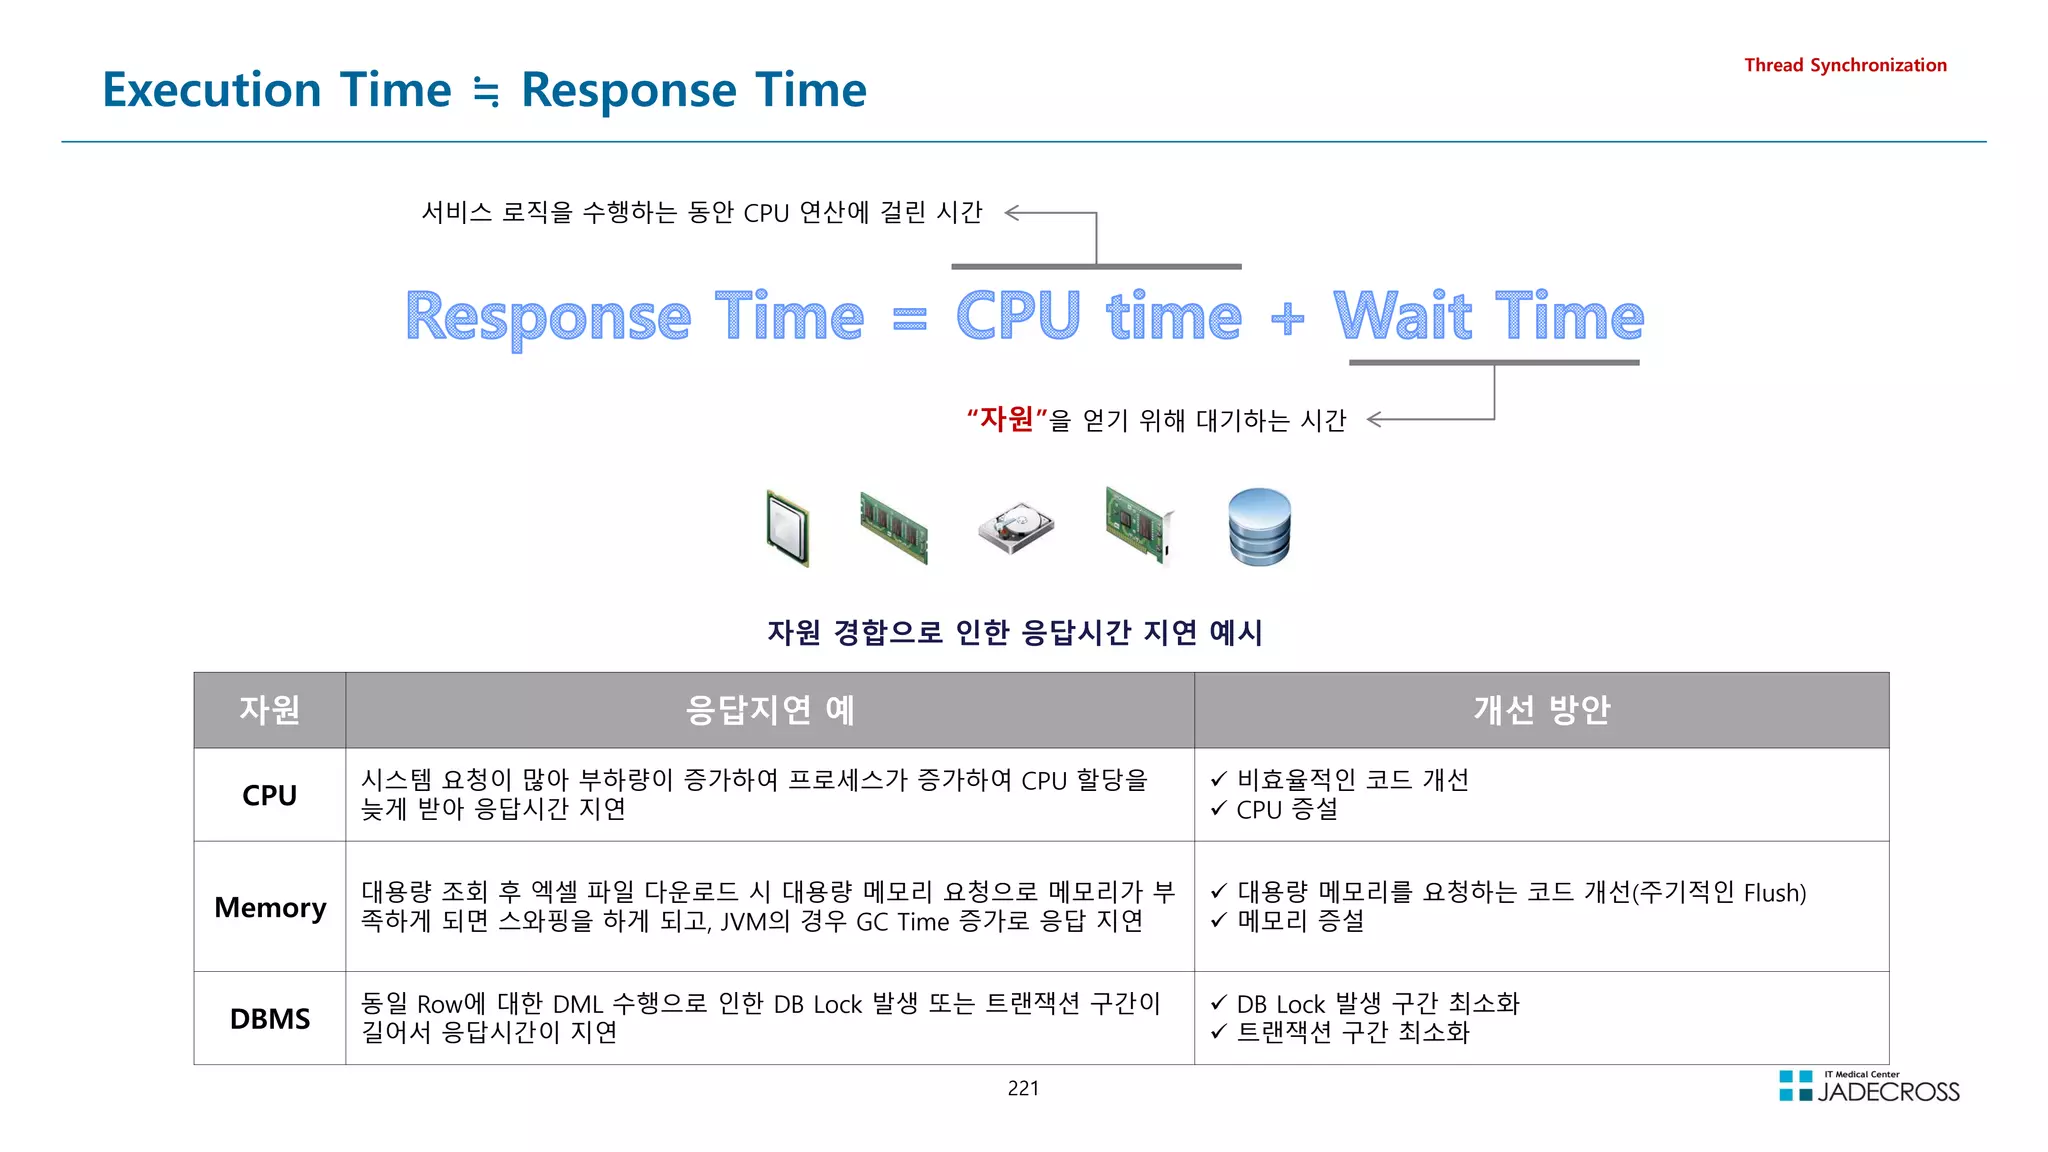
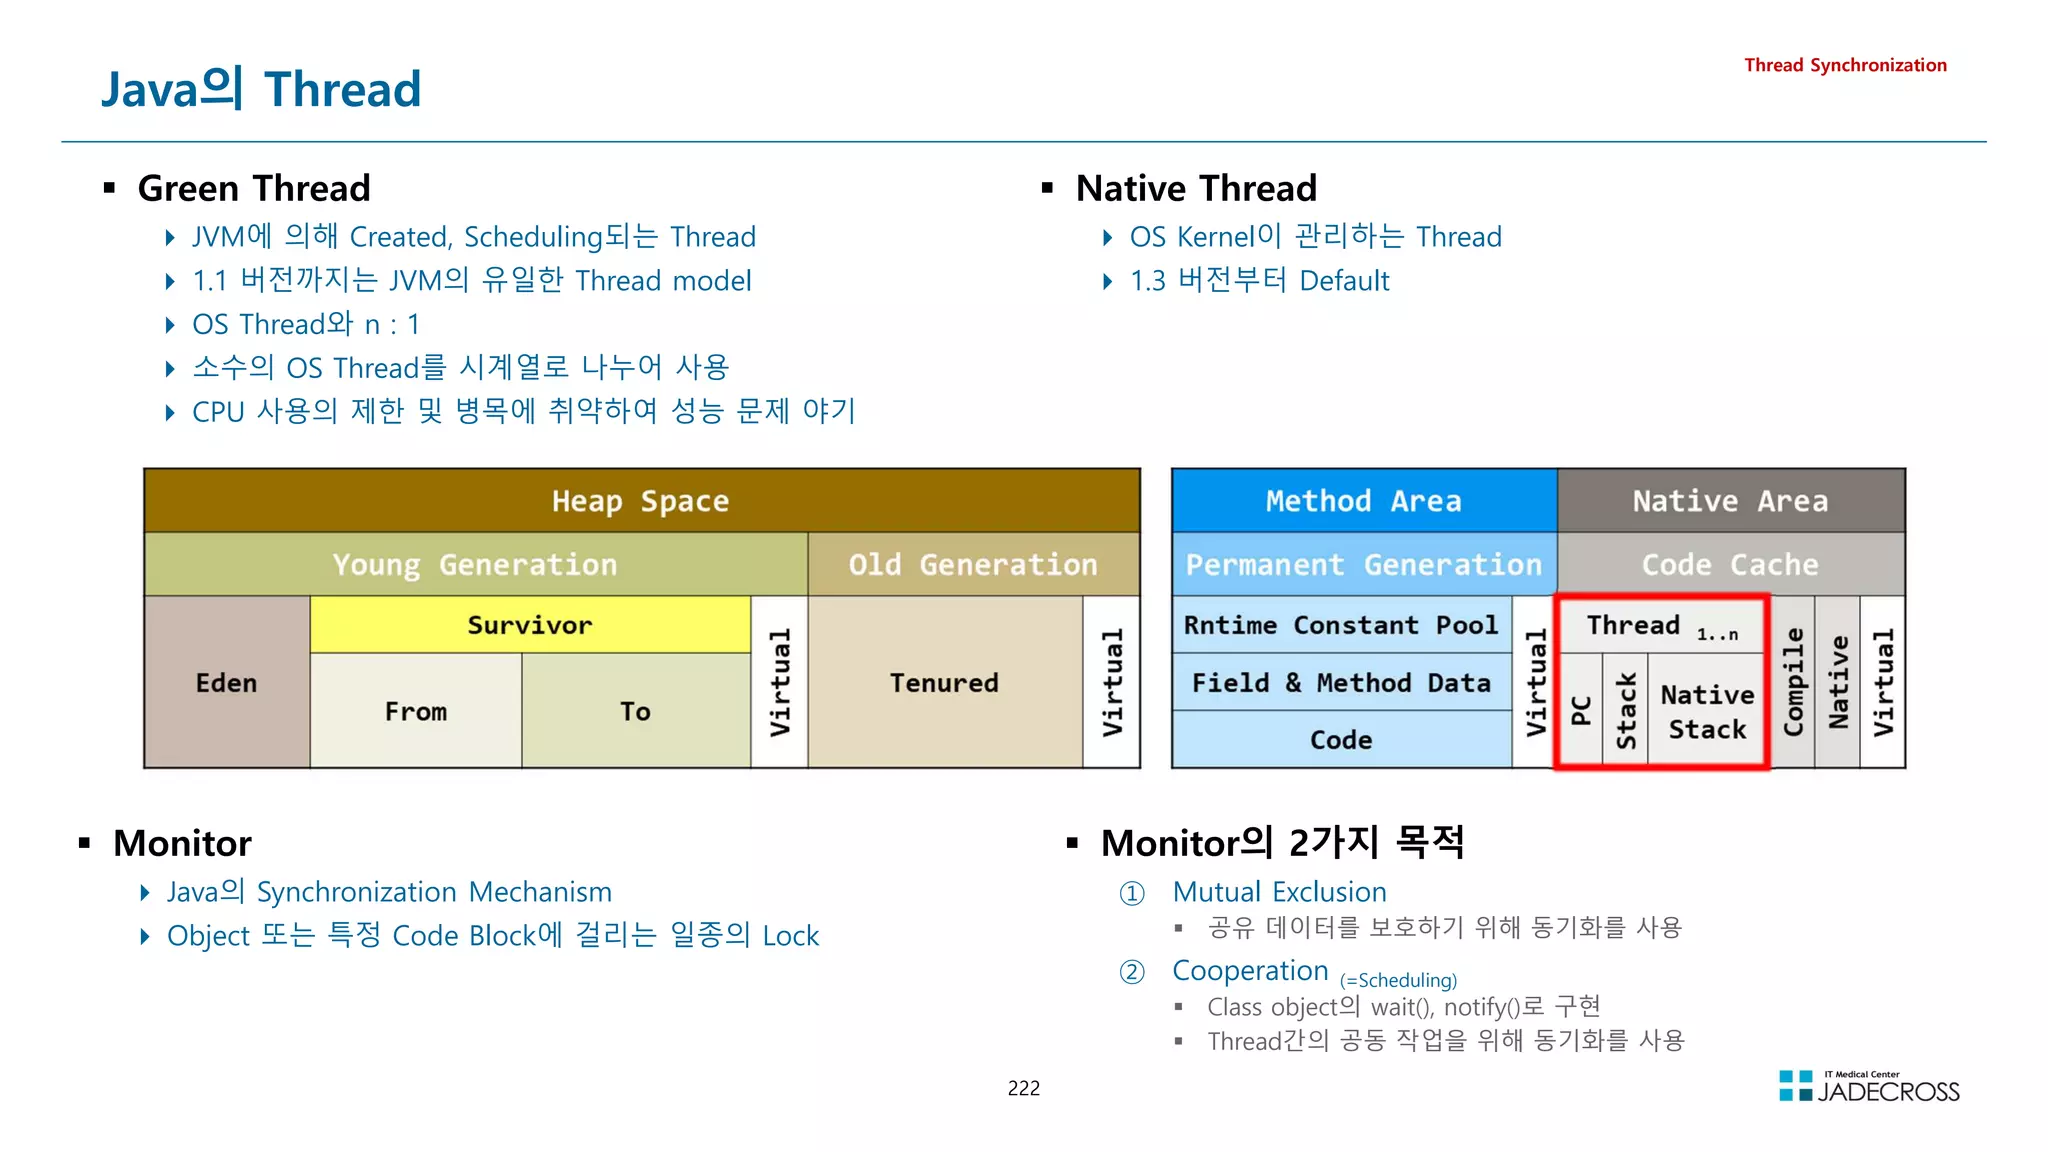
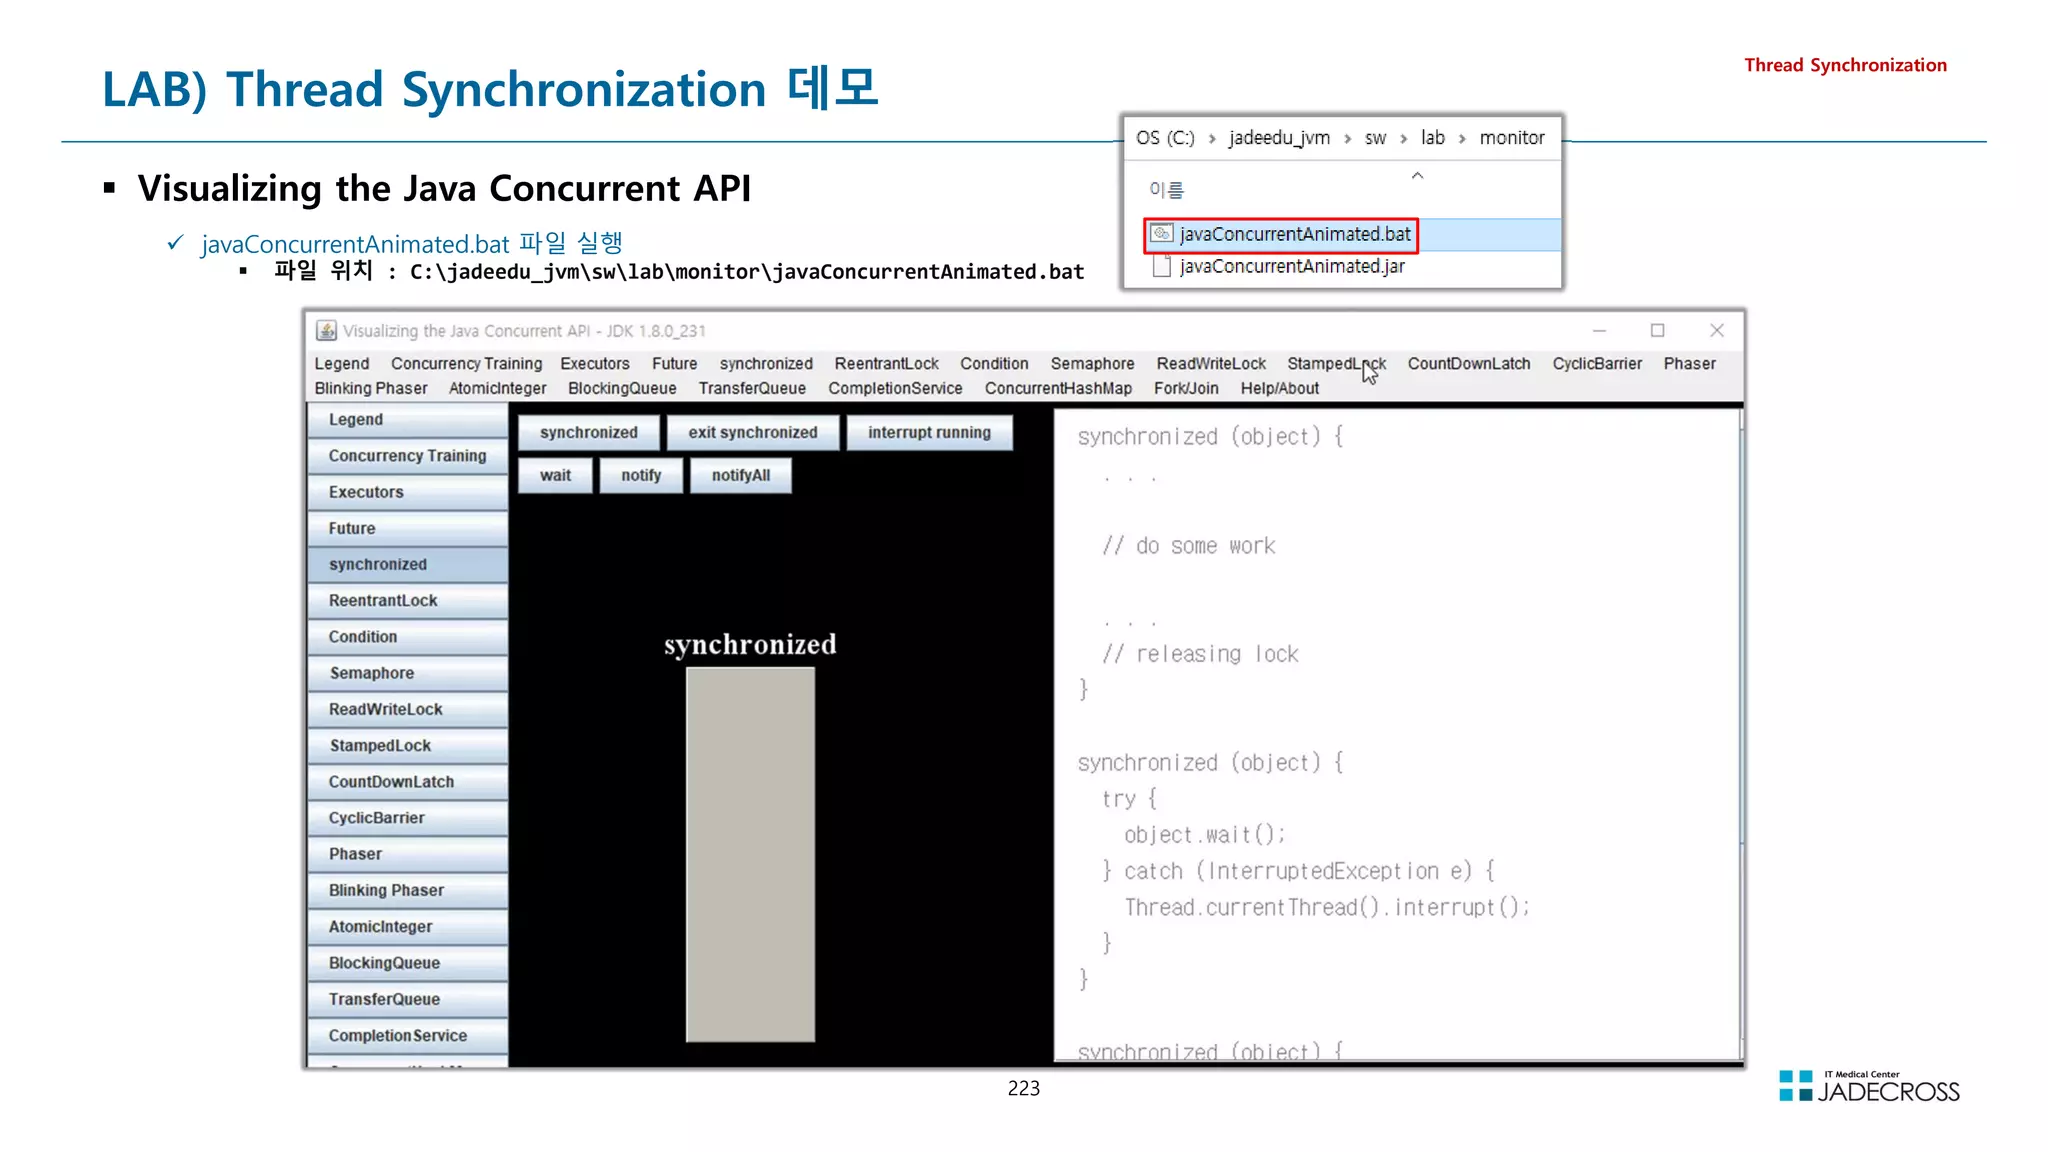
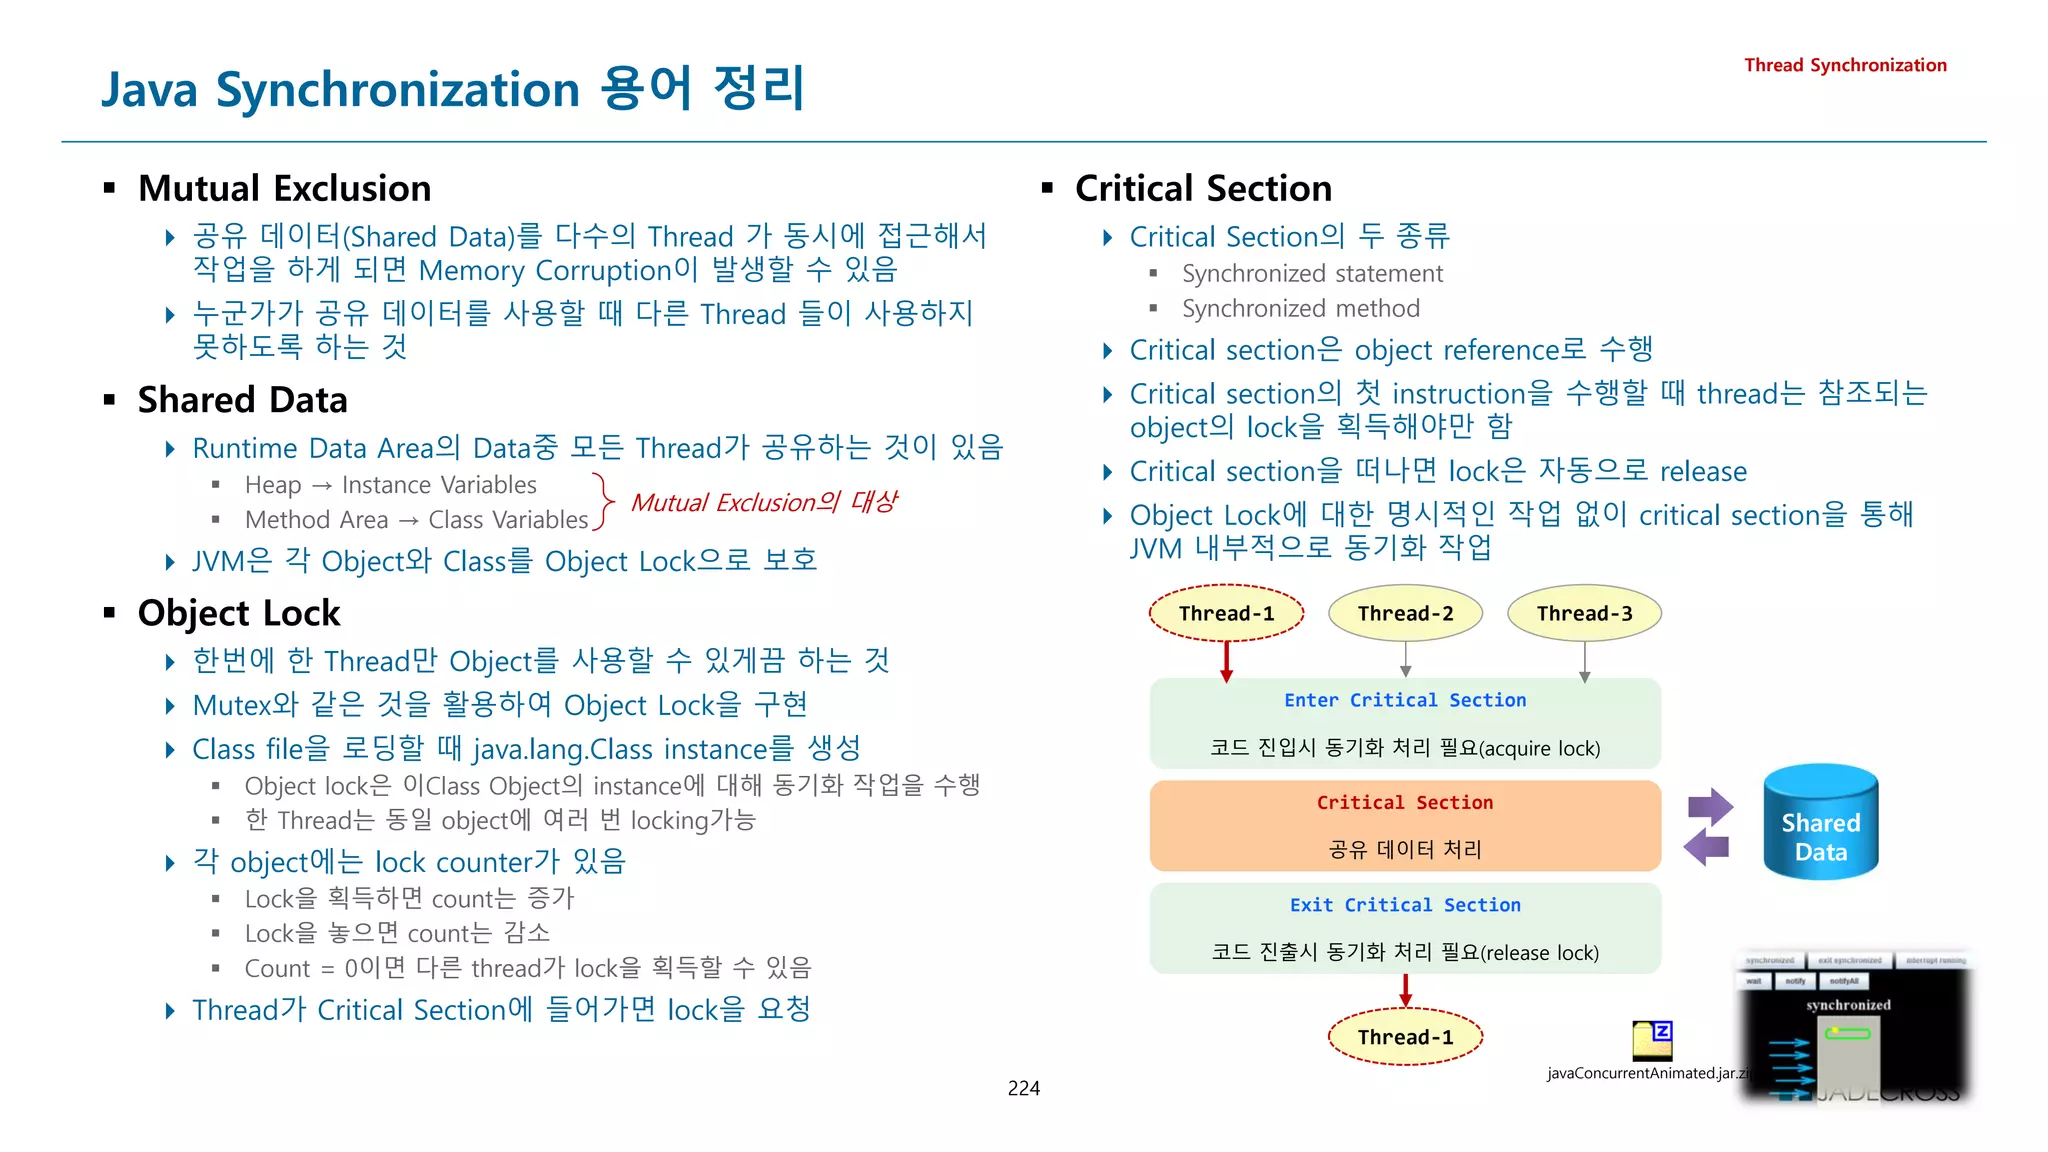
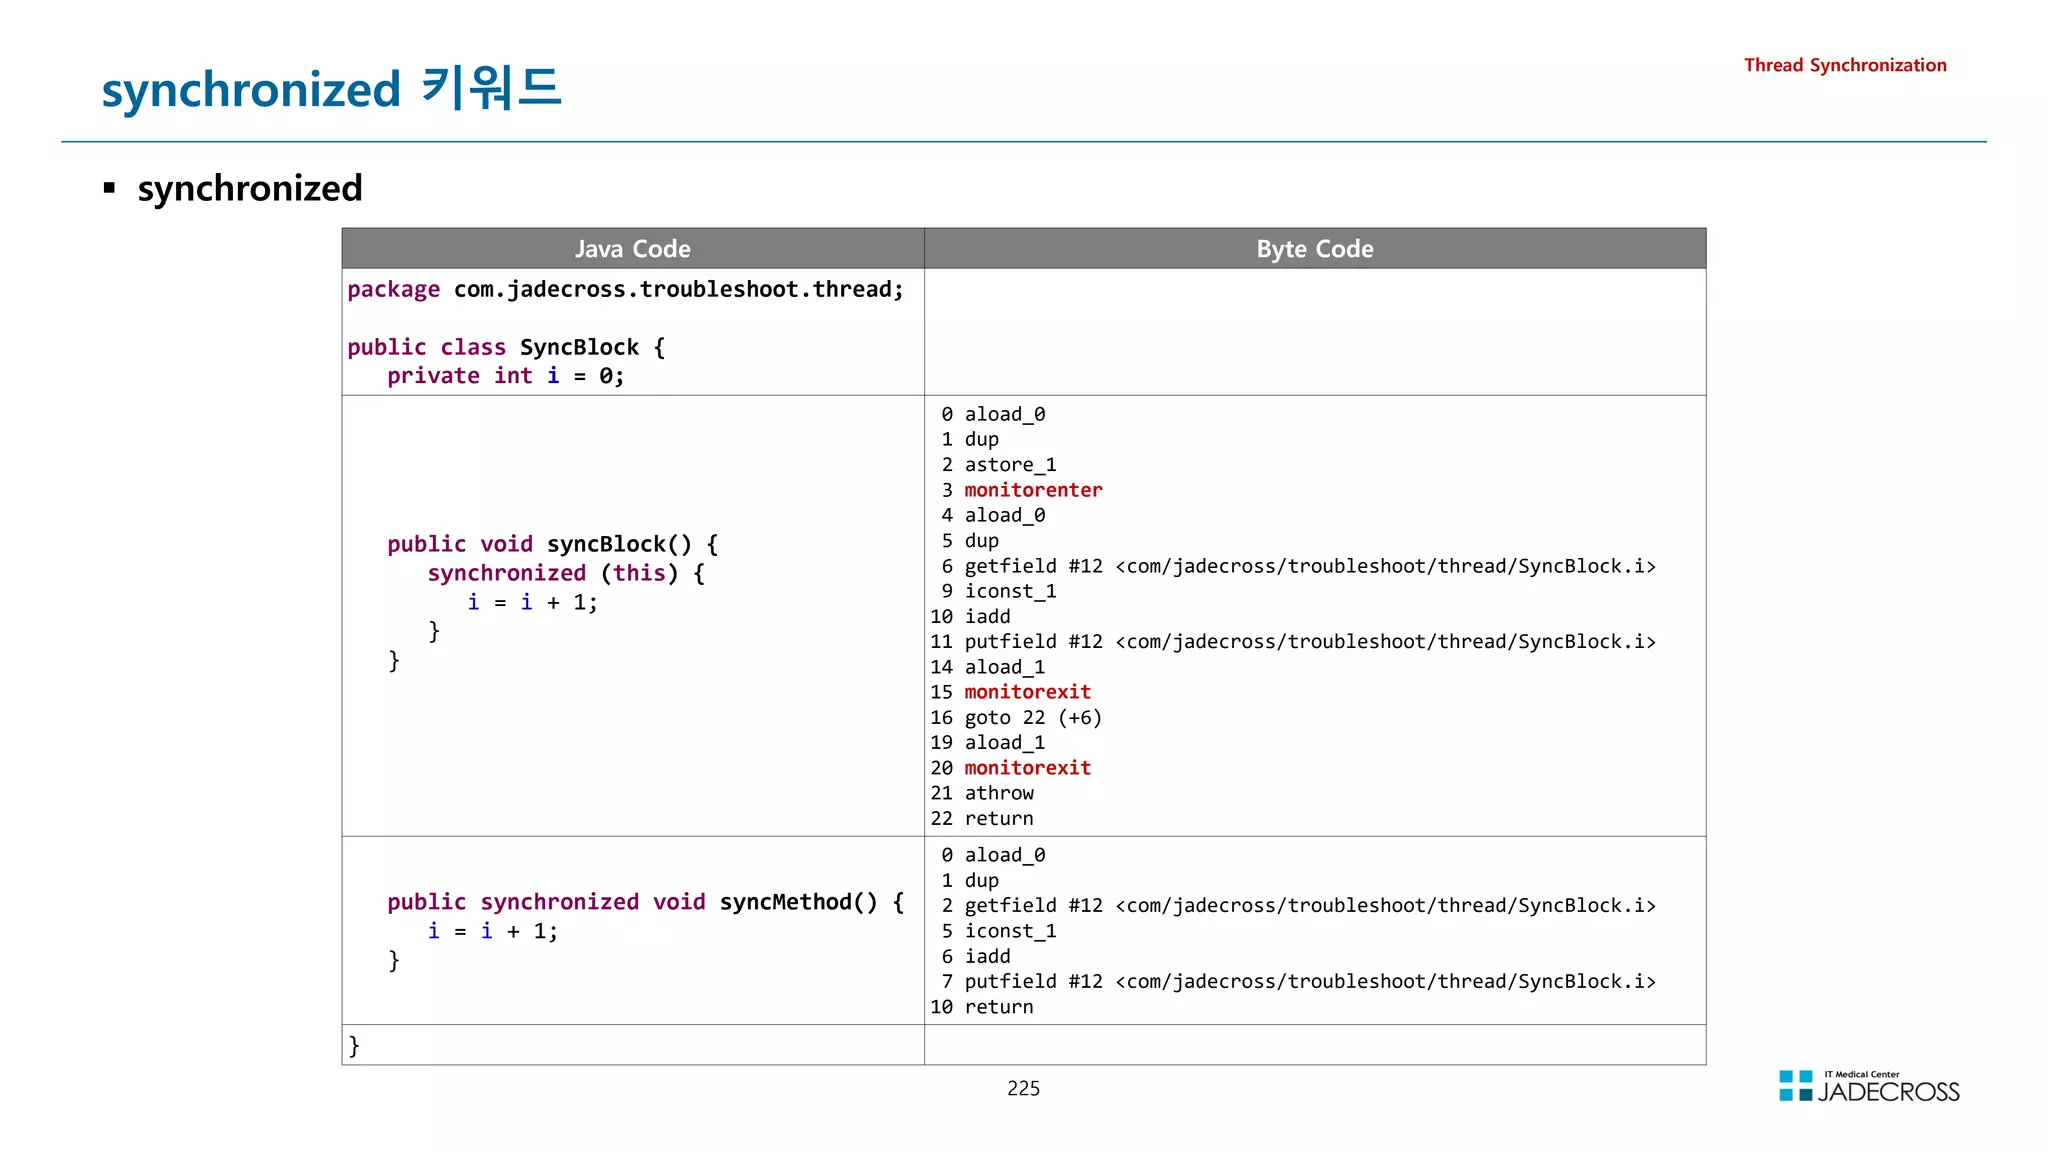

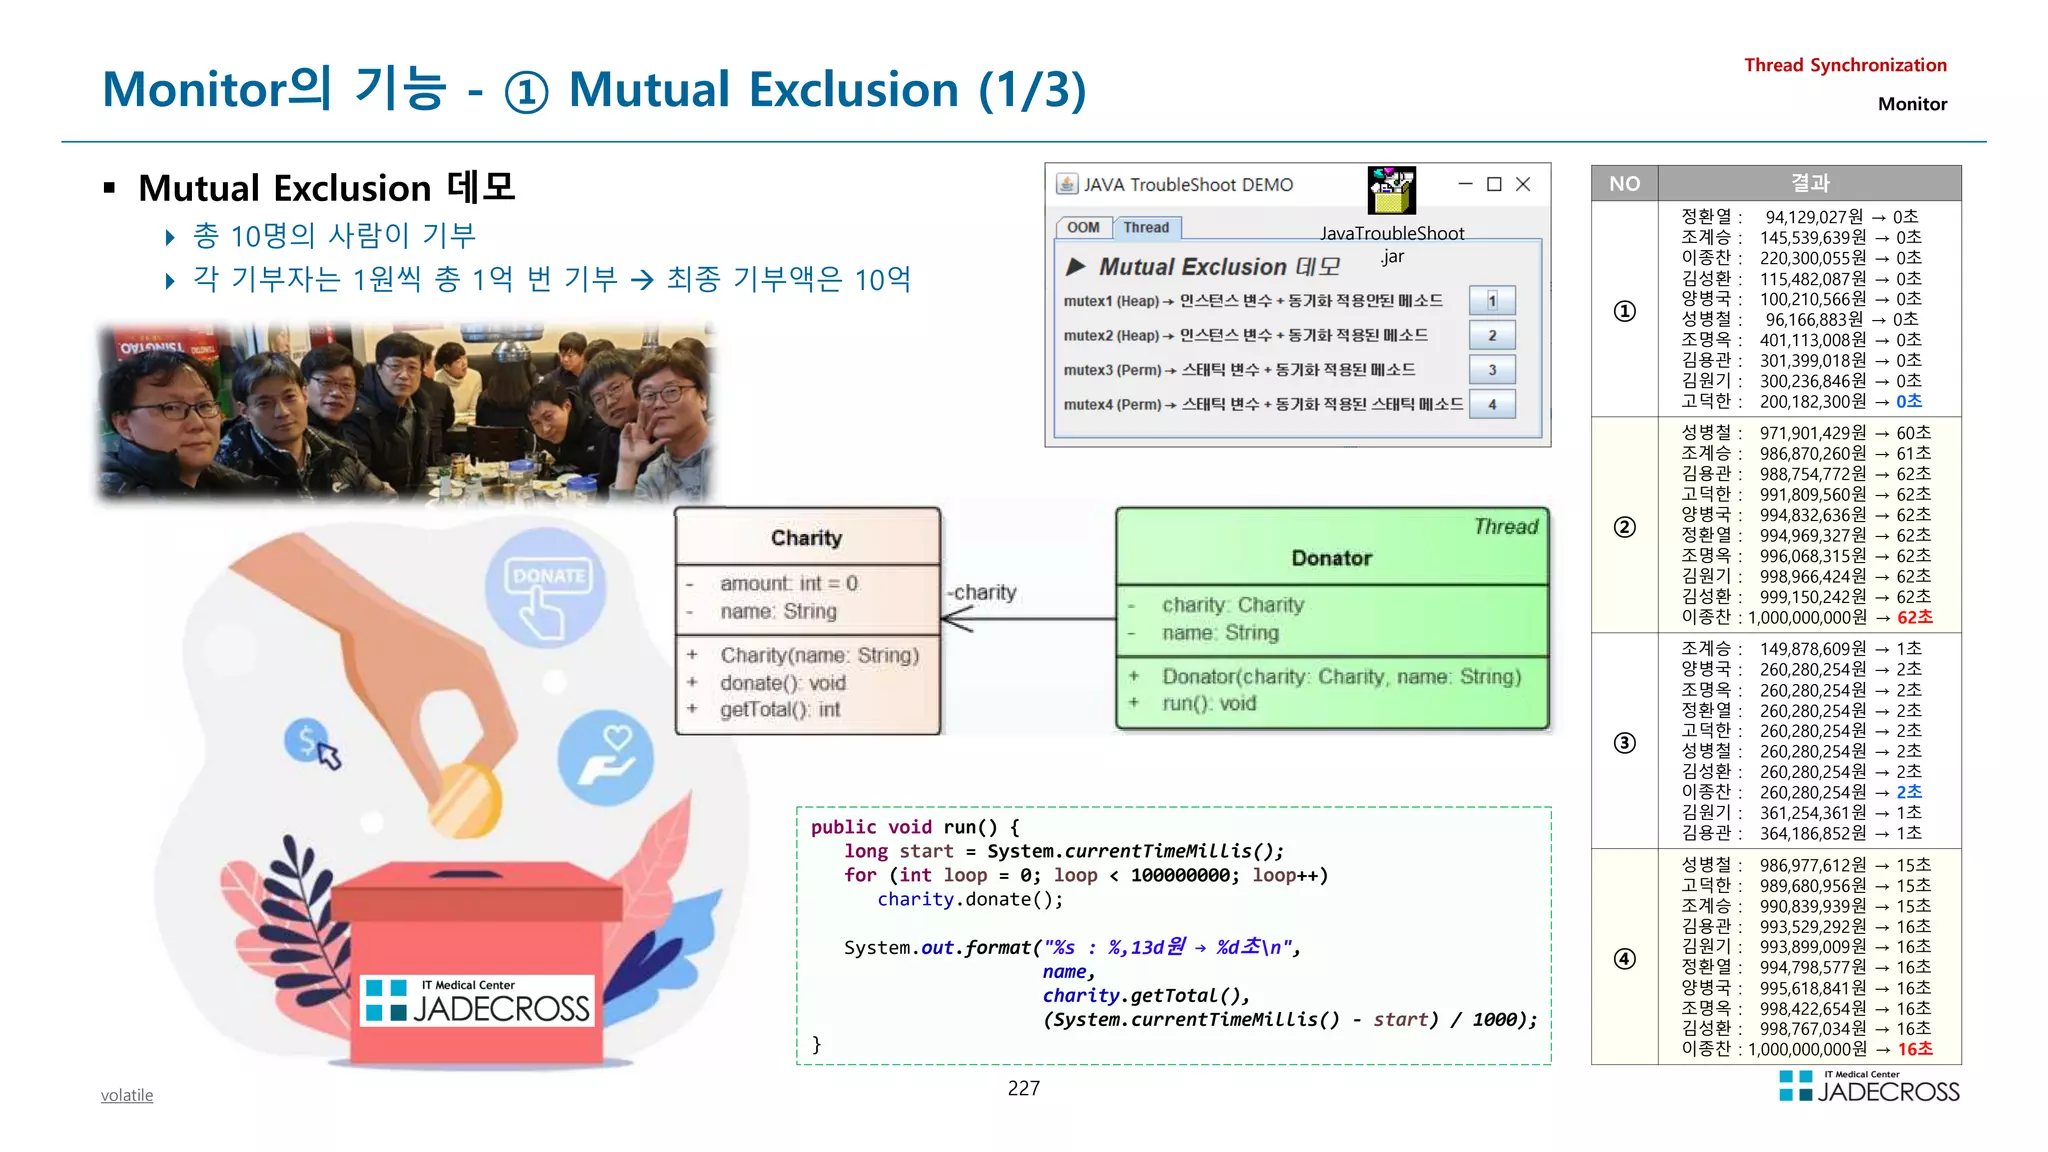
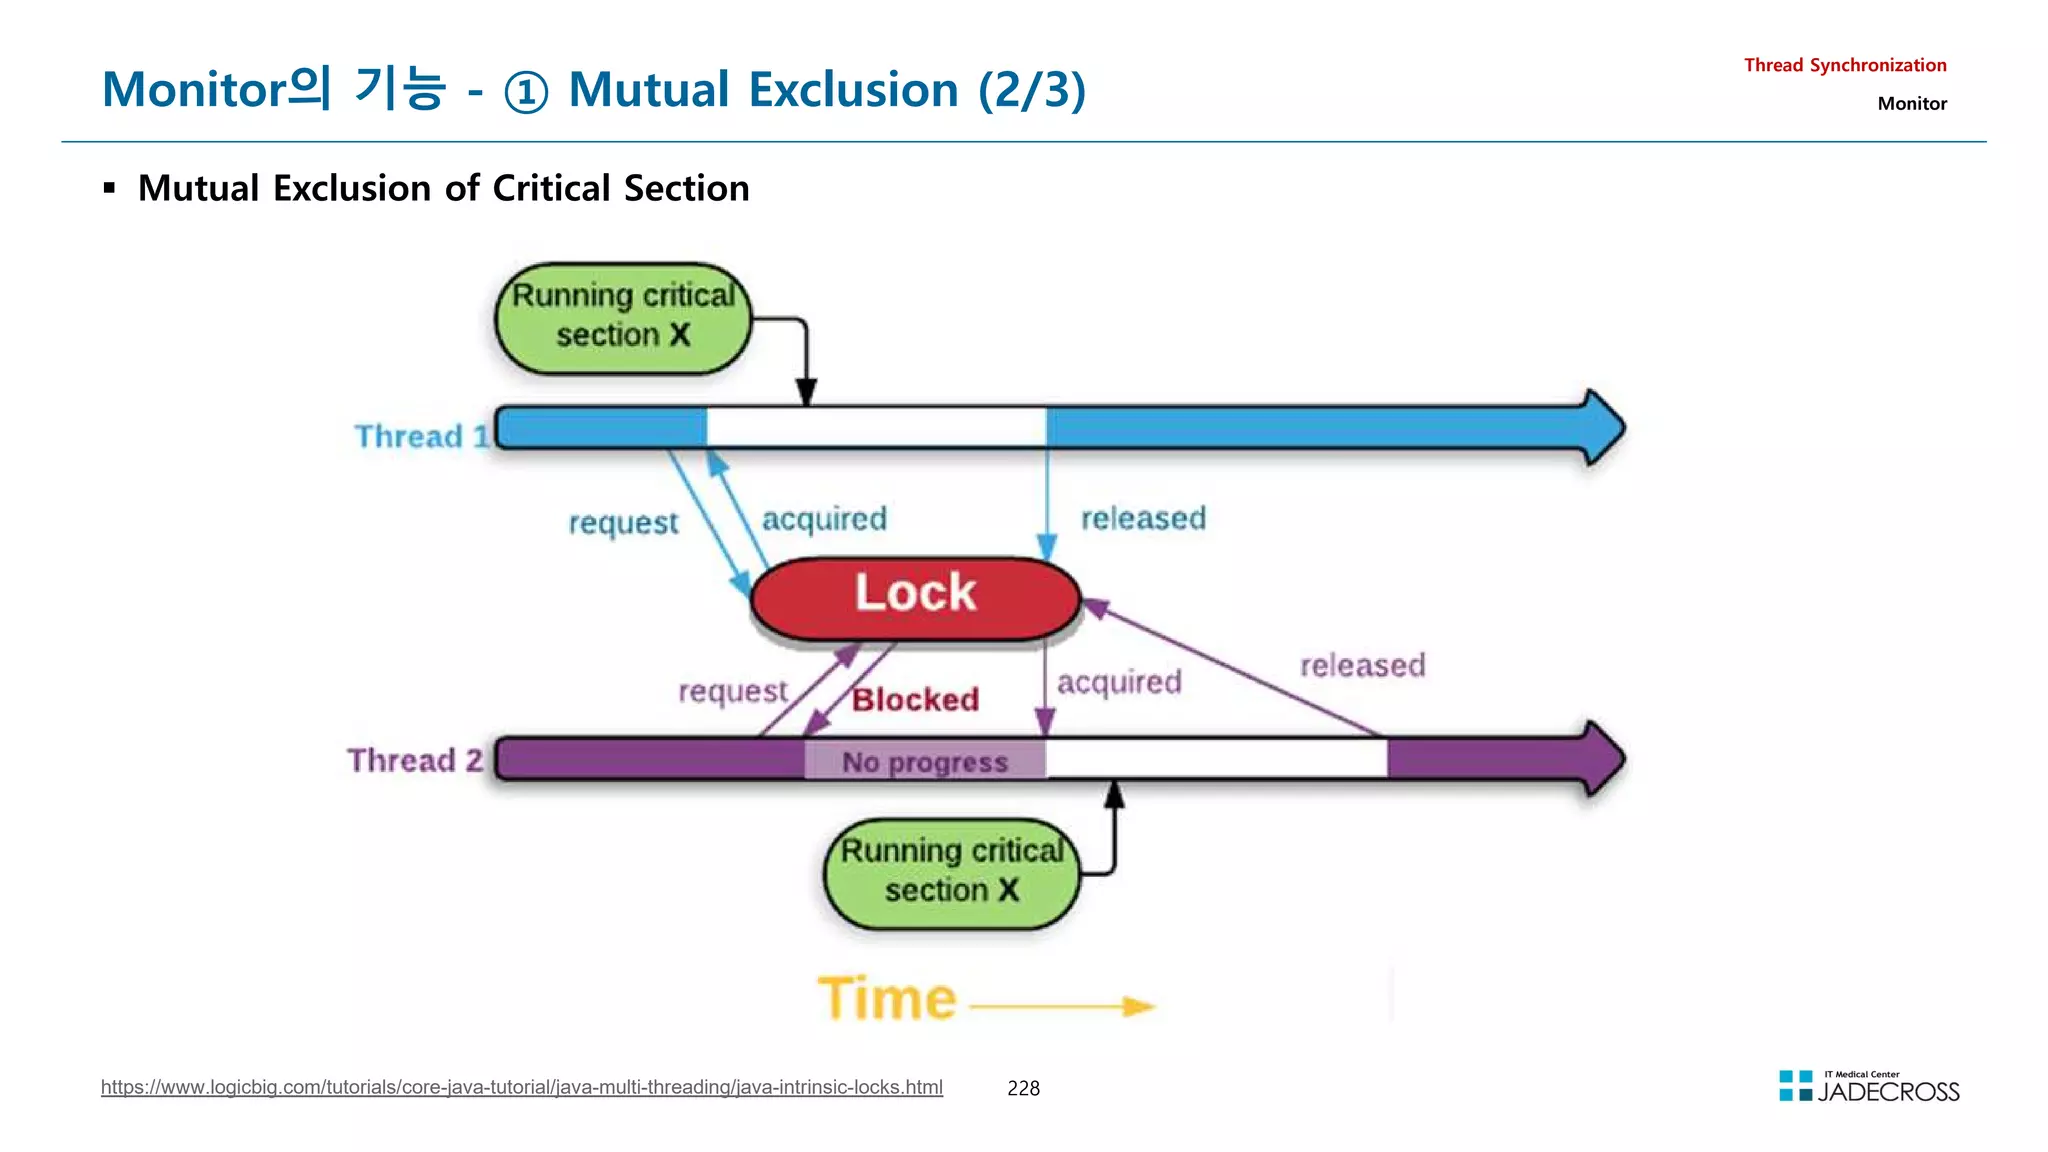
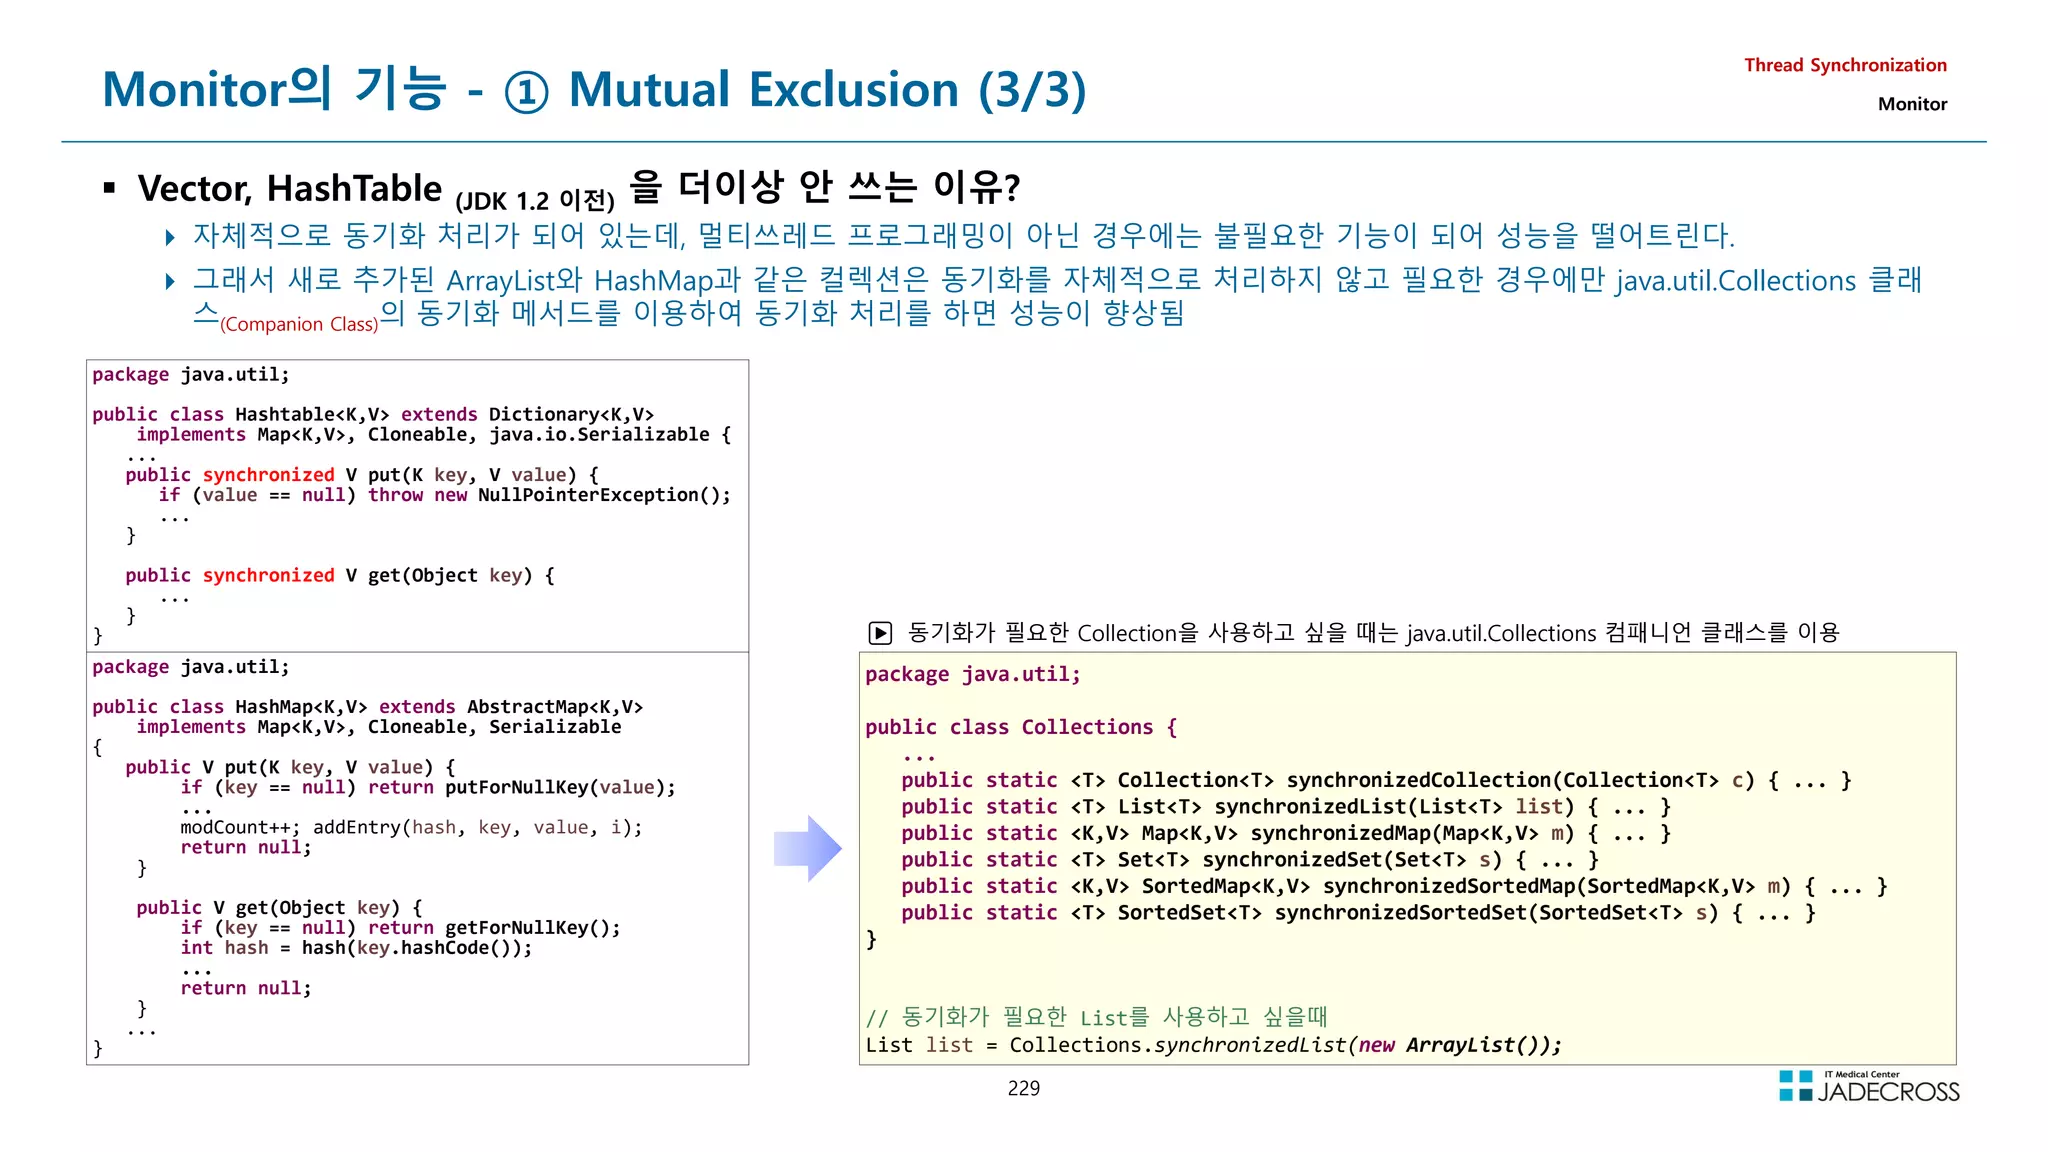
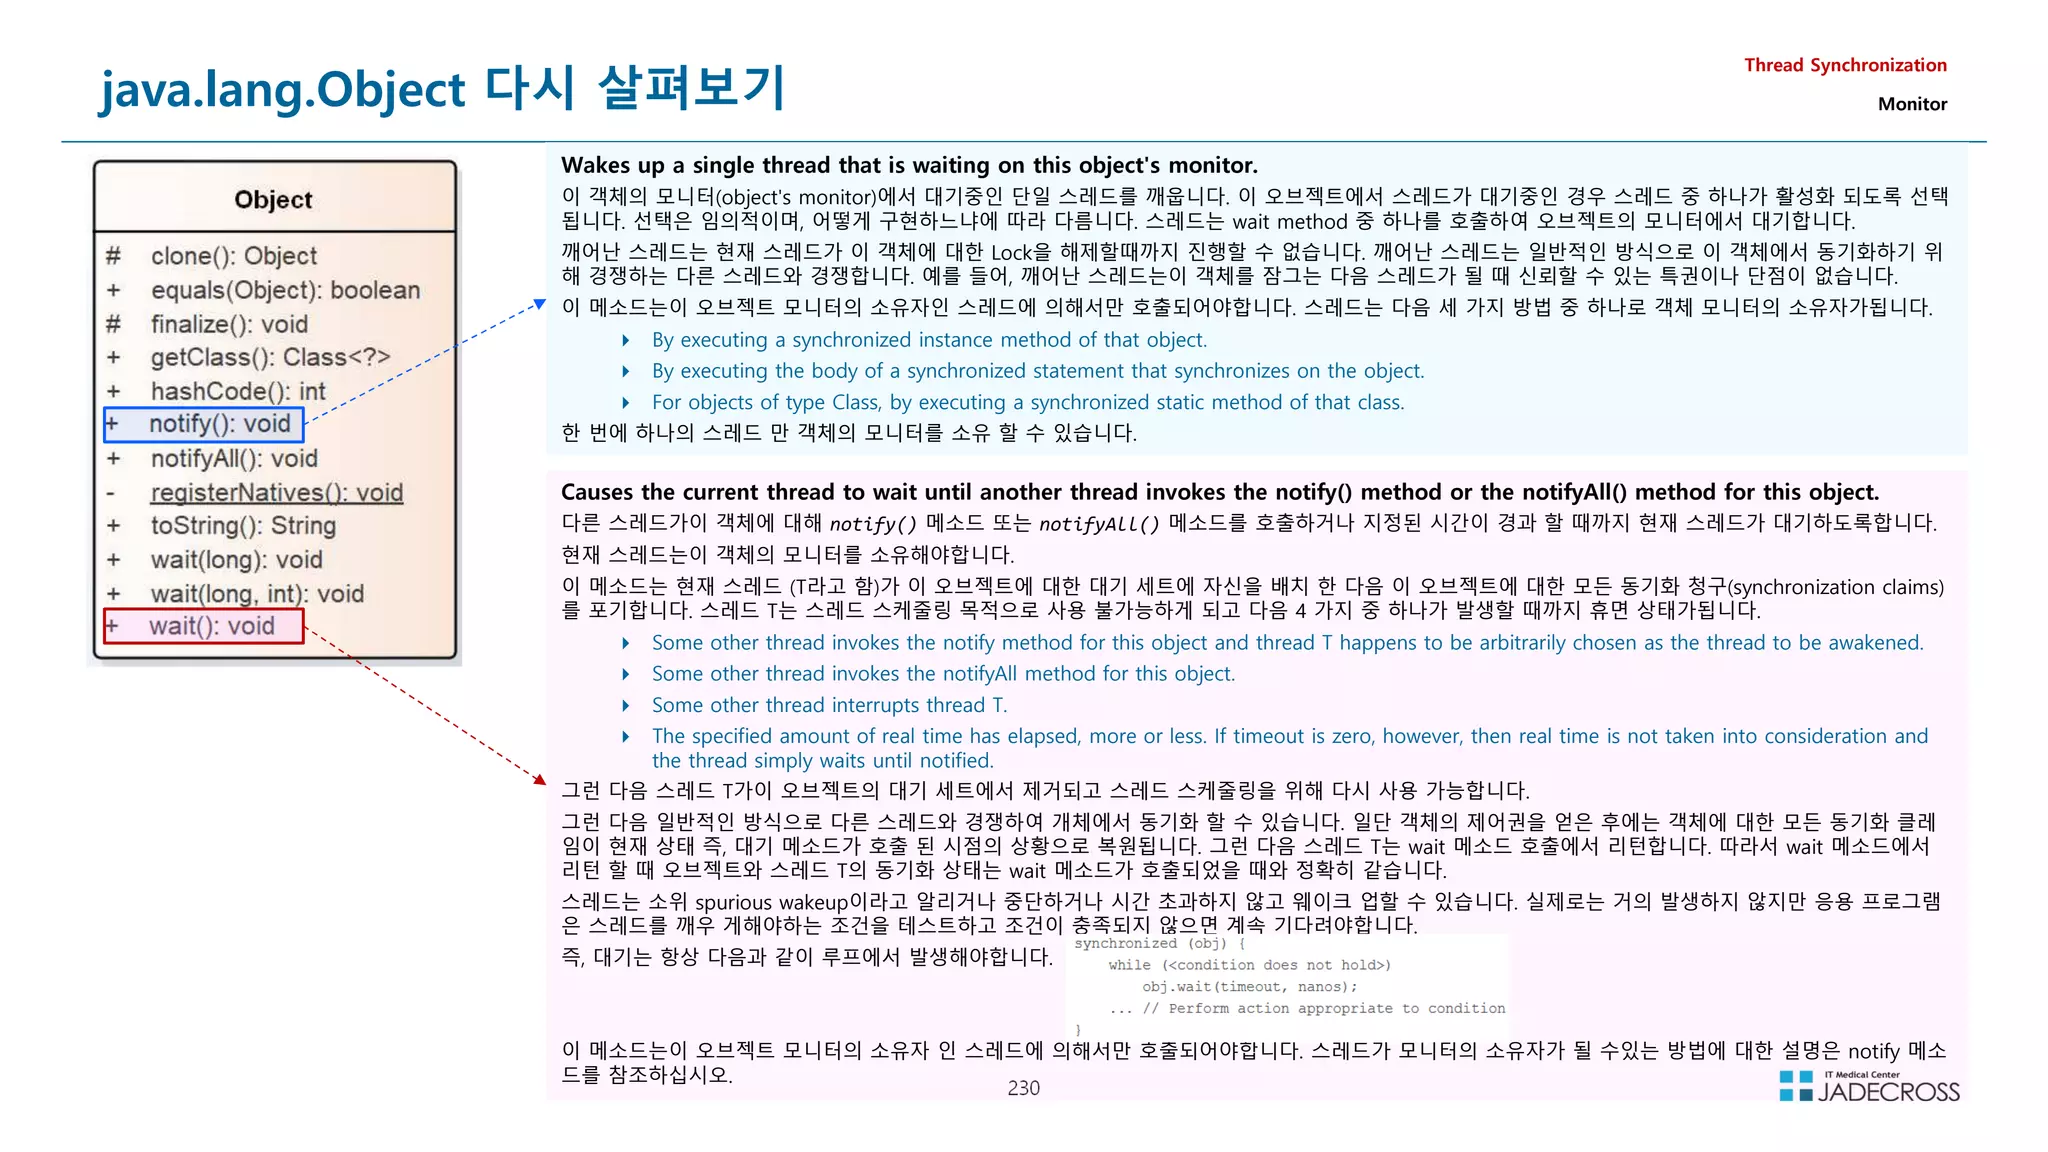
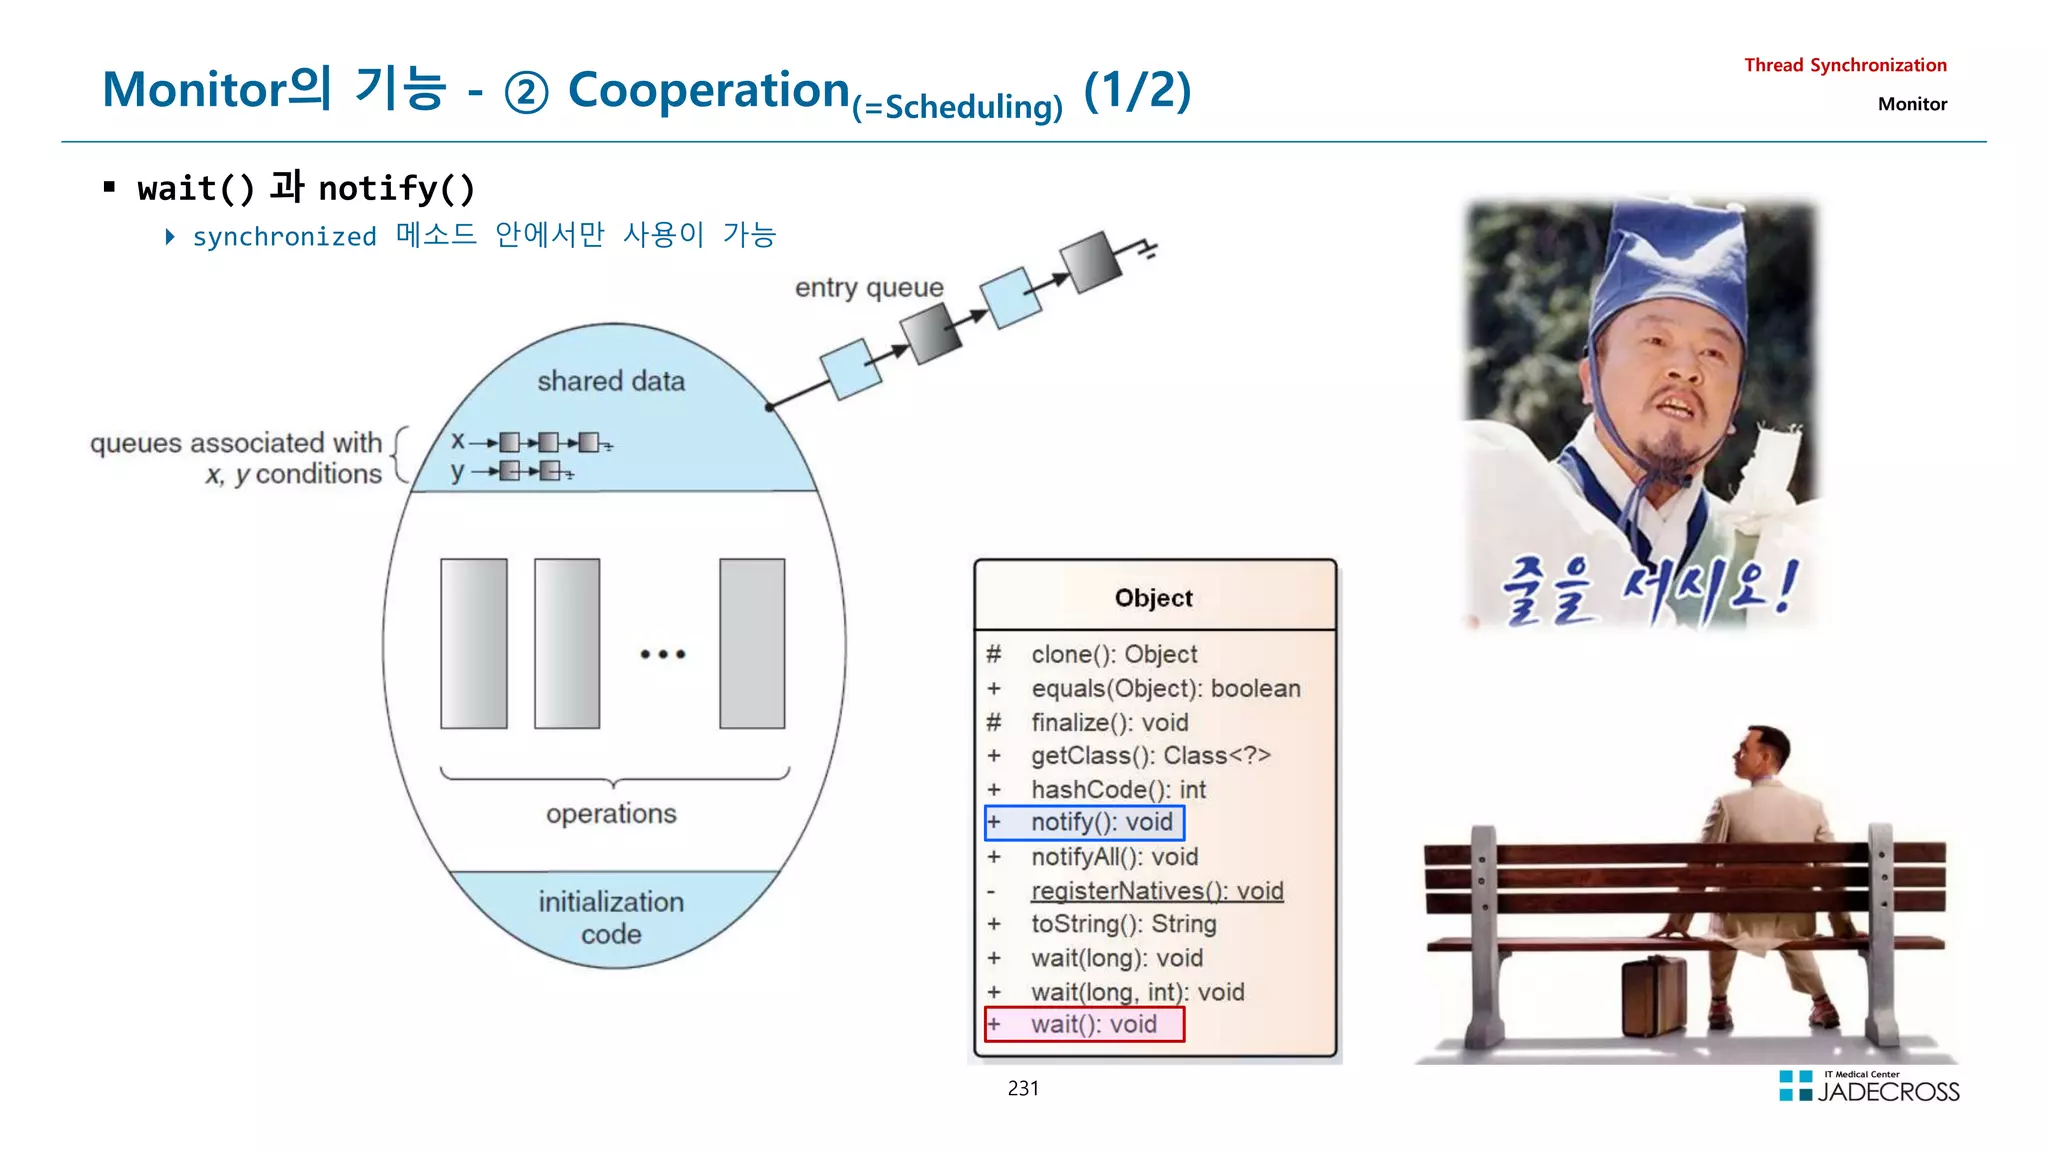
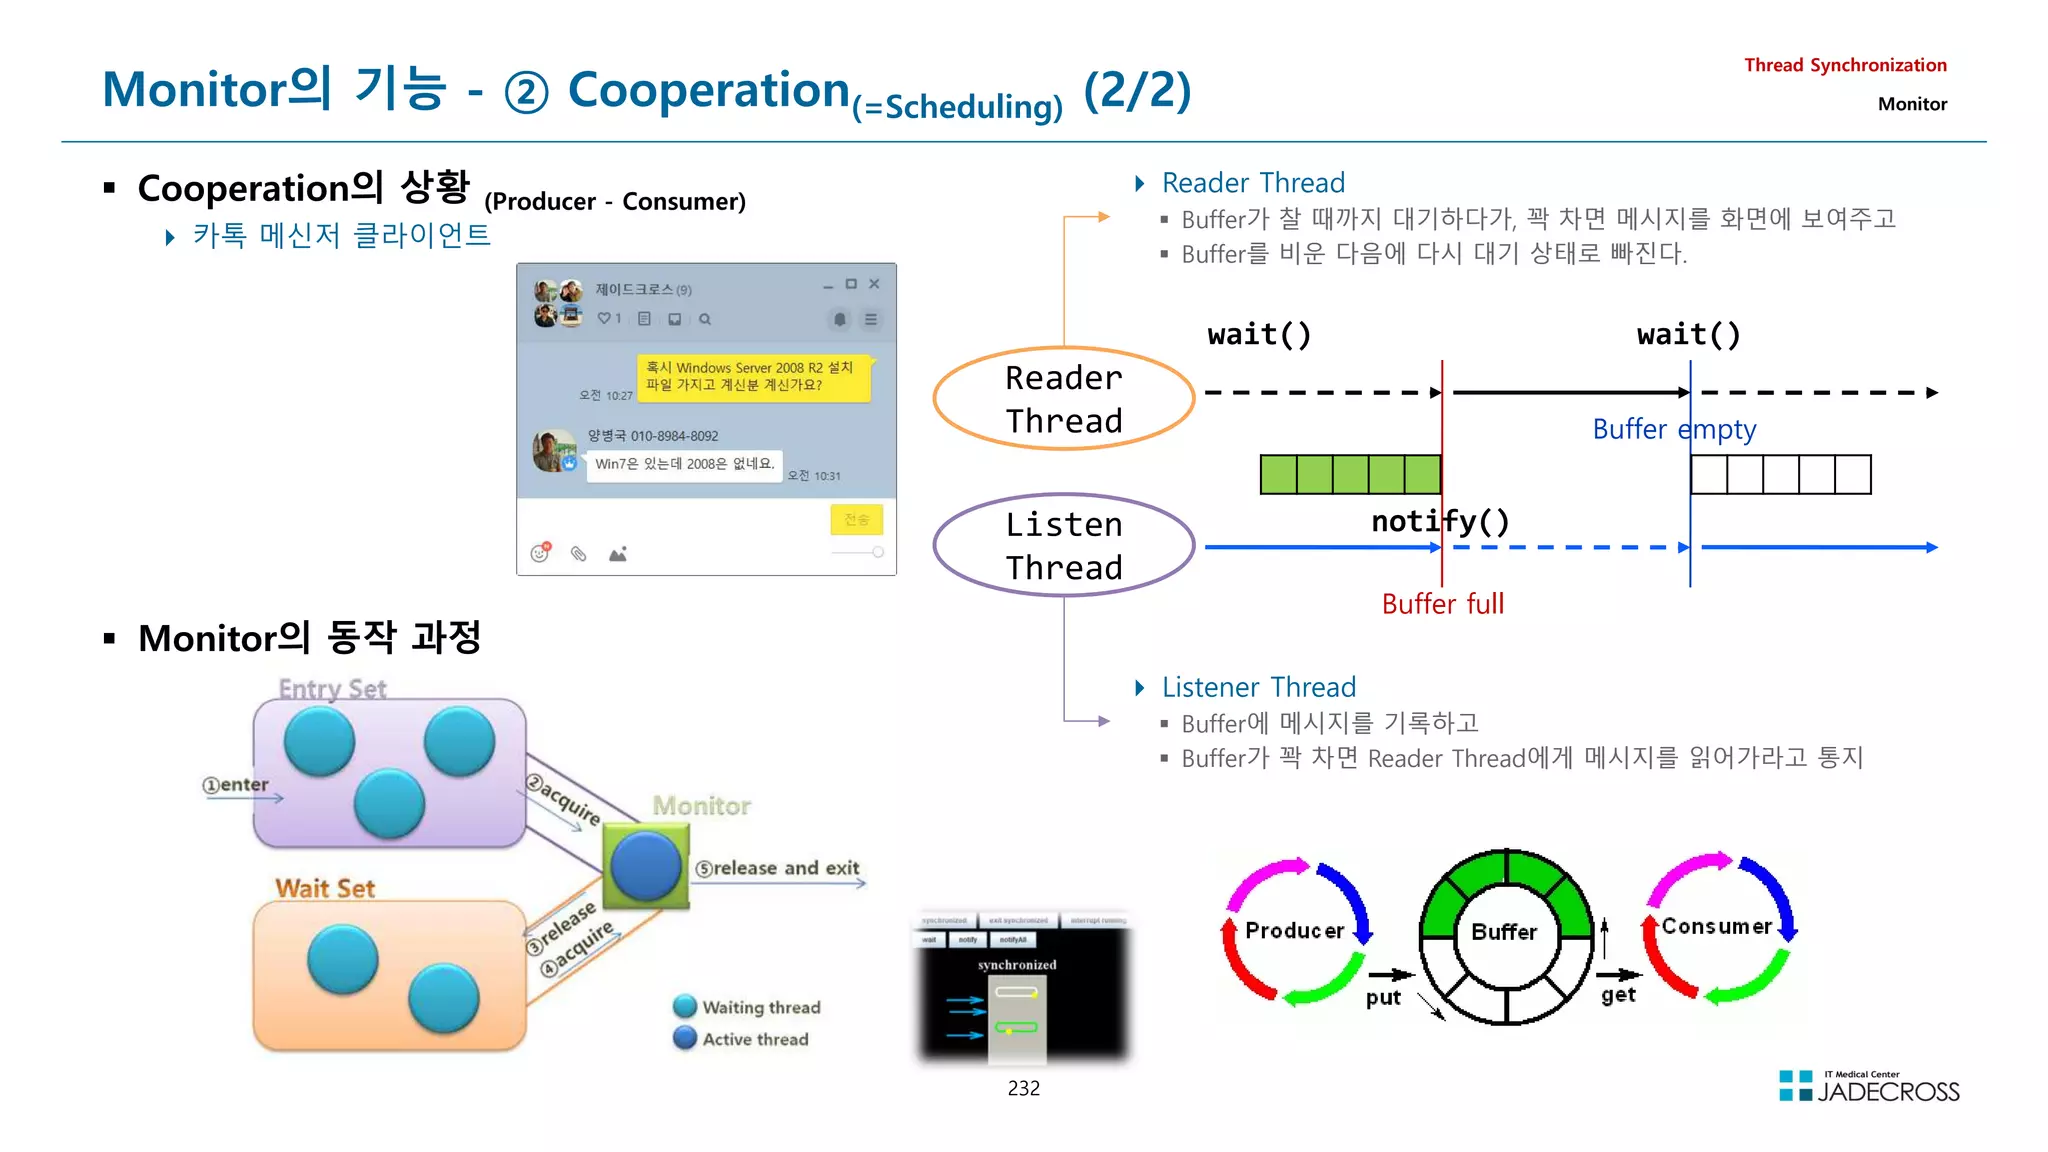
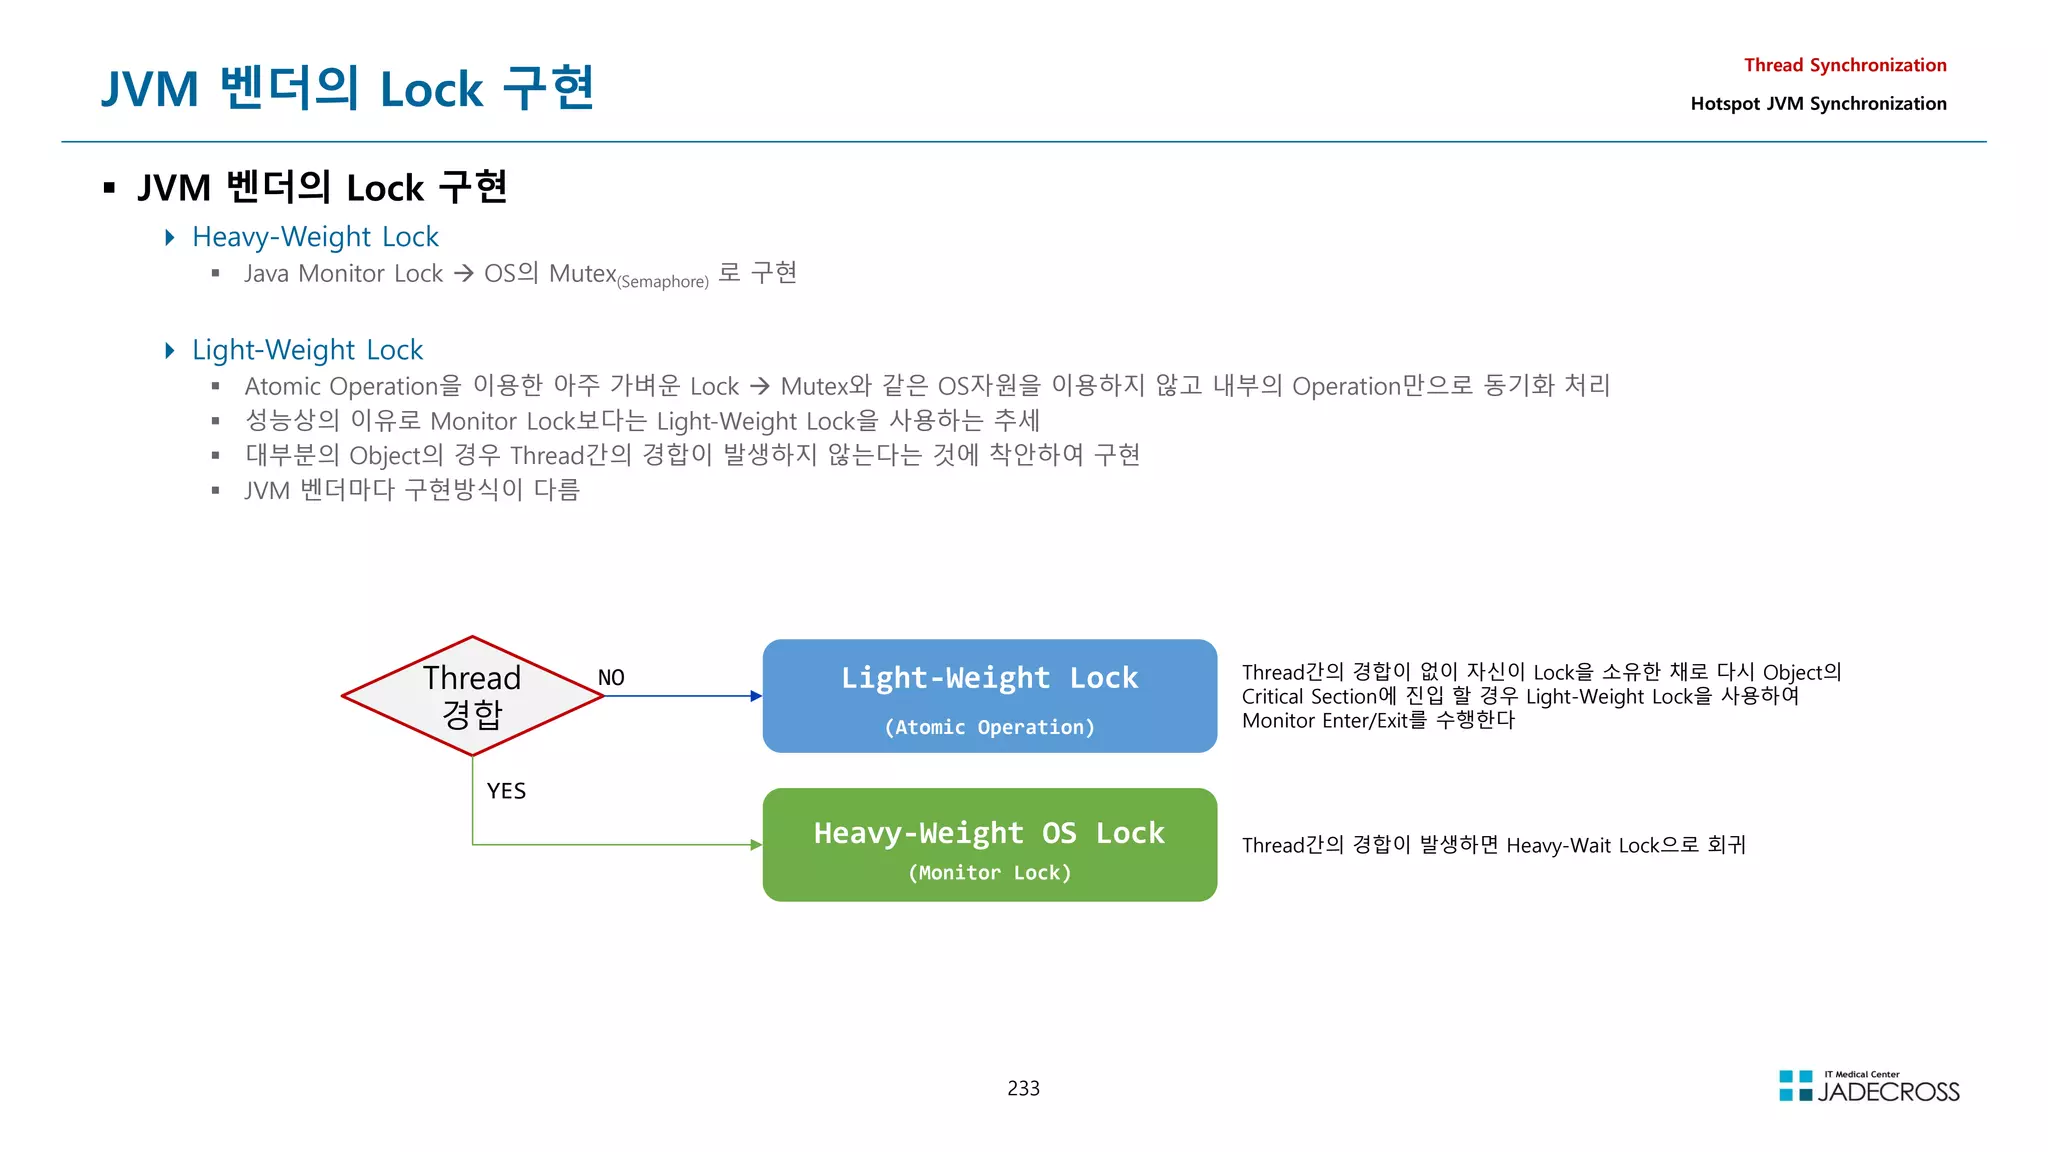
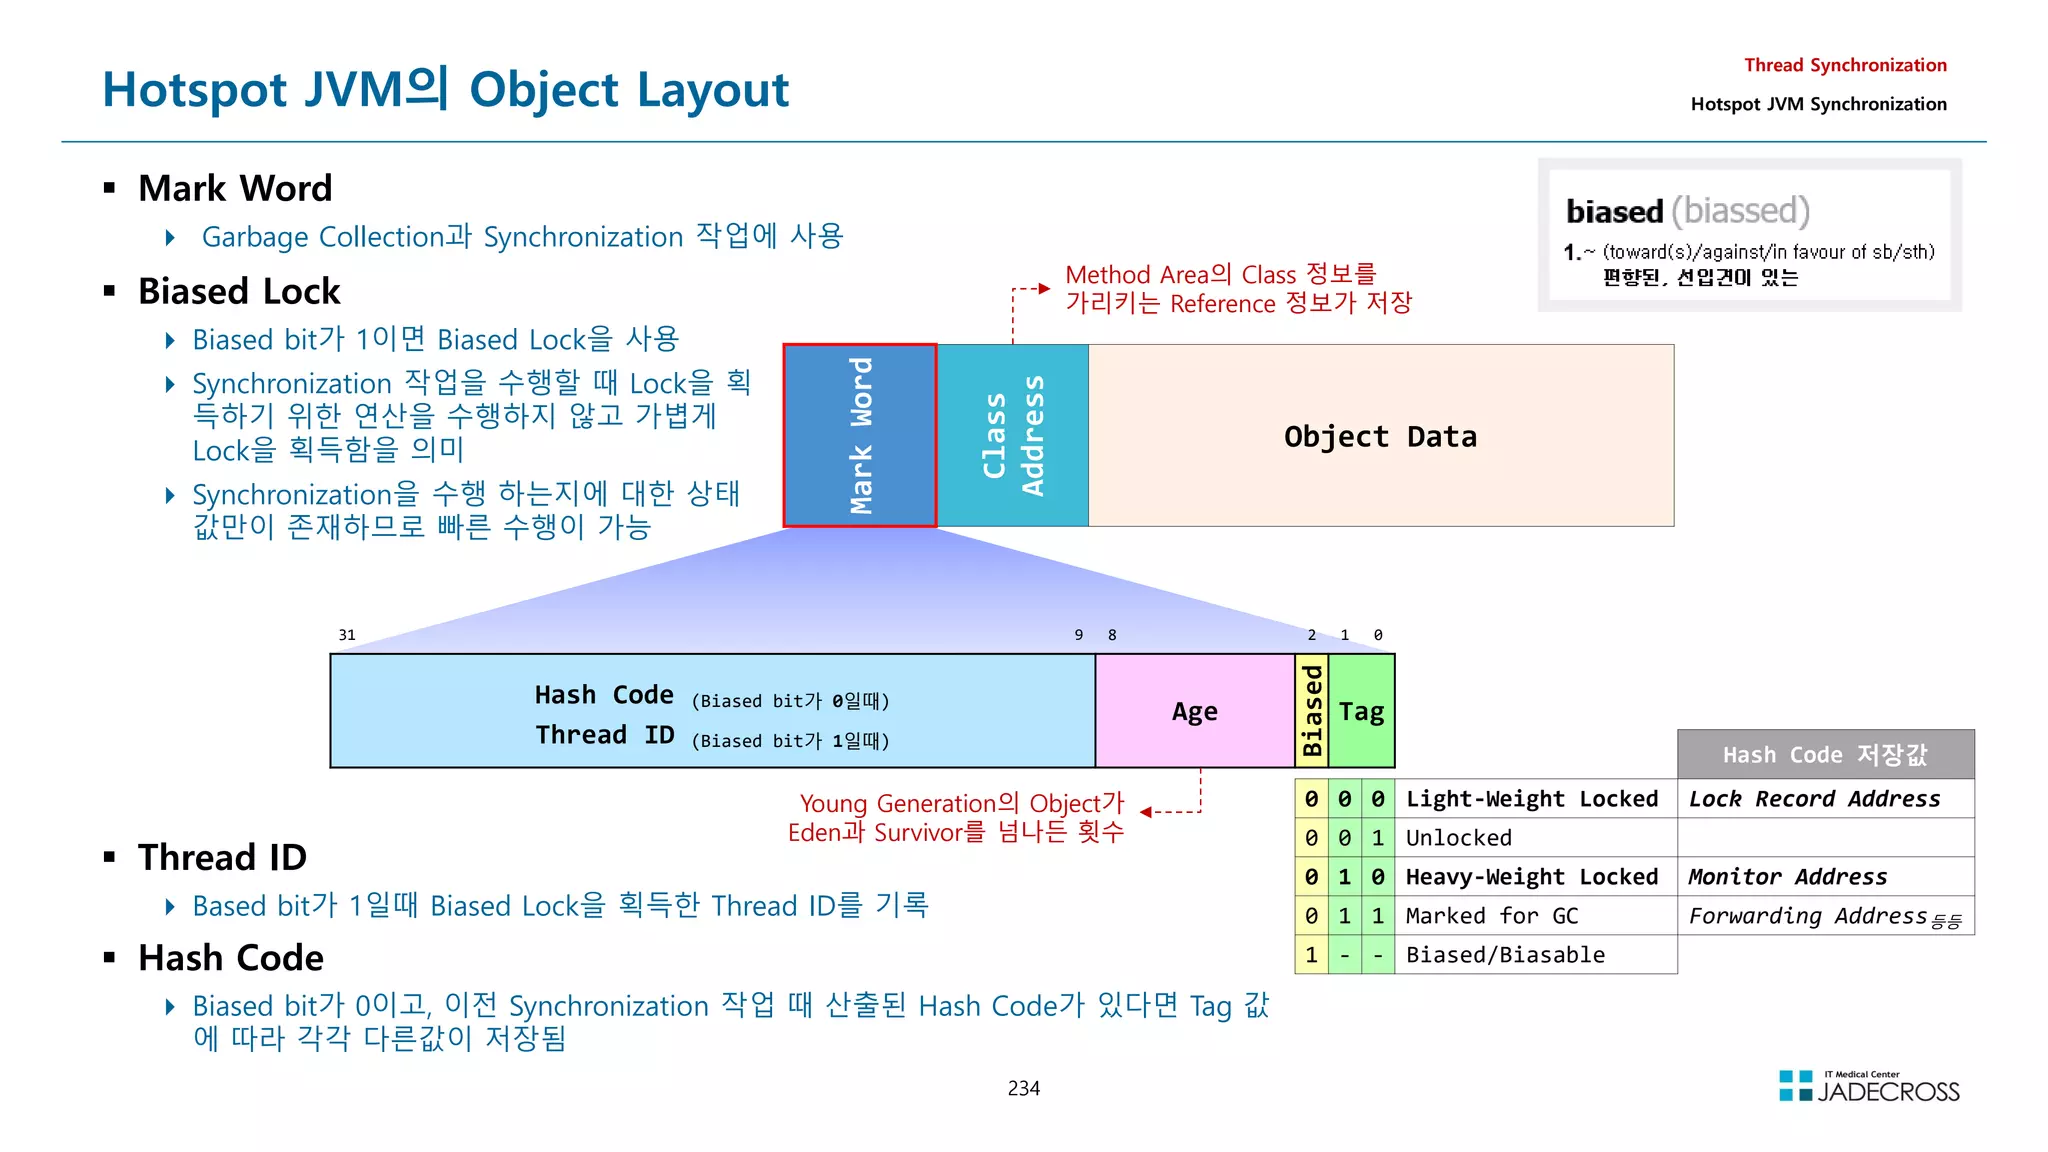
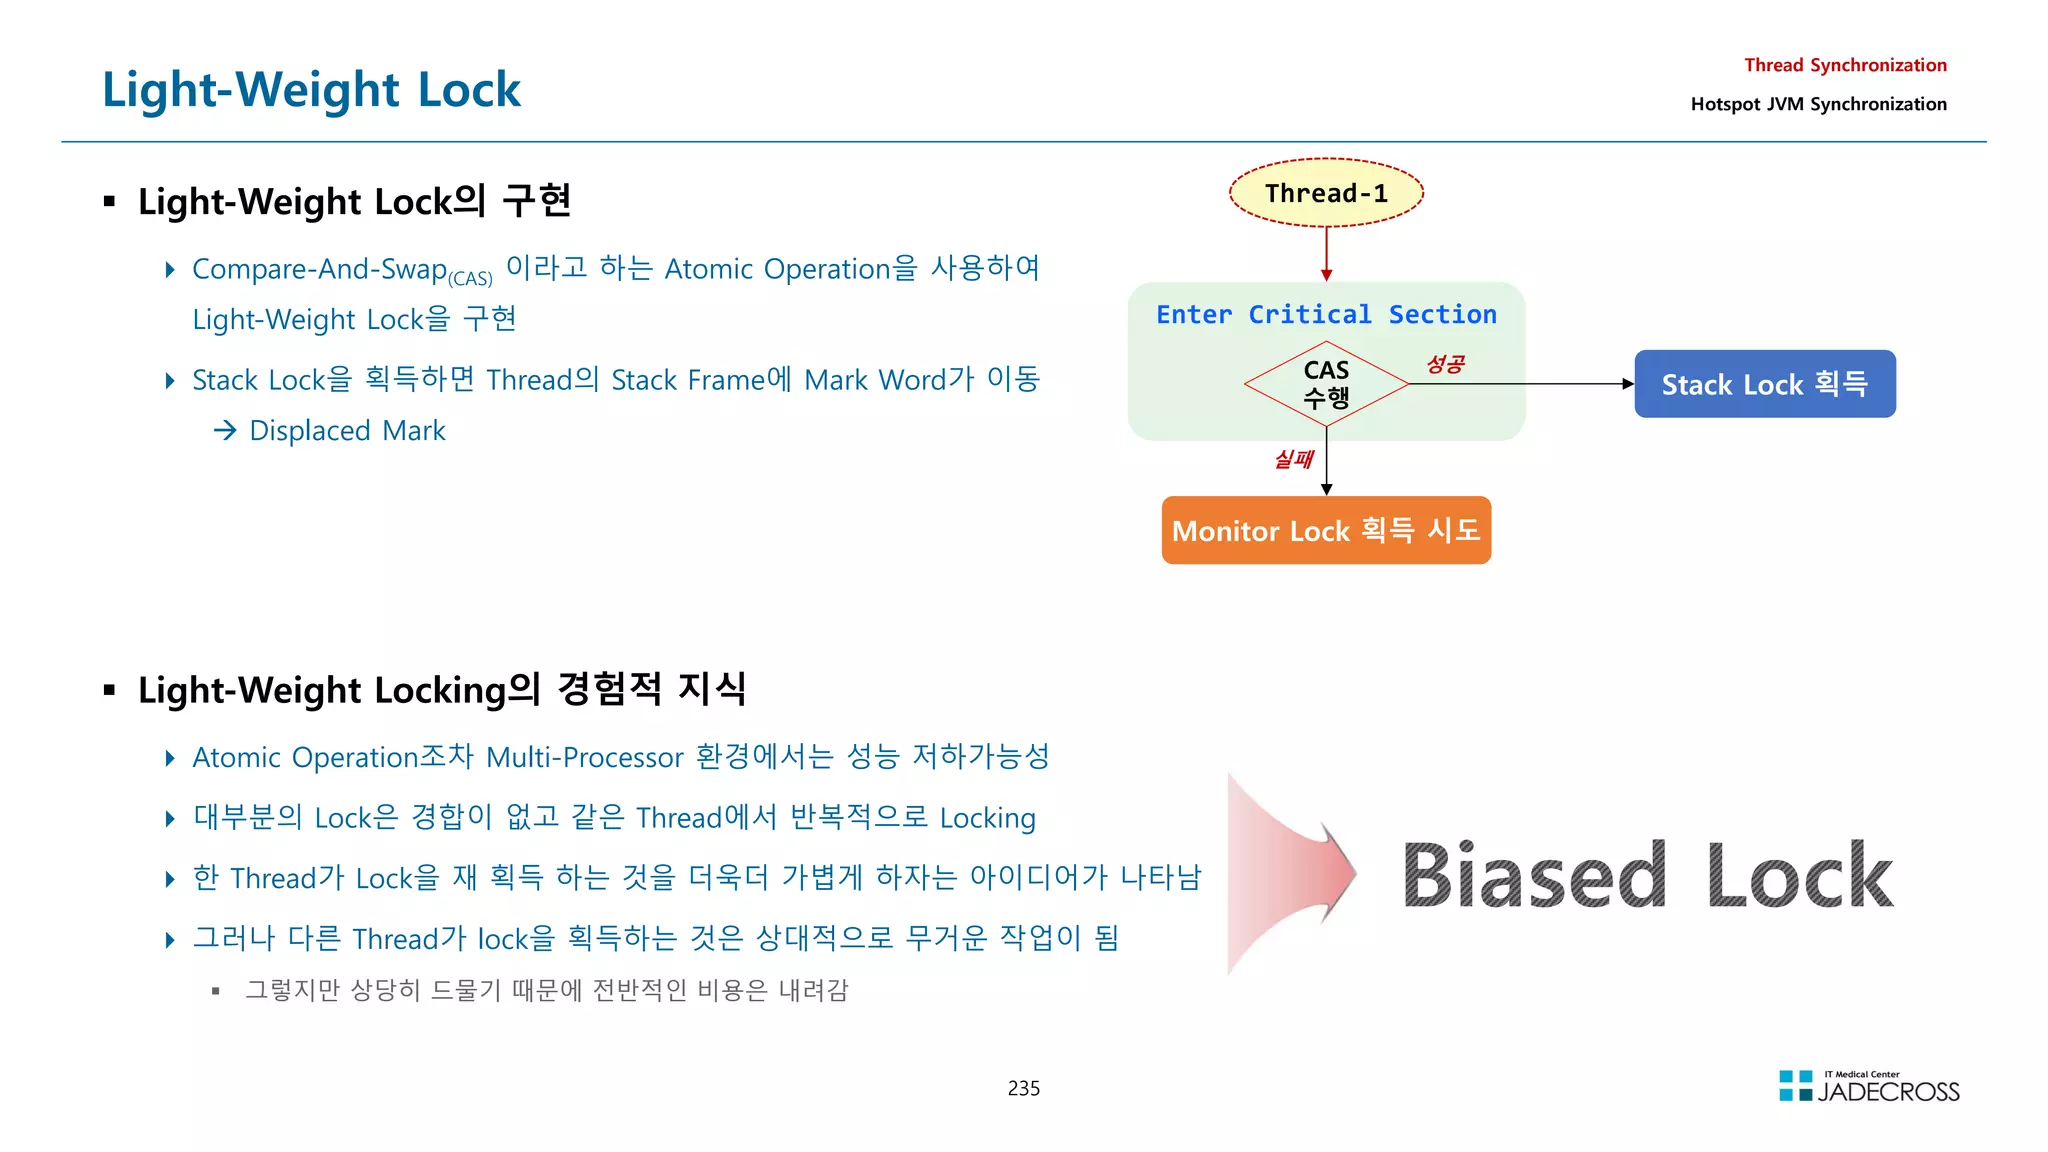
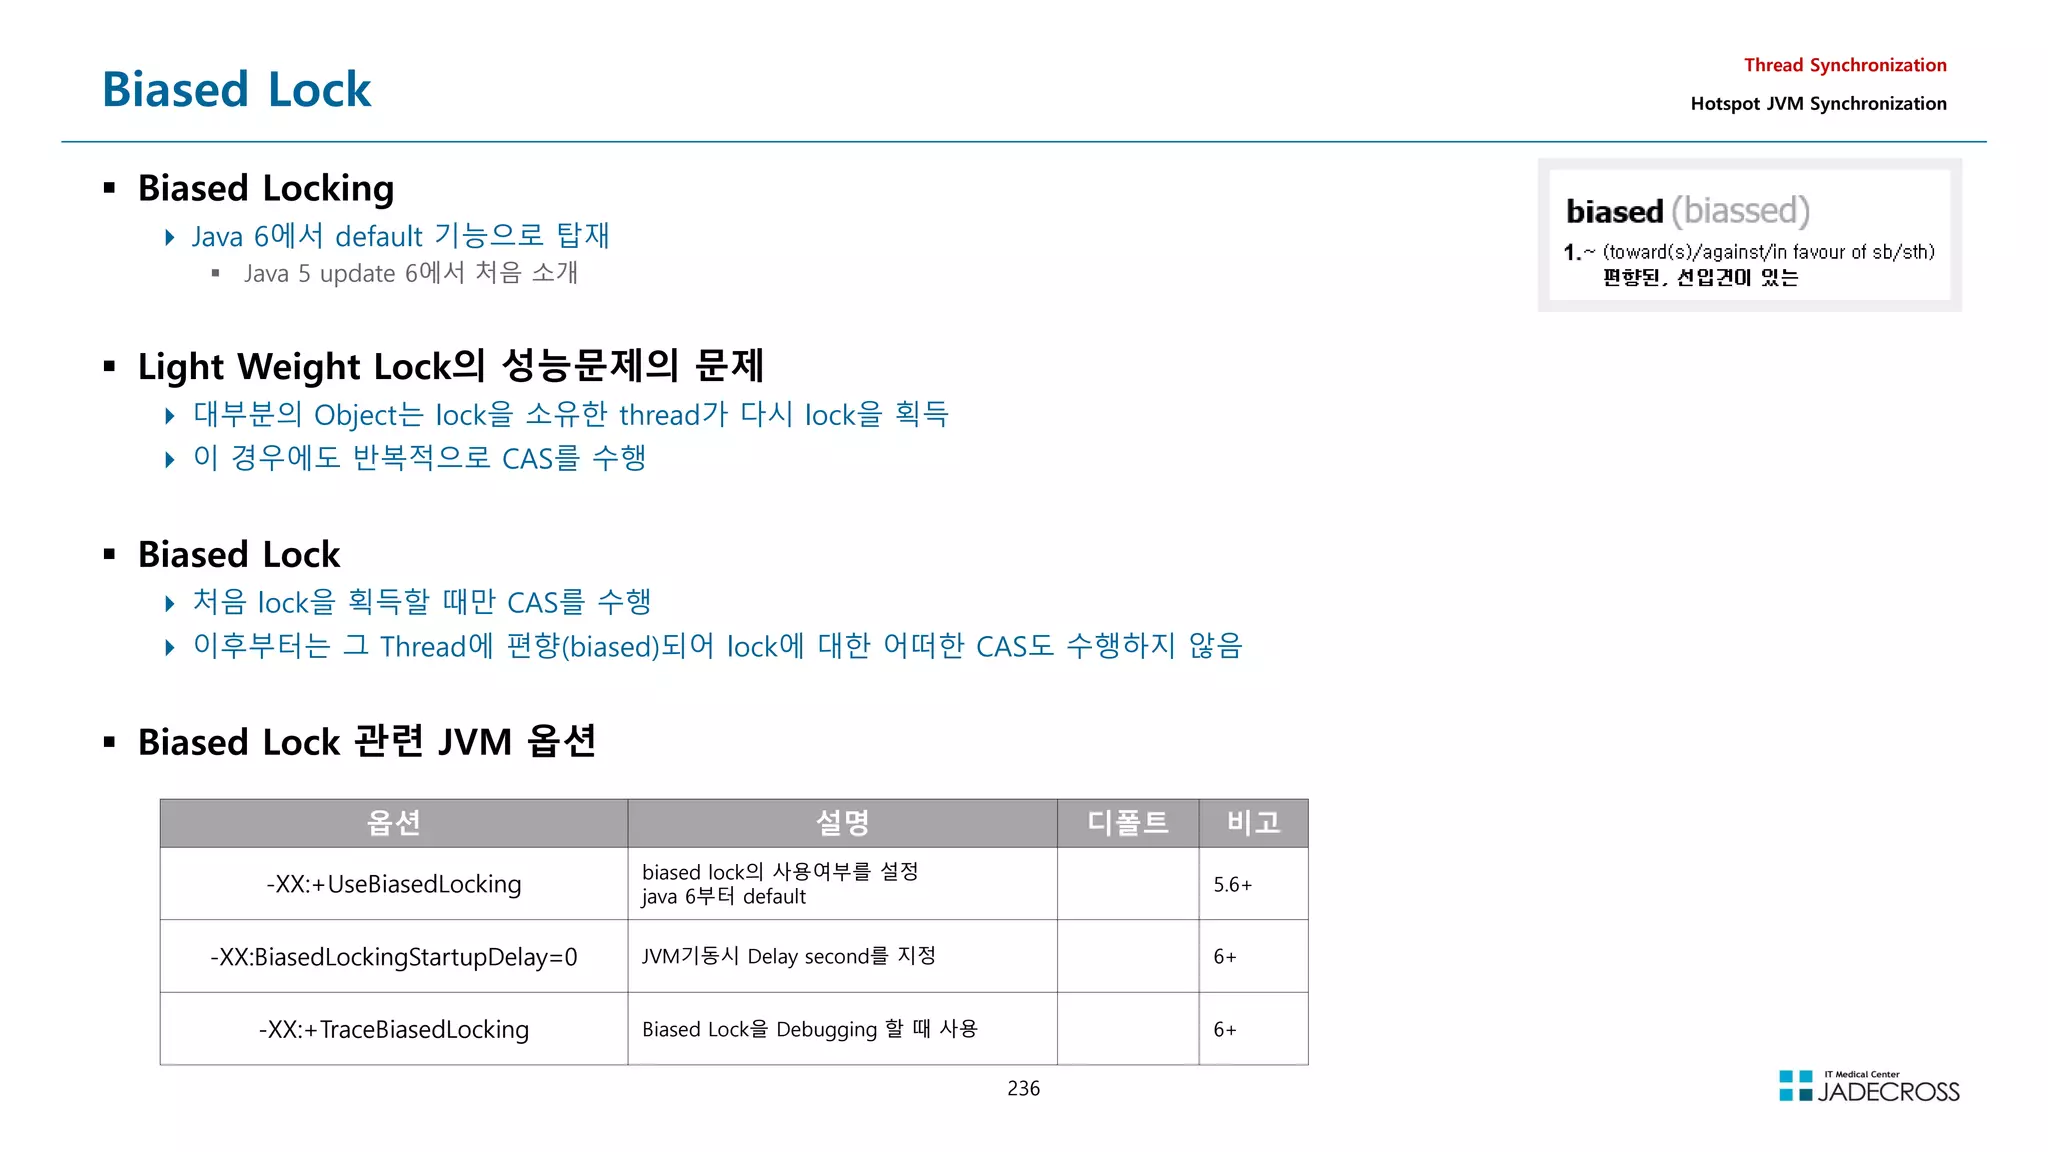
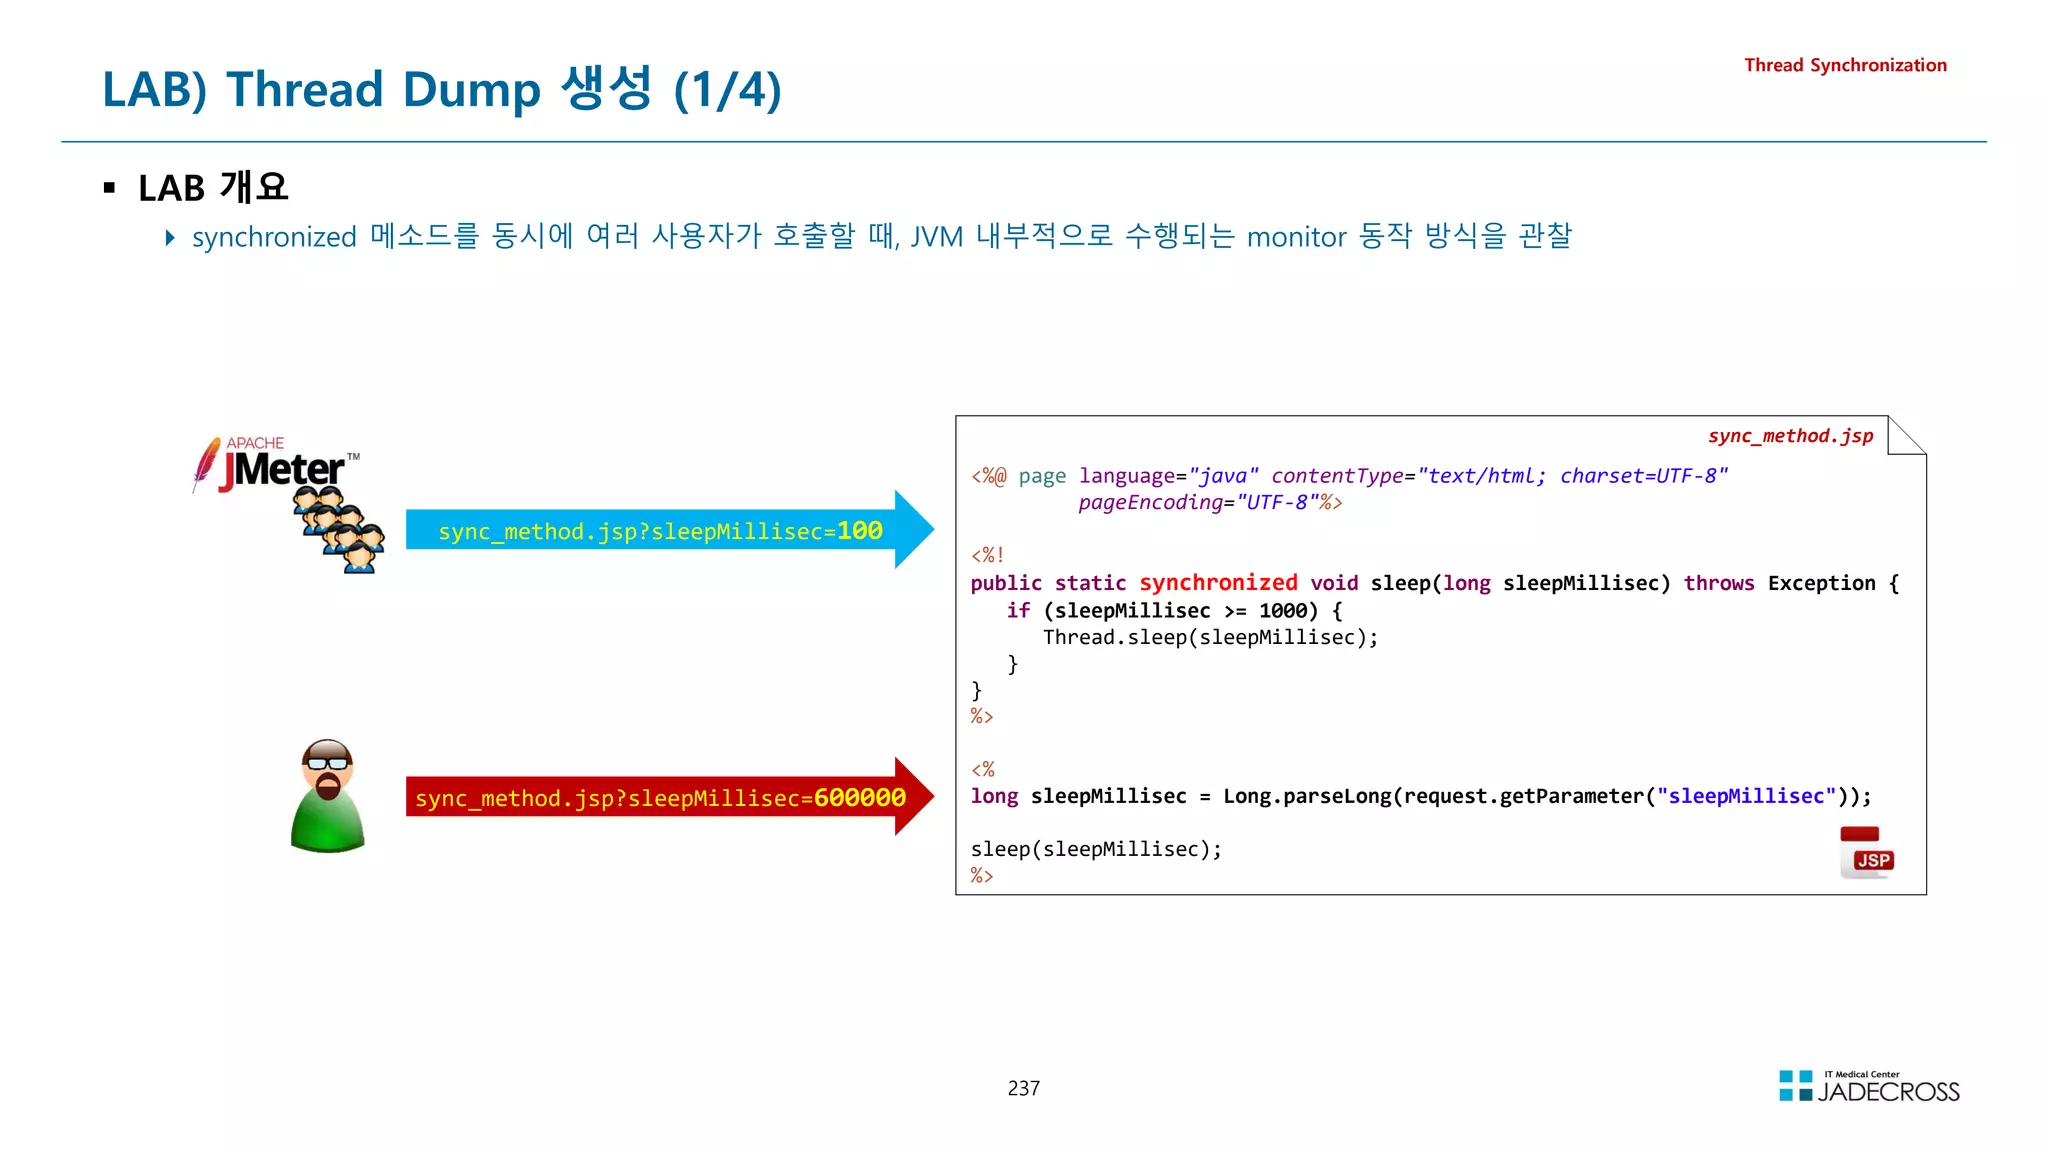
![238
LAB) Thread Dump 생성 (2/4)
Thread Synchronization
① STS 실행후 Tomcat v7.0 서버 실행
[root@jvmedu ~]# sts
② visualvm을 실행하고 visualgc 플러그인 설치
Applications 뷰에서 Local Tomcat 더블 클릭 Threads 탭 클릭
[root@jvmedu ~]# visualvm](https://image.slidesharecdn.com/jvm-230511085906-be6f1201/75/JVM_-pdf-238-2048.jpg)
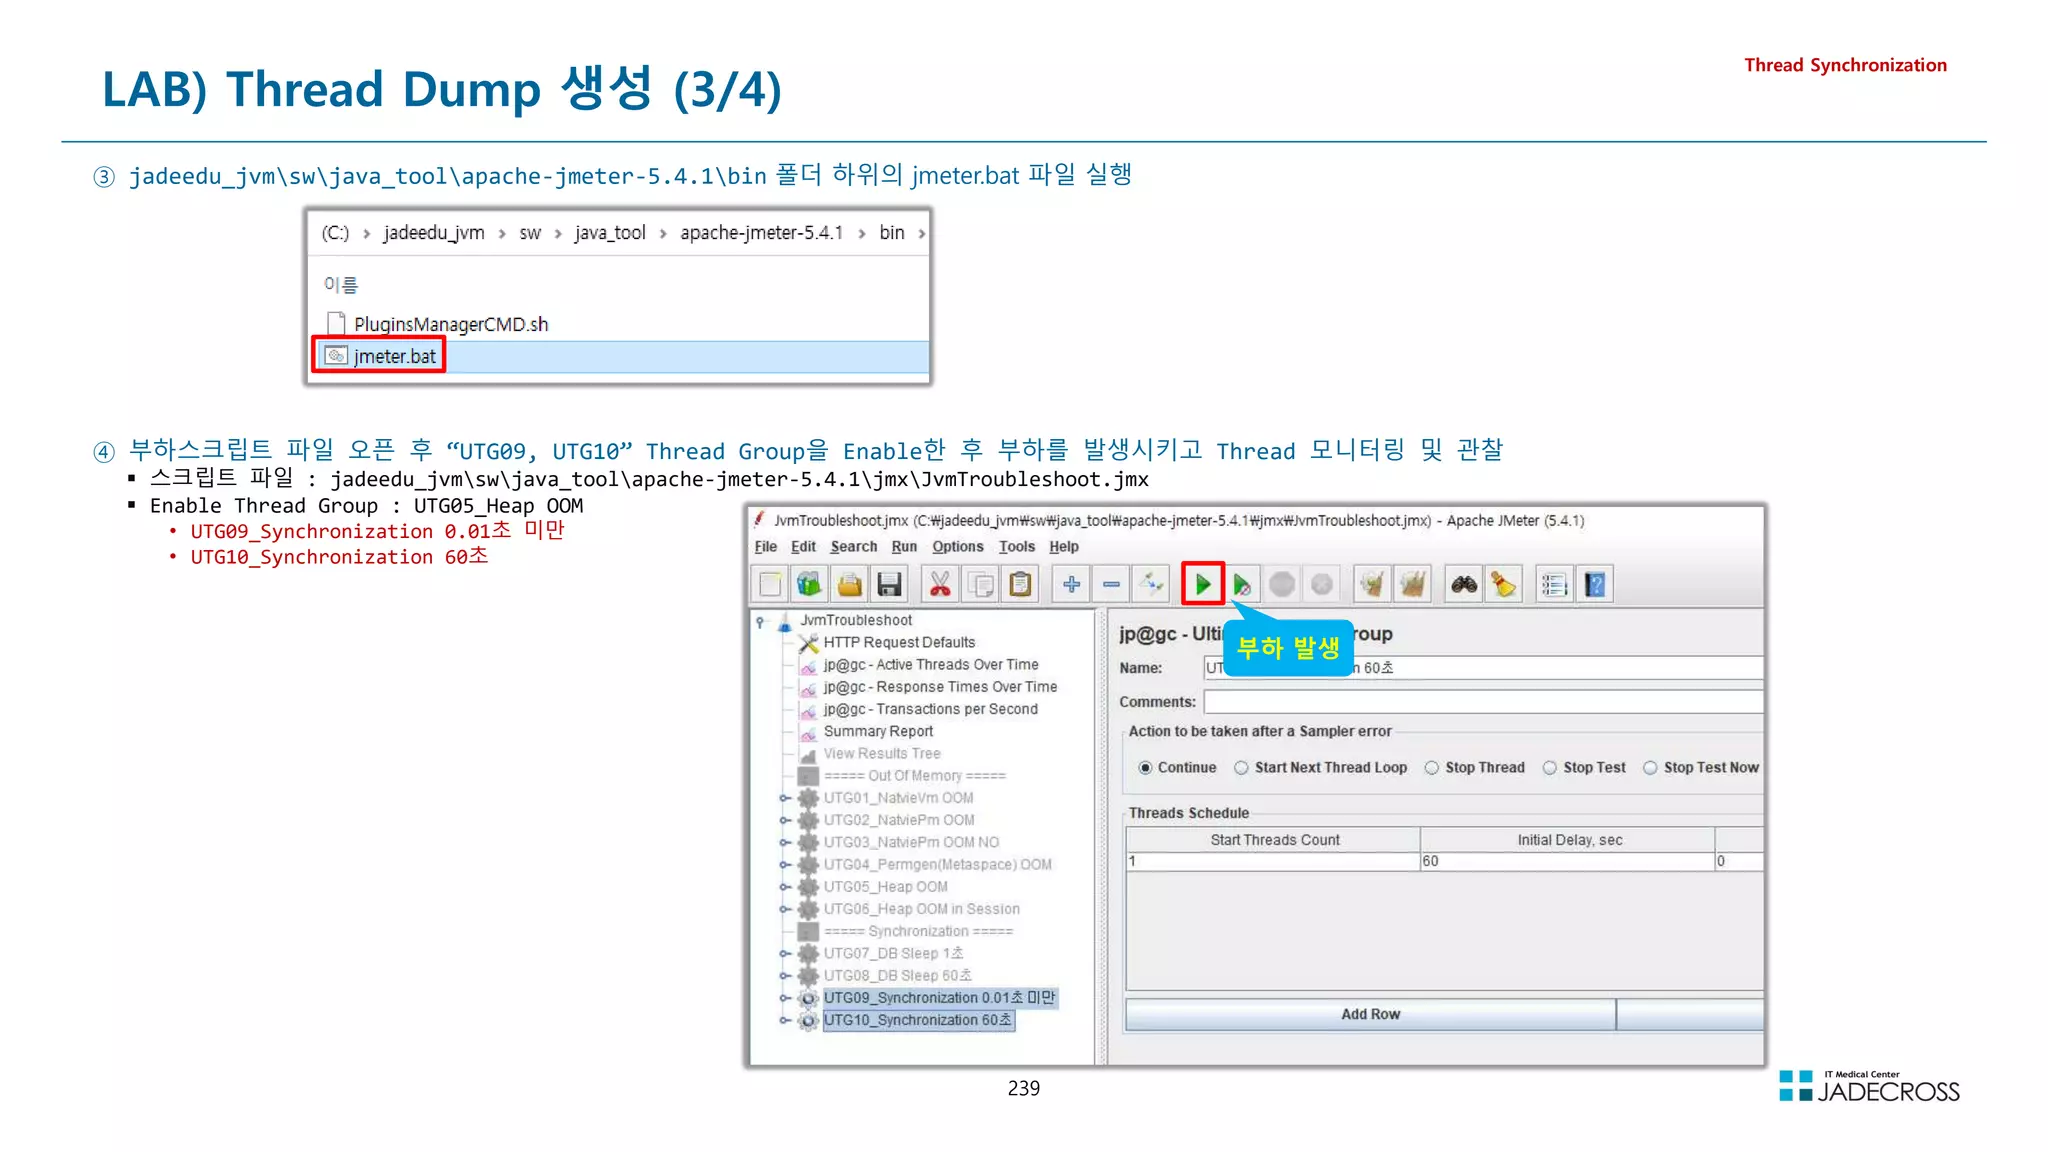
![240
LAB) Thread Dump 생성 (4/4)
Thread Synchronization
⑤ Tomcat 서버의 PID(Process ID)를 확인 후 jstack 명령을 이용하여 Thread Stack Trace 확인
[root@jvmedu ~]# jps -v | grep catalina
2128 Bootstrap -Dcatalina.base=/root/.workspace/.metadata/.plugins/org.eclipse.wst.server.core/tmp0 -Dcatalina.home=/root/tomcat7 -
Dwtp.deploy=/root/.workspace/.metadata/.plugins/org.eclipse.wst.server.core/tmp0/wtpwebapps -Djava.endorsed.dirs=/root/tomcat7/endorsed -
javaagent:/root/scouter/agent.java_6_7/scouter.agent.jar -Dscouter.config=/root/scouter/agent.java_6_7/conf/tomcat7.conf -
Djava.library.path=/root/lab/jni/ex02 -Xms512m -Xmx512m -Dfile.encoding=UTF-8
[root@jvmedu ~]# jstack 2128
2021-10-25 11:34:46
Full thread dump Java HotSpot(TM) 64-Bit Server VM (24.80-b11 mixed mode):
RMI TCP Connection(4)-192.168.56.96 daemon prio=10 tid=0x00007f6e24005000 nid=0x89e runnable [0x00007f6e4e49a000]
java.lang.Thread.State: RUNNABLE
at java.net.SocketInputStream.socketRead0(Native Method)
at java.net.SocketInputStream.read(SocketInputStream.java:152)
at java.net.SocketInputStream.read(SocketInputStream.java:122)
at java.io.BufferedInputStream.fill(BufferedInputStream.java:235)
at java.io.BufferedInputStream.read(BufferedInputStream.java:254)
- locked 0x00000000fd47b808 (a java.io.BufferedInputStream)
at java.io.FilterInputStream.read(FilterInputStream.java:83)
at sun.rmi.transport.tcp.TCPTransport.handleMessages(TCPTransport.java:549)
at sun.rmi.transport.tcp.TCPTransport$ConnectionHandler.run0(TCPTransport.java:828)
at sun.rmi.transport.tcp.TCPTransport$ConnectionHandler.access$400(TCPTransport.java:619)
at sun.rmi.transport.tcp.TCPTransport$ConnectionHandler$1.run(TCPTransport.java:684)
at sun.rmi.transport.tcp.TCPTransport$ConnectionHandler$1.run(TCPTransport.java:681)
at java.security.AccessController.doPrivileged(Native Method)
at sun.rmi.transport.tcp.TCPTransport$ConnectionHandler.run(TCPTransport.java:681)
at java.util.concurrent.ThreadPoolExecutor.runWorker(ThreadPoolExecutor.java:1145)
at java.util.concurrent.ThreadPoolExecutor$Worker.run(ThreadPoolExecutor.java:615)
at java.lang.Thread.run(Thread.java:745)
~~~
⑥ jstack 명령을 이용하여 Thread Dump 2개 생성
[root@jvmedu ~]# jstack 2128 thread_dump01.txt; sleep 10; jstack 2128 thread_dump02.txt](https://image.slidesharecdn.com/jvm-230511085906-be6f1201/75/JVM_-pdf-240-2048.jpg)
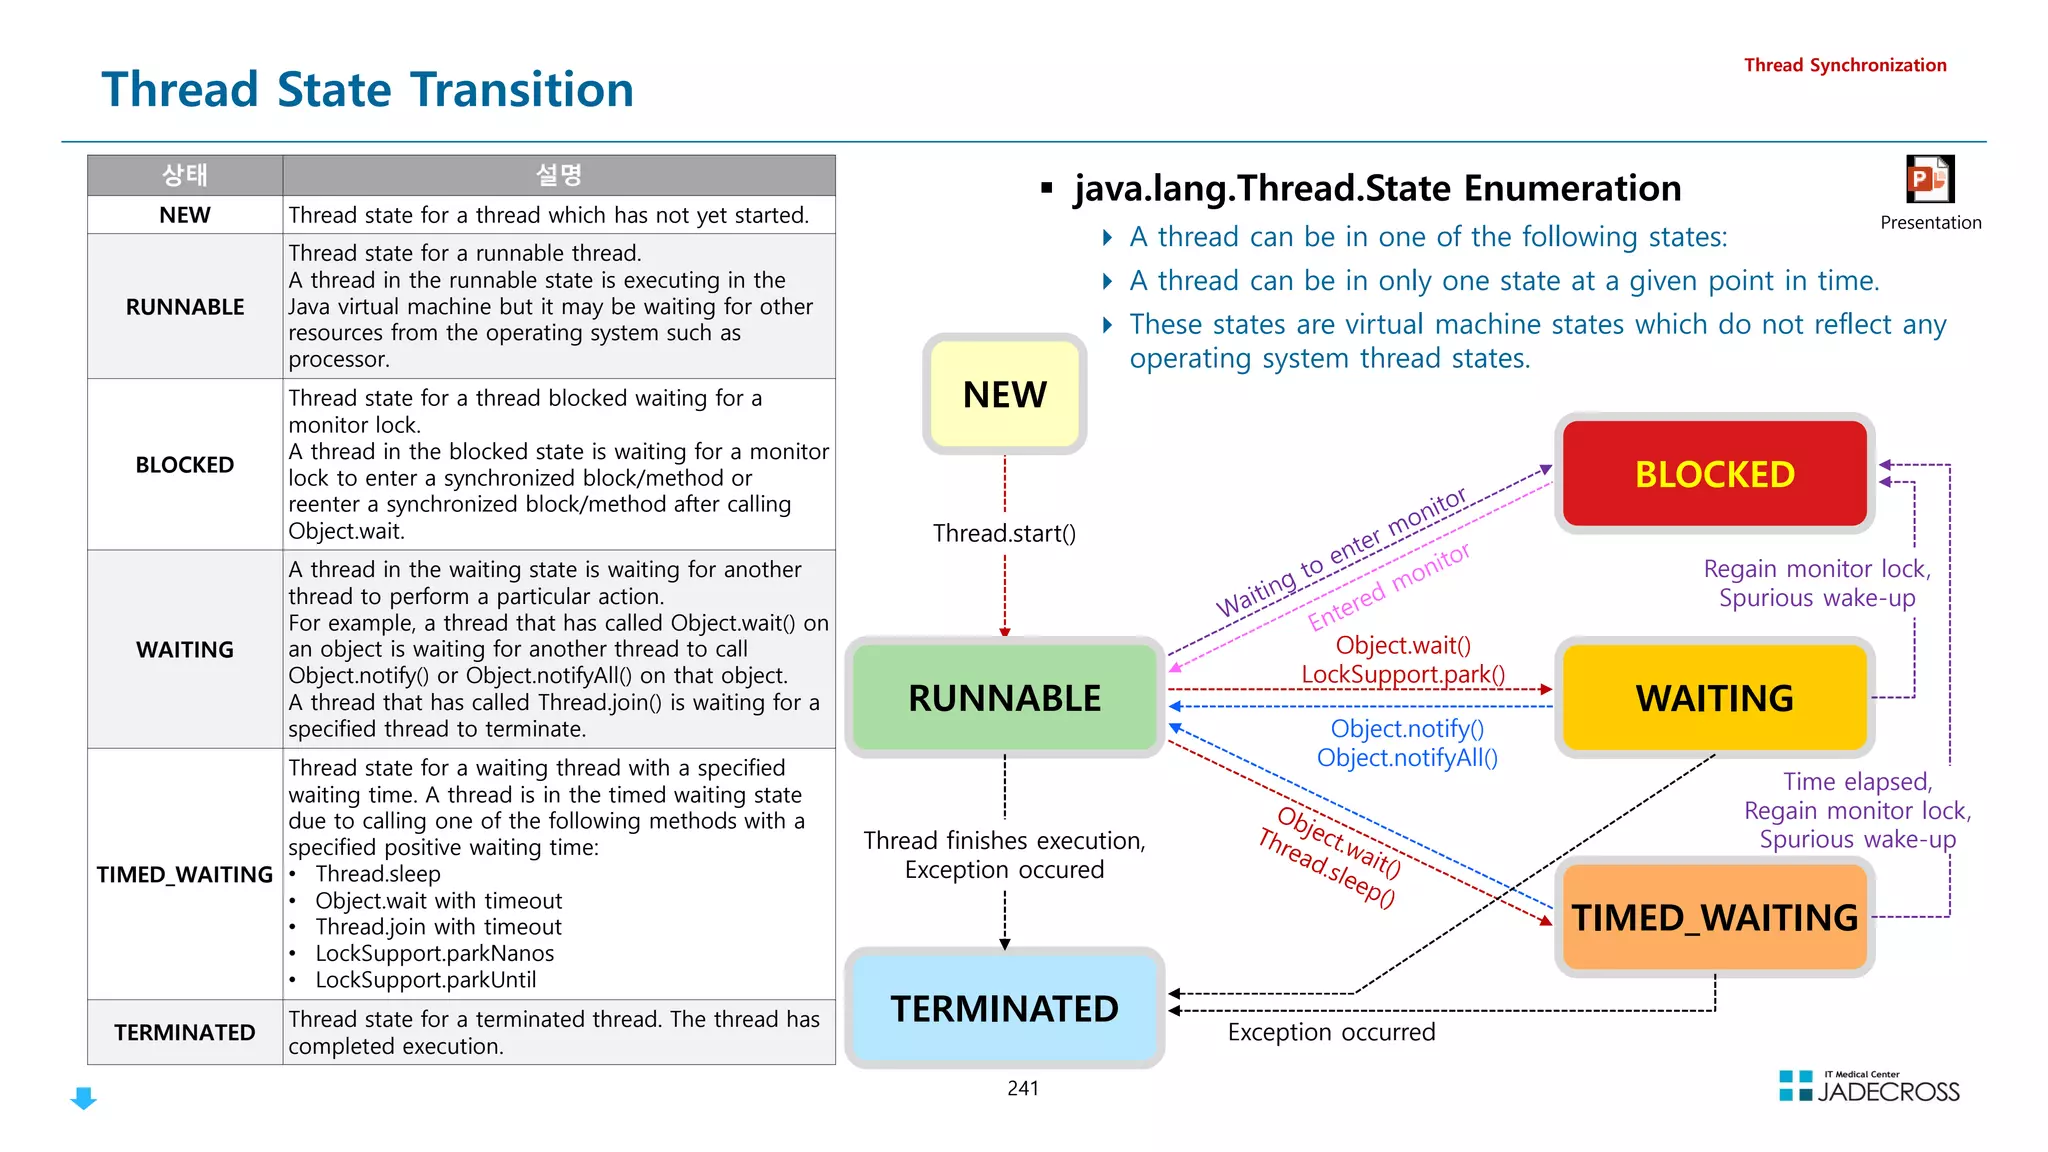
![242
Thread Dump 정보
Thread Synchronization
http-bio-7080-exec-19 daemon prio=10 tid=0x00007f4e3800b800 nid=0x866 waiting for monitor entry [0x00007f4e844f7000]
java.lang.Thread.State: BLOCKED (on object monitor)
at org.apache.jsp.sync.sync_005fmethod_jsp.sleep(sync_005fmethod_jsp.java:20)
- waiting to lock 0x00000000e48a3a98 (a java.lang.Class for org.apache.jsp.sync.sync_005fmethod_jsp)
at org.apache.jsp.sync.sync_005fmethod_jsp._jspService(sync_005fmethod_jsp.java:96)
at org.apache.jasper.runtime.HttpJspBase.service(HttpJspBase.java:71)
at javax.servlet.http.HttpServlet.service(HttpServlet.java:728)
...
at org.apache.tomcat.util.threads.TaskThread$WrappingRunnable.run(TaskThread.java:61)
at java.lang.Thread.run(Thread.java:745)
http-bio-7080-exec-21 daemon prio=10 tid=0x00007f4e64009800 nid=0x868 waiting on condition [0x00007f4e842f5000]
java.lang.Thread.State: TIMED_WAITING (sleeping)
at java.lang.Thread.sleep(Native Method)
at org.apache.jsp.sync.sync_005fmethod_jsp.sleep(sync_005fmethod_jsp.java:21)
- locked 0x00000000e48a3a98 (a java.lang.Class for org.apache.jsp.sync.sync_005fmethod_jsp)
at org.apache.jsp.sync.sync_005fmethod_jsp._jspService(sync_005fmethod_jsp.java:96)
at org.apache.jasper.runtime.HttpJspBase.service(HttpJspBase.java:71)
at javax.servlet.http.HttpServlet.service(HttpServlet.java:728)
...
at org.apache.tomcat.util.threads.TaskThread$WrappingRunnable.run(TaskThread.java:61)
at java.lang.Thread.run(Thread.java:745)
VM Thread prio=10 tid=0x00007f4e98132000 nid=0x807 runnable
JNI global references: 426
쓰레드 이름
쓰레드 타입
우선순위 쓰레드 ID 쓰레드 상태
main thread
(Non-Daemon Thread)](https://image.slidesharecdn.com/jvm-230511085906-be6f1201/75/JVM_-pdf-242-2048.jpg)
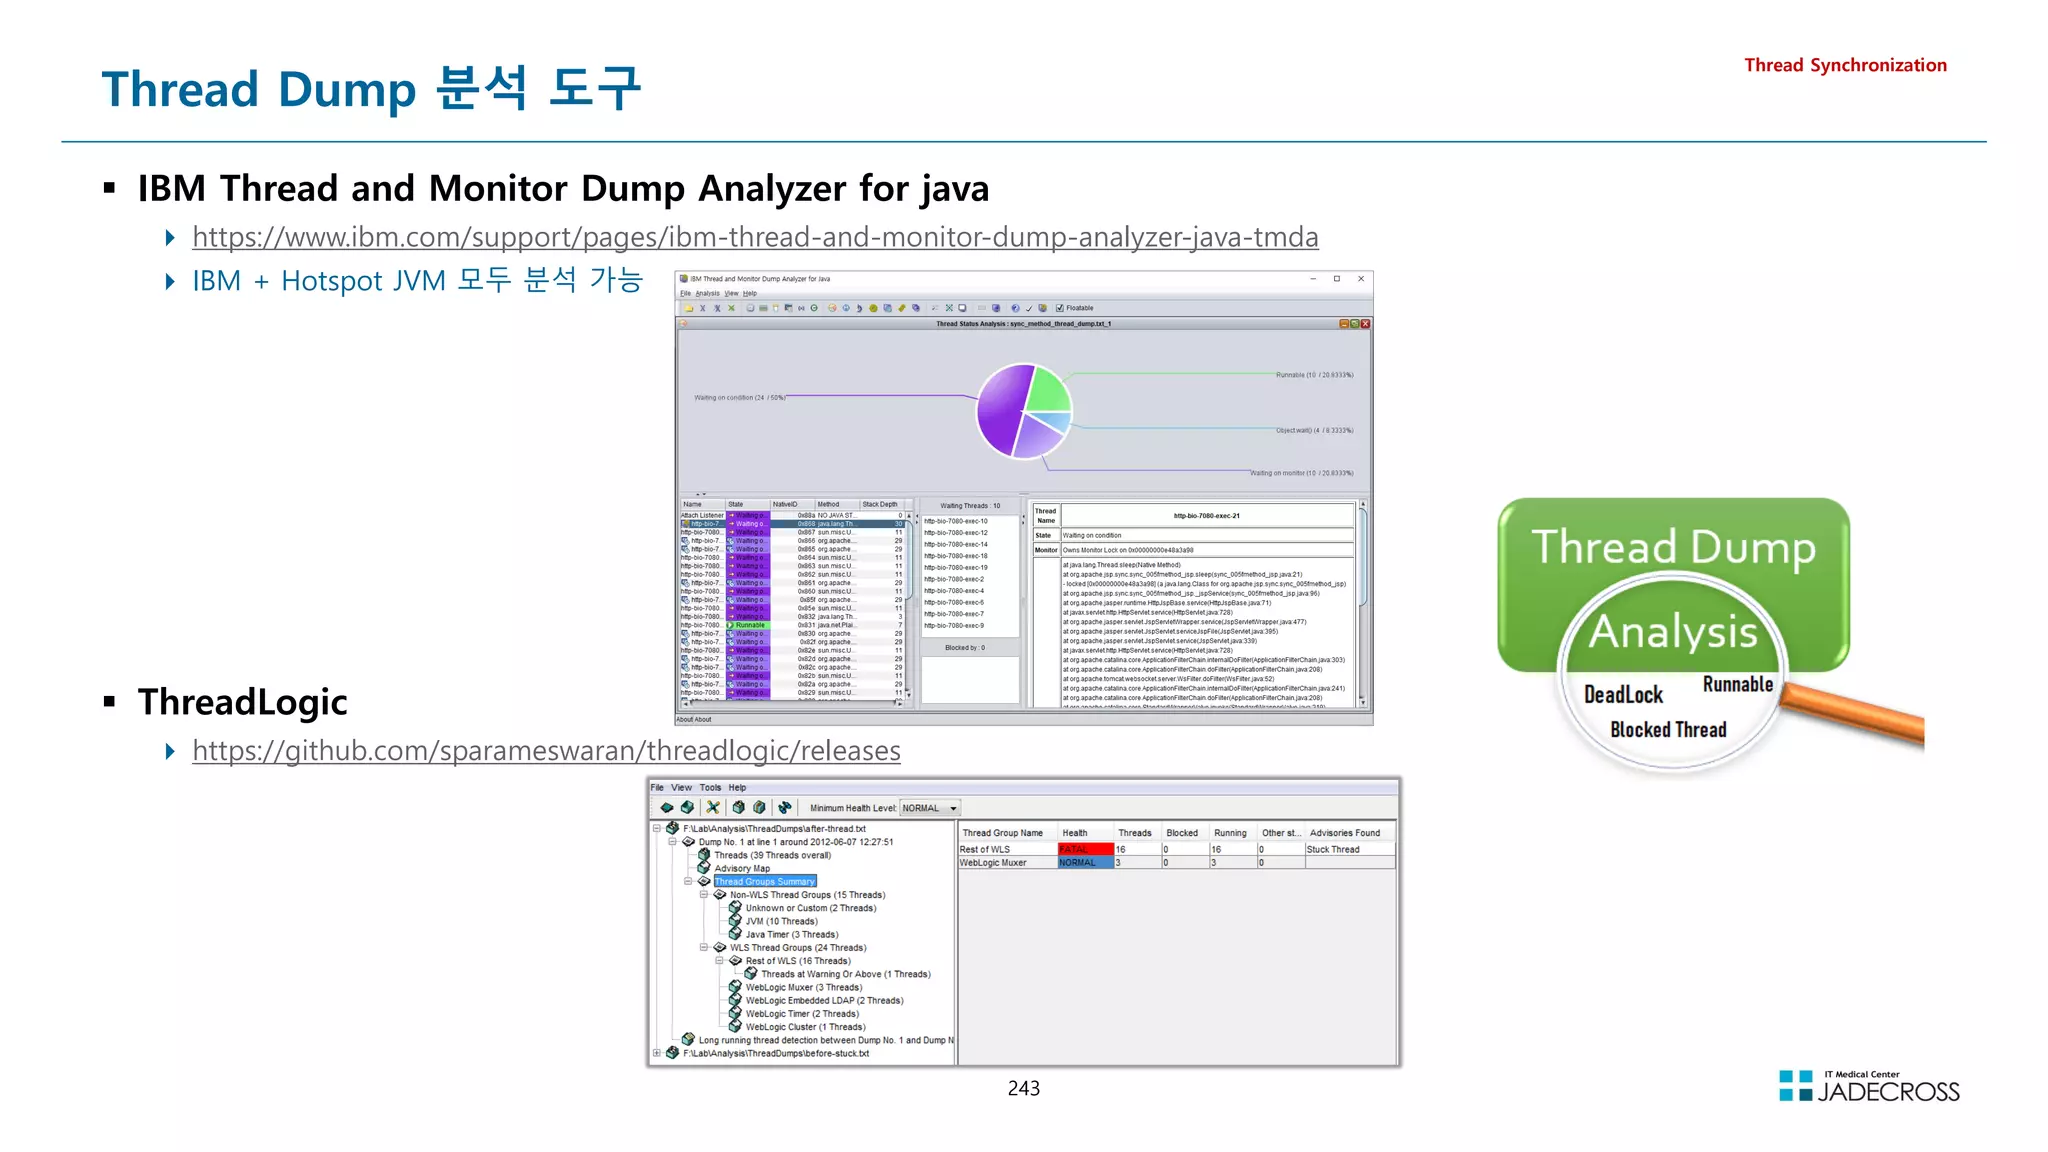
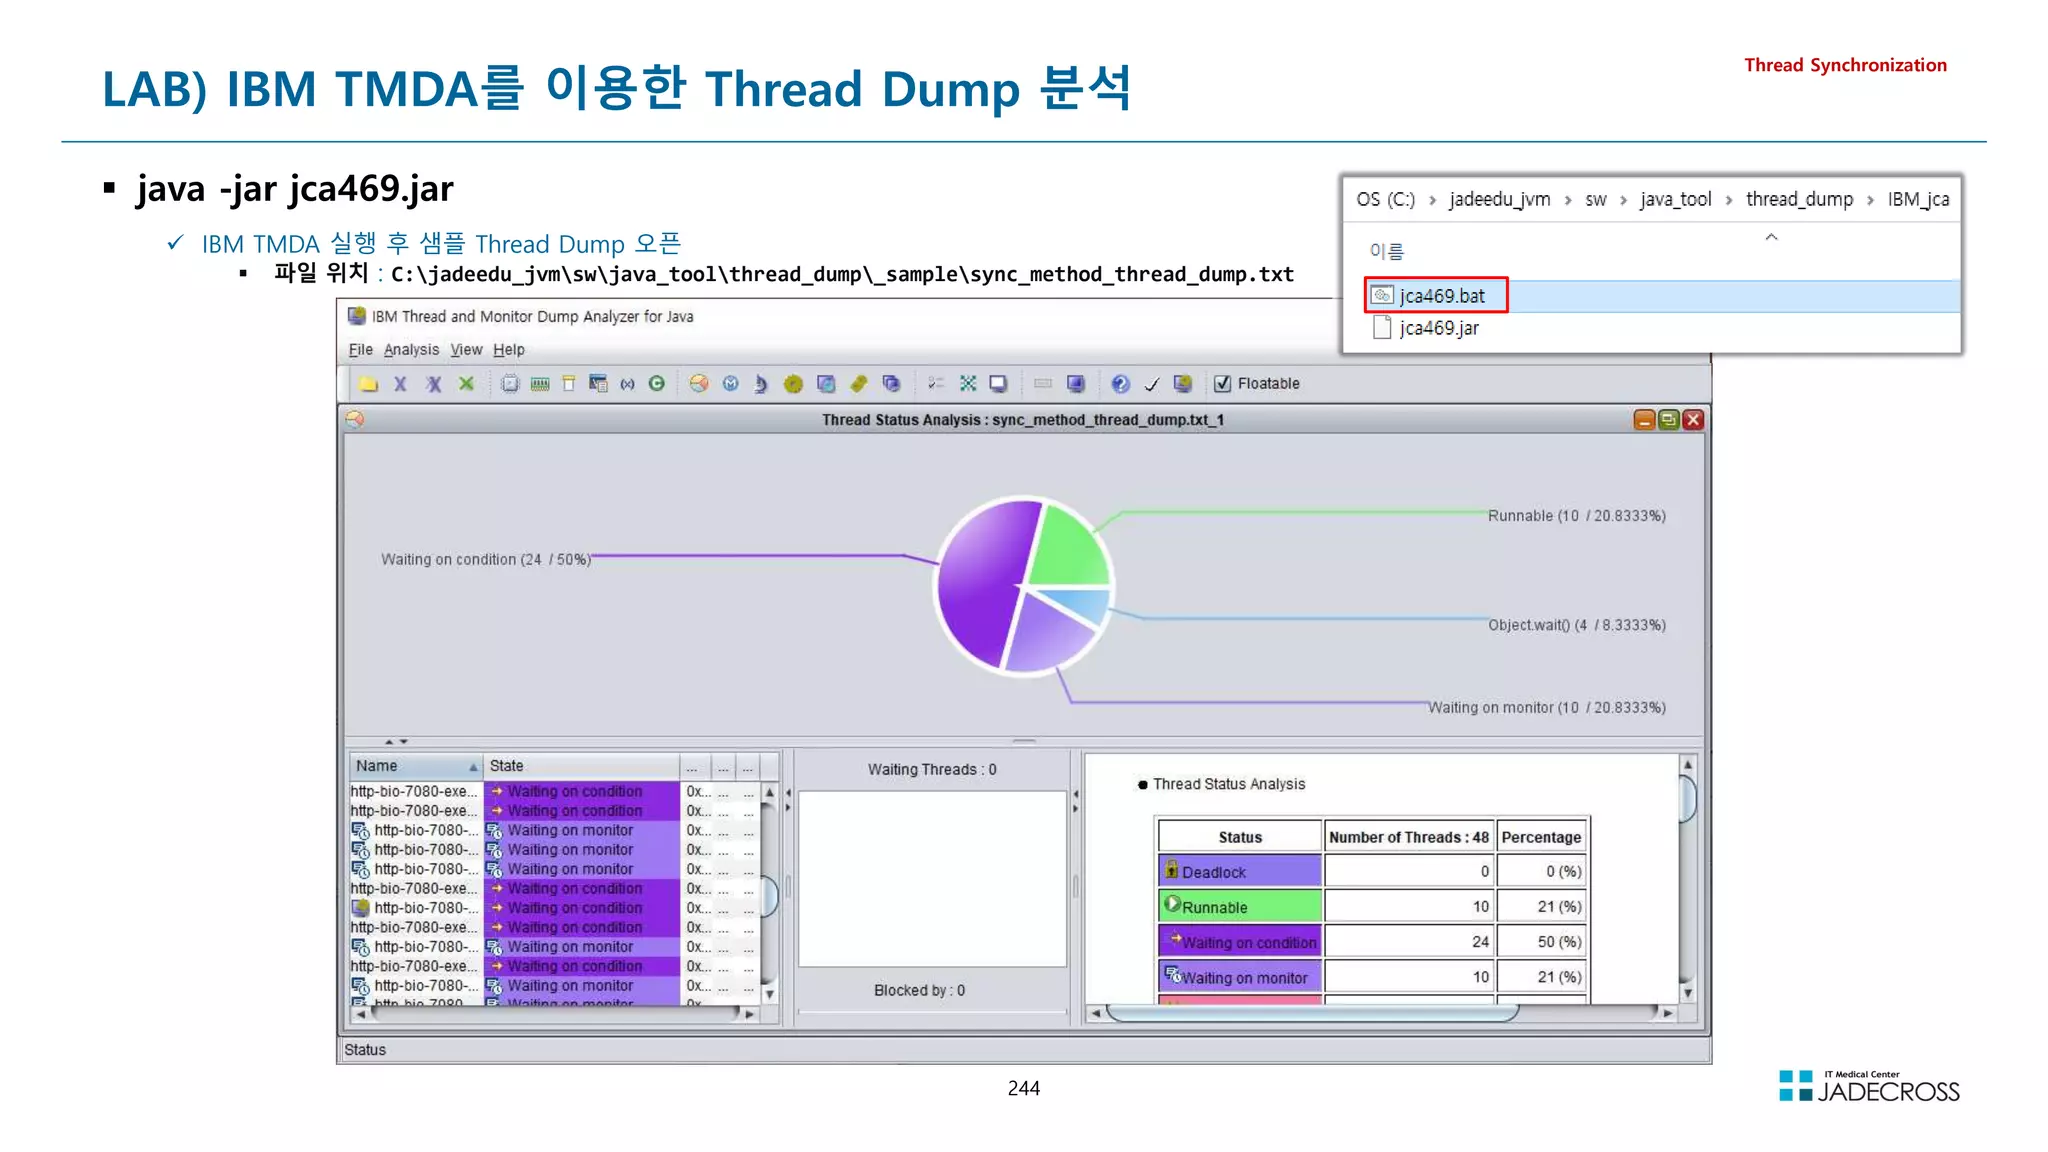
![245
Thread Dump 유형별 패턴 #1
BLOCKED - 락을 획득하지 못하는 경우
한 스레드가 락을 소유하고 있어 다른 스레드가 락을 획득하지 못해 애플리케이션의 전체적인 성능이 느려지는 경우
Thread Synchronization
http-bio-7080-exec-19 daemon prio=10 tid=0x00007f4e3800b800 nid=0x866 waiting for monitor entry [0x00007f4e844f7000]
java.lang.Thread.State: BLOCKED (on object monitor)
at org.apache.jsp.sync.sync_005fmethod_jsp.sleep(sync_005fmethod_jsp.java:20)
- waiting to lock 0x00000000e48a3a98 (a java.lang.Class for org.apache.jsp.sync.sync_005fmethod_jsp)
at org.apache.jsp.sync.sync_005fmethod_jsp._jspService(sync_005fmethod_jsp.java:96)
at org.apache.jasper.runtime.HttpJspBase.service(HttpJspBase.java:71)
at javax.servlet.http.HttpServlet.service(HttpServlet.java:728)
...
at org.apache.tomcat.util.threads.TaskThread$WrappingRunnable.run(TaskThread.java:61)
at java.lang.Thread.run(Thread.java:745)
http-bio-7080-exec-21 daemon prio=10 tid=0x00007f4e64009800 nid=0x868 waiting on condition [0x00007f4e842f5000]
java.lang.Thread.State: TIMED_WAITING (sleeping)
at java.lang.Thread.sleep(Native Method)
at org.apache.jsp.sync.sync_005fmethod_jsp.sleep(sync_005fmethod_jsp.java:21)
- locked 0x00000000e48a3a98 (a java.lang.Class for org.apache.jsp.sync.sync_005fmethod_jsp)
at org.apache.jsp.sync.sync_005fmethod_jsp._jspService(sync_005fmethod_jsp.java:96)
at org.apache.jasper.runtime.HttpJspBase.service(HttpJspBase.java:71)
at javax.servlet.http.HttpServlet.service(HttpServlet.java:728)
...
at org.apache.tomcat.util.threads.TaskThread$WrappingRunnable.run(TaskThread.java:61)
at java.lang.Thread.run(Thread.java:745)](https://image.slidesharecdn.com/jvm-230511085906-be6f1201/75/JVM_-pdf-245-2048.jpg)
![246
Thread Dump 유형별 패턴 #2
RUNNABLE - 원격 서버로부터 메시지 수신을 받기 위해 계속 대기하는 경우
쓰레드 상태는 RUNNABLE이지만 원격서버에 소켓통신시 응답 지연으로 Worker Thread가 부족해지는 경우
대부분 Top Stack이 “at java.net.SocketInputStream.socketRead0(Native Method)” 프레임이다.
Thread Synchronization
http-bio-7080-exec-24 daemon prio=10 tid=0x00007f71c0002000 nid=0x706 runnable [0x00007f716afec000]
java.lang.Thread.State: RUNNABLE
at java.net.SocketInputStream.socketRead0(Native Method)
at java.net.SocketInputStream.read(SocketInputStream.java:152)
at java.net.SocketInputStream.read(SocketInputStream.java:122)
at com.mysql.jdbc.util.ReadAheadInputStream.fill(ReadAheadInputStream.java:101)
at com.mysql.jdbc.util.ReadAheadInputStream.readFromUnderlyingStreamIfNecessary(ReadAheadInputStream.java:144)
at com.mysql.jdbc.util.ReadAheadInputStream.read(ReadAheadInputStream.java:174)
- locked 0x00000000fa627c18 (a com.mysql.jdbc.util.ReadAheadInputStream)
at com.mysql.jdbc.MysqlIO.readFully(MysqlIO.java:2966)
at com.mysql.jdbc.MysqlIO.reuseAndReadPacket(MysqlIO.java:3427)
at com.mysql.jdbc.MysqlIO.reuseAndReadPacket(MysqlIO.java:3417)
at com.mysql.jdbc.MysqlIO.checkErrorPacket(MysqlIO.java:3860)
at com.mysql.jdbc.MysqlIO.sendCommand(MysqlIO.java:2524)
at com.mysql.jdbc.MysqlIO.sqlQueryDirect(MysqlIO.java:2675)
at com.mysql.jdbc.ConnectionImpl.execSQL(ConnectionImpl.java:2465)
- locked 0x00000000fada1050 (a com.mysql.jdbc.JDBC4Connection)
at com.mysql.jdbc.PreparedStatement.executeInternal(PreparedStatement.java:1915)
- locked 0x00000000fada1050 (a com.mysql.jdbc.JDBC4Connection)
at com.mysql.jdbc.PreparedStatement.executeQuery(PreparedStatement.java:2023)
- locked 0x00000000fada1050 (a com.mysql.jdbc.JDBC4Connection)
at org.apache.tomcat.dbcp.dbcp.DelegatingPreparedStatement.executeQuery(DelegatingPreparedStatement.java:99)
at org.apache.tomcat.dbcp.dbcp.DelegatingPreparedStatement.executeQuery(DelegatingPreparedStatement.java:99)
at org.apache.jsp.sleep.db_005fsleep_jsp._jspService(db_005fsleep_jsp.java:116)
at org.apache.jasper.runtime.HttpJspBase.service(HttpJspBase.java:71)
at javax.servlet.http.HttpServlet.service(HttpServlet.java:728)
...
at org.apache.tomcat.util.threads.TaskThread$WrappingRunnable.run(TaskThread.java:61)
at java.lang.Thread.run(Thread.java:745)](https://image.slidesharecdn.com/jvm-230511085906-be6f1201/75/JVM_-pdf-246-2048.jpg)
![247
Thread Dump 유형별 패턴 #3
WAITING - 공유리소스를 Pool로 관리할때 Pool 안의 객체가 부족할 때 대기하는 경우
DBCP(DataBase Connection Pool) 사용중 여유 DB Connection이 부족하면 Connection을 얻기 위해 대기하게 됨
대부분 Top Stack이 “at java.lang.Object.wait(Native Method)” 프레임
Thread Synchronization
http-bio-7080-exec-26 daemon prio=10 tid=0x00007f7190009000 nid=0x708 in Object.wait() [0x00007f716adeb000]
java.lang.Thread.State: WAITING (on object monitor)
at java.lang.Object.wait(Native Method)
- waiting on 0x00000000f705e740 (a org.apache.tomcat.dbcp.pool.impl.GenericObjectPool$Latch)
at java.lang.Object.wait(Object.java:503)
at org.apache.tomcat.dbcp.pool.impl.GenericObjectPool.borrowObject(GenericObjectPool.java:1128)
- locked 0x00000000f705e740 (a org.apache.tomcat.dbcp.pool.impl.GenericObjectPool$Latch)
at org.apache.tomcat.dbcp.dbcp.PoolingDataSource.getConnection(PoolingDataSource.java:115)
at org.apache.tomcat.dbcp.dbcp.BasicDataSource.getConnection(BasicDataSource.java:1103)
at org.apache.jsp.sleep.db_005fsleep_jsp._jspService(db_005fsleep_jsp.java:111)
at org.apache.jasper.runtime.HttpJspBase.service(HttpJspBase.java:71)
at javax.servlet.http.HttpServlet.service(HttpServlet.java:728)
...
at java.util.concurrent.ThreadPoolExecutor$Worker.run(ThreadPoolExecutor.java:615)
at org.apache.tomcat.util.threads.TaskThread$WrappingRunnable.run(TaskThread.java:61)
at java.lang.Thread.run(Thread.java:745)](https://image.slidesharecdn.com/jvm-230511085906-be6f1201/75/JVM_-pdf-247-2048.jpg)
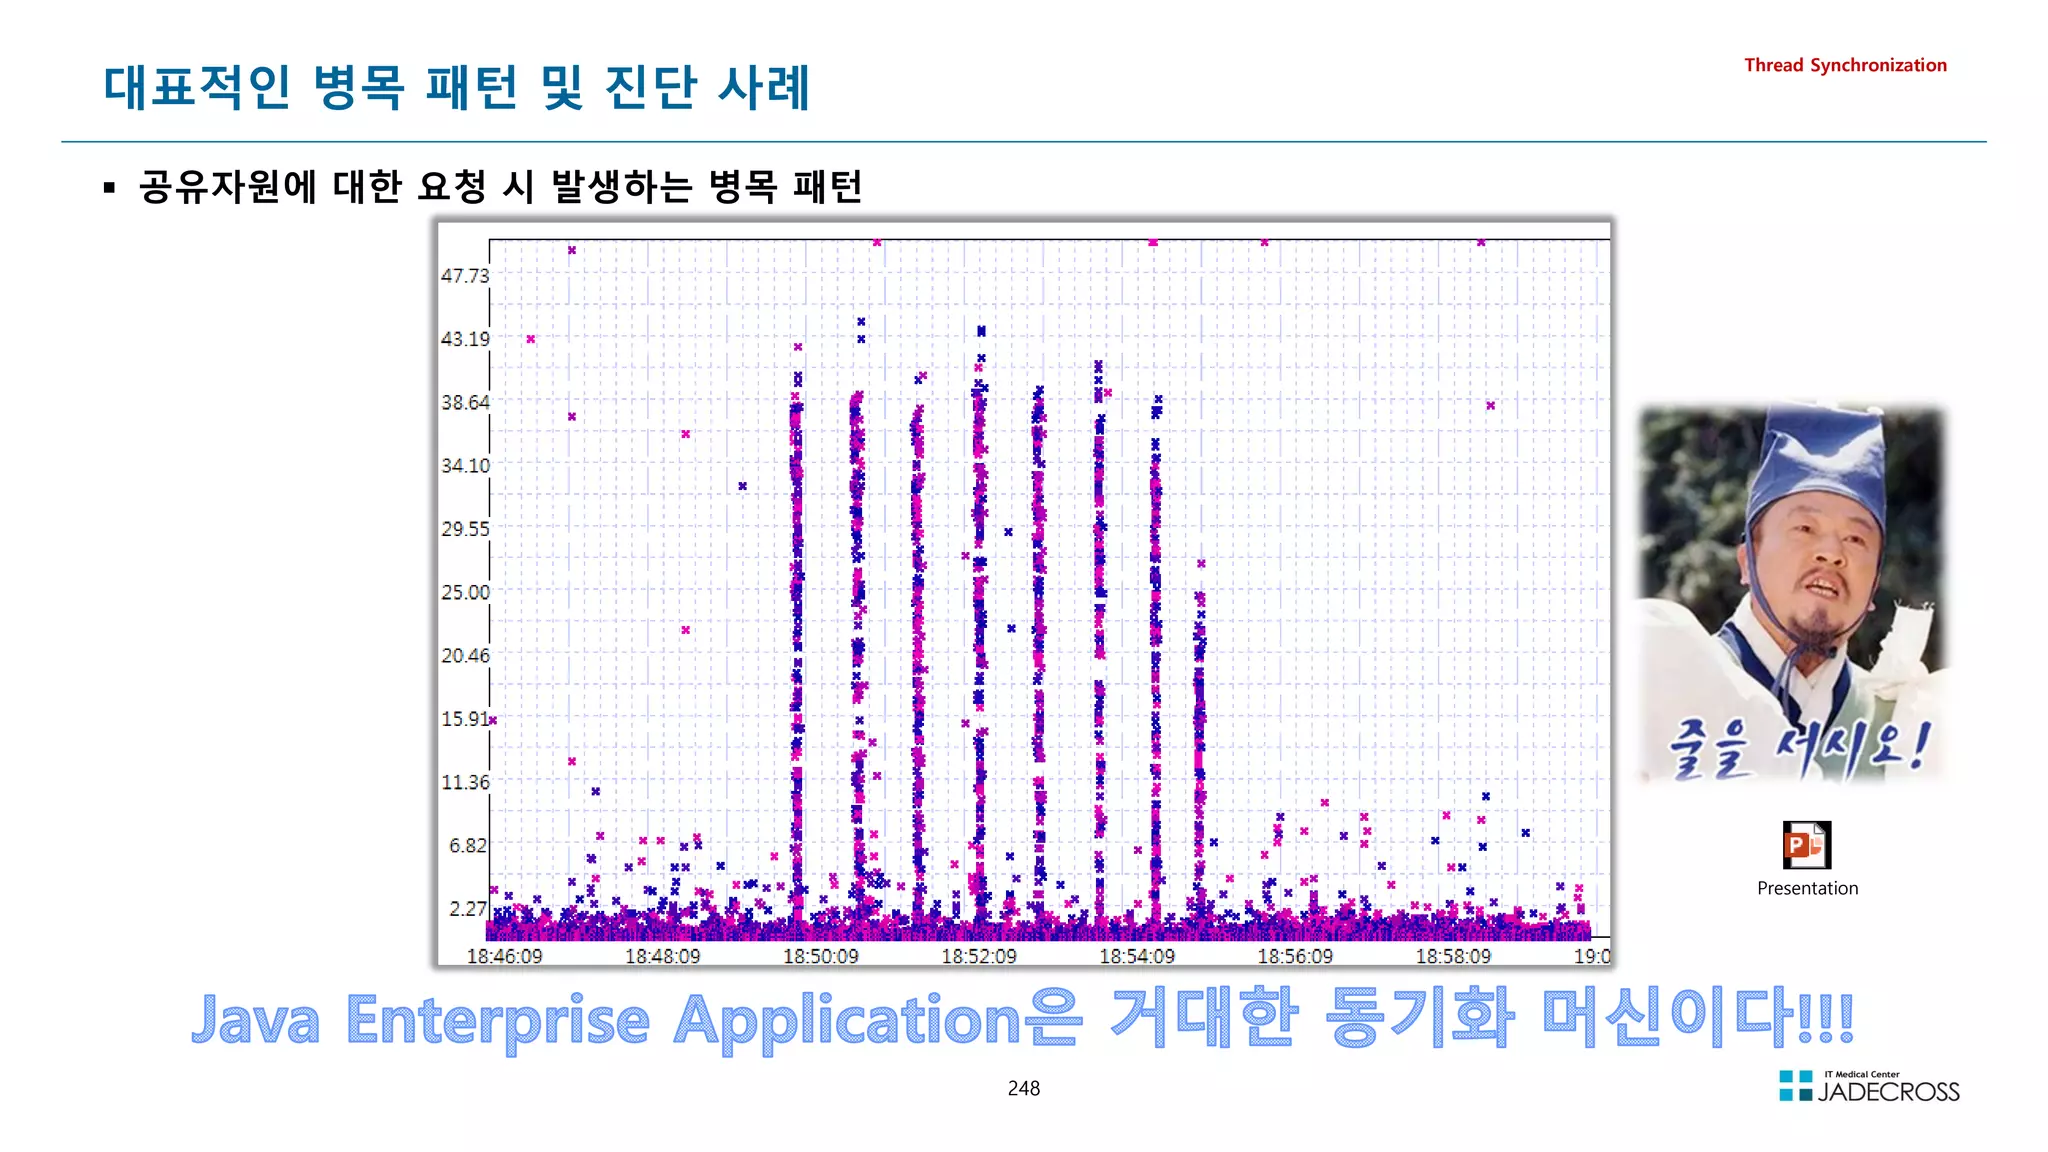
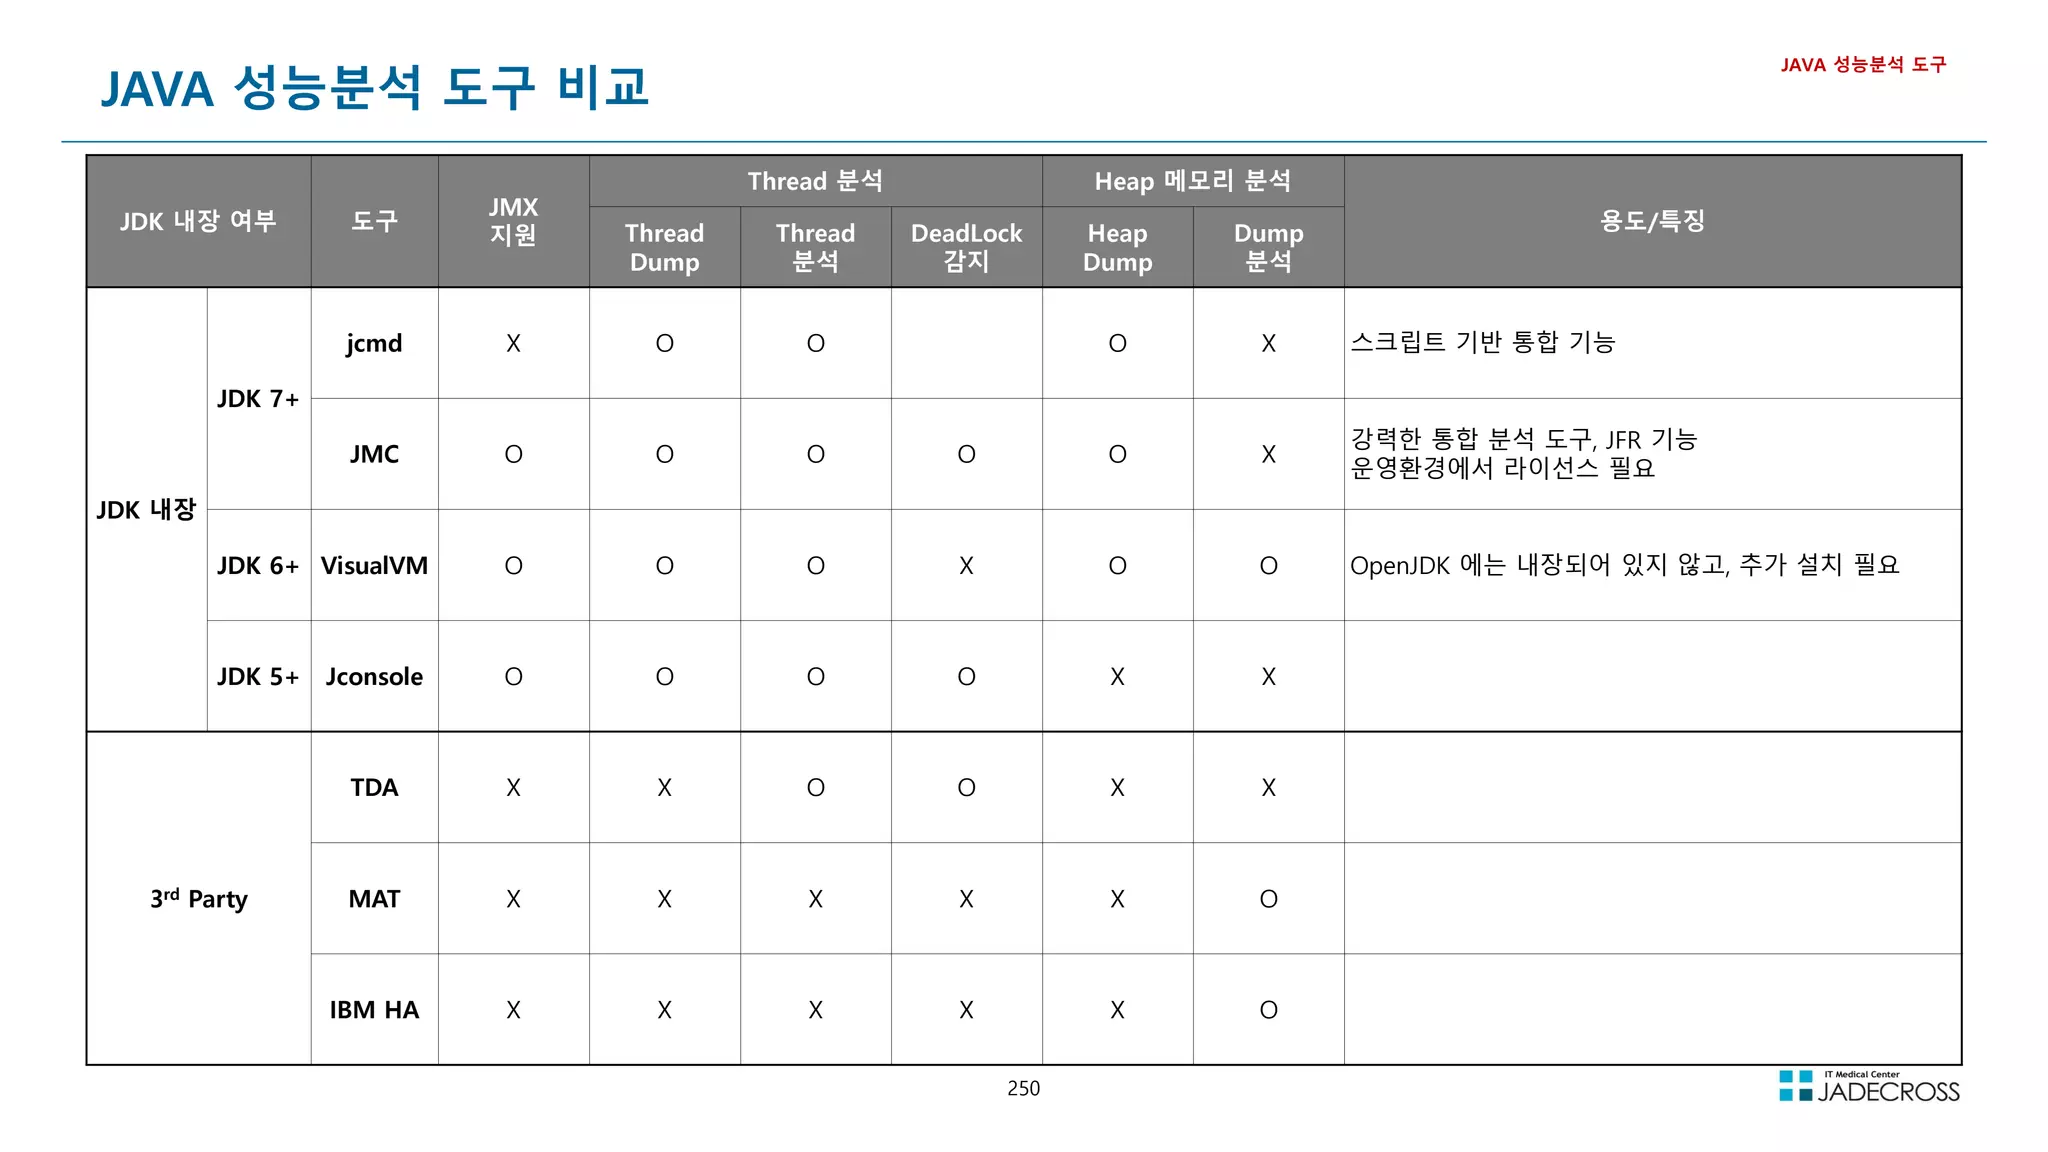
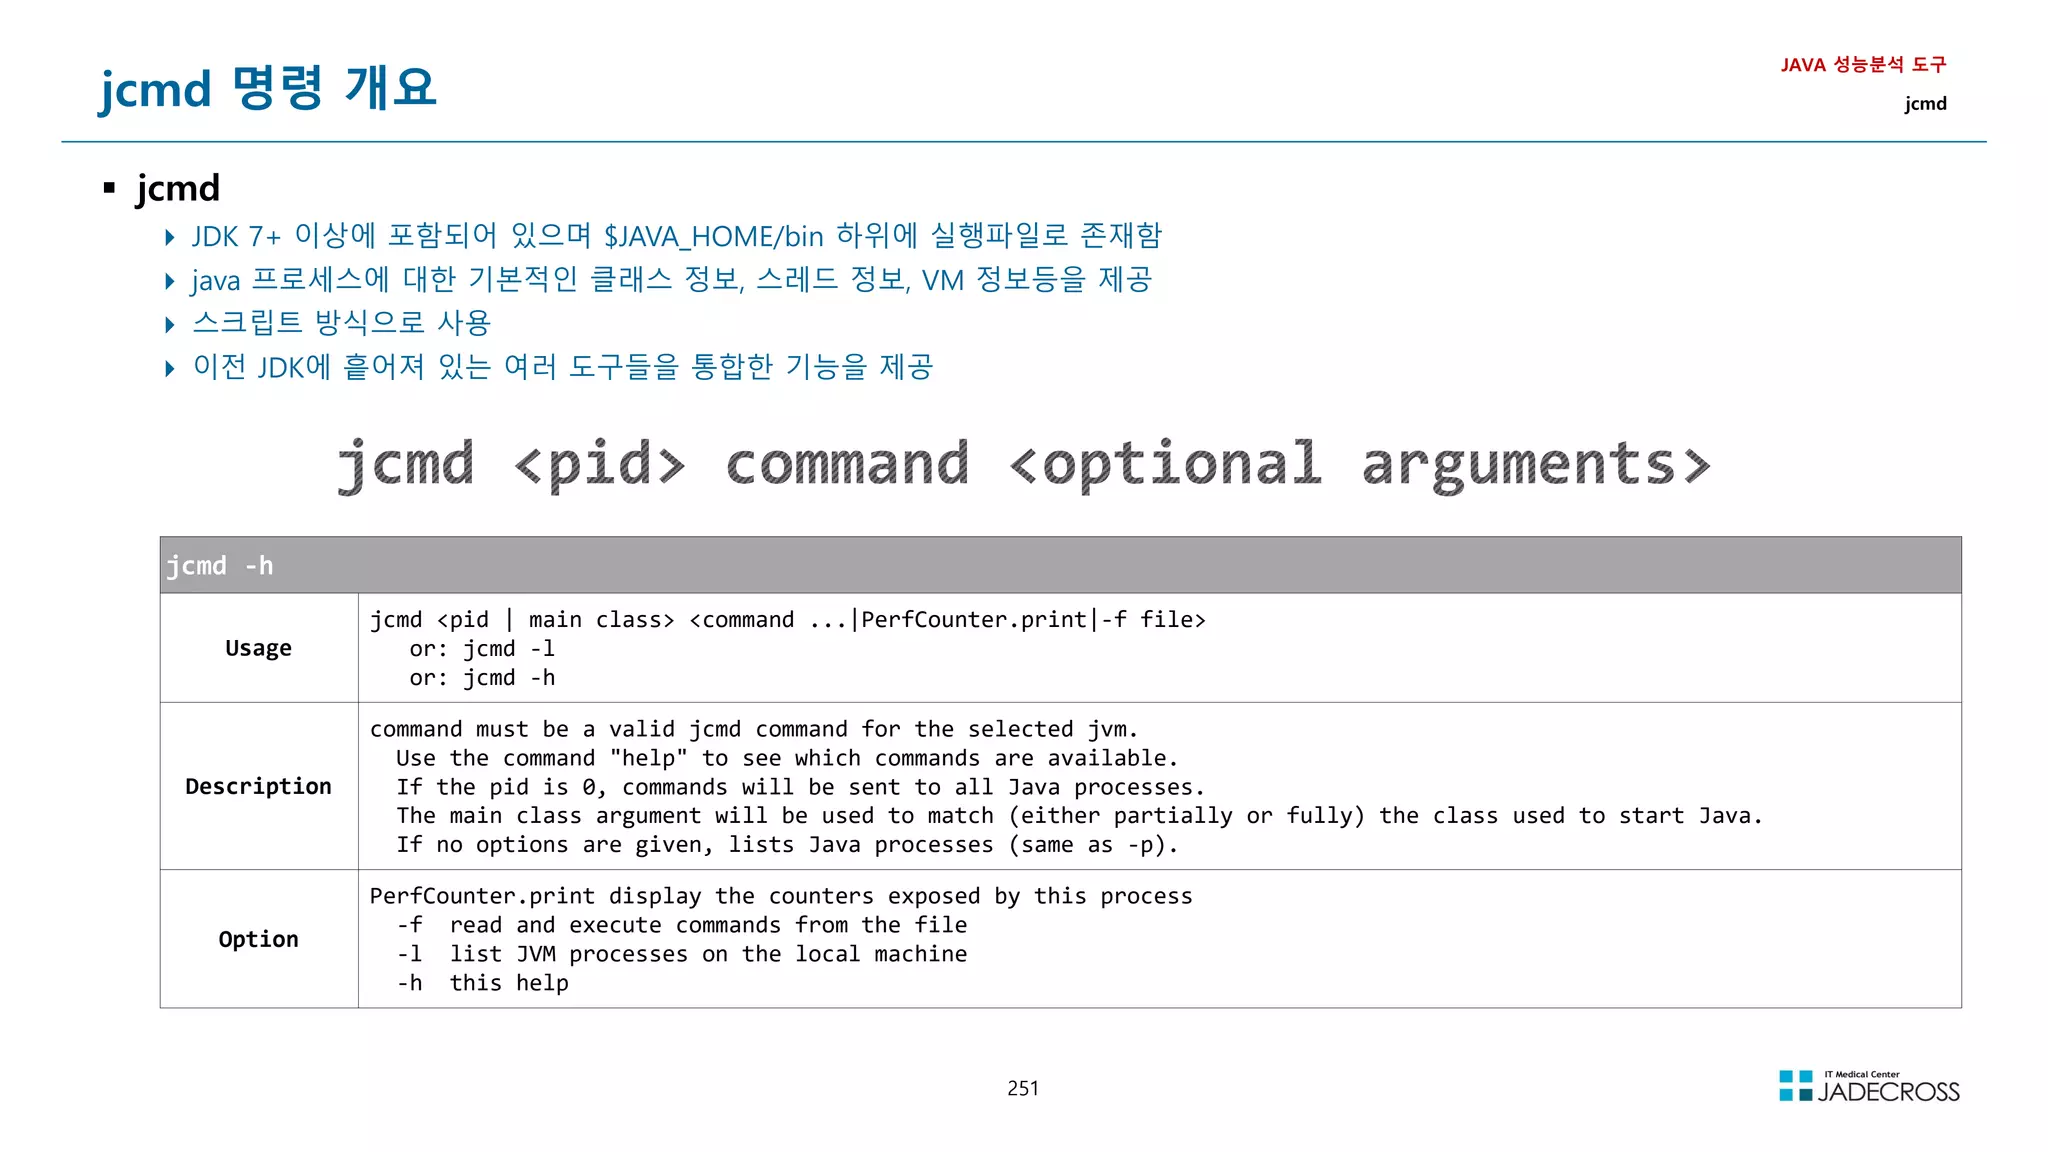
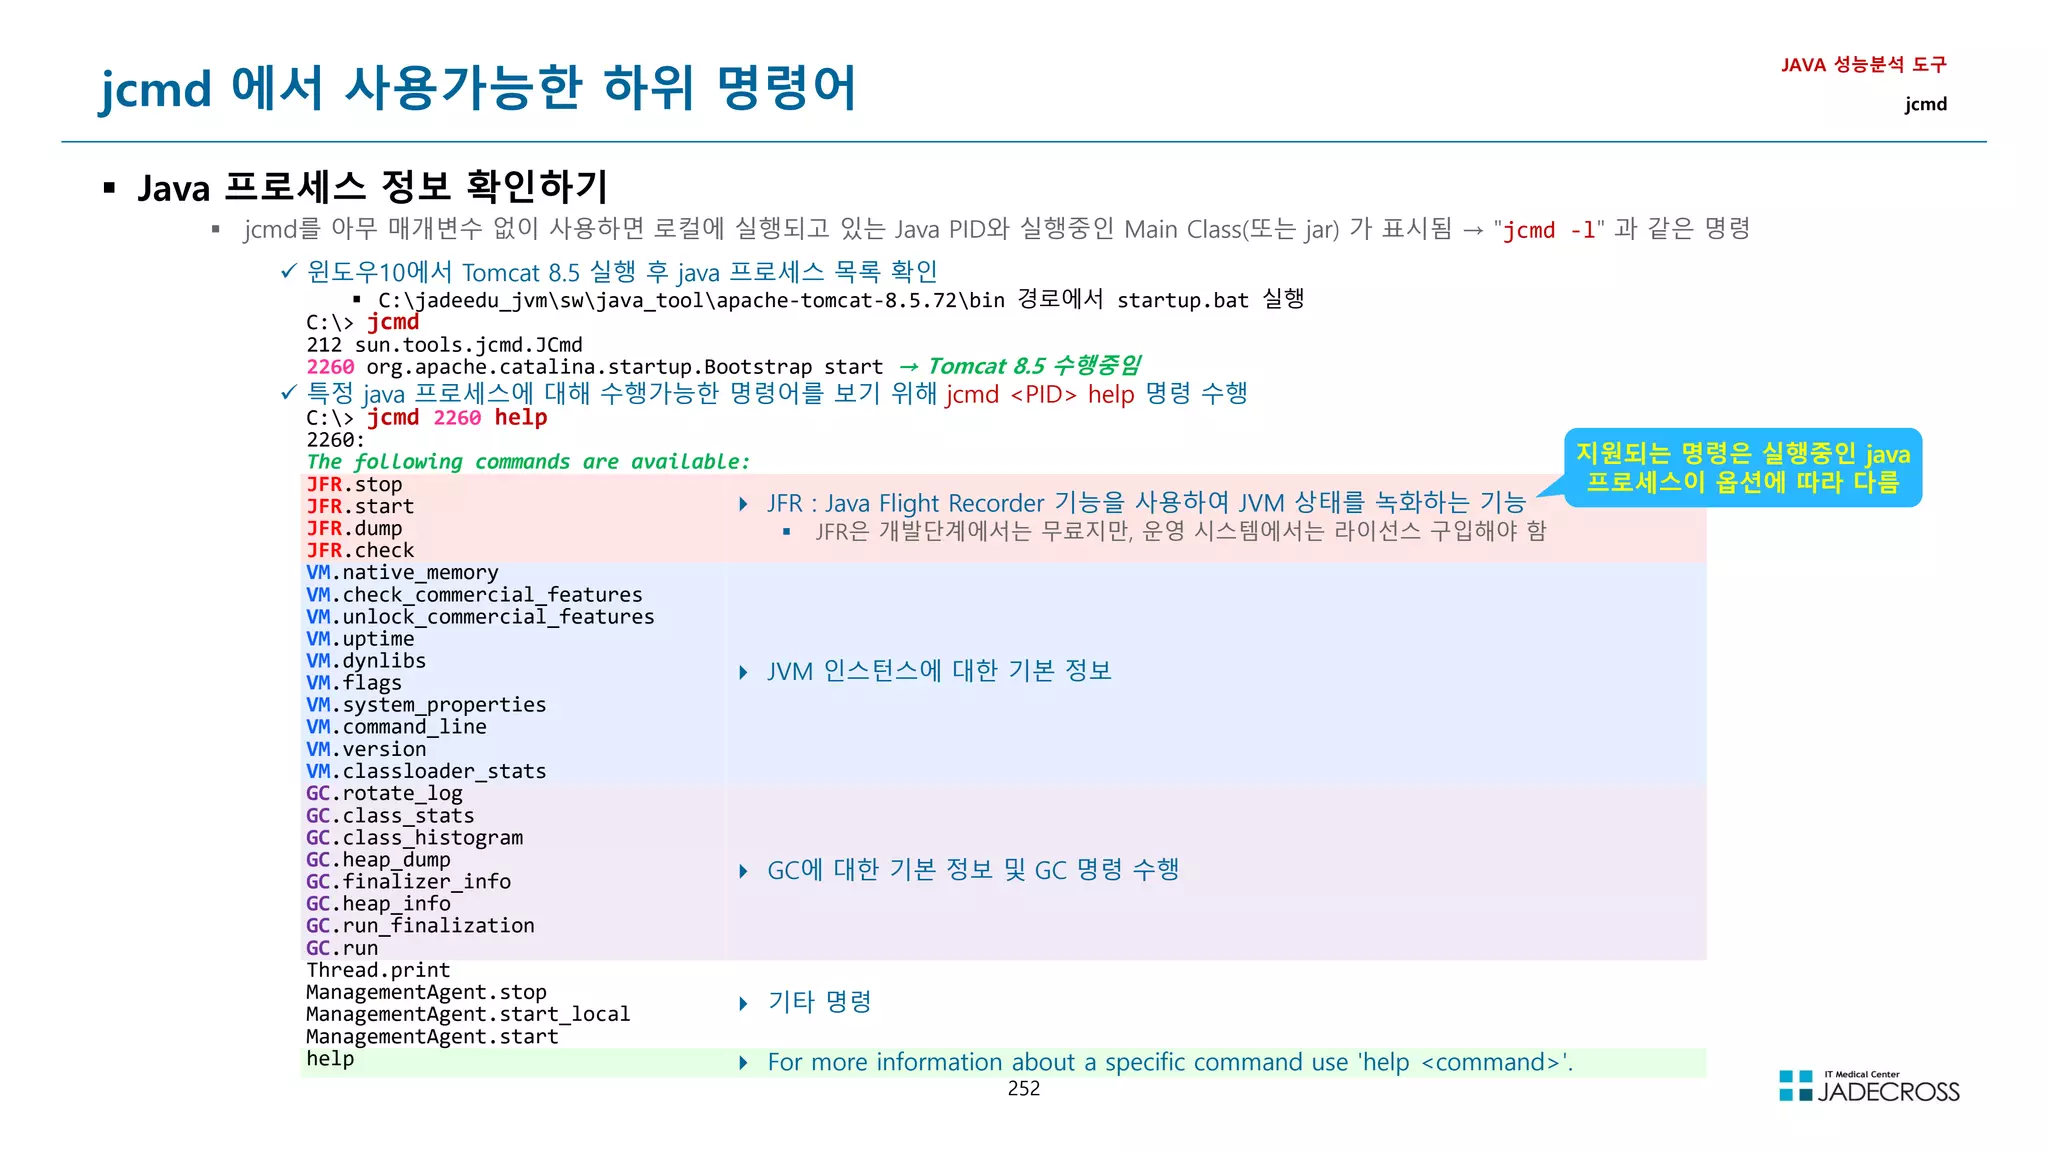
![253
jcmd 하위 명령어 도움말 보기
jcmd pid help sub-command
JAVA 성능분석 도구
jcmd
VM.uptime 명령어의 도움말을 출력해보고 사용방법을 숙지한 후 명령을 수행하여 java 프로세스의 수행시간을 확인해 보자
C:jcmd 2260 help VM.uptime
2260:
VM.uptime
Print VM uptime.
Impact: Low
Syntax : VM.uptime [options]
Options: (options must be specified using the key or key=value syntax)
-date : [optional] Add a prefix with current date (BOOLEAN, false)
C:jcmd 2260 VM.uptime
2260:
1699.678 s](https://image.slidesharecdn.com/jvm-230511085906-be6f1201/75/JVM_-pdf-253-2048.jpg)
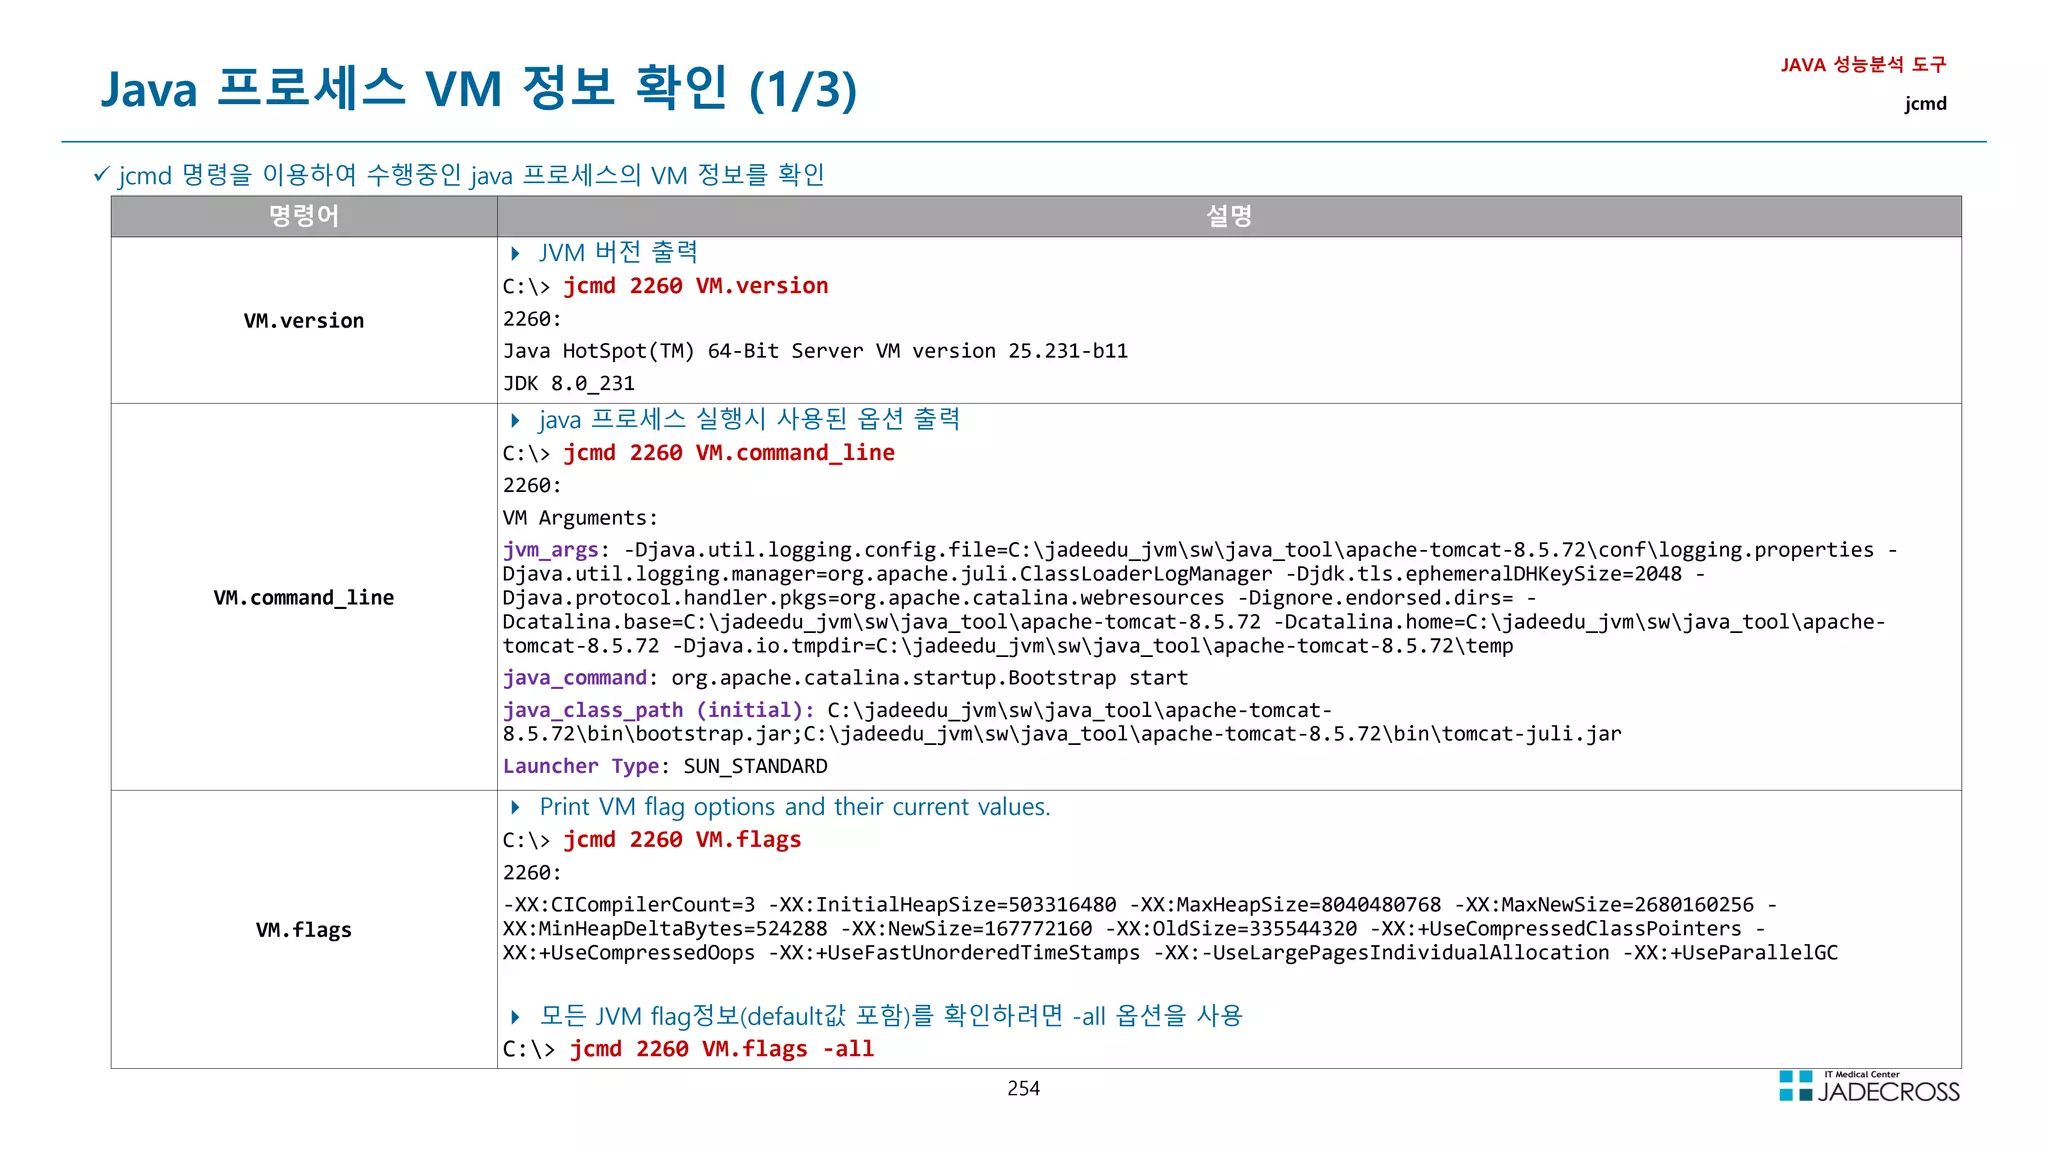
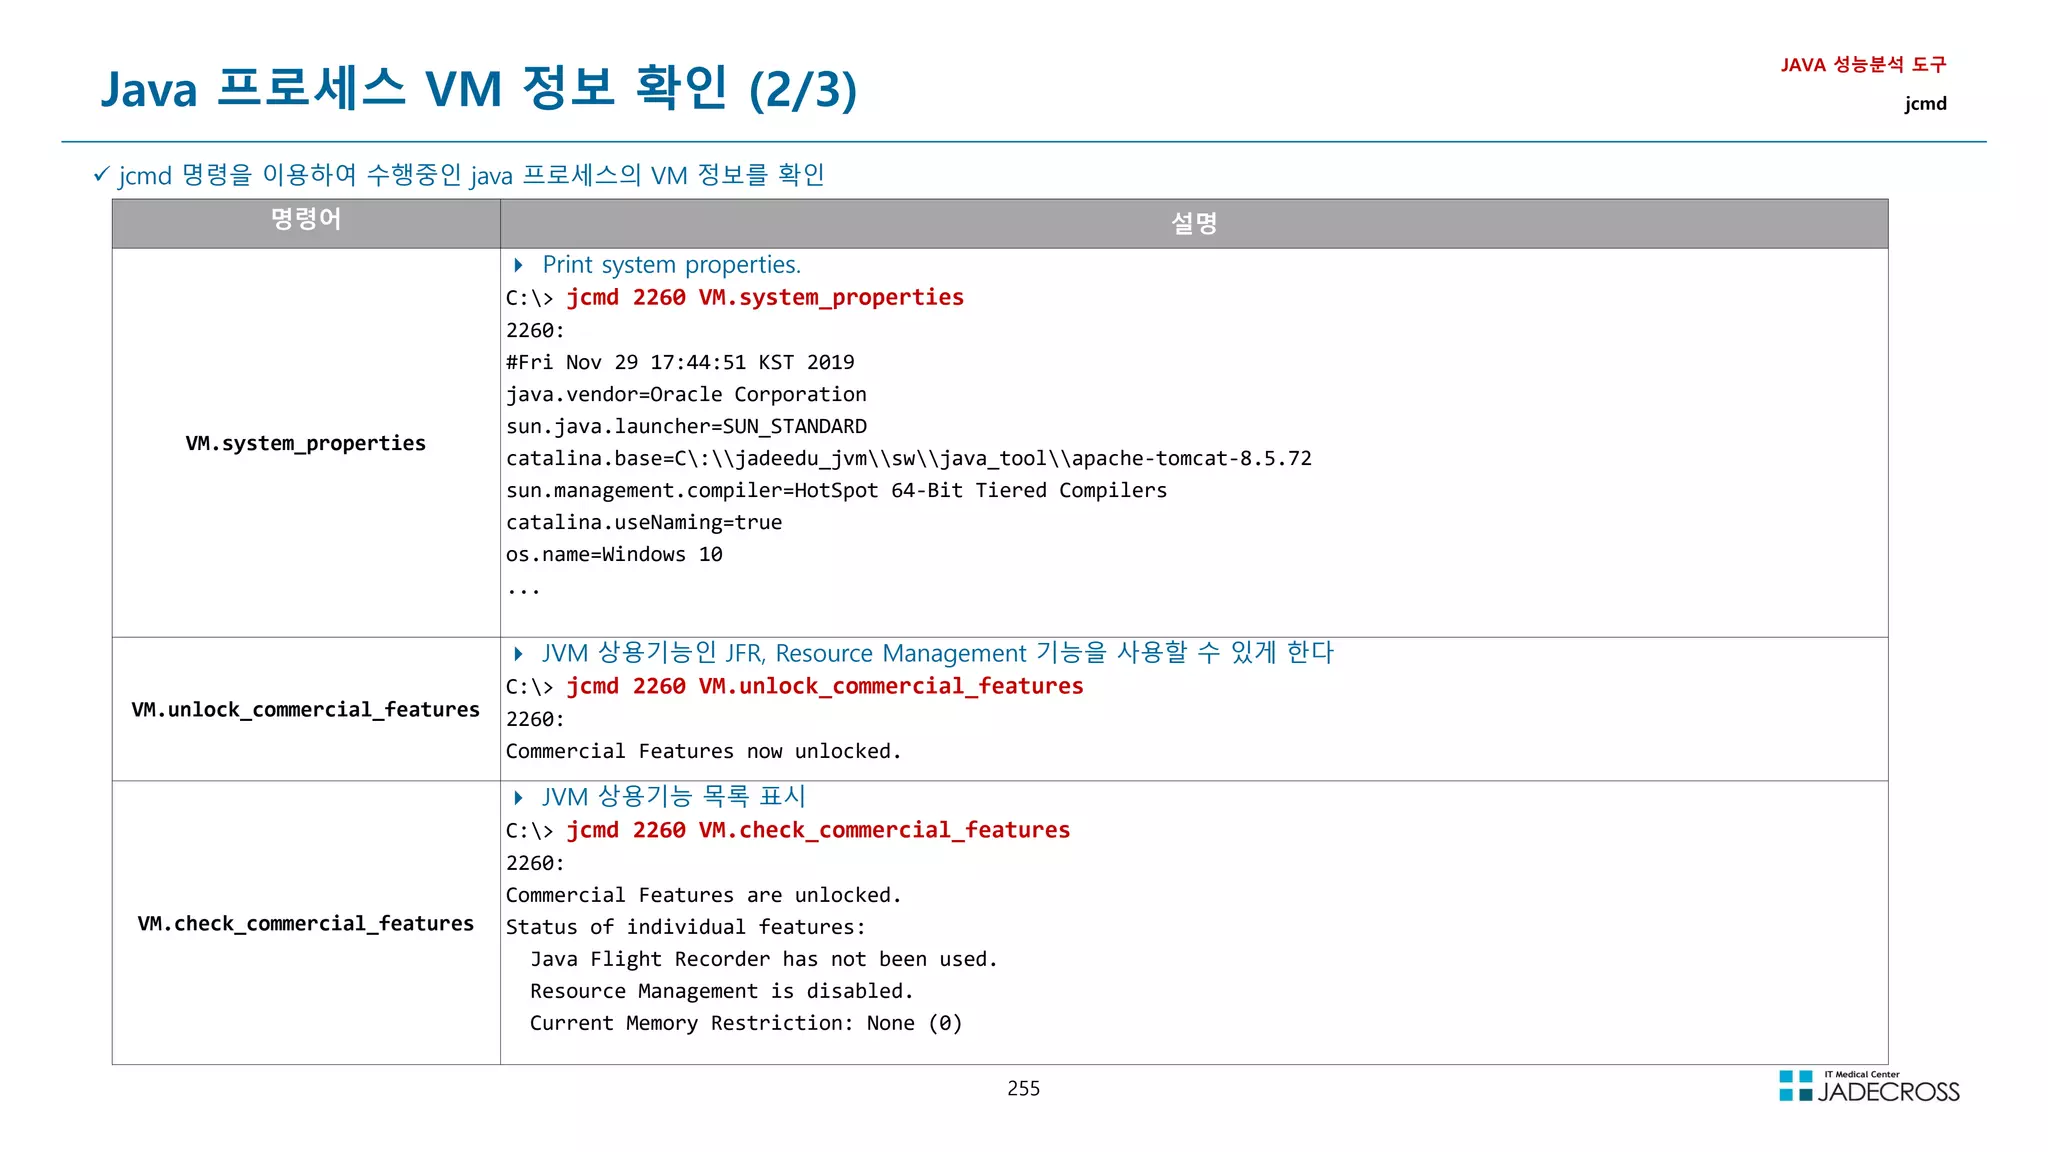
![256
Java 프로세스 VM 정보 확인 (3/3)
JAVA 성능분석 도구
jcmd
jcmd 명령을 이용하여 수행중인 java 프로세스의 VM 정보를 확인
명령어 설명
VM.dynlibs
Print loaded dynamic libraries
C: jcmd 2260 VM.dynlibs
2260:
Dynamic libraries:
0x00007ff7173f0000 - 0x00007ff717427000 C:jadeedu_jvmswjava_tooljdk1.8.0_281binjava.exe
0x00007ffe18f60000 - 0x00007ffe19150000 C:WINDOWSSYSTEM32ntdll.dll
0x00007ffe17010000 - 0x00007ffe170c2000 C:WINDOWSSystem32KERNEL32.DLL
0x00007ffe16670000 - 0x00007ffe16913000 C:WINDOWSSystem32KERNELBASE.dll
...
VM.native_memory
Print native memory usage
C: jcmd 2260 help VM.native_memory
2260:
VM.native_memory
Print native memory usage
Impact: Medium
Permission: java.lang.management.ManagementPermission(monitor)
Syntax : VM.native_memory [options]
Options: (options must be specified using the key or key=value syntax)
summary : [optional] request runtime to report current memory summary, which includes total reserved and committed memory, along
with memory usage summary by each subsytem. (BOOLEAN, false)
detail : [optional] request runtime to report memory allocation = 1K by each callsite. (BOOLEAN, false)
baseline : [optional] request runtime to baseline current memory usage, so it can be compared against in later time. (BOOLEAN,
false)
summary.diff : [optional] request runtime to report memory summary comparison against previous baseline. (BOOLEAN, false)
detail.diff : [optional] request runtime to report memory detail comparison against previous baseline, which shows the memory
allocation activities at different callsites. (BOOLEAN, false)
shutdown : [optional] request runtime to shutdown itself and free the memory used by runtime. (BOOLEAN, false)
statistics : [optional] print tracker statistics for tuning purpose. (BOOLEAN, false)
scale : [optional] Memory usage in which scale, KB, MB or GB (STRING, KB)](https://image.slidesharecdn.com/jvm-230511085906-be6f1201/75/JVM_-pdf-256-2048.jpg)
![257
Java 프로세스 Thread 정보 확인
JAVA 성능분석 도구
jcmd
jcmd 명령을 이용하여 수행중인 java 프로세스의 Thread 정보를 확인 → Thread Dump 내용 출력
명령어 설명
Thread.print
Print all threads with stacktraces.
C: jcmd 2260 Thread.print
2260:
2019-11-29 18:15:00
Full thread dump Java HotSpot(TM) 64-Bit Server VM (25.201-b09 mixed mode):
ajp-nio-8009-AsyncTimeout #47 daemon prio=5 os_prio=0 tid=0x000000002cf58800 nid=0x1320 waiting on condition [0x000000003253f000]
java.lang.Thread.State: TIMED_WAITING (sleeping)
at java.lang.Thread.sleep(Native Method)
at org.apache.coyote.AbstractProtocol$AsyncTimeout.run(AbstractProtocol.java:1154)
at java.lang.Thread.run(Thread.java:748)
ajp-nio-8009-Acceptor-0 #46 daemon prio=5 os_prio=0 tid=0x000000002cf54800 nid=0xbcc runnable [0x000000003243f000]
java.lang.Thread.State: RUNNABLE
at sun.nio.ch.ServerSocketChannelImpl.accept0(Native Method)
at sun.nio.ch.ServerSocketChannelImpl.accept(ServerSocketChannelImpl.java:422)
at sun.nio.ch.ServerSocketChannelImpl.accept(ServerSocketChannelImpl.java:250)
- locked 0x00000005c1cc6640 (a java.lang.Object)
at org.apache.tomcat.util.net.NioEndpoint$Acceptor.run(NioEndpoint.java:482)
at java.lang.Thread.run(Thread.java:748)
...](https://image.slidesharecdn.com/jvm-230511085906-be6f1201/75/JVM_-pdf-257-2048.jpg)
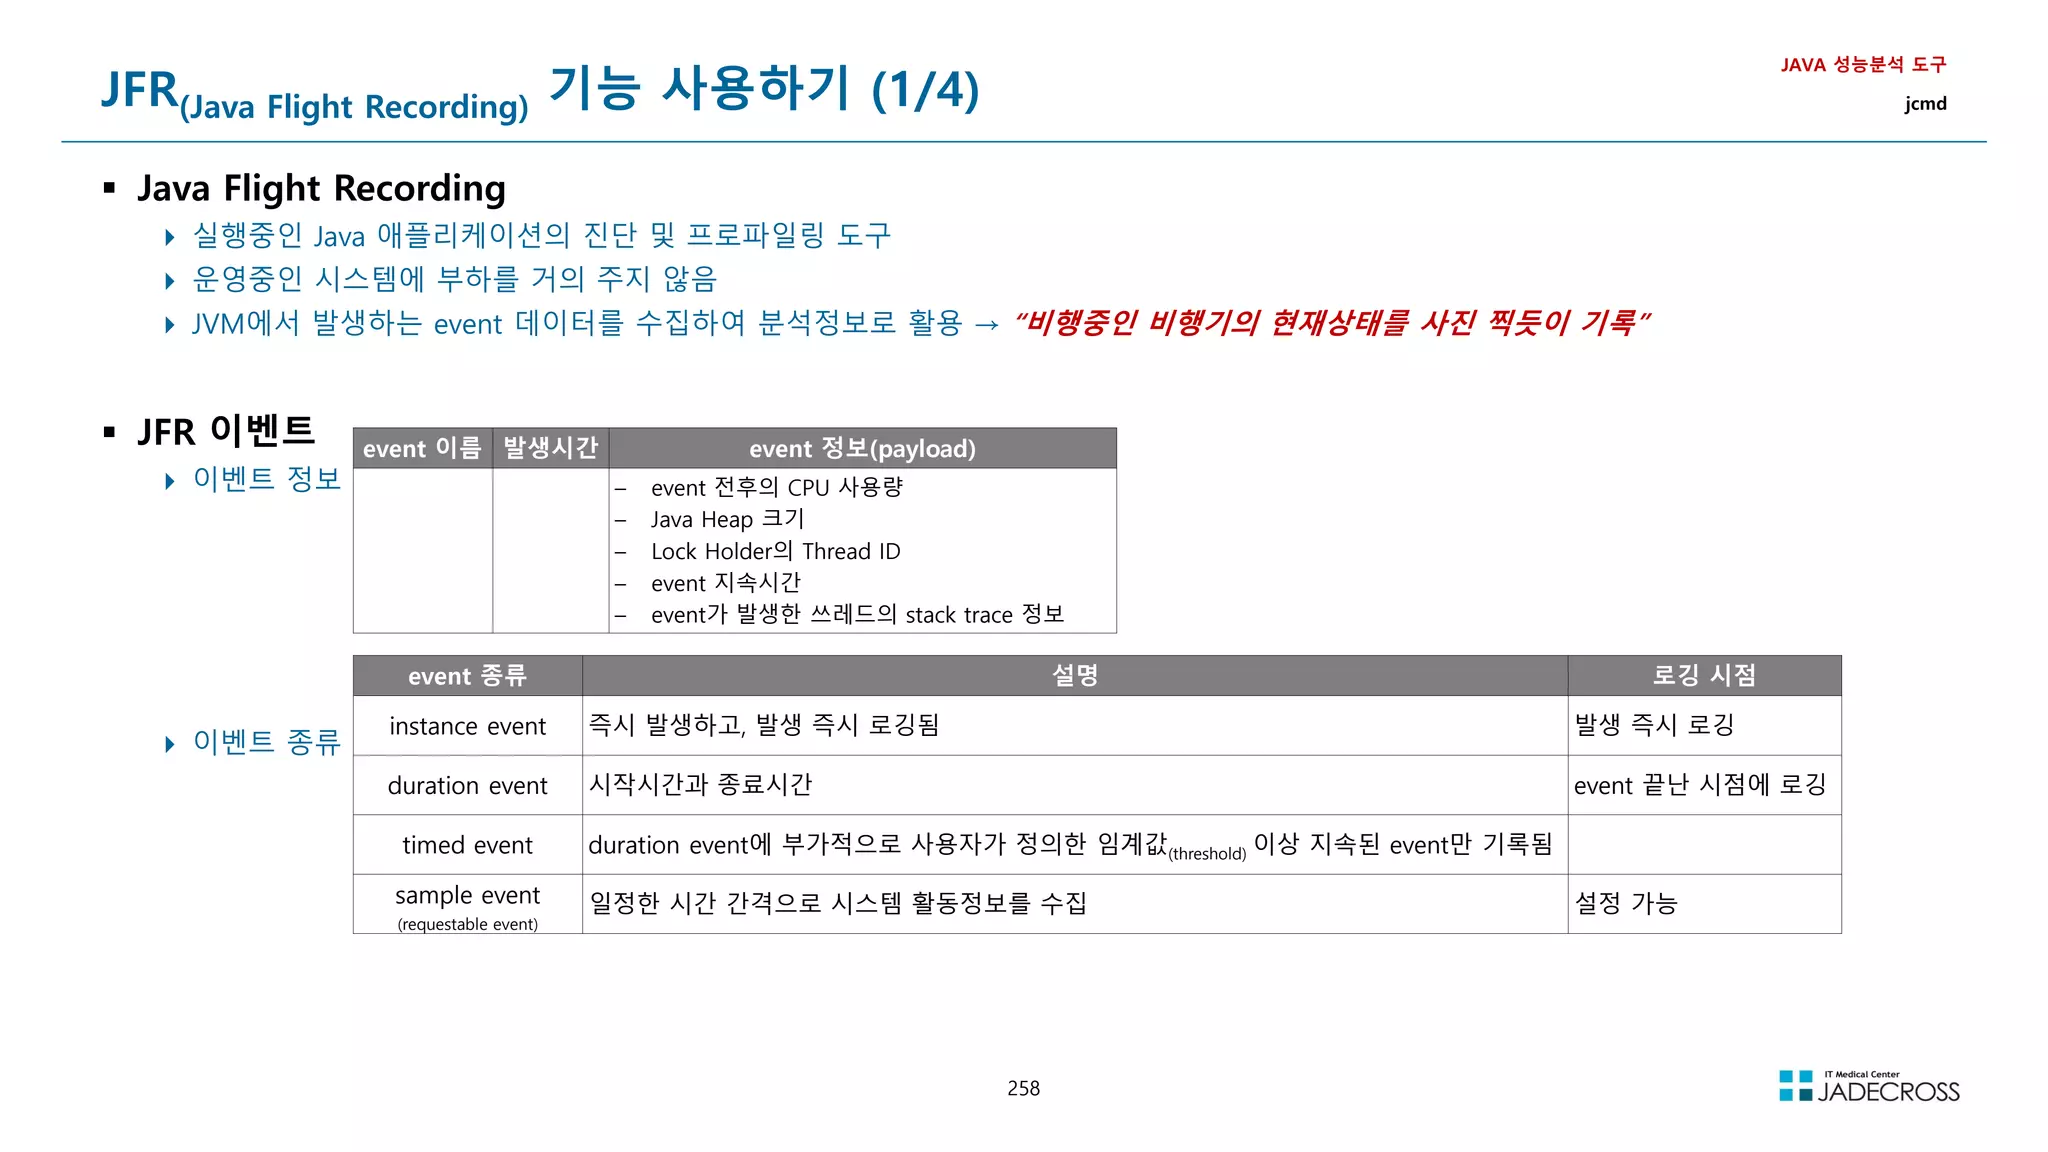
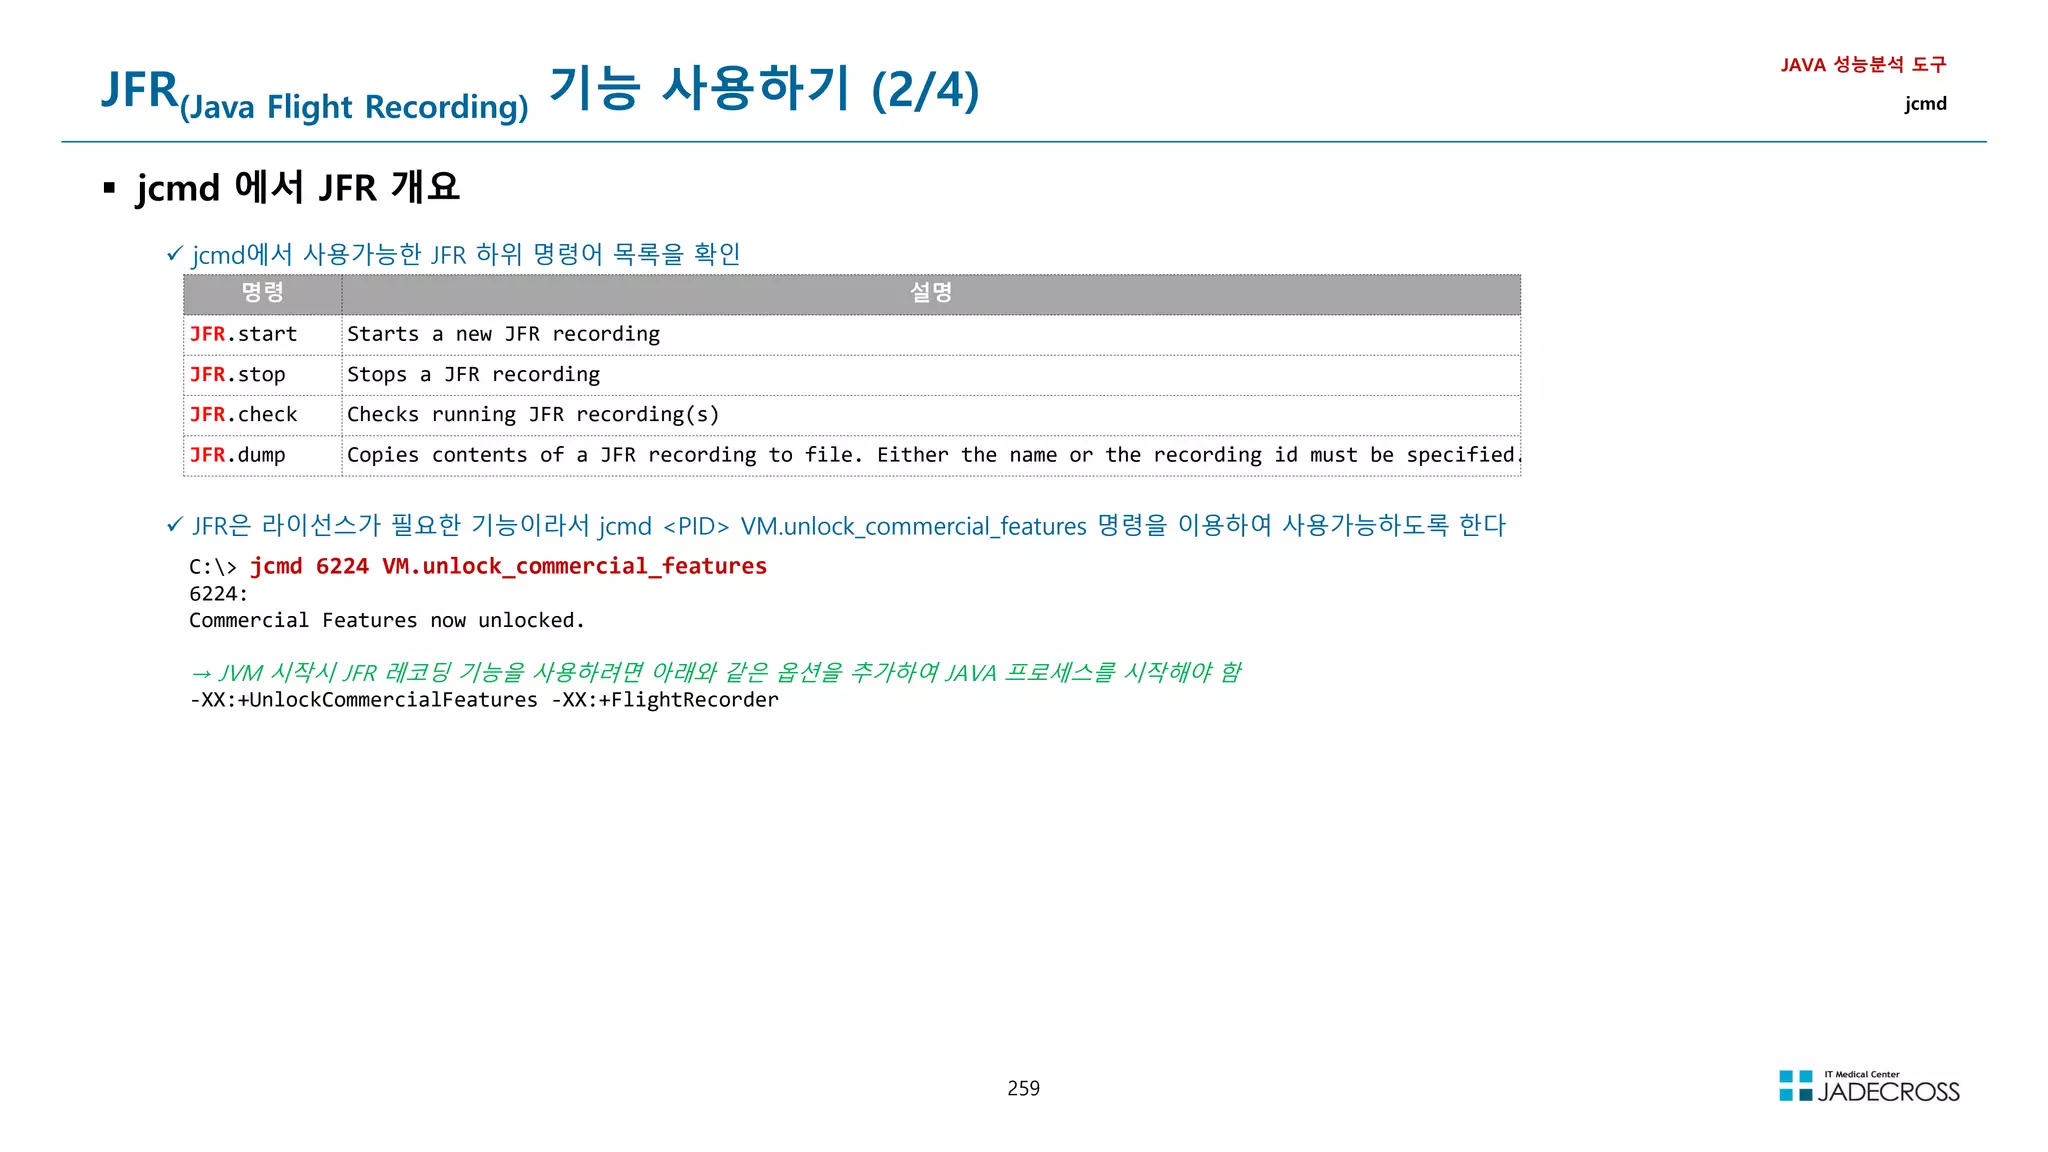
![260
JFR(Java Flight Recording) 기능 사용하기 (3/4)
jcmd를 이용하여 JFR 레코딩 수행 (1/2)
JFR.start
JAVA 성능분석 도구
jcmd
JFR.start 명령의 도움말 확인
C: jcmd 6224 help JFR.start
6224:
JFR.start
Starts a new JFR recording
Impact Medium: Depending on the settings for a recording, the impact can range from low to high.
Permission java.lang.management.ManagementPermission(monitor)
Syntax JFR.start [options]
Options
(options must be specified using the key or key=value syntax)
name : [optional] Name that can be used to identify recording, e.g. My Recording (STRING, no default value)
defaultrecording : [optional] Starts the default recording, can only be combined with settings. (BOOLEAN, false)
dumponexit : [optional] Dump running recording when JVM shuts down (BOOLEAN, no default value)
settings : [optional] Settings file(s), e.g. profile or default. See JRE_HOME/lib/jfr (STRING SET, no default value)
delay : [optional] Delay recording start with (s)econds, (m)inutes), (h)ours), or (d)ays, e.g. 5h. (NANOTIME, 0)
duration : [optional] Duration of recording in (s)econds, (m)inutes, (h)ours, or (d)ays, e.g. 300s. (NANOTIME, 0)
filename : [optional] Resulting recording filename, e.g. C:UsersuserMy Recording.jfr (STRING, no default value)
compress : [optional] GZip-compress the resulting recording file (BOOLEAN, false)
maxage : [optional] Maximum time to keep recorded data (on disk) in (s)econds, (m)inutes, (h)ours, or (d)ays, e.g. 60m, or 0 for no
limit (NANOTIME, 0)
maxsize : [optional] Maximum amount of bytes to keep (on disk) in (k)B, (M)B or (G)B, e.g. 500M, or 0 for no limit (MEMORY SIZE, 0)
jpetstore 웹어플리션을 수행중인 Tomcat8.5 WAS를 60초 동안 레코딩을 수행
C: jcmd 6224 JFR.start duration=60s filename=rec01.jfr
6224:
Started recording 1. The result will be written to:
D:javaapacheapache-tomcat-8.5.46binrec01.jfr](https://image.slidesharecdn.com/jvm-230511085906-be6f1201/75/JVM_-pdf-260-2048.jpg)
![261
JFR(Java Flight Recording) 기능 사용하기 (3/4)
jcmd를 이용하여 JFR 레코딩 수행 (2/2)
JFR.check
JAVA 성능분석 도구
jcmd
JFR.check 명령의 도움말 확인
C: jcmd 6224 help JFR.check
6224:
JFR.check
Checks running JFR recording(s)
Impact Low
Permission java.lang.management.ManagementPermission(monitor)
Syntax JFR.check [options]
Options
(options must be specified using the key or key=value syntax)
name : [optional] Recording name, e.g. My Recording or omit to see all recordings (STRING, no default value)
recording : [optional] Recording number, or omit to see all recordings (JLONG, -1)
verbose : [optional] Print event settings for the recording(s) (BOOLEAN, false)
JFR 레코딩중인 Tomcat8.5 WAS에 대해서, 실행중인 JFR 레코딩의 상태를 확인
C: jcmd 6224 JFR.check
6224:
Recording: recording=1 name=rec01.jfr duration=1m filename=rec01.jfr compress=false (running)
C: jcmd 6224 JFR.check
6224:
No available recordings.
Use JFR.start to start a recording.
JFR 레코딩이
종료되었음](https://image.slidesharecdn.com/jvm-230511085906-be6f1201/75/JVM_-pdf-261-2048.jpg)
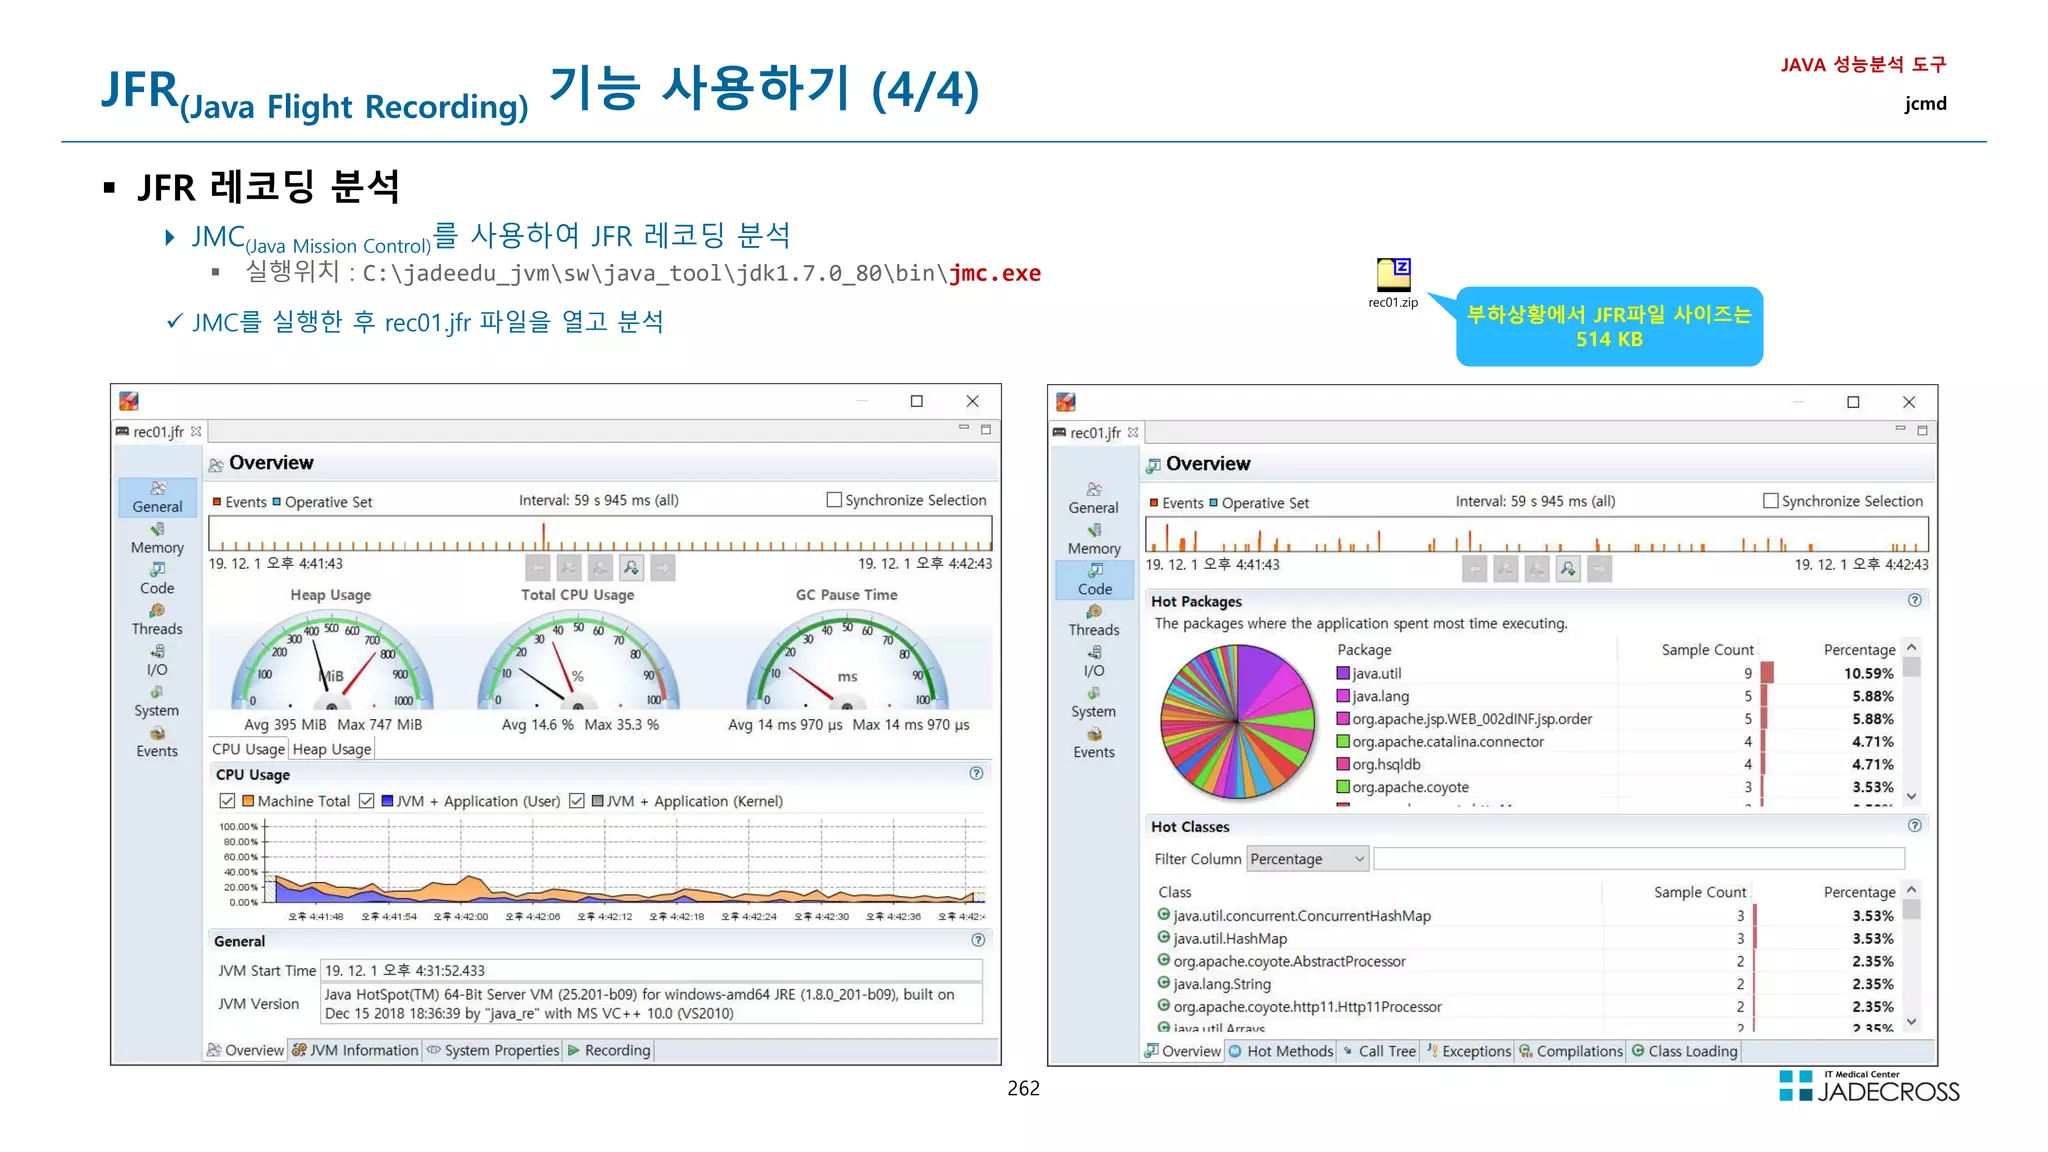
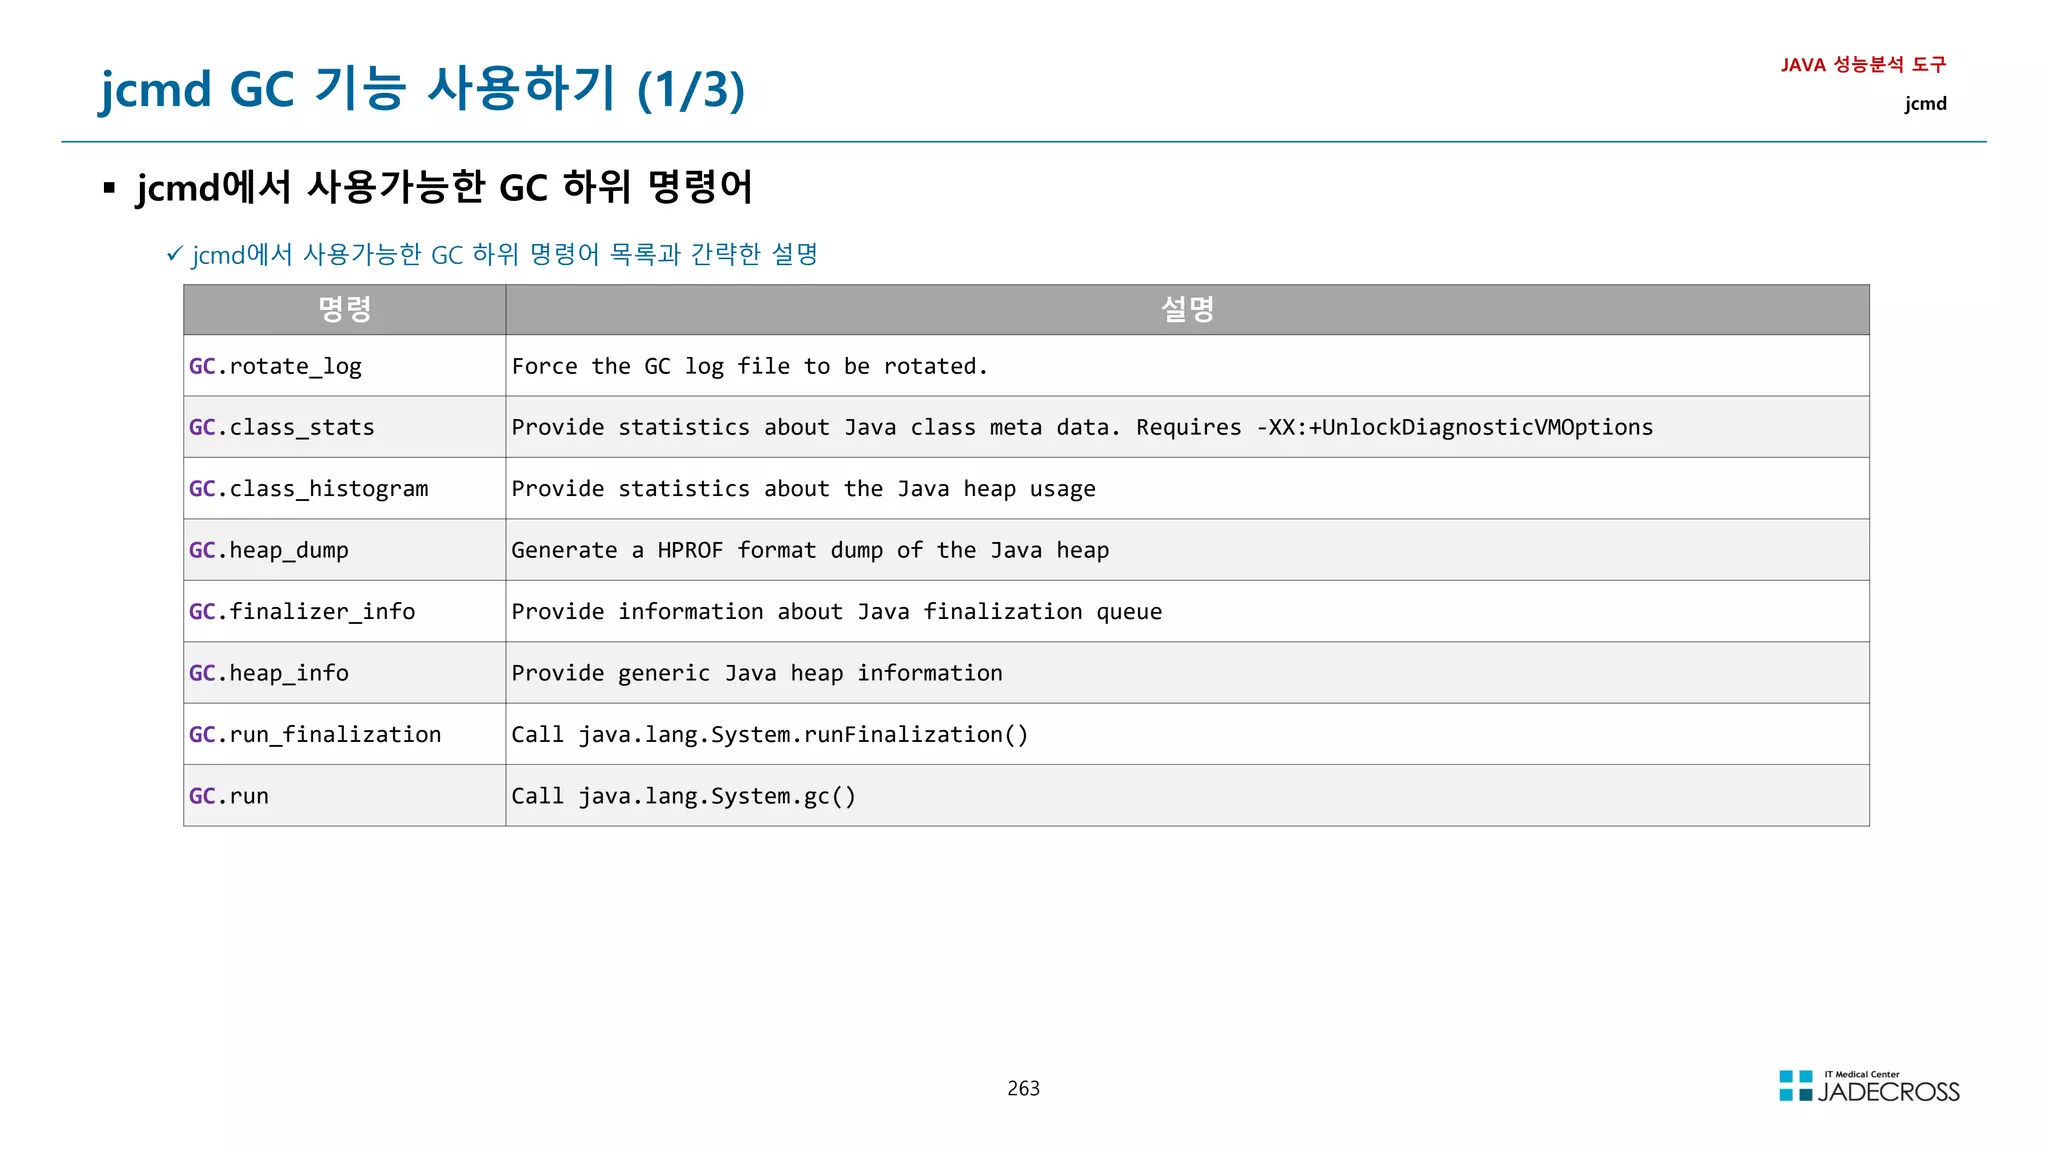
![264
jcmd GC 기능 사용하기 (2/3)
GC.class_histogram
클래스별 메모리 사용량을 조회하고 class histogram을 출력
Heap Dump보다는 세밀하지 않지만, 신속하게 대략적인 정보를 파악하는데 유용함
어떤 객체 타입이 메모리를 많이 사용하는지 빠르게 파악
JAVA 성능분석 도구
jcmd
GC.class_histogram 명령의 도움말 확인
C: jcmd 6224 help GC.class_histogram → Full GC를 수행한후 Live Object에 대해서 Heap 메모리 점유율 출력
6224:
GC.class_histogram
Provide statistics about the Java heap usage.
Impact High: Depends on Java heap size and content
Permission java.lang.management.ManagementPermission(monitor)
Syntax GC.class_histogram [options]
Options
(options must be specified using the key or key=value syntax)
-all : [optional] Inspect all objects, including unreachable objects (BOOLEAN, false)
jpetstore 웹어플리션을 수행중인 Tomcat8.5 WAS의 class histogram을 확인
C: jcmd 6224 GC.class_histogram class_histogram.txt
6224:
num #instances #bytes class name
----------------------------------------------
1: 75443 7634952 [C
2: 74025 1776600 java.lang.String
3: 3865 1666968 [B
4: 12061 1061368 java.lang.reflect.Method
5: 8152 1021144 [I
6: 7819 892608 java.lang.Class
7: 13148 866016 [Ljava.lang.Object;
8: 24056 769792 java.util.HashMap$Node
9: 16511 528352 java.util.concurrent.ConcurrentHashMap$Node
...
배열 시그니처 설명
[Z boolean 배열
[B byte 배열
[S short 배열
[I int 배열
[J long 배열
[F float 배열
[D double 배열
[C char 배열
[L 객체 배열](https://image.slidesharecdn.com/jvm-230511085906-be6f1201/75/JVM_-pdf-264-2048.jpg)
![265
jcmd GC 기능 사용하기 (3/3)
GC.heap_dump
jmap 명령으로도 Heap Dump 생성이 가능하지만, jmap은 객체를 생성한 Stack Trace정보를 포함하지 않음
jmap -dump:format=b,file=file PID
jcmd PID GC.heap_dump 명령은 jmap보다 더 최신이며, 부하도 더 적으므로 jmap보다는 jcmd를 사용하자!!!
JAVA 성능분석 도구
jcmd
GC.heap_dump 명령의 도움말 확인
C: jcmd 6224 help GC.heap_dump
6224:
GC.heap_dump
Generate a HPROF format dump of the Java heap
Impact High: Depends on Java heap size and content. Request a full GC unless the '-all' option is specified
Permission java.lang.management.ManagementPermission(monitor)
Syntax GC.heap_dump [options] filename
Arguments Name of the dump file (STRING, no default value)
Options
Options: (options must be specified using the key or key=value syntax)
-all : [optional] Dump all objects, including unreachable objects (BOOLEAN, false)
jpetstore 웹어플리션을 수행중인 Tomcat8.5 WAS의 Heap Dump를 생성해 보자
C: jcmd 6224 GC.heap_dump jpetstoreHeapDump
6224:
Heap dump file created 절대경로를 생략하면 java 프로세스의
Working Directory 하위에 파일 생성됨](https://image.slidesharecdn.com/jvm-230511085906-be6f1201/75/JVM_-pdf-265-2048.jpg)
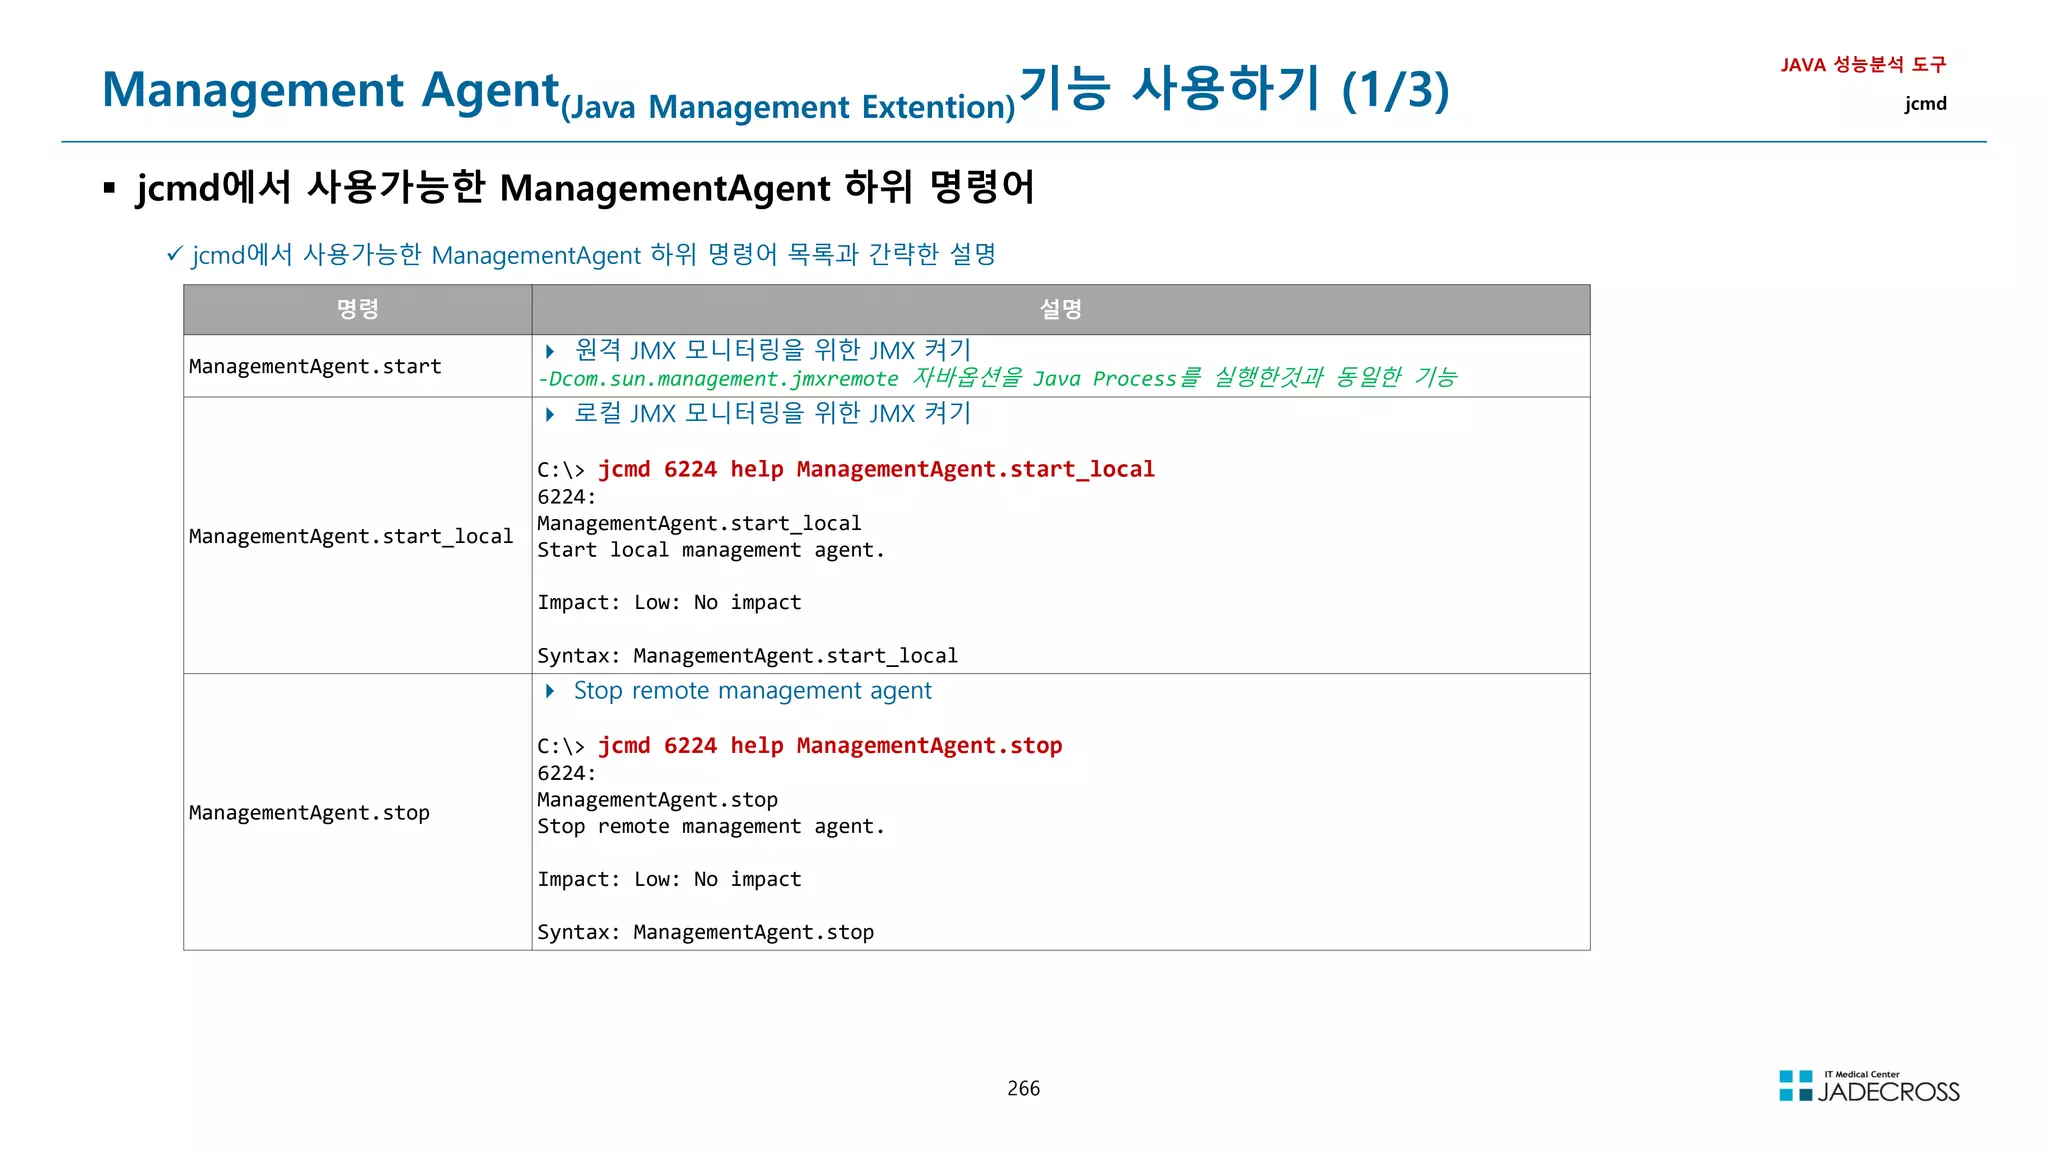
![267
Management Agent(Java Management Extention)기능 사용하기 (2/3)
ManagementAgent.start (1/2)
원격 JMX 모니터링을 위해 JMX 기능 켜기
JAVA 성능분석 도구
jcmd
ManagementAgent.start 명령의 도움말 확인
C: jcmd 6224 help ManagementAgent.start
6224:
ManagementAgent.start
Start remote management agent.
Impact Low: No impact
Permission java.lang.management.ManagementPermission(monitor)
Syntax ManagementAgent.start [options]
Options
(options must be specified using the key or key=value syntax)
config.file : [optional] set com.sun.management.config.file (STRING, no default value)
jmxremote.host : [optional] set com.sun.management.jmxremote.host (STRING, no default value)
jmxremote.port : [optional] set com.sun.management.jmxremote.port (STRING, no default value)
jmxremote.rmi.port : [optional] set com.sun.management.jmxremote.rmi.port (STRING, no default value)
jmxremote.ssl : [optional] set com.sun.management.jmxremote.ssl (STRING, no default value)
jmxremote.registry.ssl : [optional] set com.sun.management.jmxremote.registry.ssl (STRING, no default value)
jmxremote.authenticate : [optional] set com.sun.management.jmxremote.authenticate (STRING, no default value)
jmxremote.password.file : [optional] set com.sun.management.jmxremote.password.file (STRING, no default value)
jmxremote.access.file : [optional] set com.sun.management.jmxremote.access.file (STRING, no default value)
jmxremote.login.config : [optional] set com.sun.management.jmxremote.login.config (STRING, no default value)
jmxremote.ssl.enabled.cipher.suites : [optional] set com.sun.management.jmxremote.ssl.enabled.cipher.suite (STRING, no default value)
jmxremote.ssl.enabled.protocols : [optional] set com.sun.management.jmxremote.ssl.enabled.protocols (STRING, no default value)
jmxremote.ssl.need.client.auth : [optional] set com.sun.management.jmxremote.need.client.auth (STRING, no default value)
jmxremote.ssl.config.file : [optional] set com.sun.management.jmxremote.ssl_config_file (STRING, no default value)
jmxremote.autodiscovery : [optional] set com.sun.management.jmxremote.autodiscovery (STRING, no default value)
jdp.port : [optional] set com.sun.management.jdp.port (INT, no default value)
jdp.address : [optional] set com.sun.management.jdp.address (STRING, no default value)
jdp.source_addr : [optional] set com.sun.management.jdp.source_addr (STRING, no default value)
jdp.ttl : [optional] set com.sun.management.jdp.ttl (INT, no default value)
jdp.pause : [optional] set com.sun.management.jdp.pause (INT, no default value)
jdp.name : [optional] set com.sun.management.jdp.name (STRING, no default value)](https://image.slidesharecdn.com/jvm-230511085906-be6f1201/75/JVM_-pdf-267-2048.jpg)
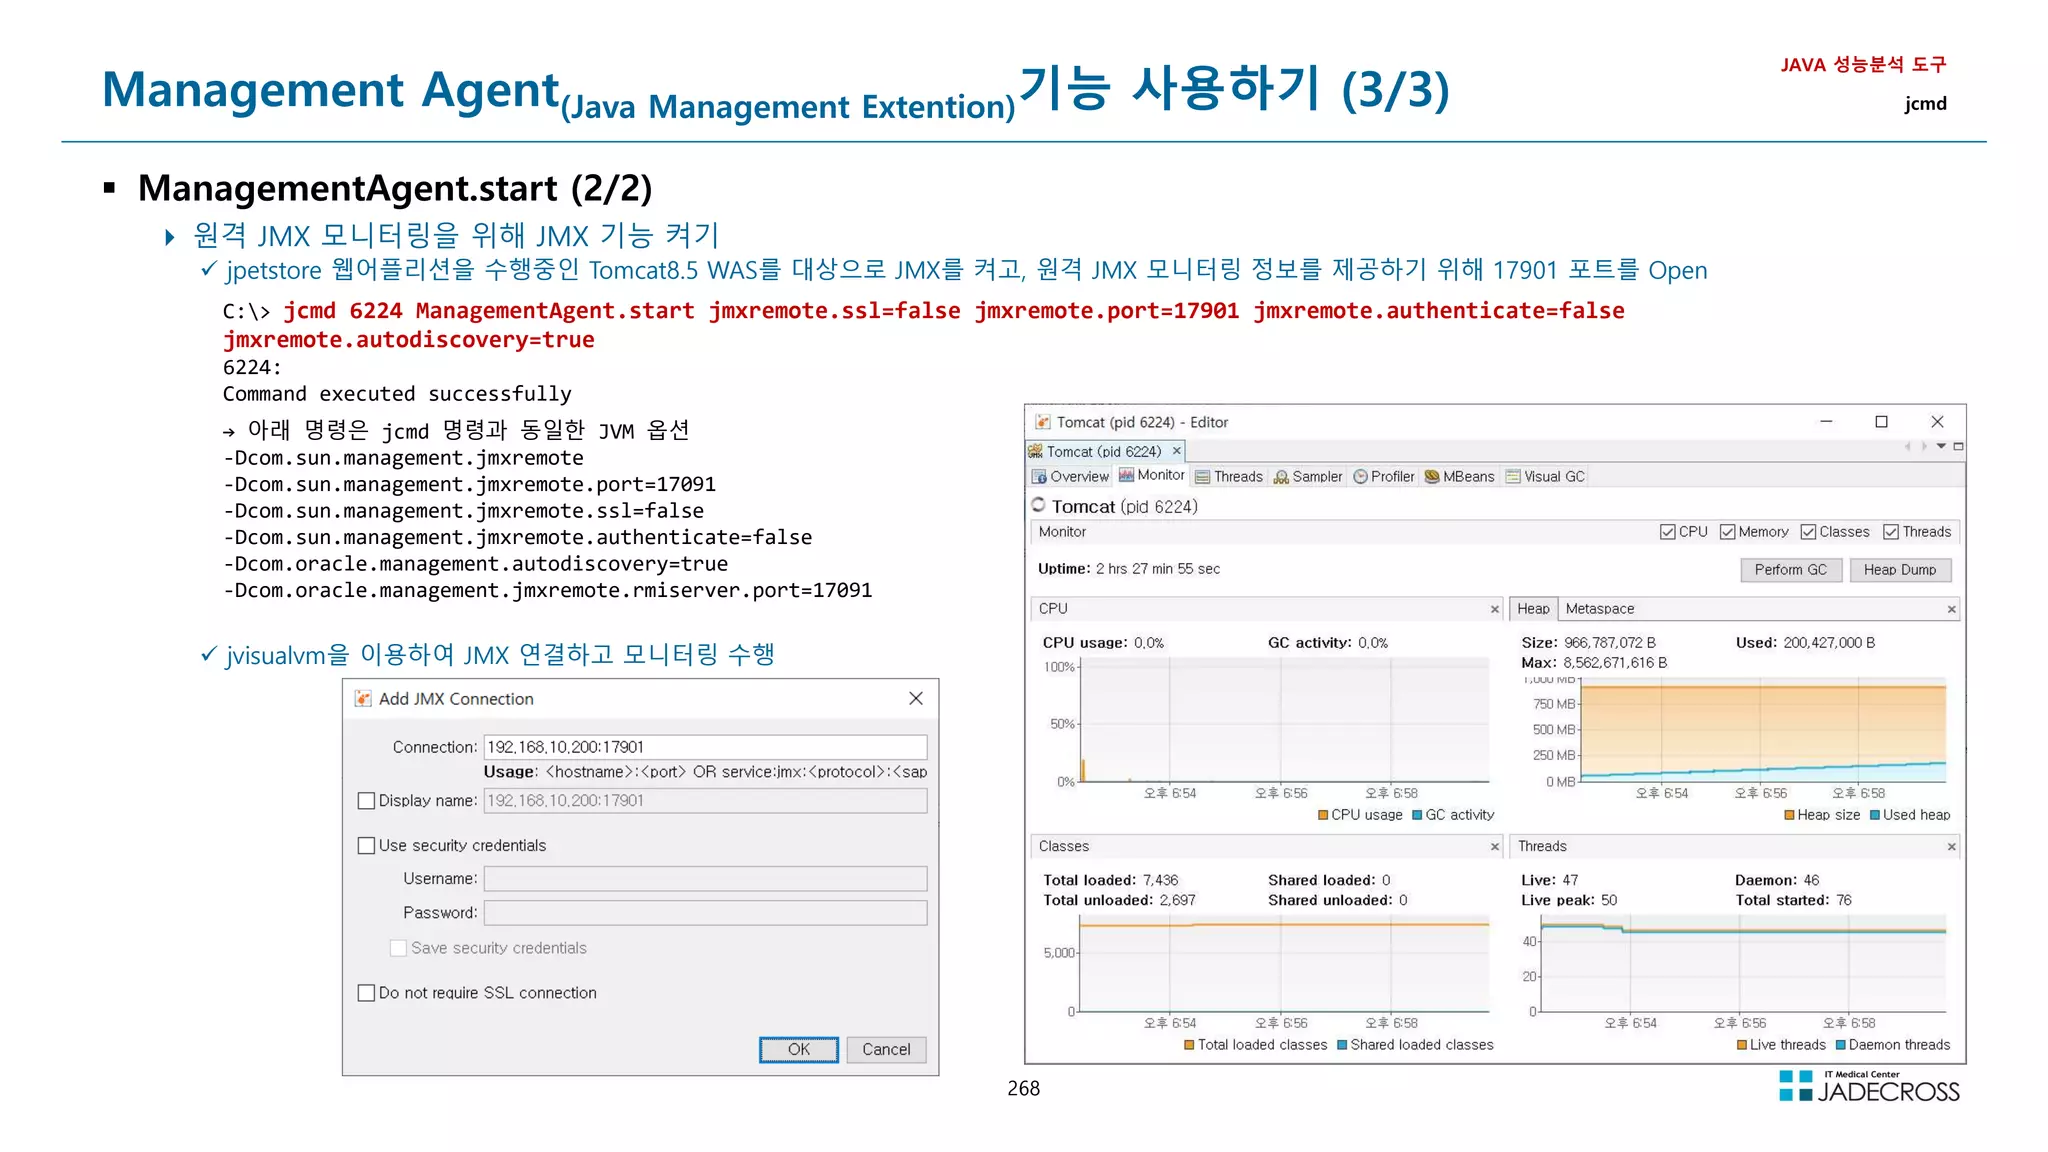
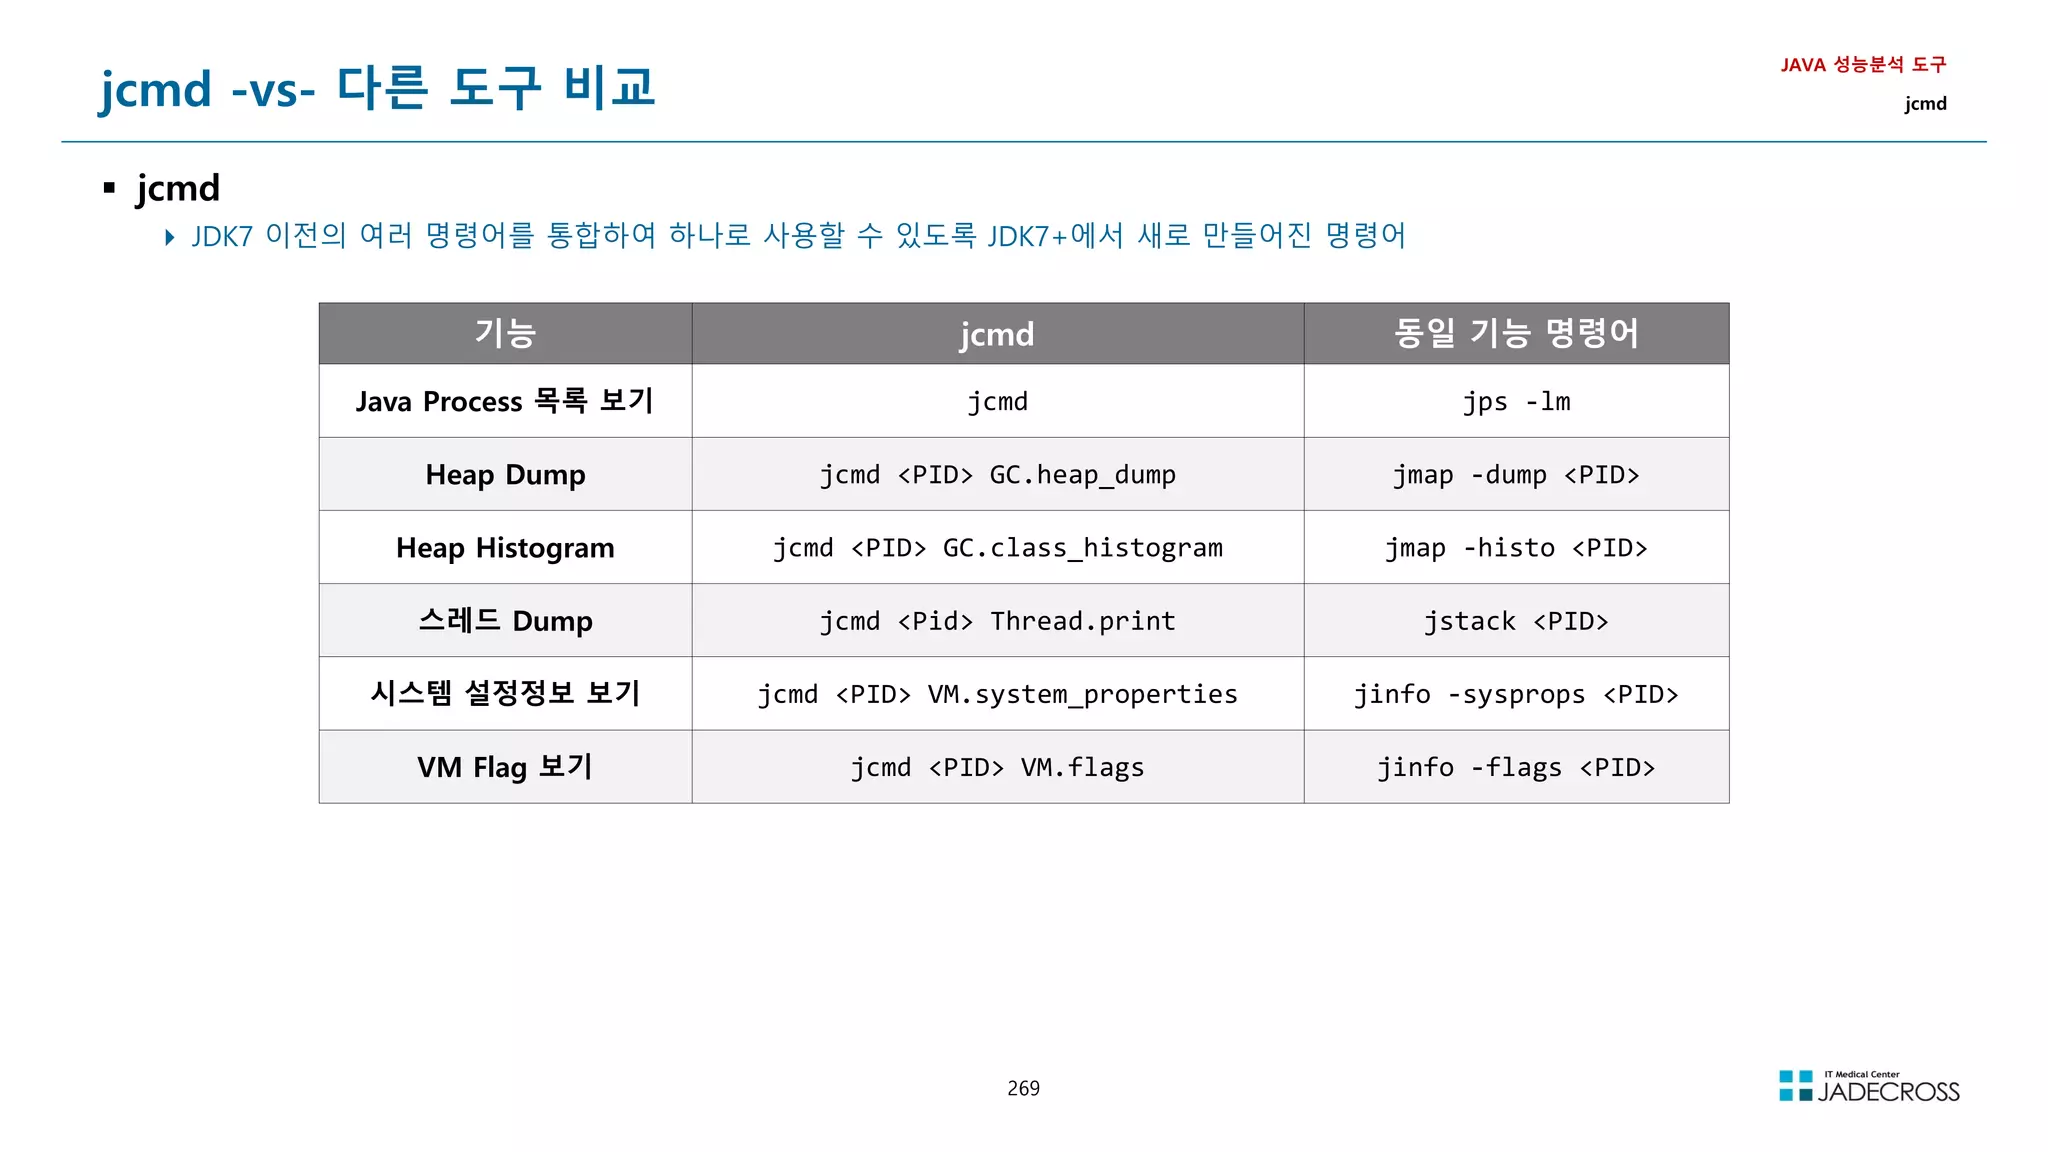
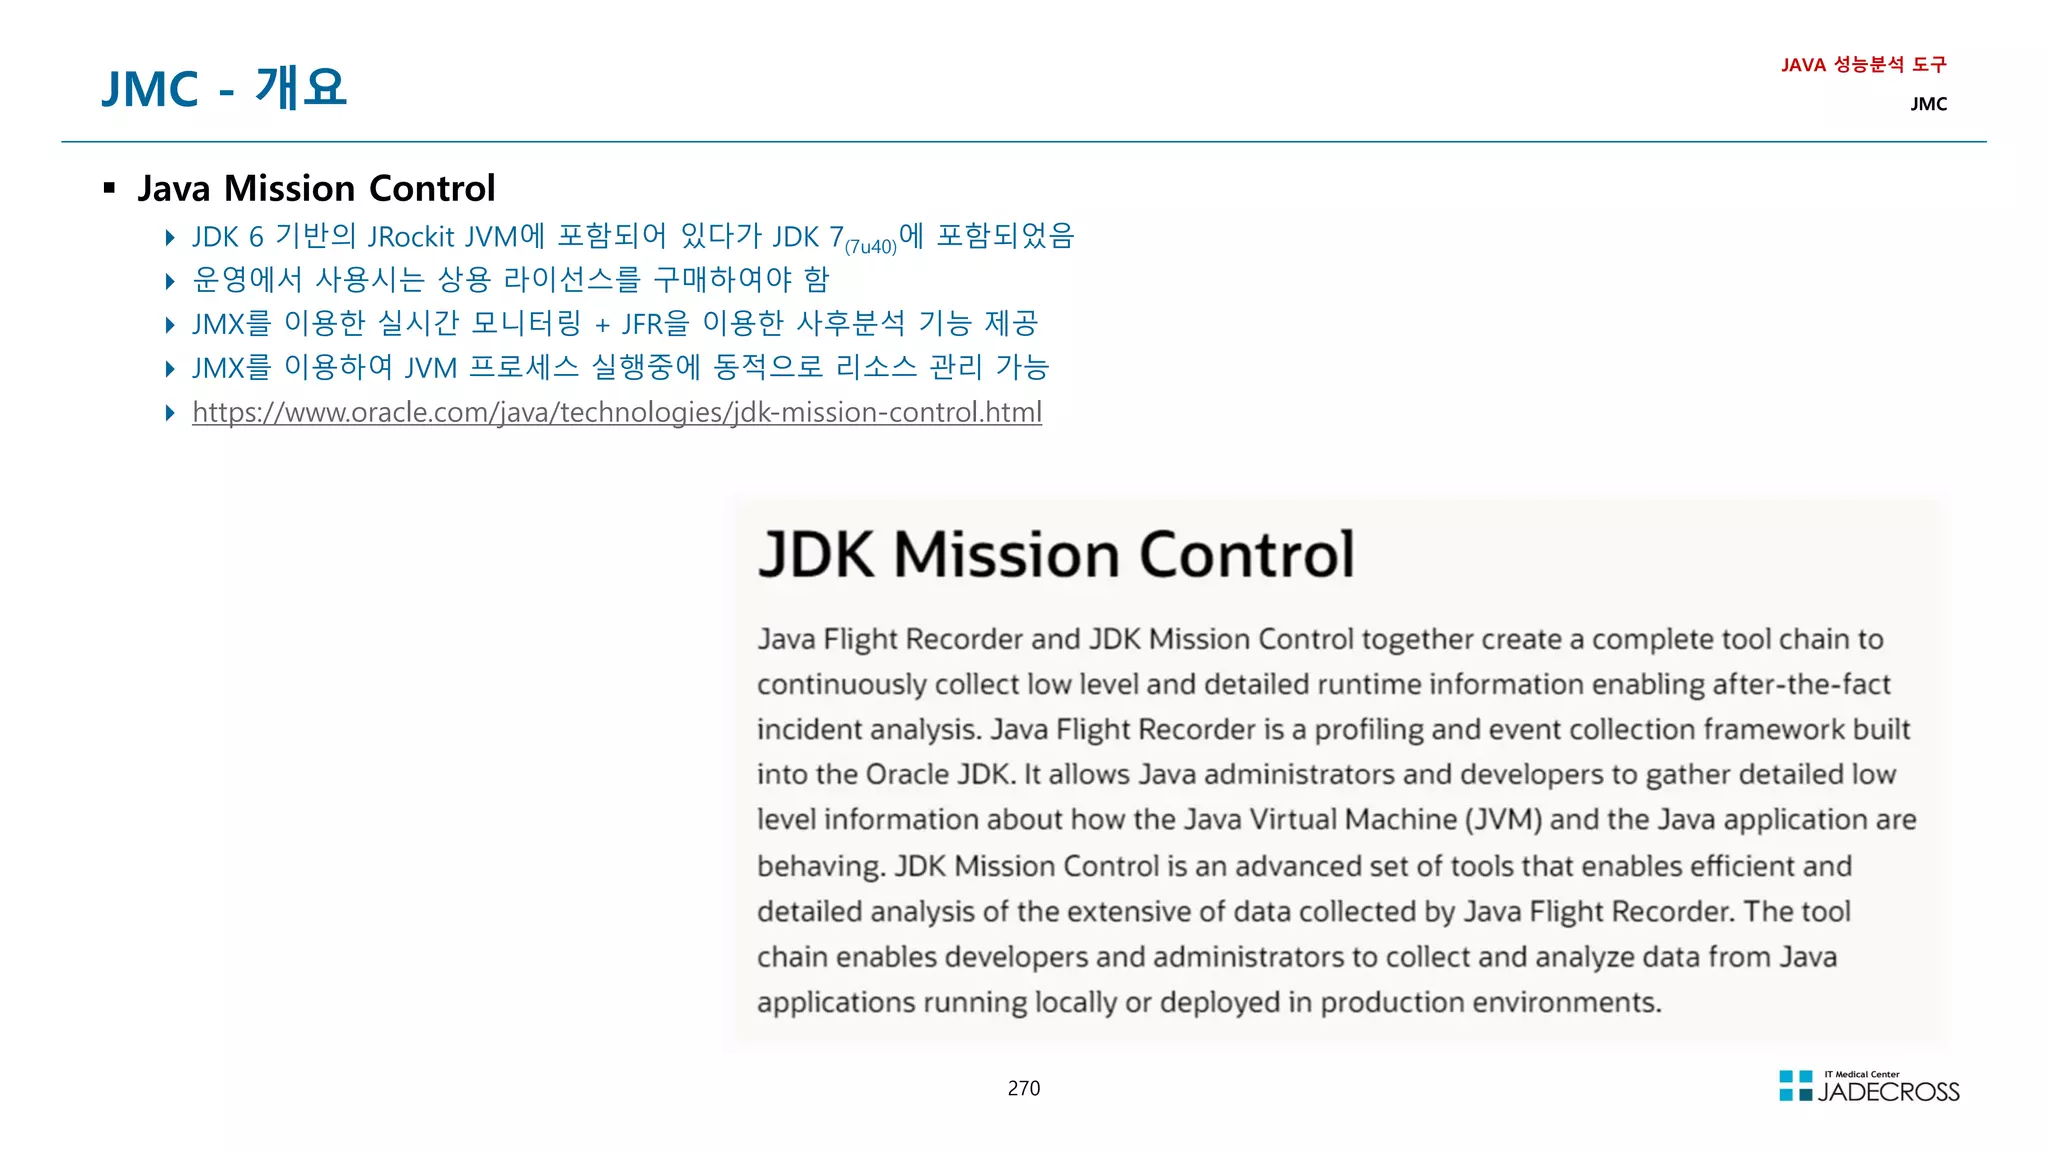
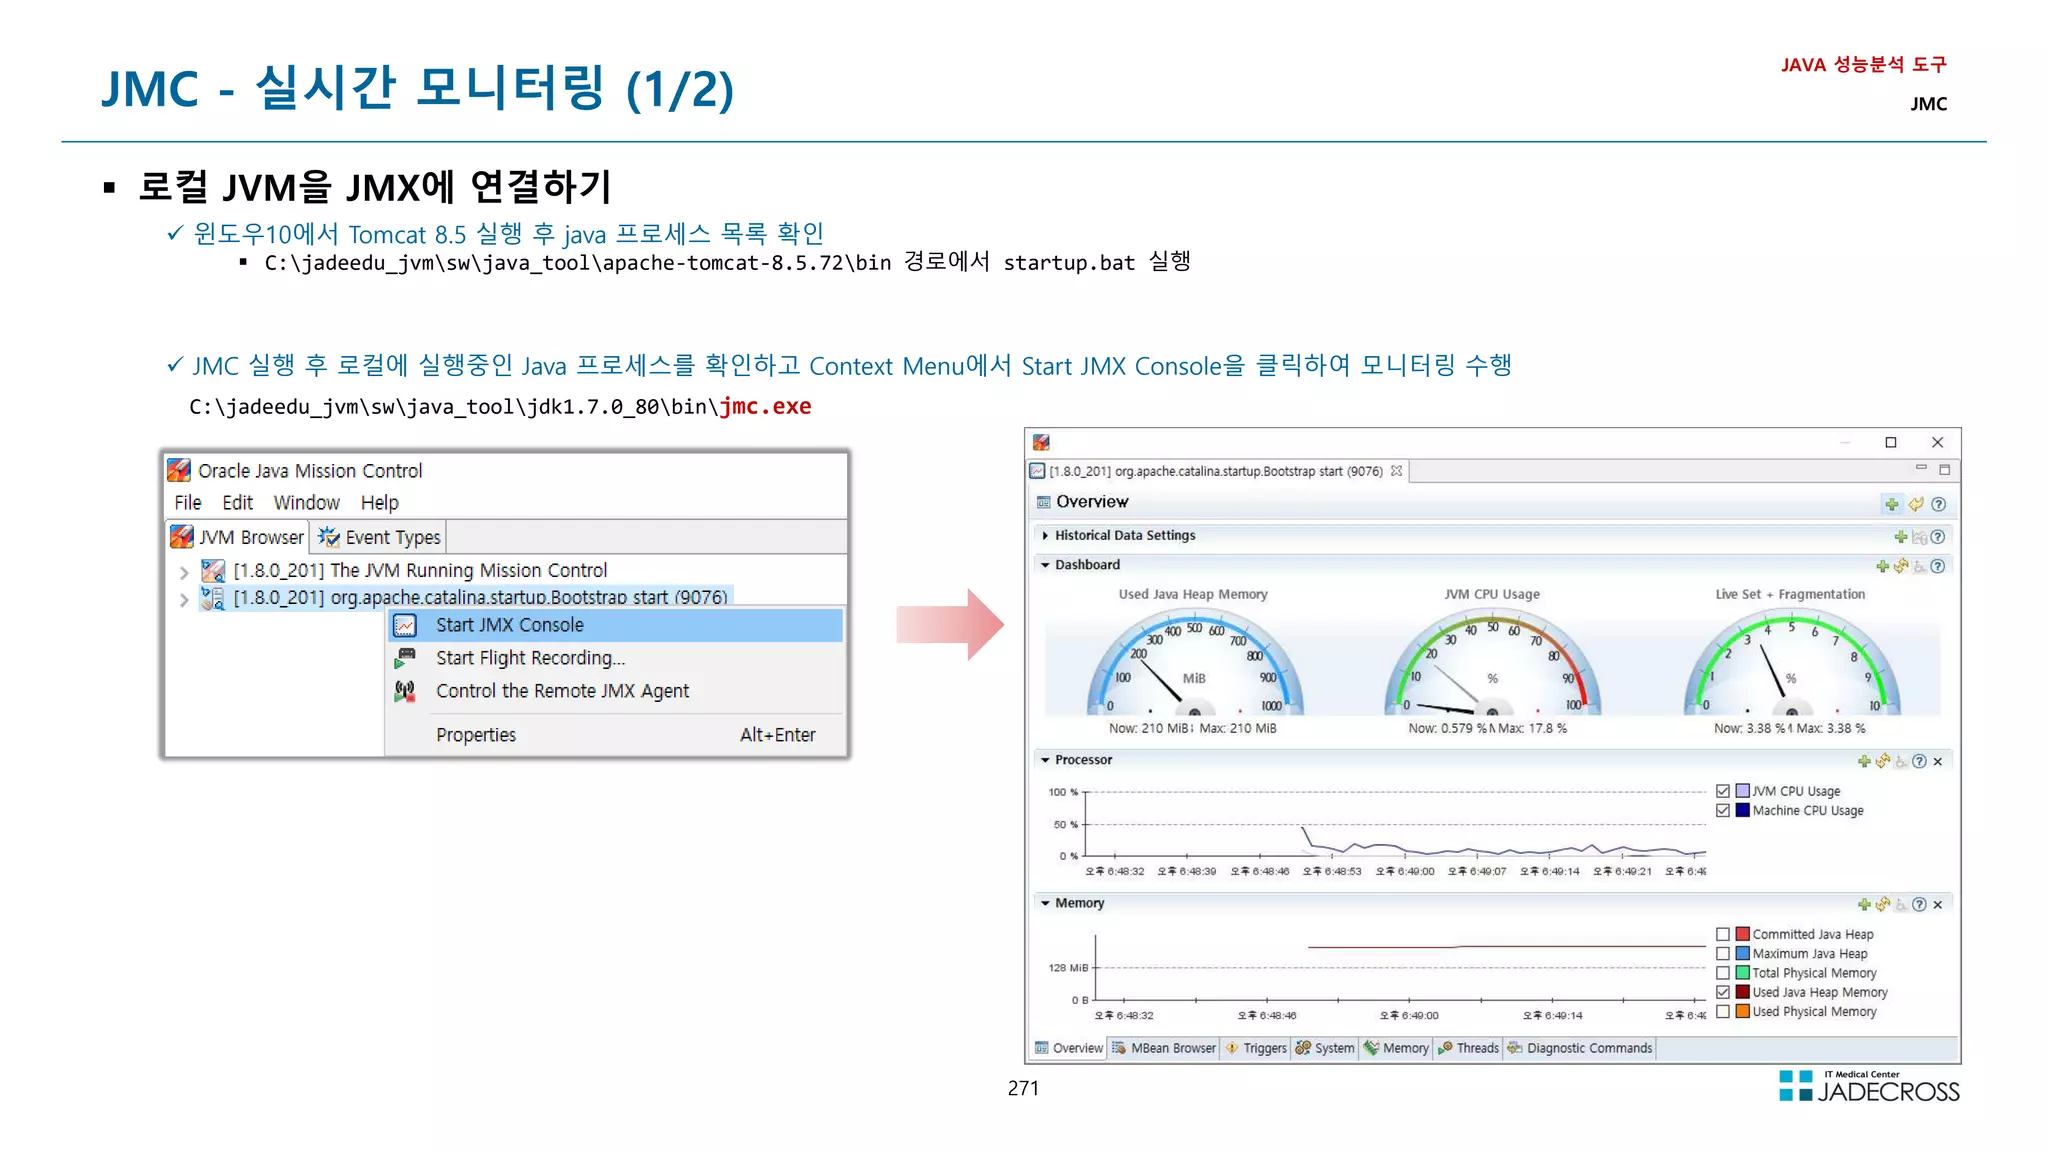
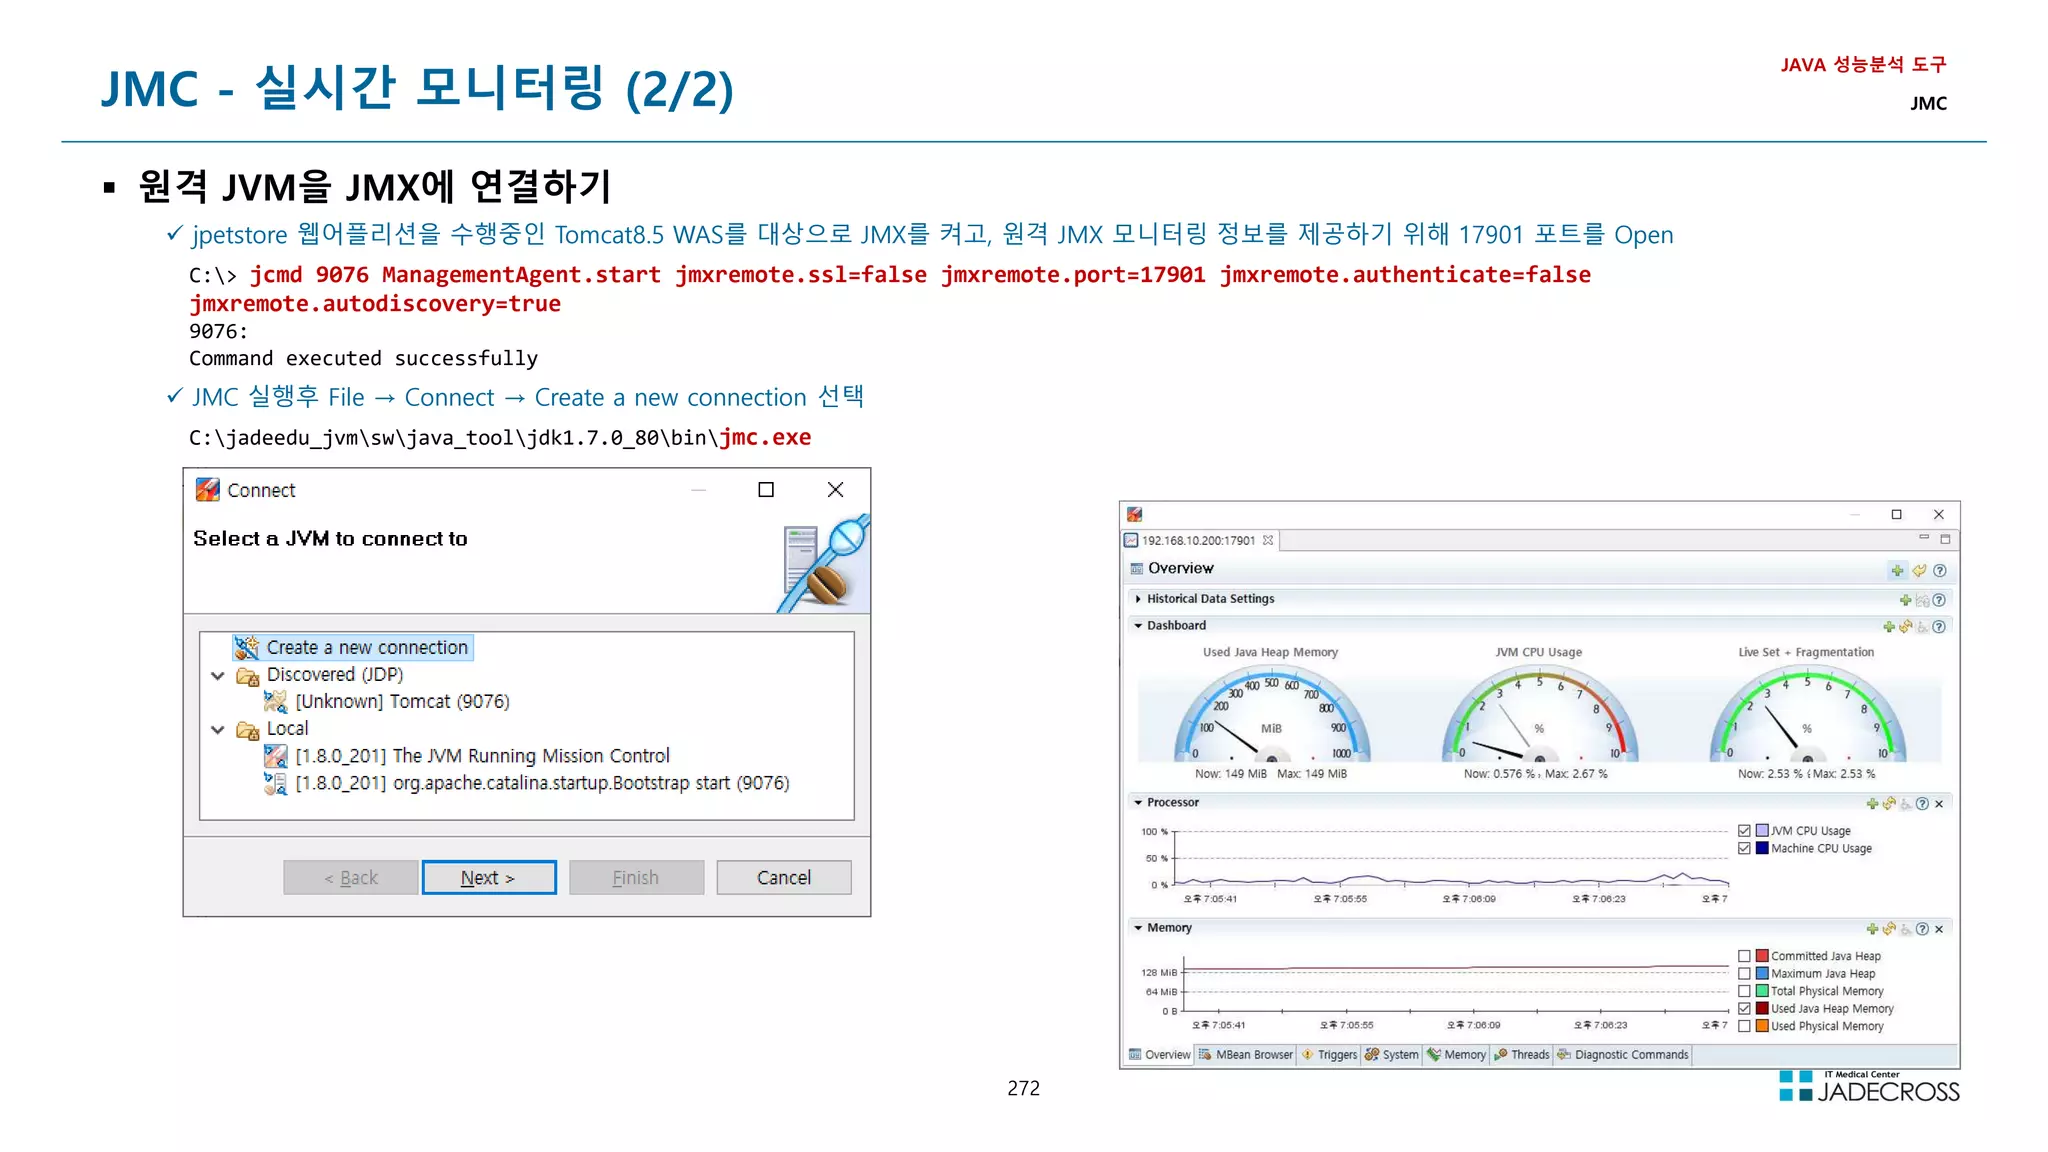
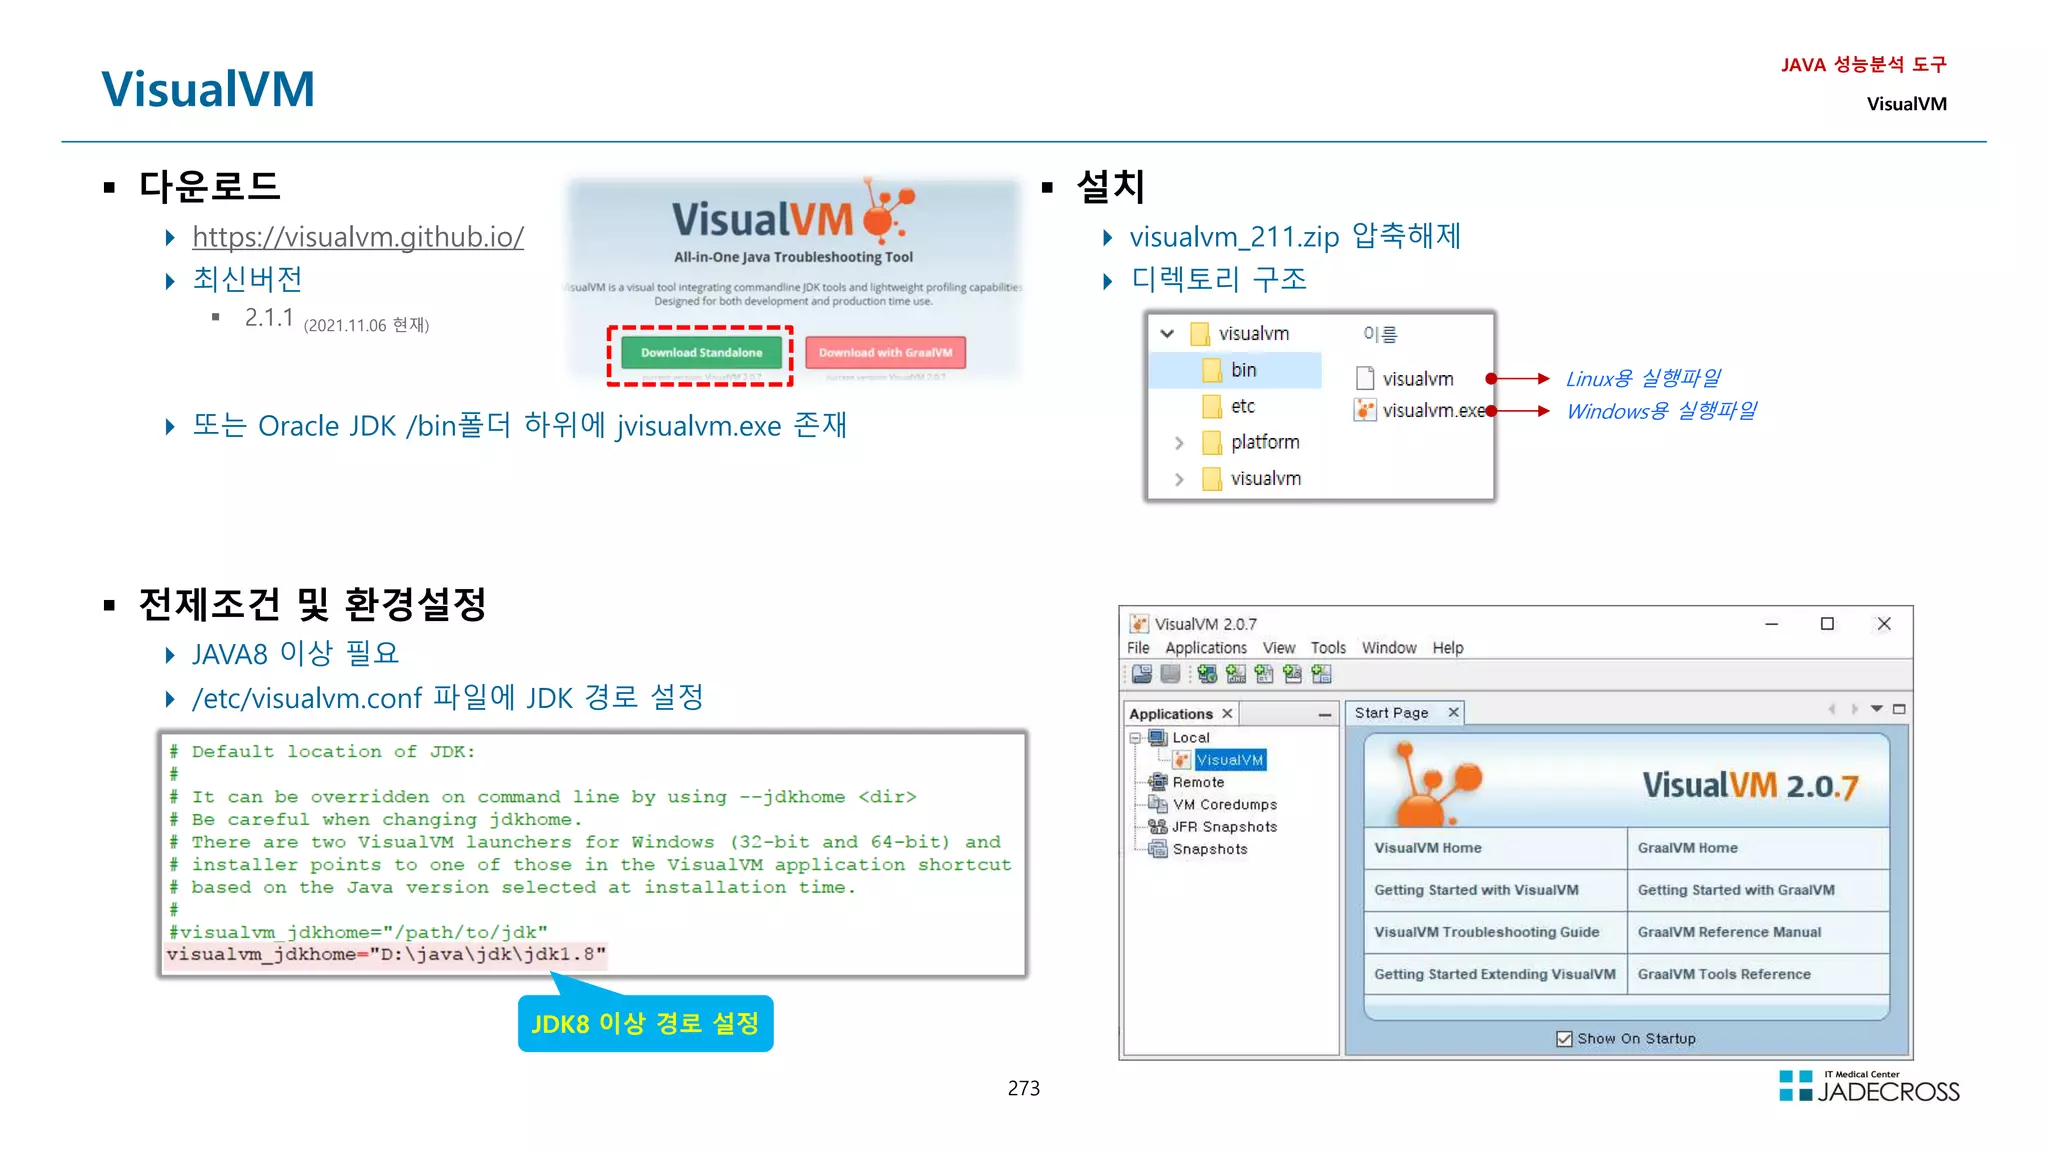
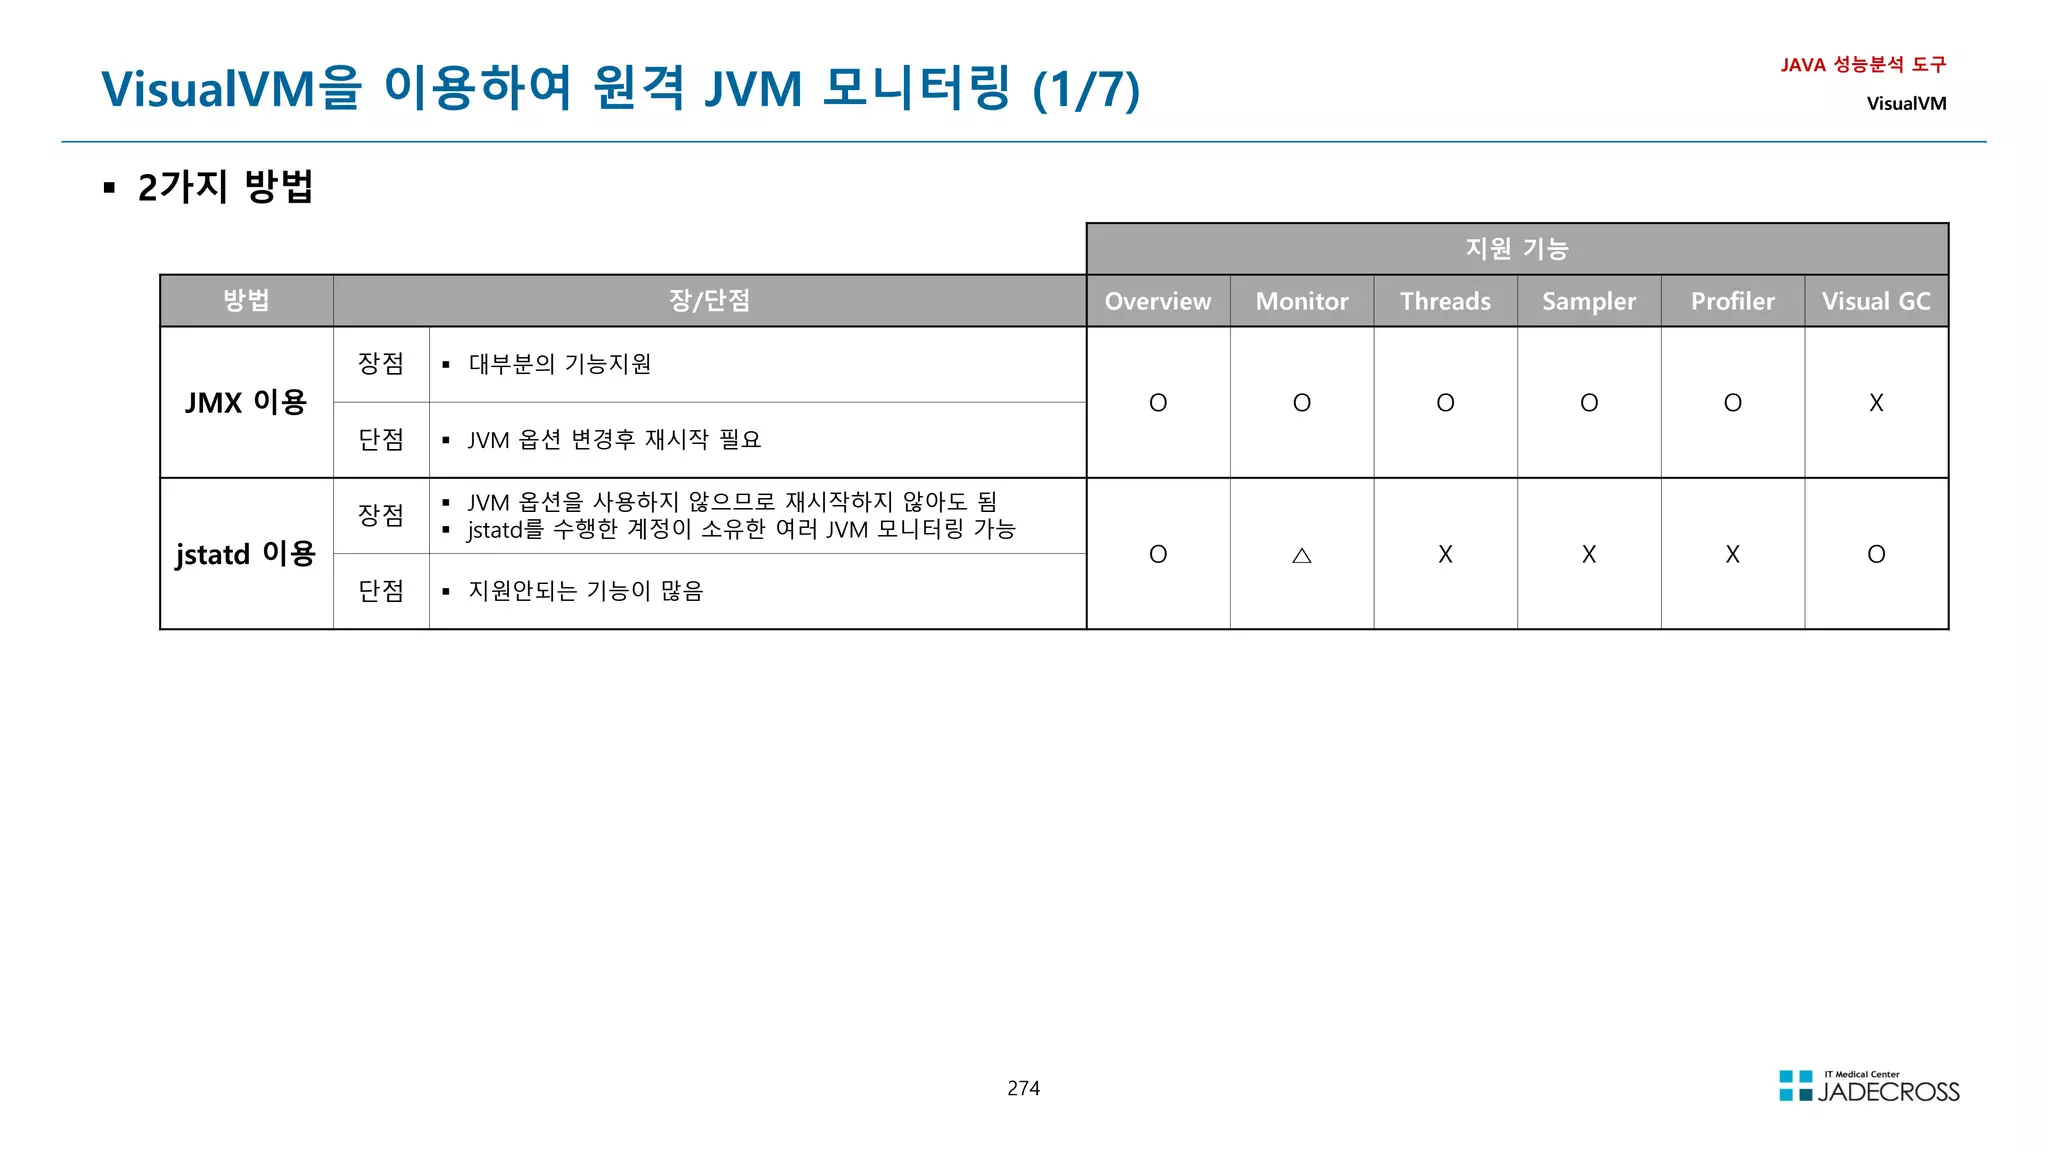
![275
VisualVM을 이용하여 원격 JVM 모니터링 (2/7)
① JMX 이용 (1/3)
JMX(Java Management Extension)를 이용하는 방법으로 JVM 시작 시 추가 옵션을 지정하여야 하며 JVM 재시작이 필요함
Tomcat v8.5 에 Remote JMX 연결하는 샘플
JAVA 성능분석 도구
VisualVM
톰캣 실행시 jmx 관련 JVM 옵션적용
-Dcom.sun.management.jmxremote.port=7091
-Dcom.sun.management.jmxremote.authenticate=false
-Dcom.sun.management.jmxremote.ssl=false
Tomcat 재시작후 JVM에서 JXM 포트를 LISTEN 하고 있는지 확인
[root@jvmedu ~]# netstat -napt | grep LISTEN | grep java
(Not all processes could be identified, non-owned process info
will not be shown, you would have to be root to see it all.)
tcp 0 0 172.21.111.42:4000 0.0.0.0:* LISTEN 7042/java
tcp 0 0 0.0.0.0:32896 0.0.0.0:* LISTEN 7042/java
tcp 0 0 127.0.0.1:8005 0.0.0.0:* LISTEN 7042/java
tcp 0 0 0.0.0.0:8009 0.0.0.0:* LISTEN 7042/java
tcp 0 0 0.0.0.0:8080 0.0.0.0:* LISTEN 7042/java
tcp 0 0 0.0.0.0:7091 0.0.0.0:* LISTEN 7042/java
tcp 0 0 0.0.0.0:45496 0.0.0.0:* LISTEN 7042/java
Visual VM 시작
STS Tomcat 실행
옵션에 적용](https://image.slidesharecdn.com/jvm-230511085906-be6f1201/75/JVM_-pdf-275-2048.jpg)
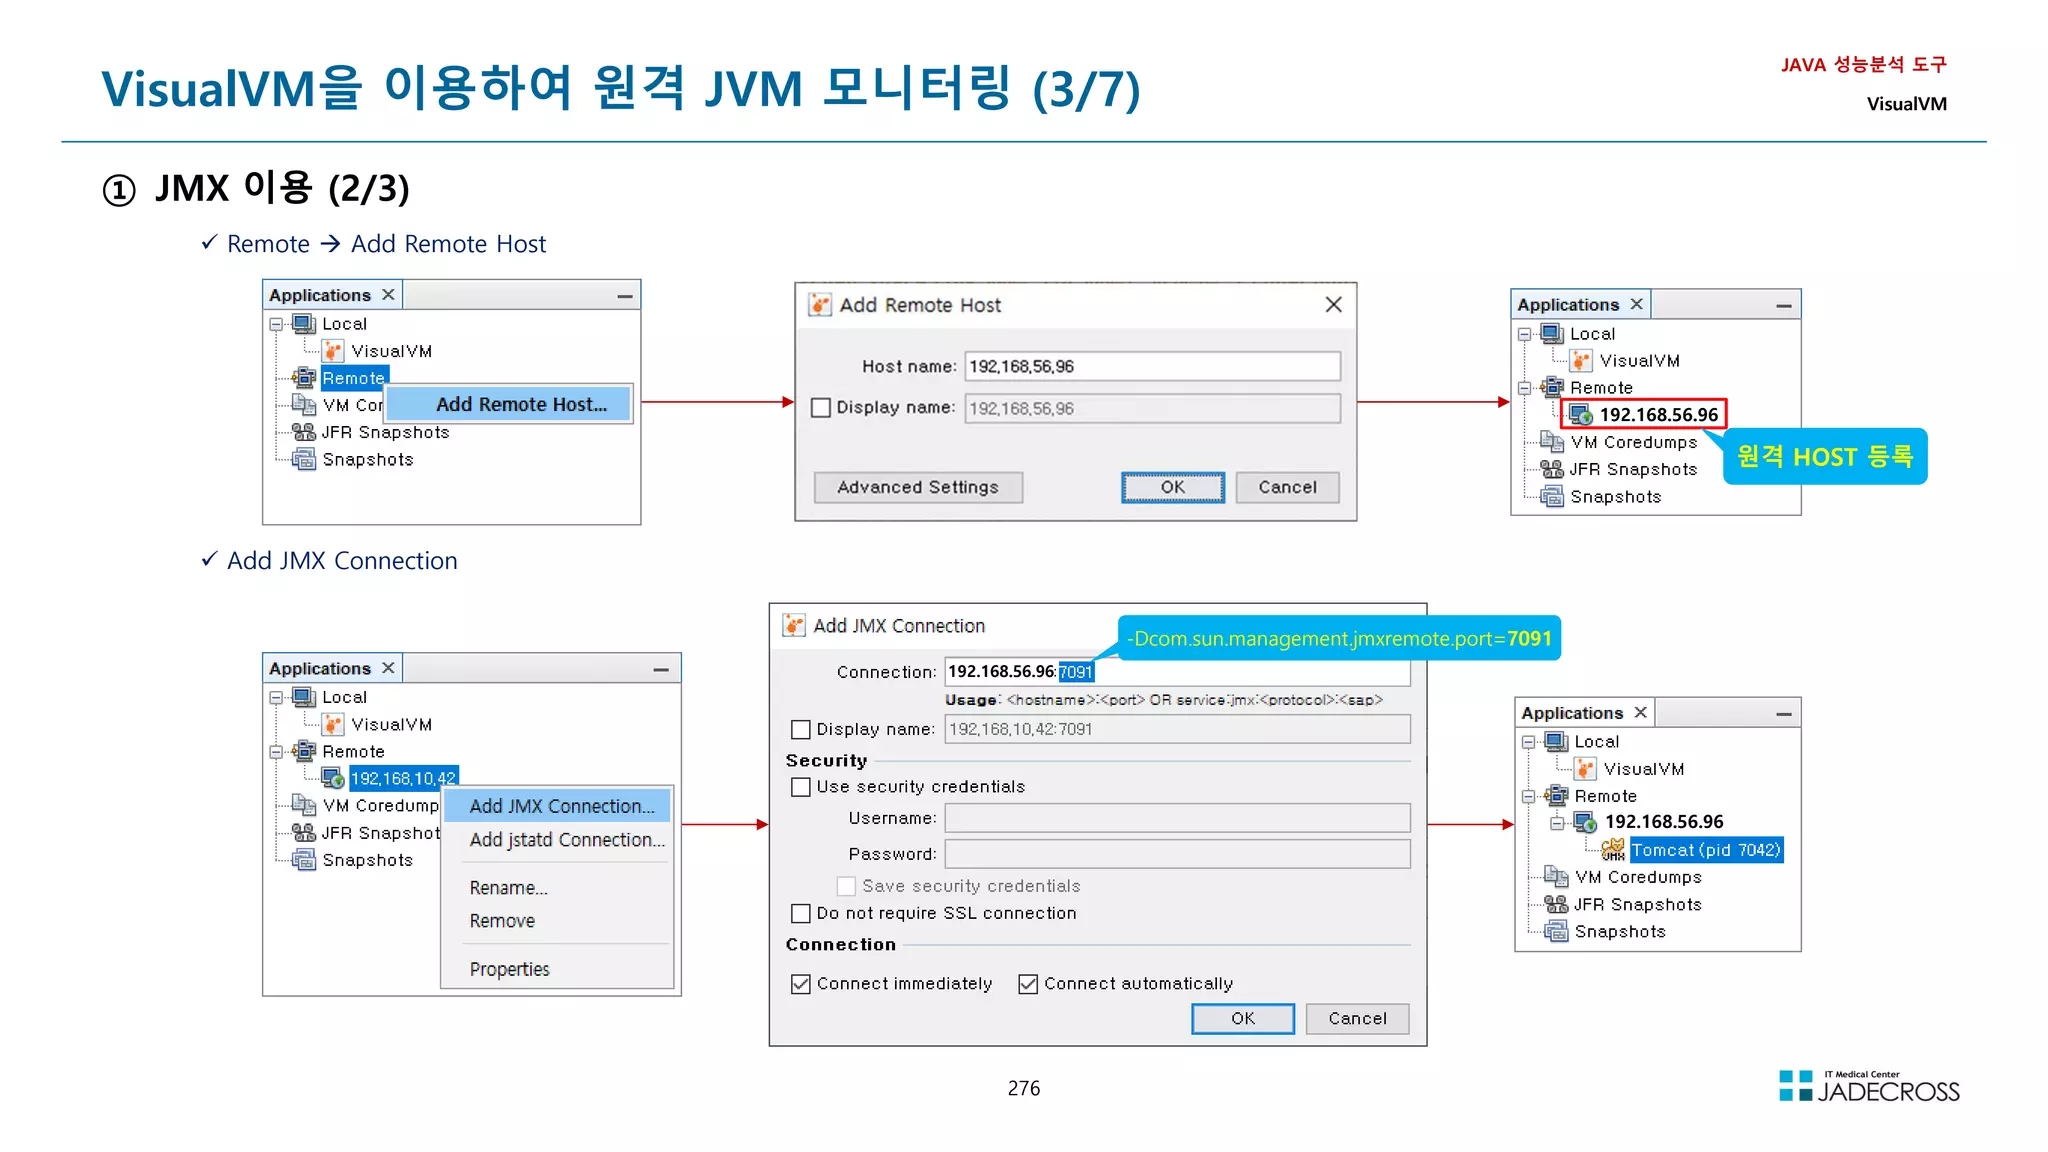
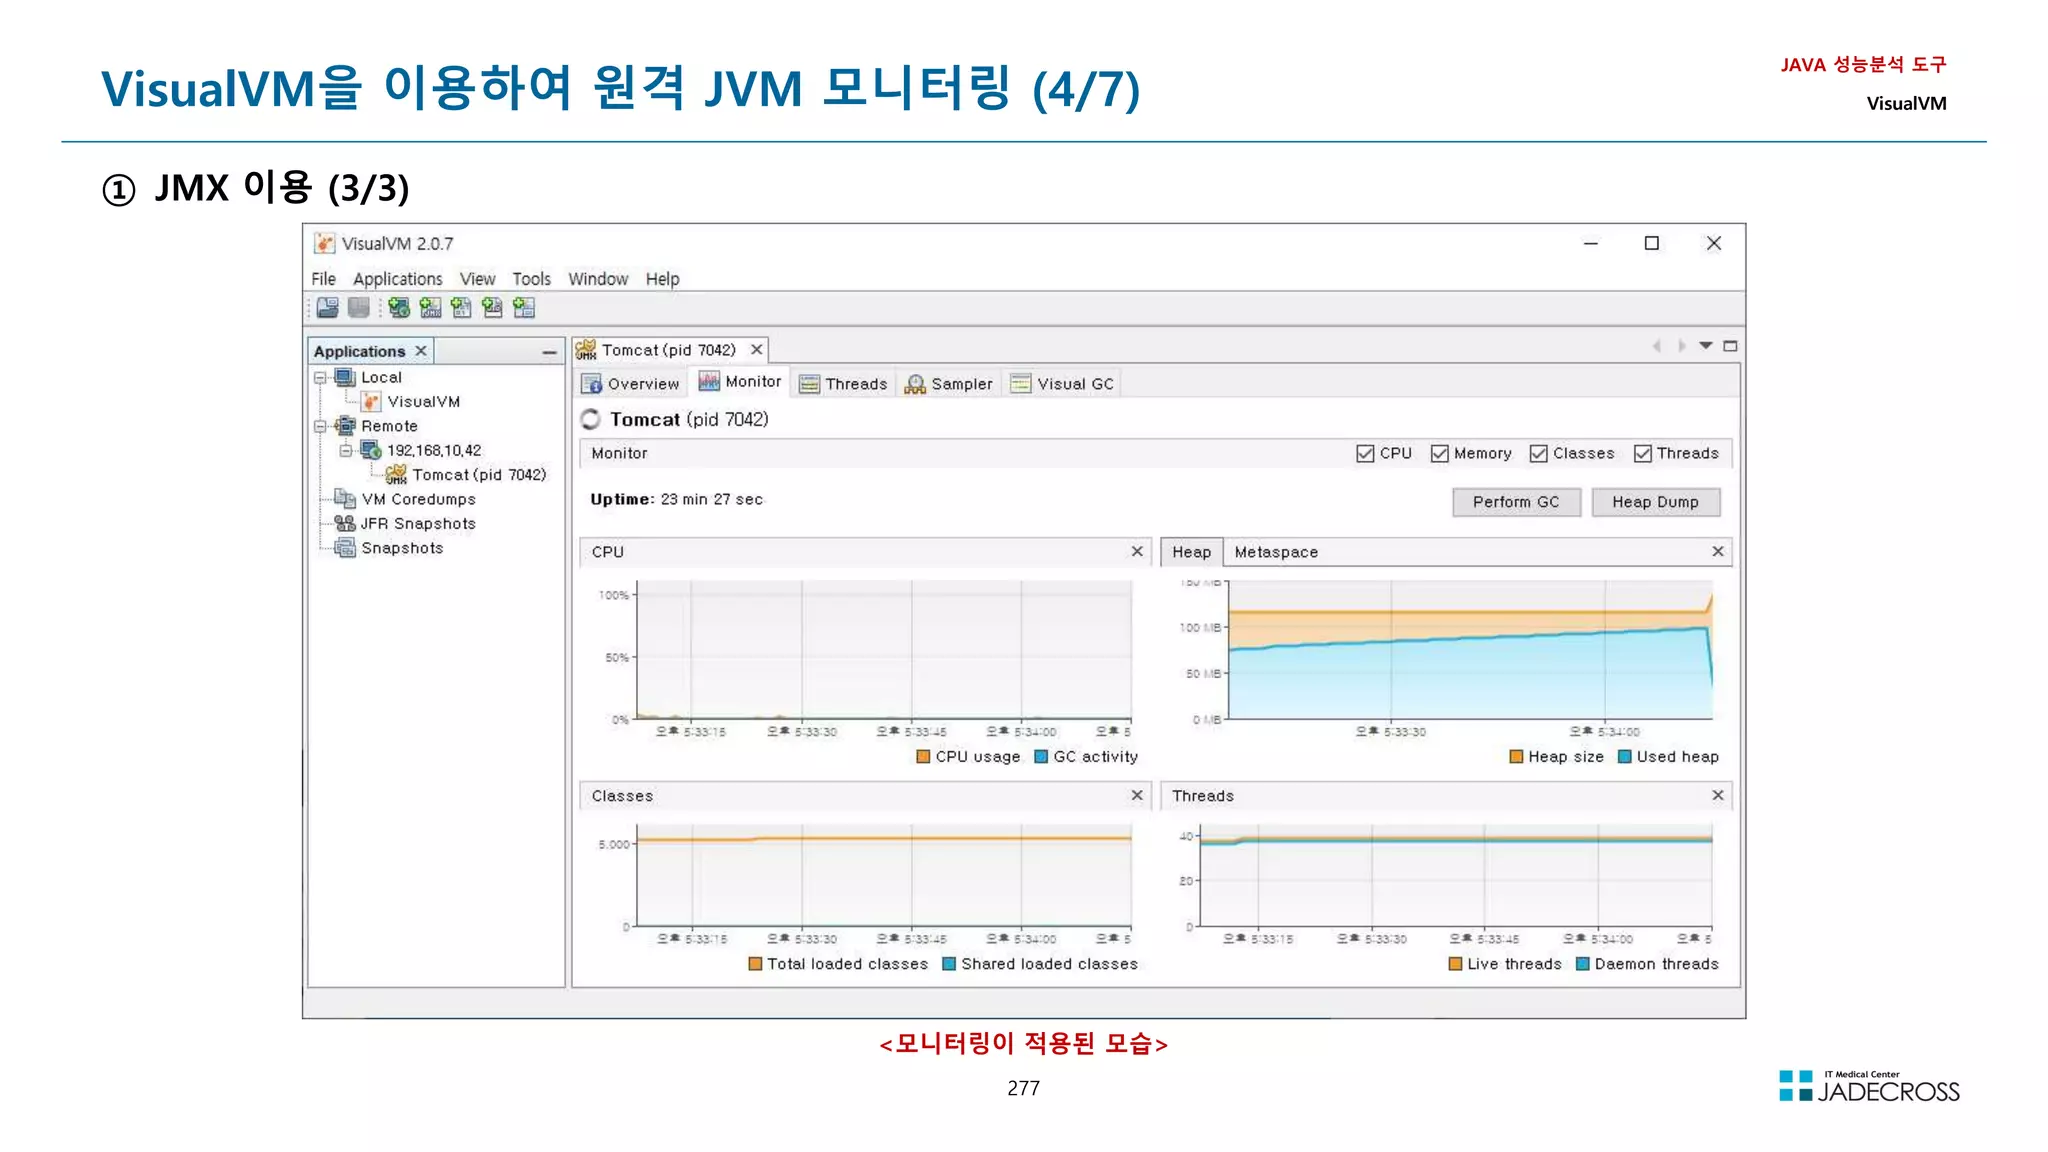
![278
참고) jstatd
JAVA 성능분석 도구
VisualVM
https://docs.oracle.com/javase/8/docs/technotes/tools/unix/jstatd.html
JVM 모니터링시 모든 자원에 접근할수 있도록 policy 파일을 생성한다.
[root@jvmedu ~]$ vi jstatd.all.policy
grant codebase
file:${java.home}/../lib/tools.jar{
permission java.security.AllPermission;
};
1099(default)포트를 사용하여 jstatd 를 실행
[root@jvmedu bin]$ jstatd -J-Djava.security.policy=./jstatd.all.policy -p 1099
-- 백그라운드로 실행하고 싶을때
nohup jstatd -J-Djava.security.policy=./jstatd.all.policy -p 1099 /dev/null 21
jstatd 와 rmiregistry
원칙적으로는 rmiregistry 1099 포트를 이용하여 먼저 실행한 뒤에 jstatd를 실행해야 하지만
jstatd가 스스로 RMI Registry가 없으면 생성한다.](https://image.slidesharecdn.com/jvm-230511085906-be6f1201/75/JVM_-pdf-278-2048.jpg)
![279
VisualVM을 이용하여 원격 JVM 모니터링 (5/7)
② jstatd 이용 (1/3)
jstatd 데몬을 이용하여 JVM을 수행한 계정에 종속된 여러 JVM을 한꺼번에 모니터링 가능
JAVA 성능분석 도구
VisualVM
JVM 모니터링시 모든 자원에 접근할수 있도록 policy 파일을 생성한다.
[tomcat6adm@was1 ~]$ vi jstatd.all.policy
grant codebase
file:${java.home}/../lib/tools.jar{
permission java.security.AllPermission;
};
1099(default)포트를 사용하여 jstatd 를 실행
[tomcat6adm@was1 bin]$ jstatd -J-Djava.security.policy=./jstatd.all.policy -p 1099
-- 백그라운드로 실행하고 싶을때
nohup jstatd -J-Djava.security.policy=./jstatd.all.policy -p 1099 /dev/null 21](https://image.slidesharecdn.com/jvm-230511085906-be6f1201/75/JVM_-pdf-279-2048.jpg)
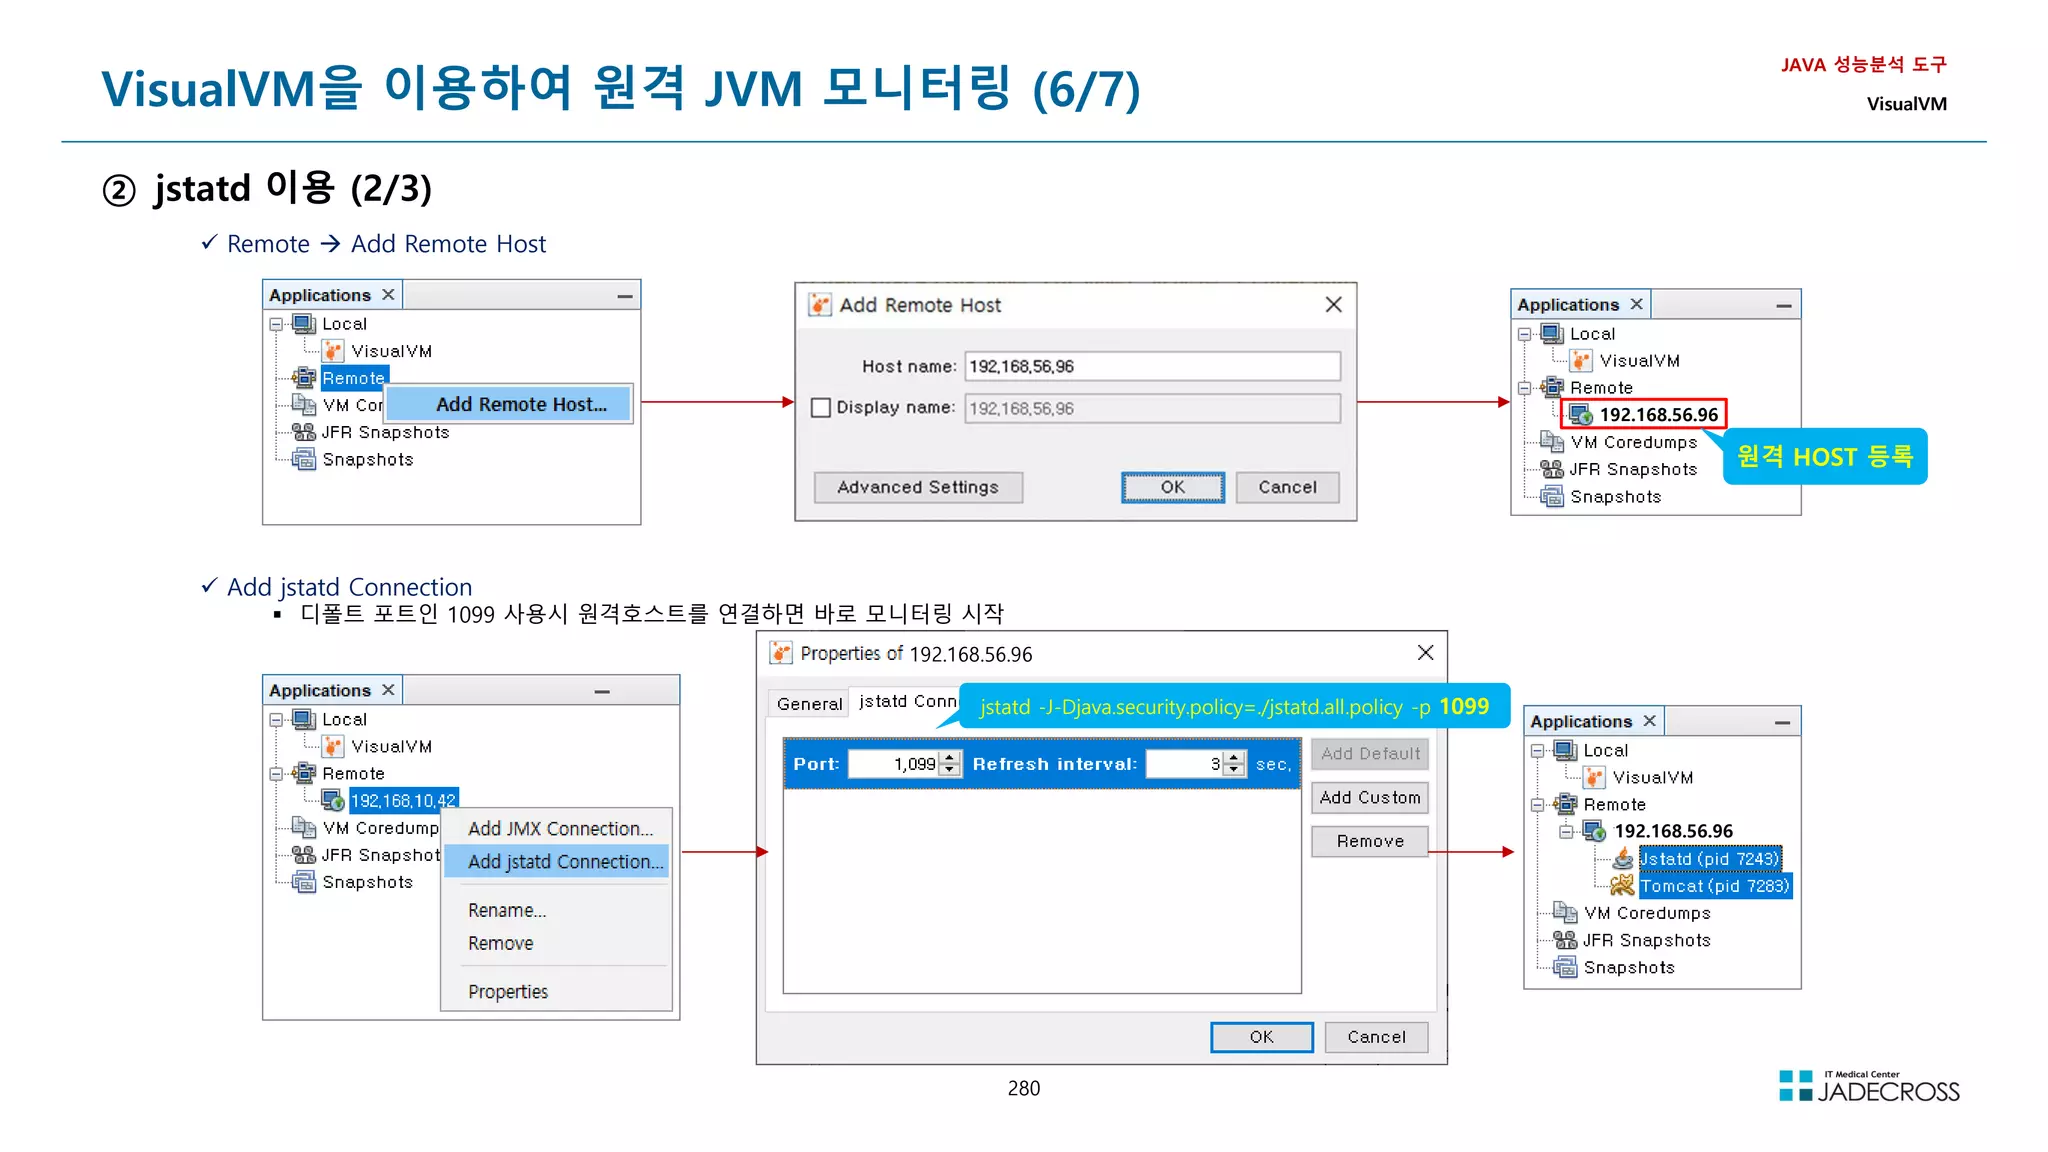
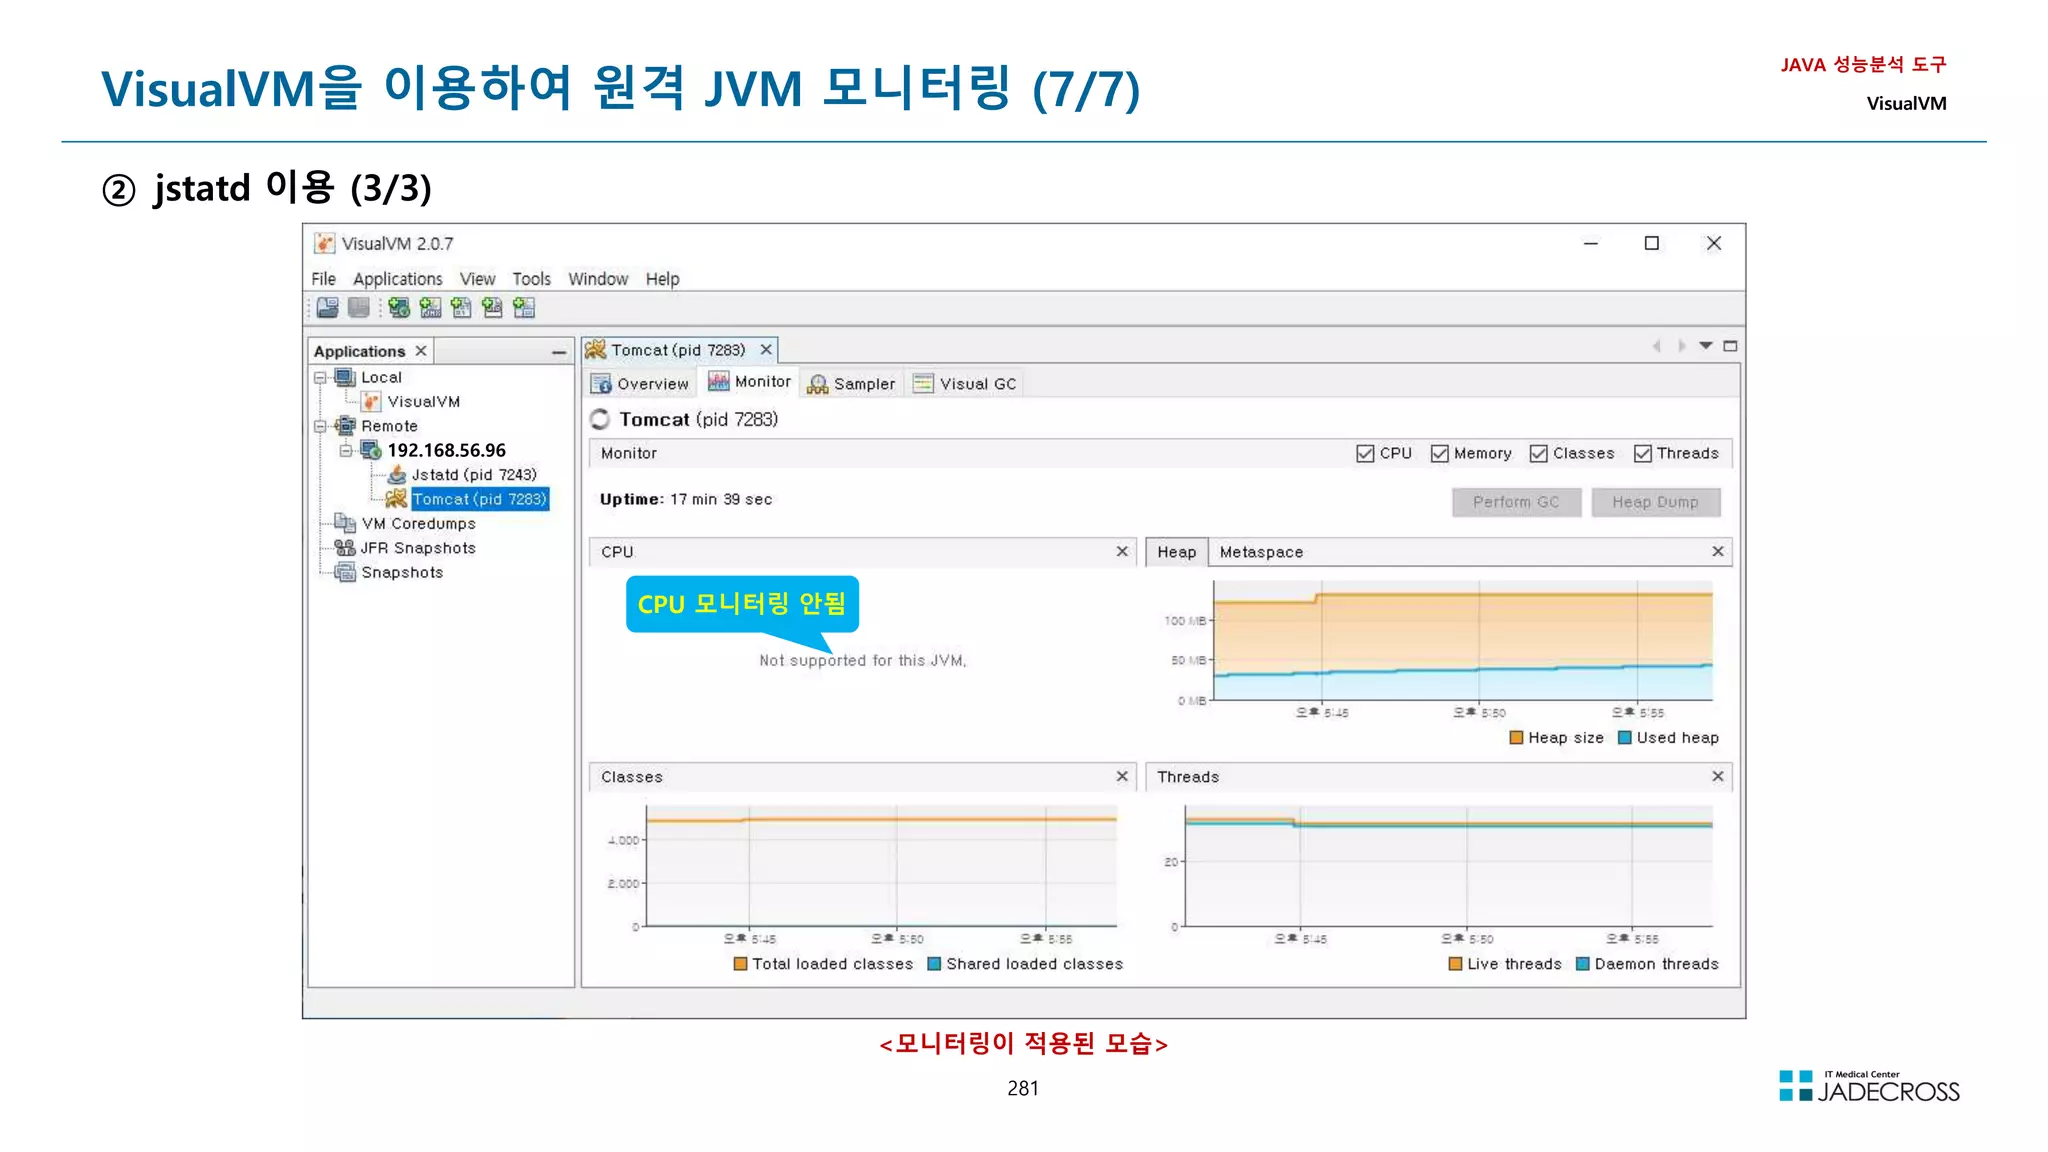
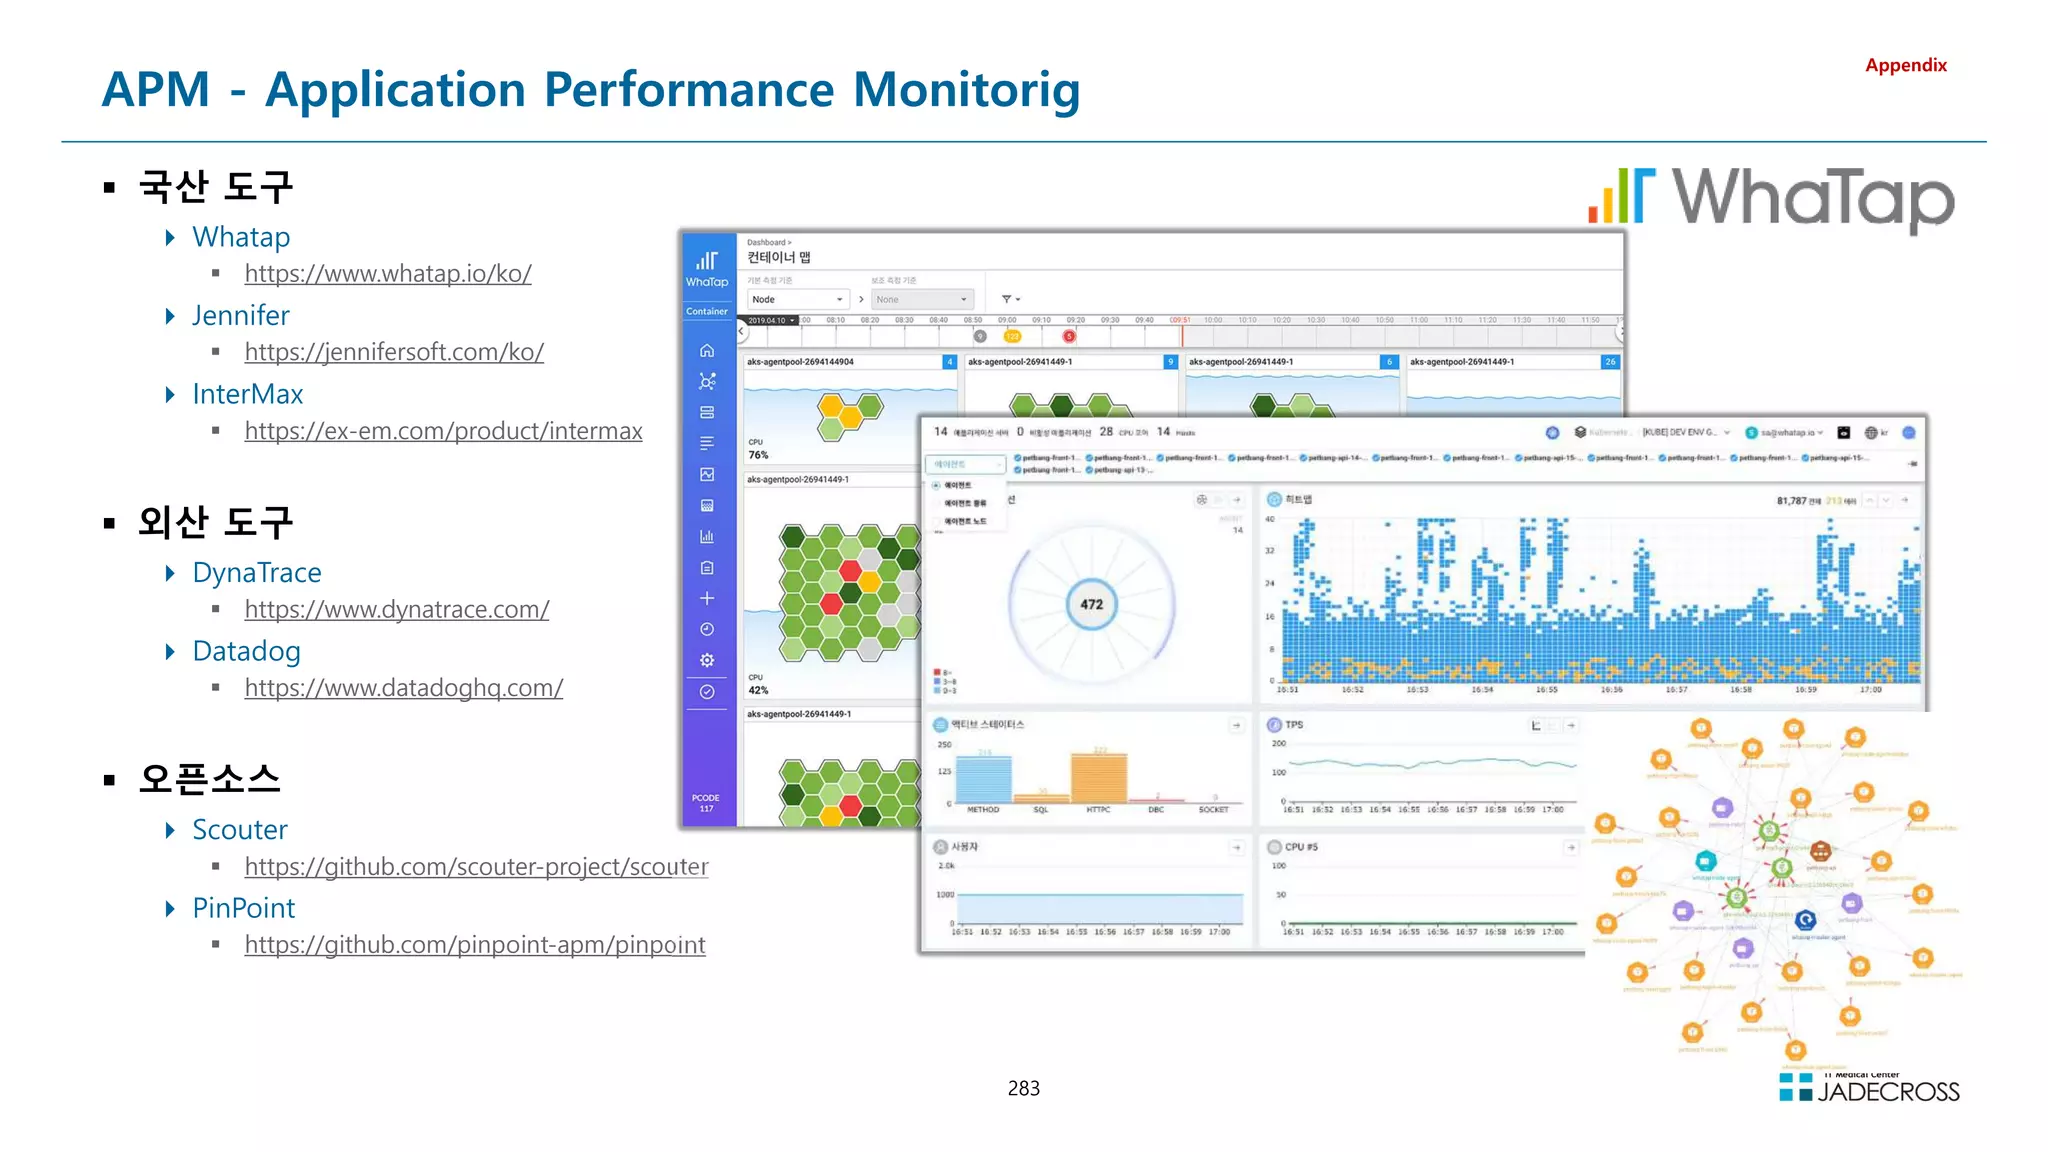


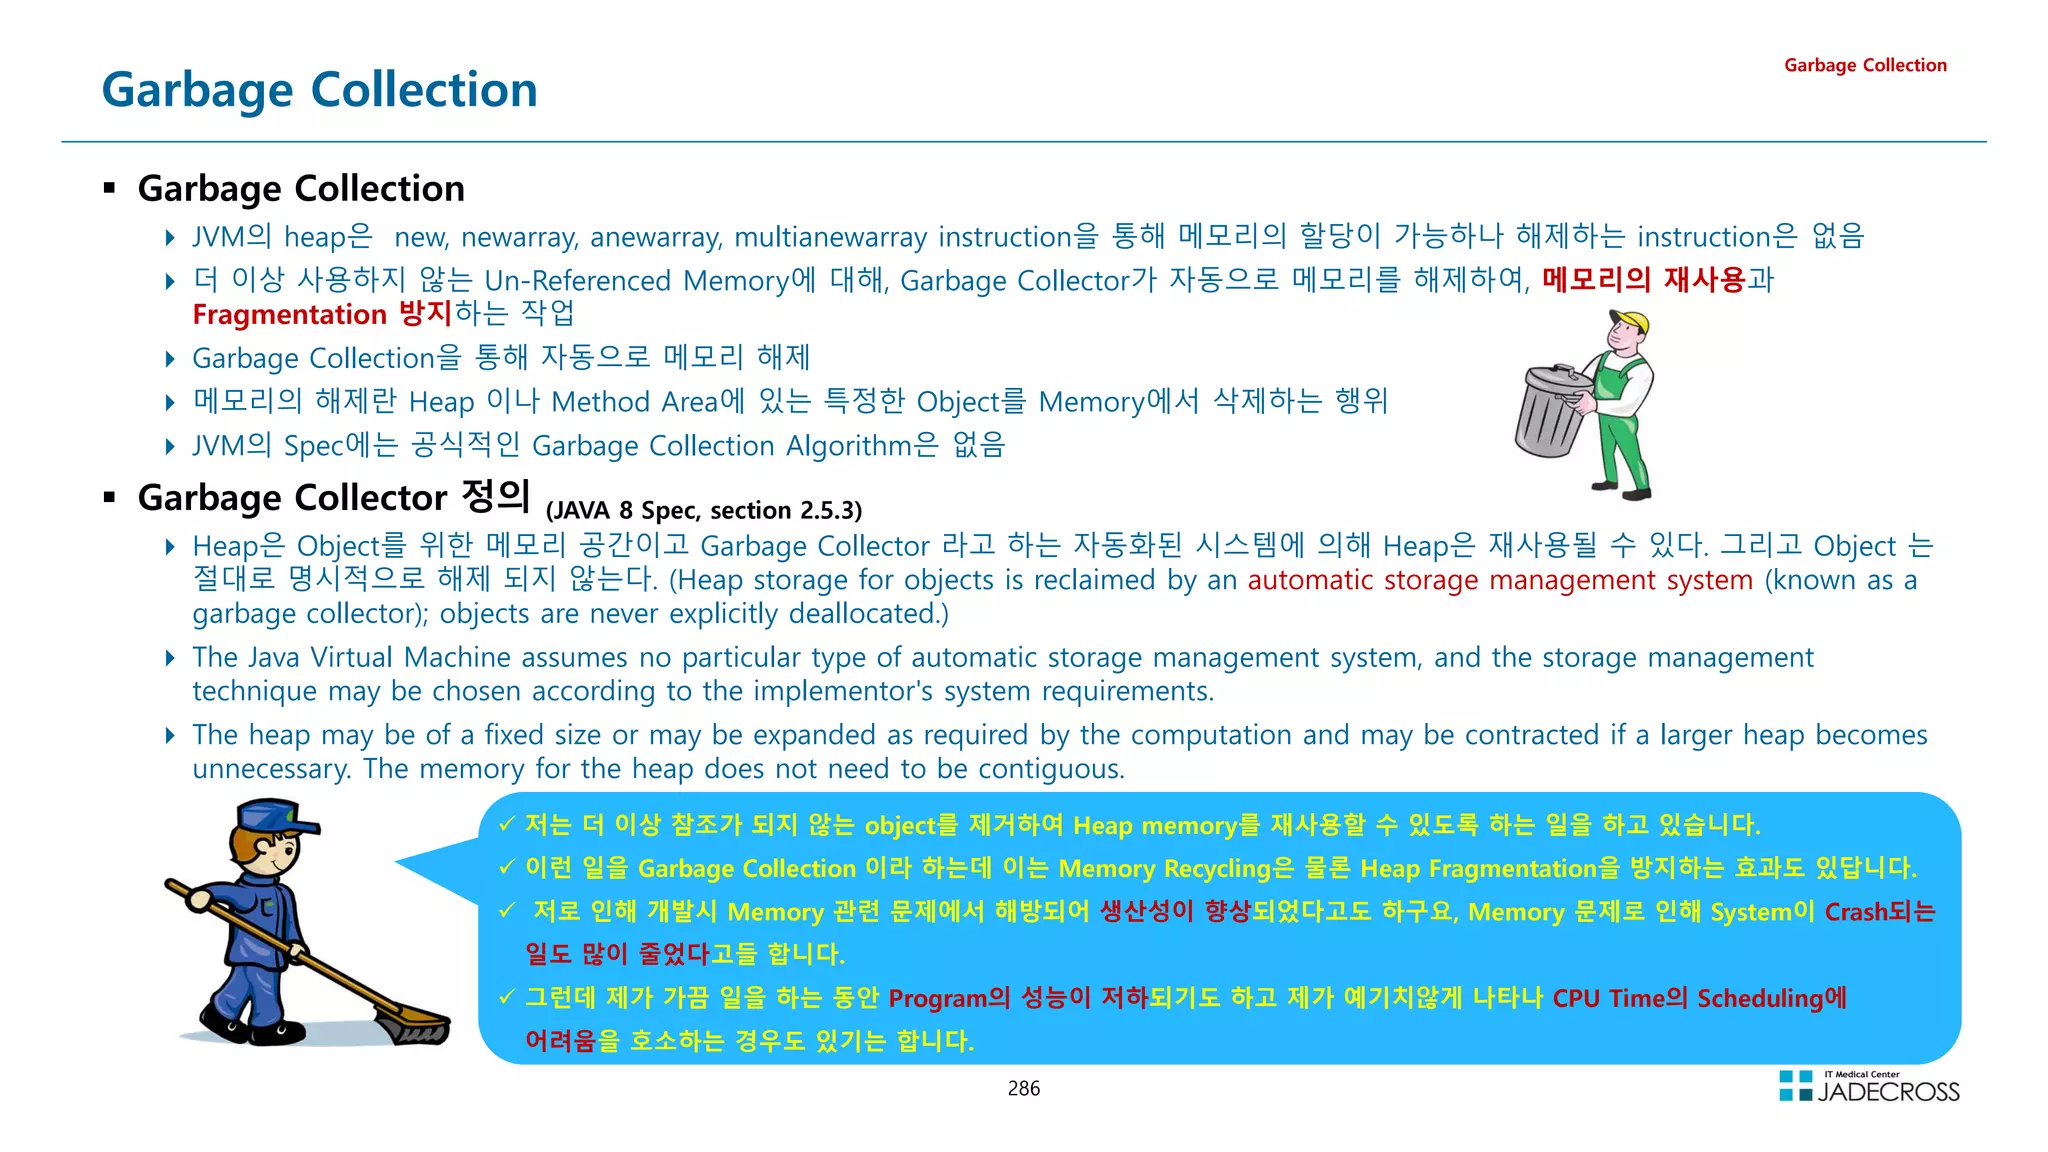
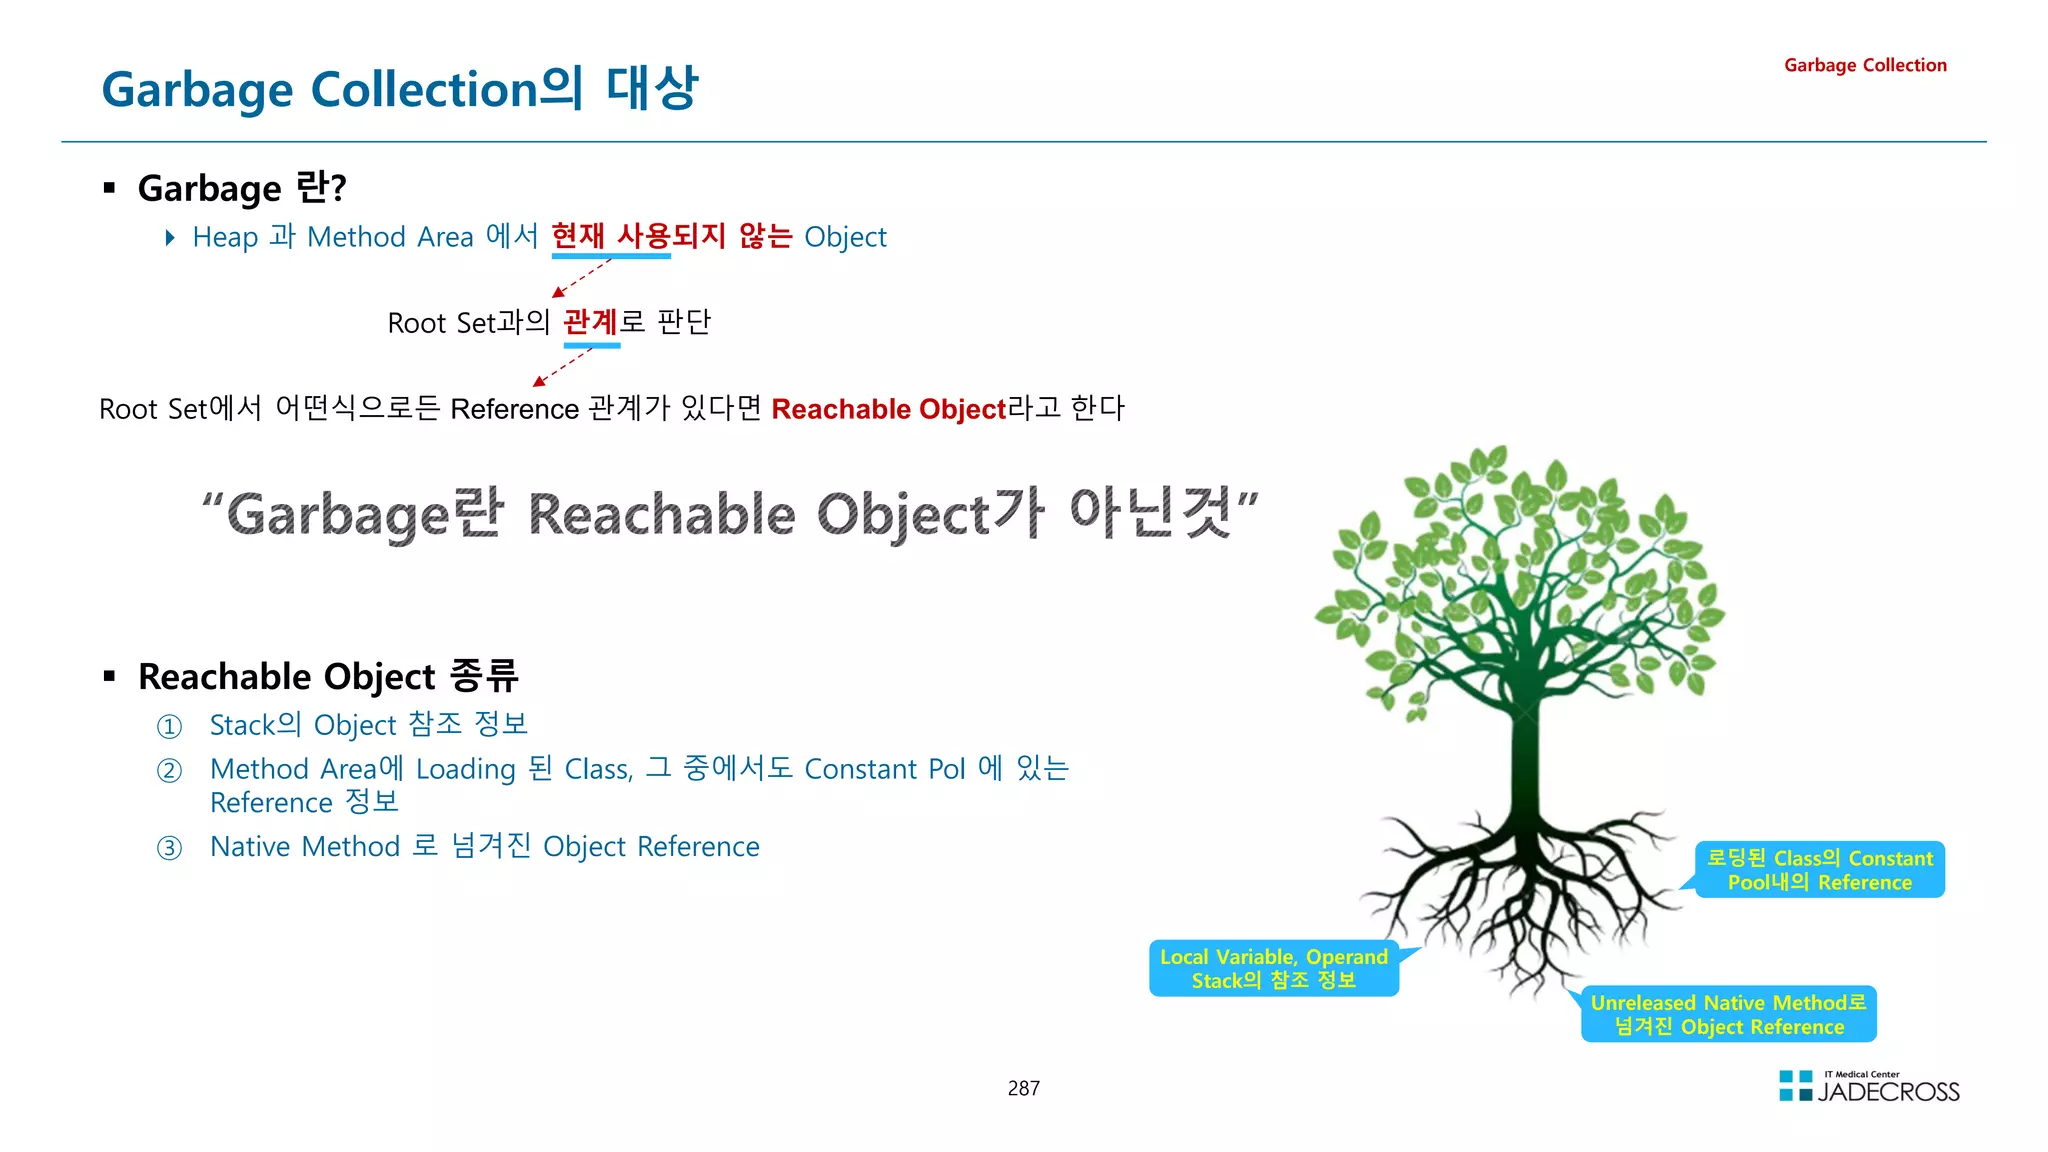

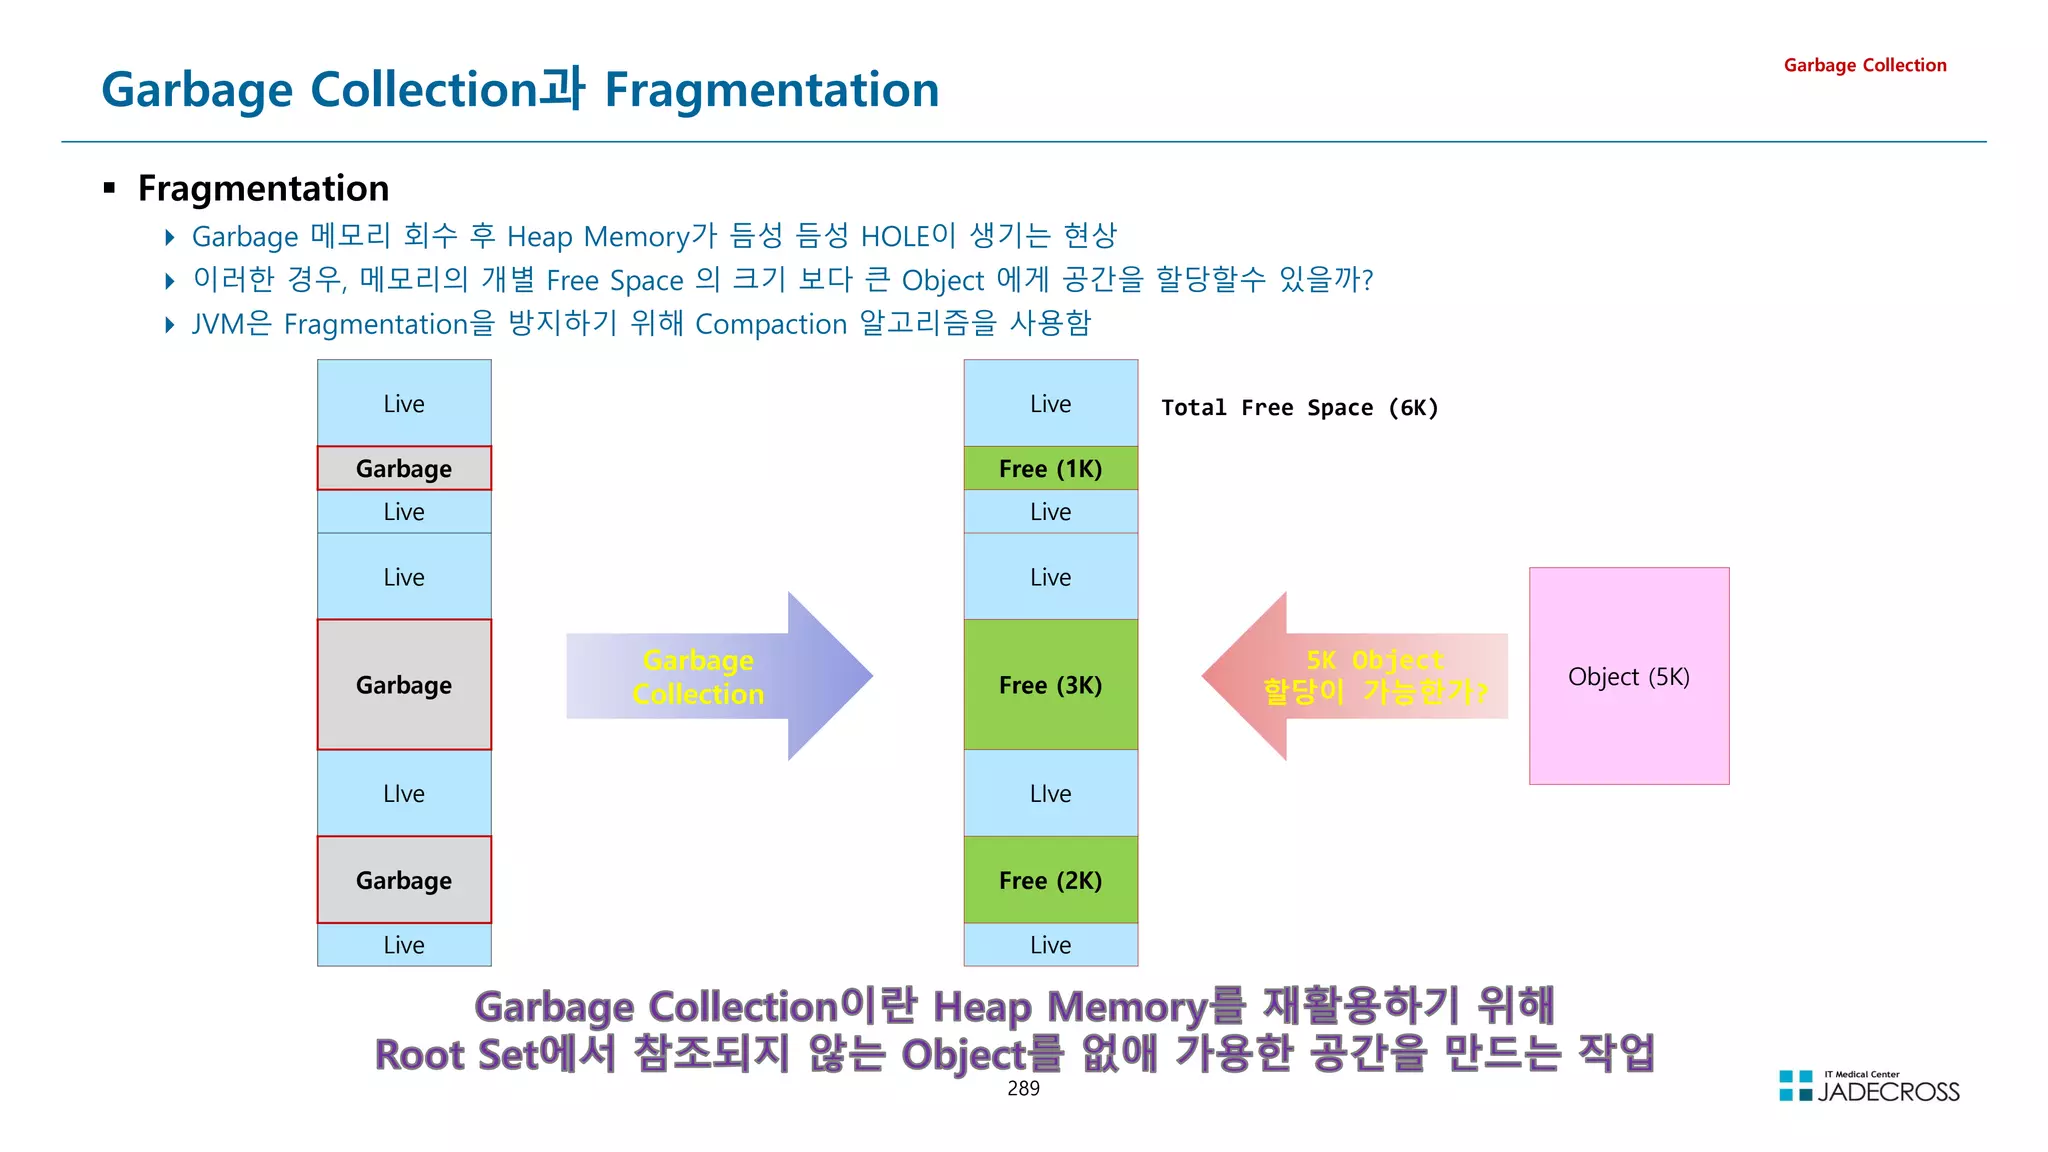
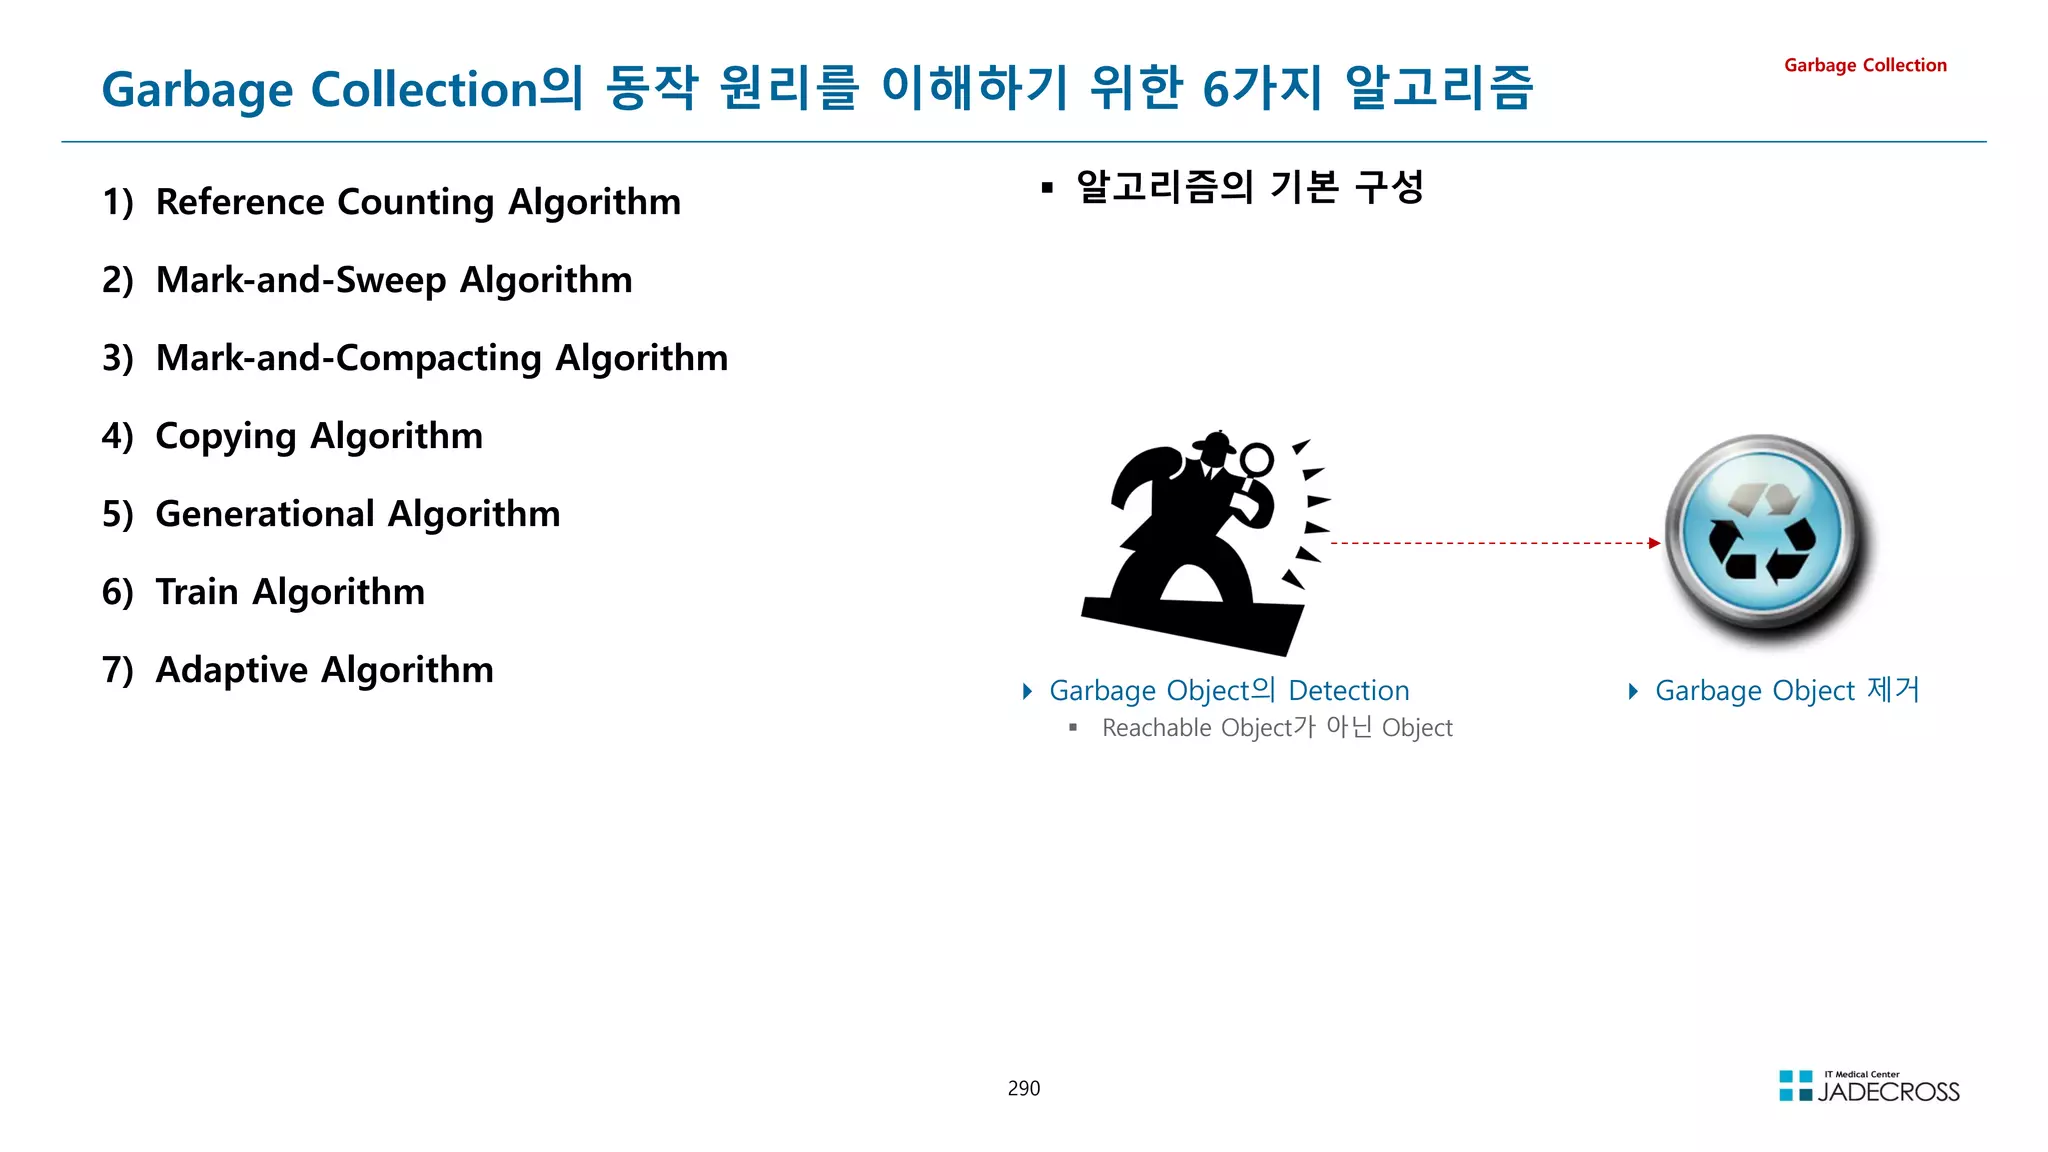
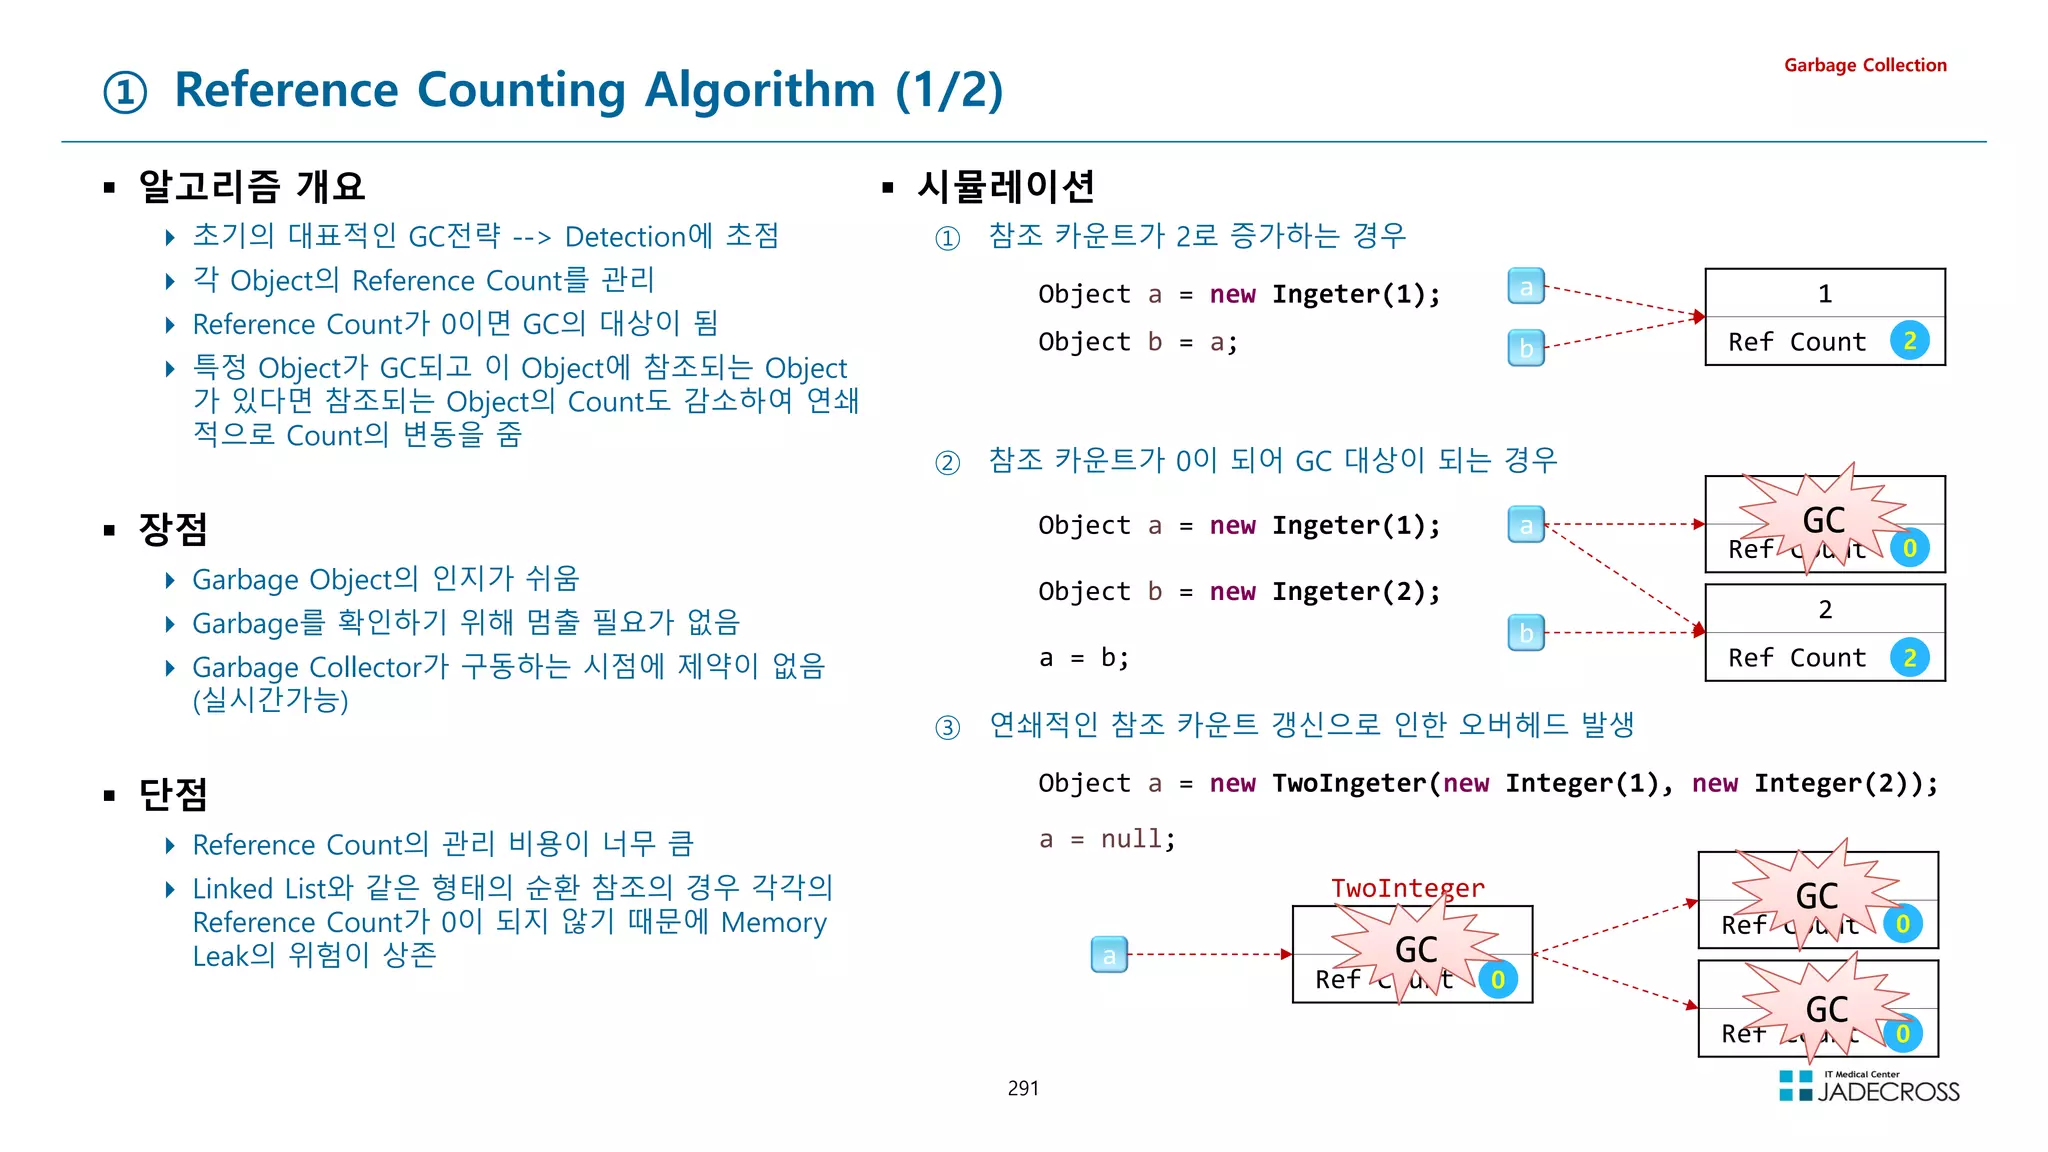
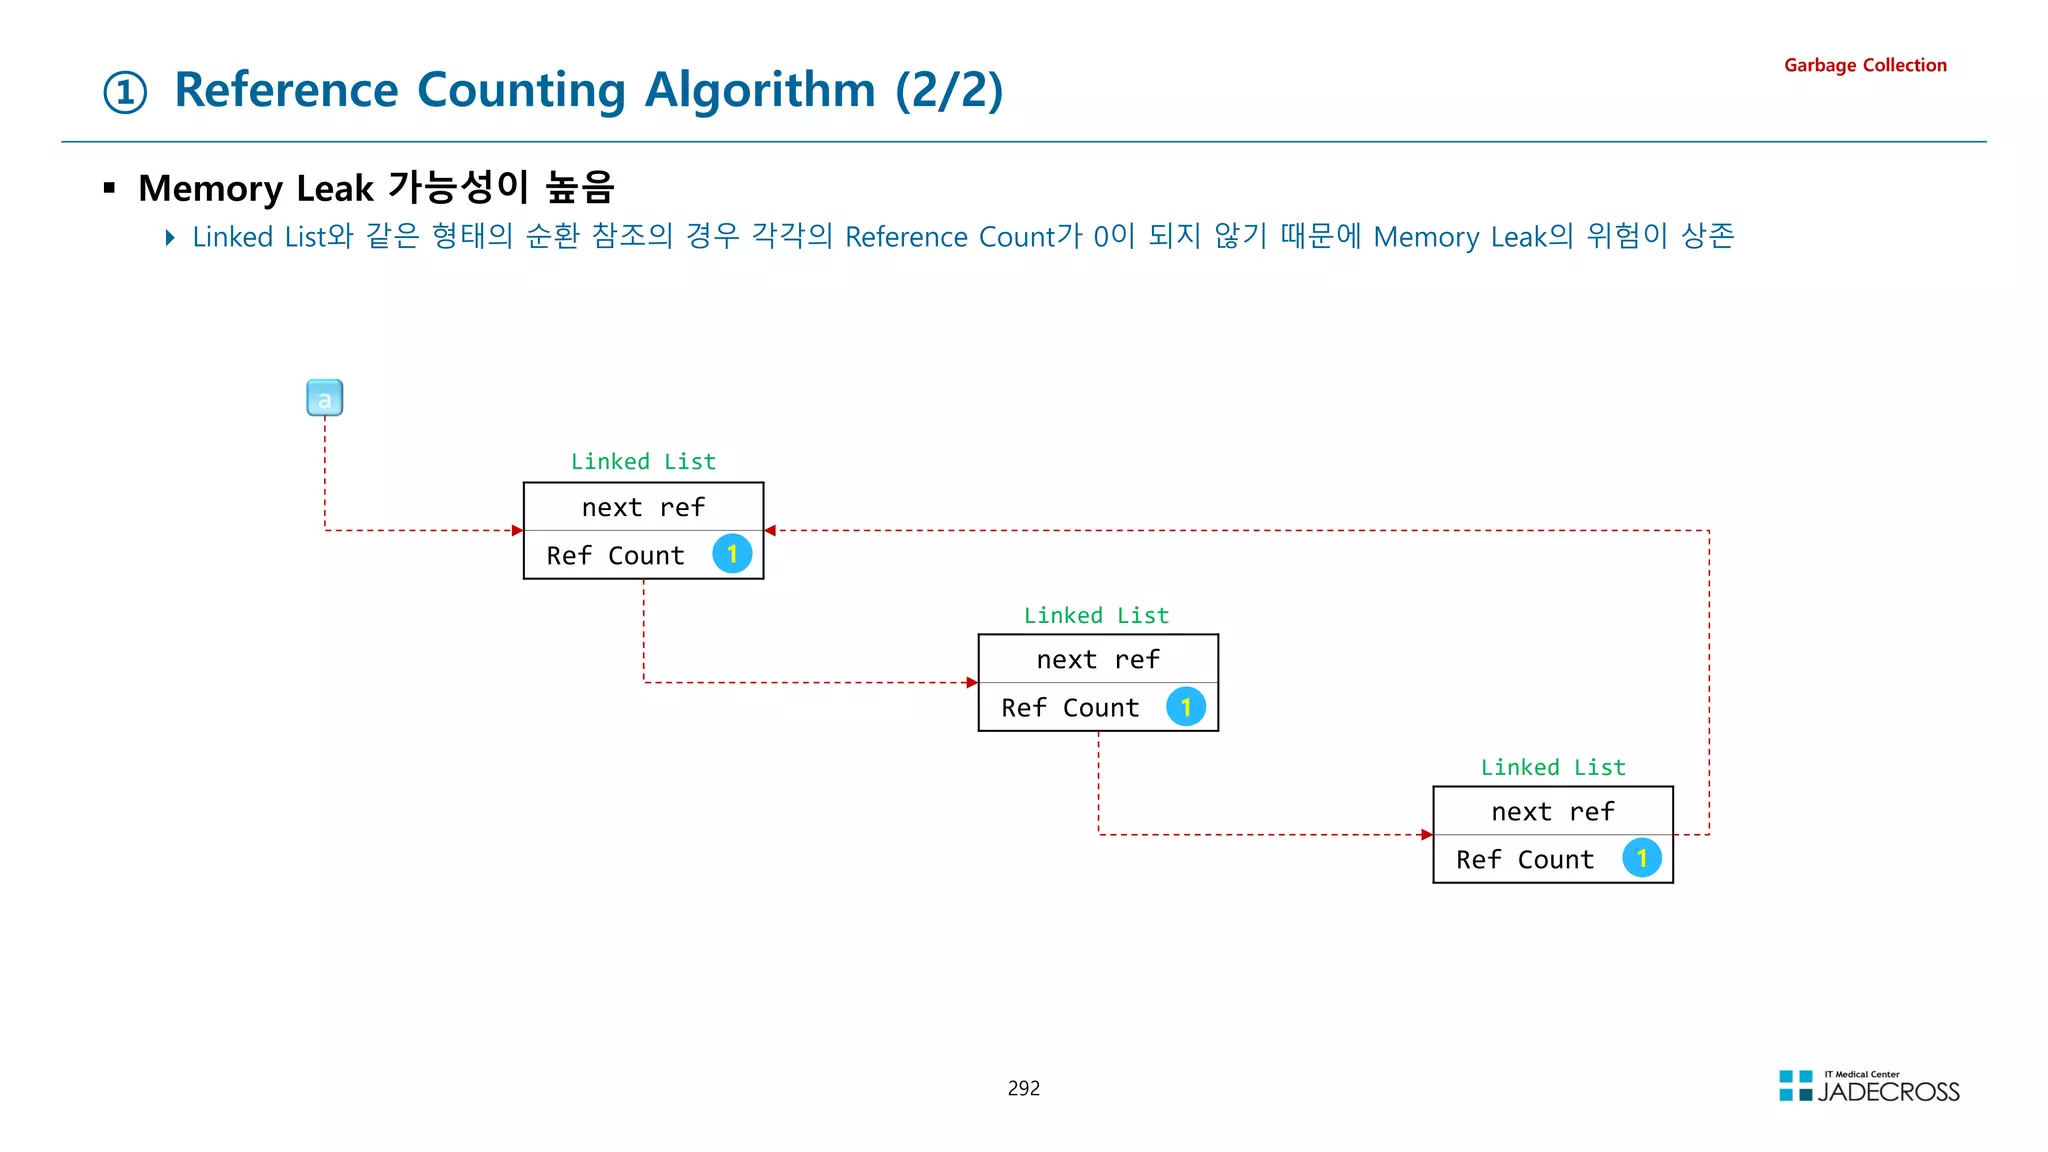
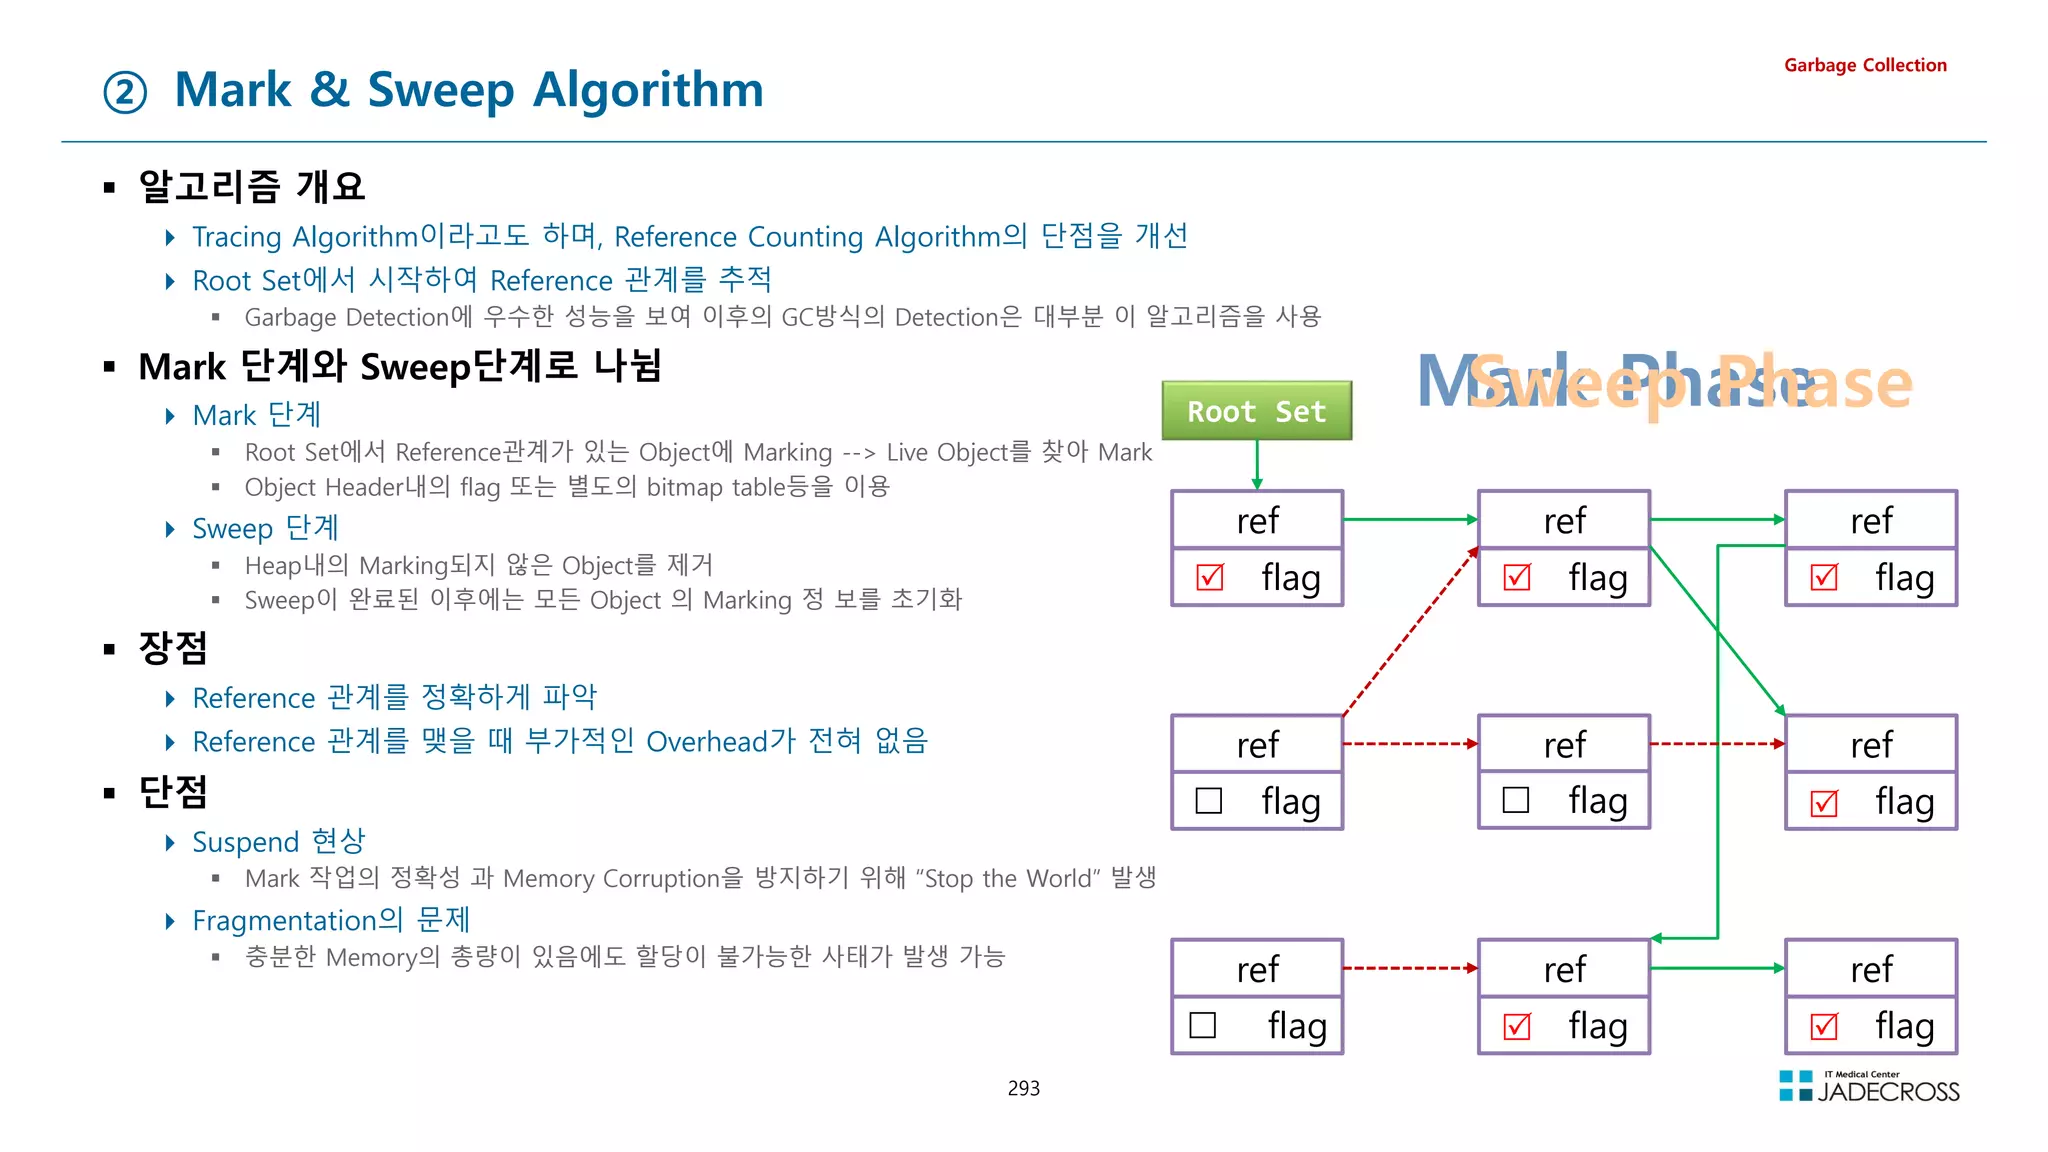
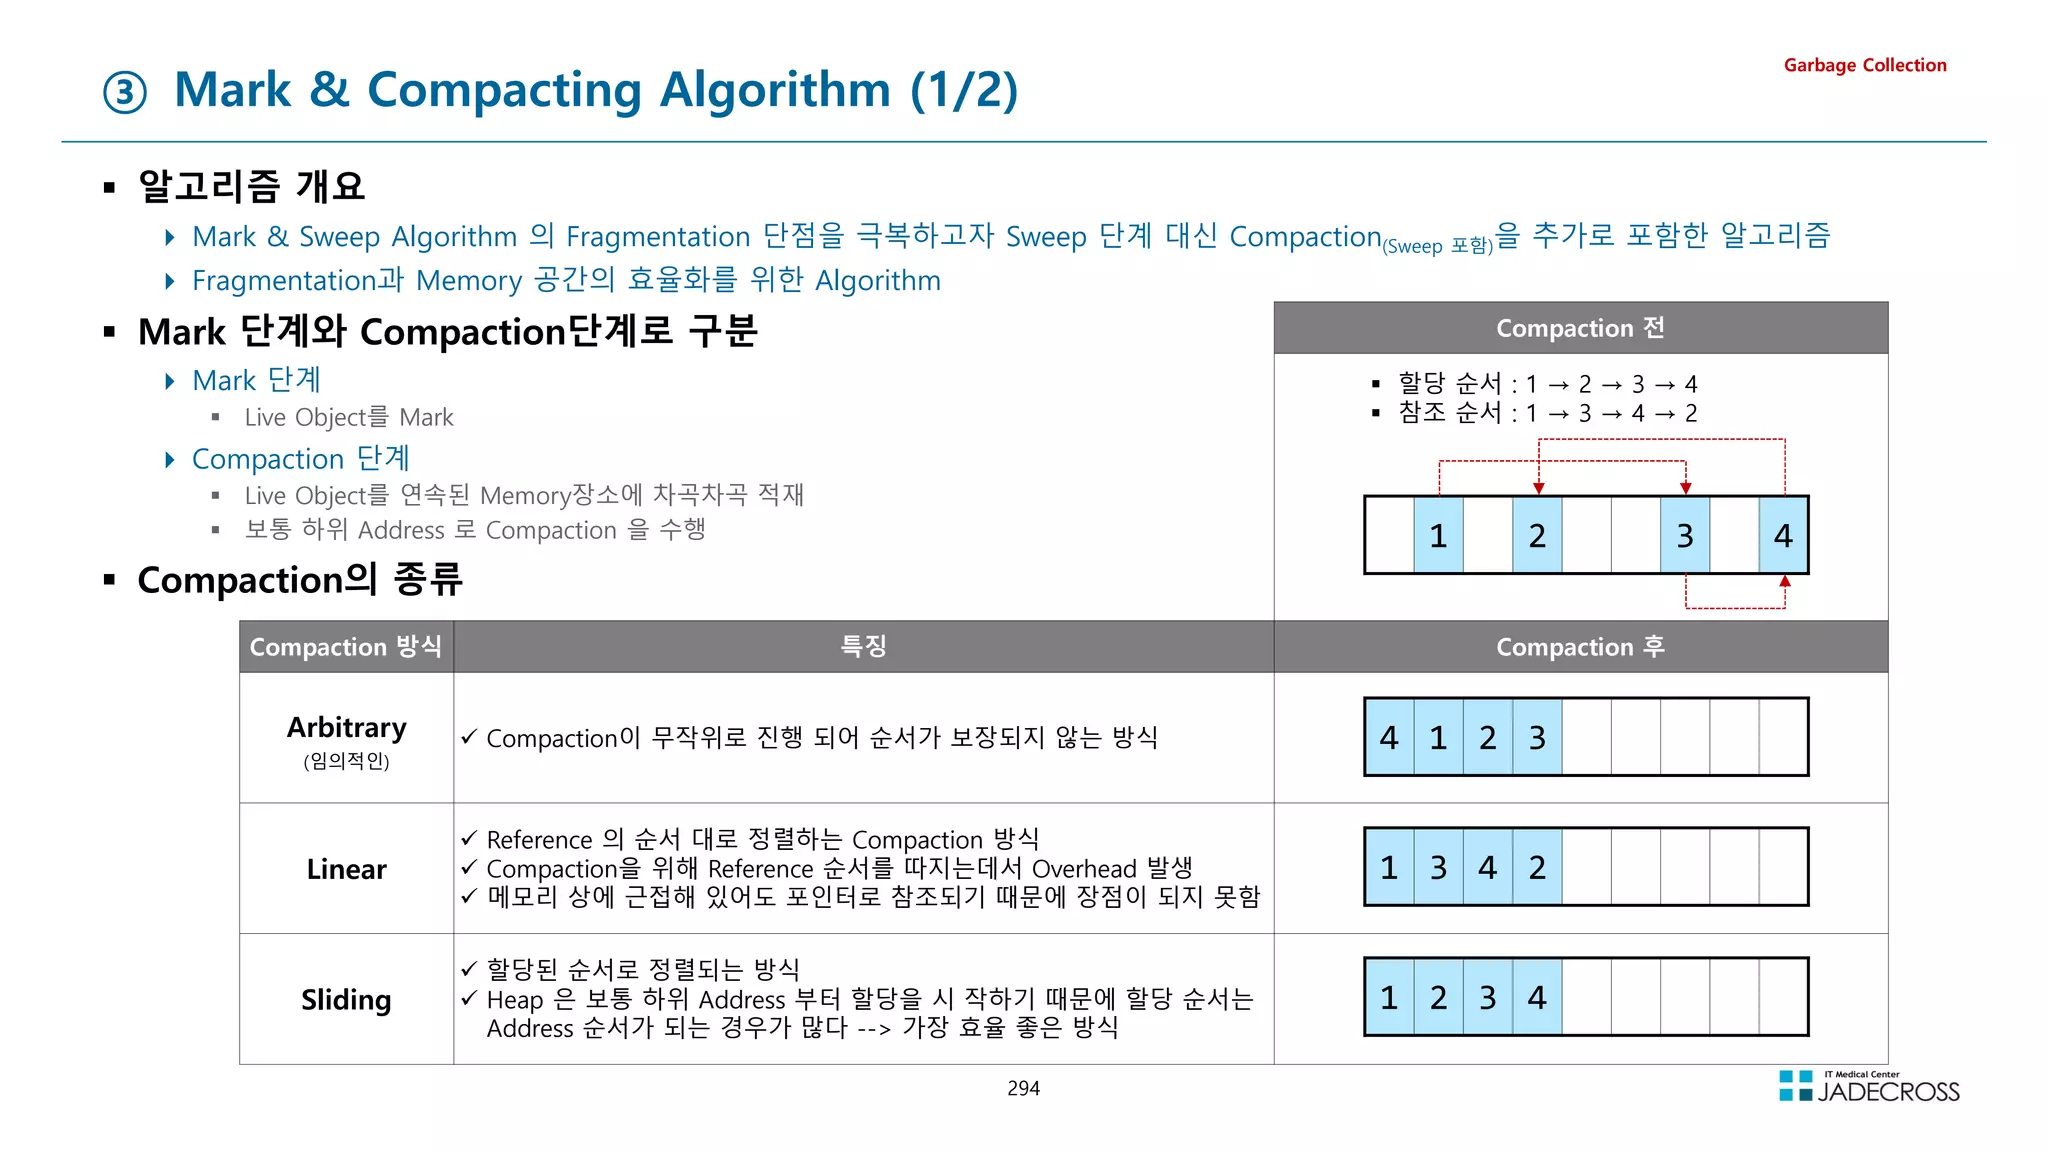
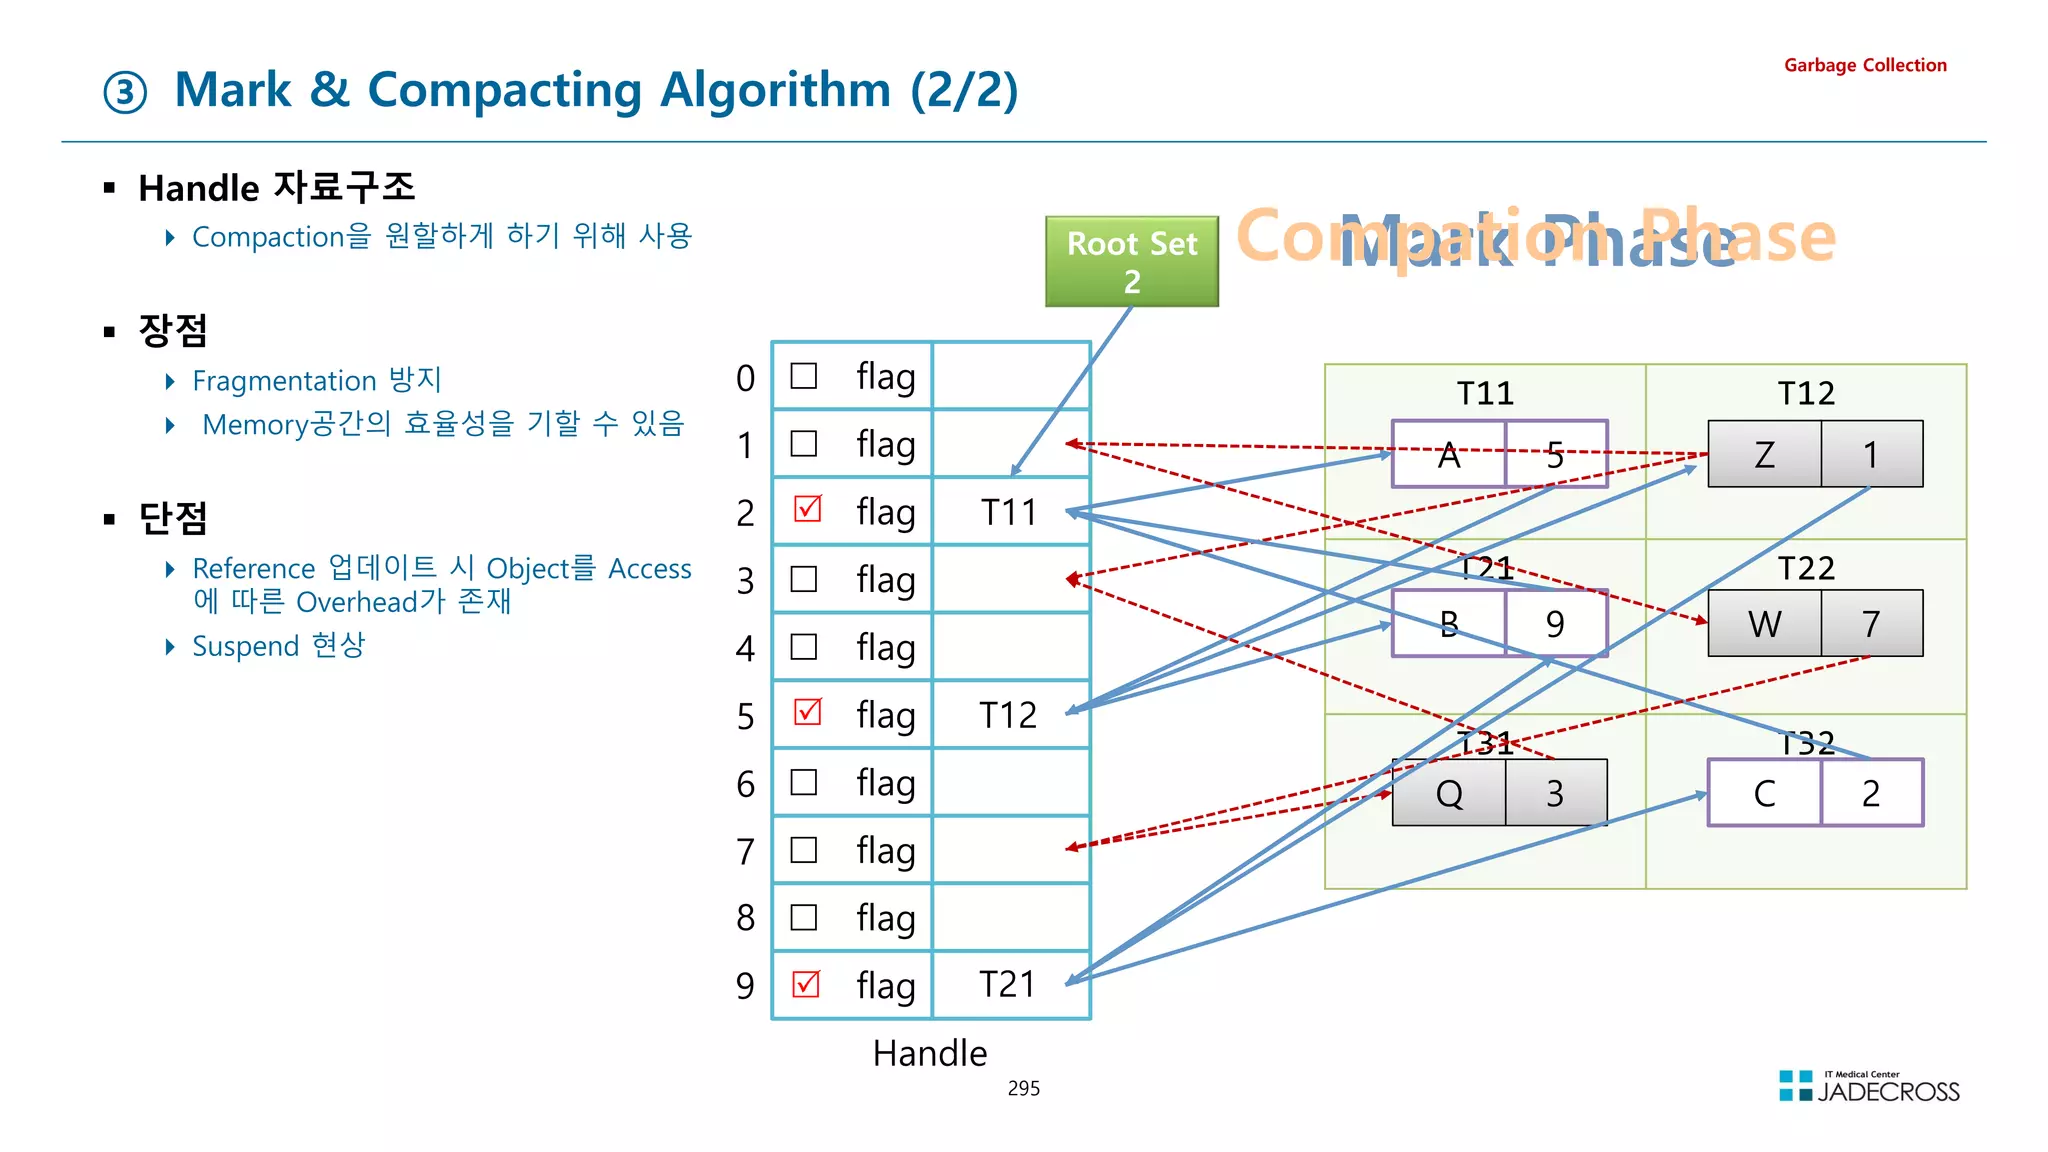
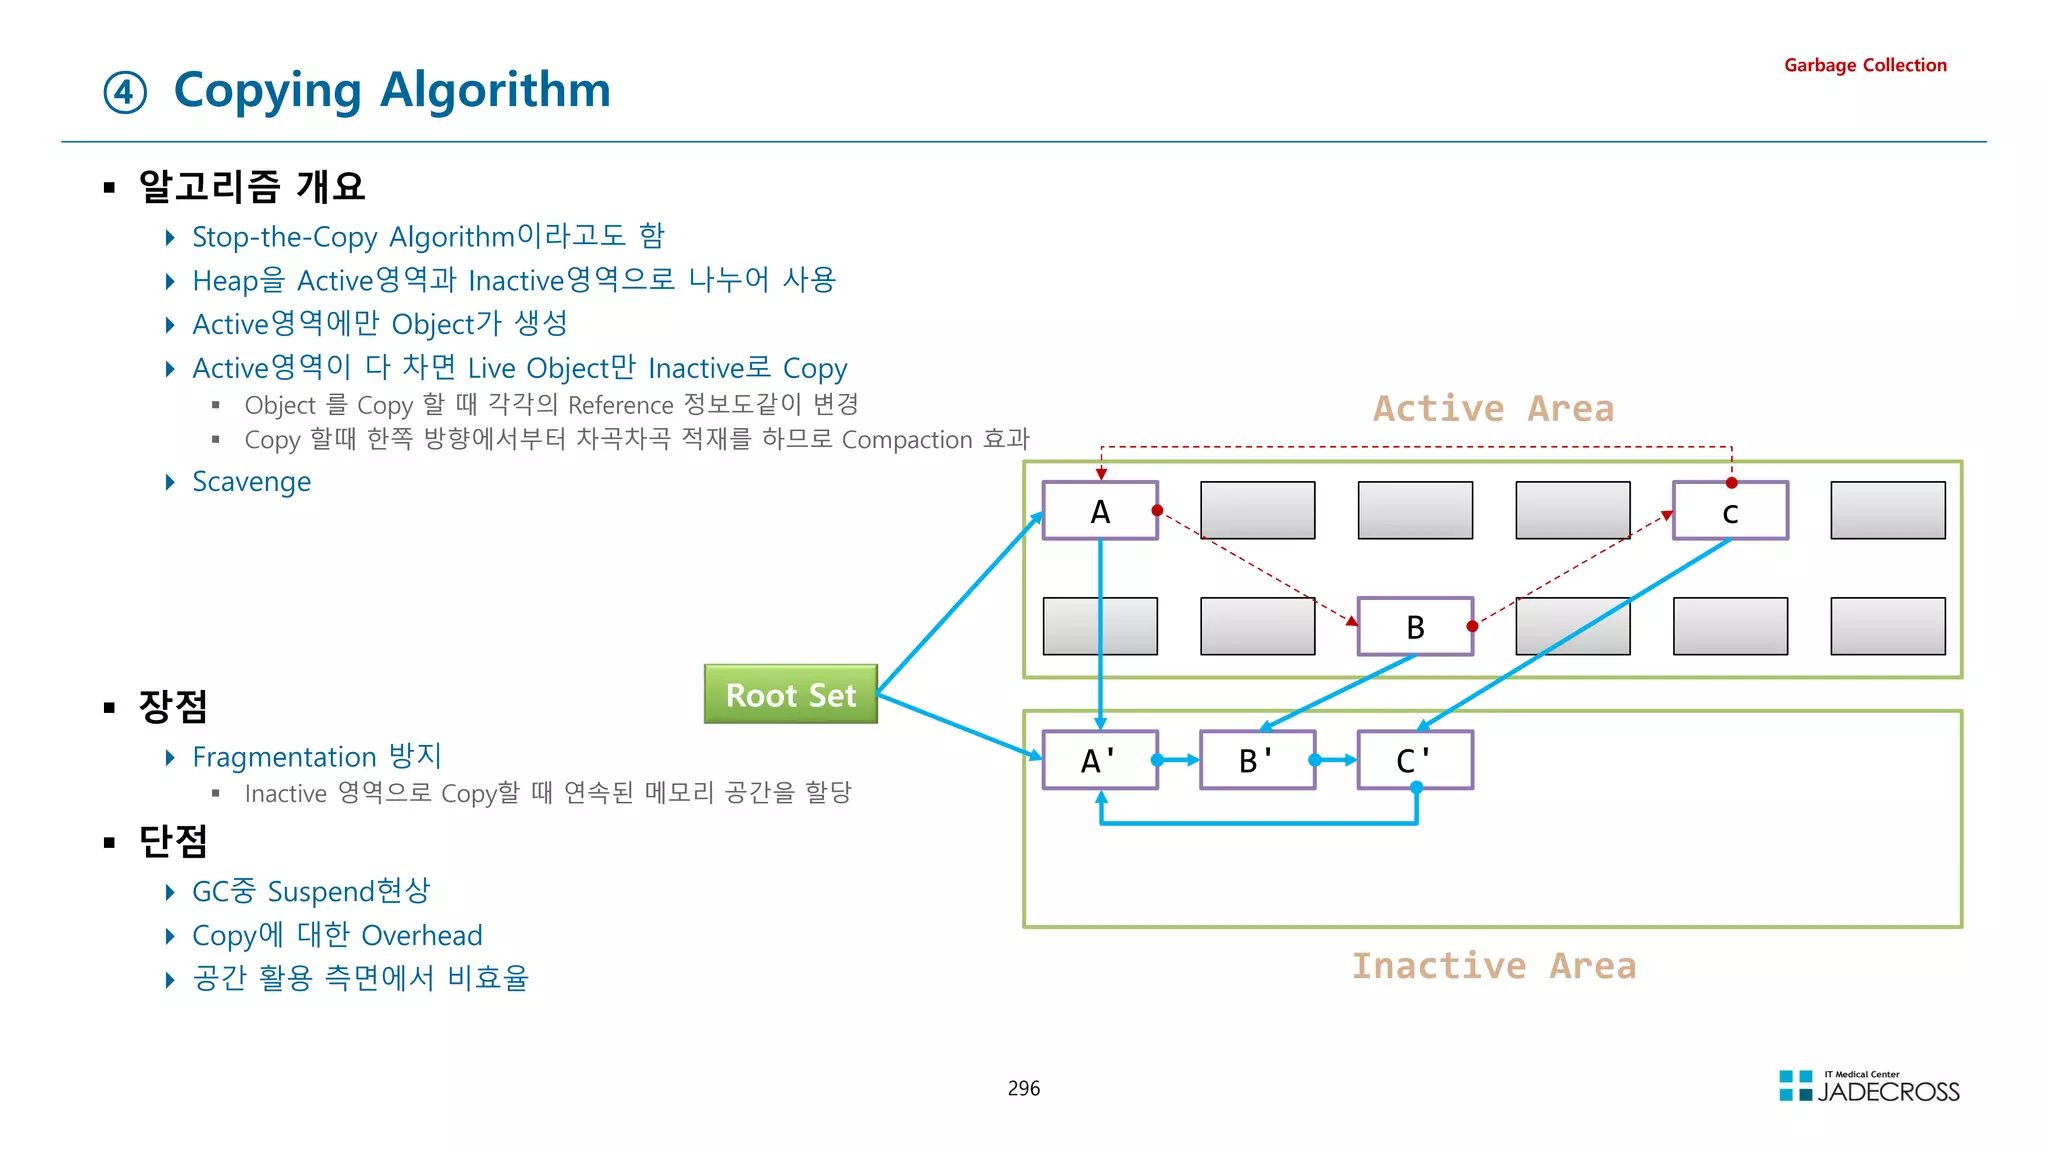
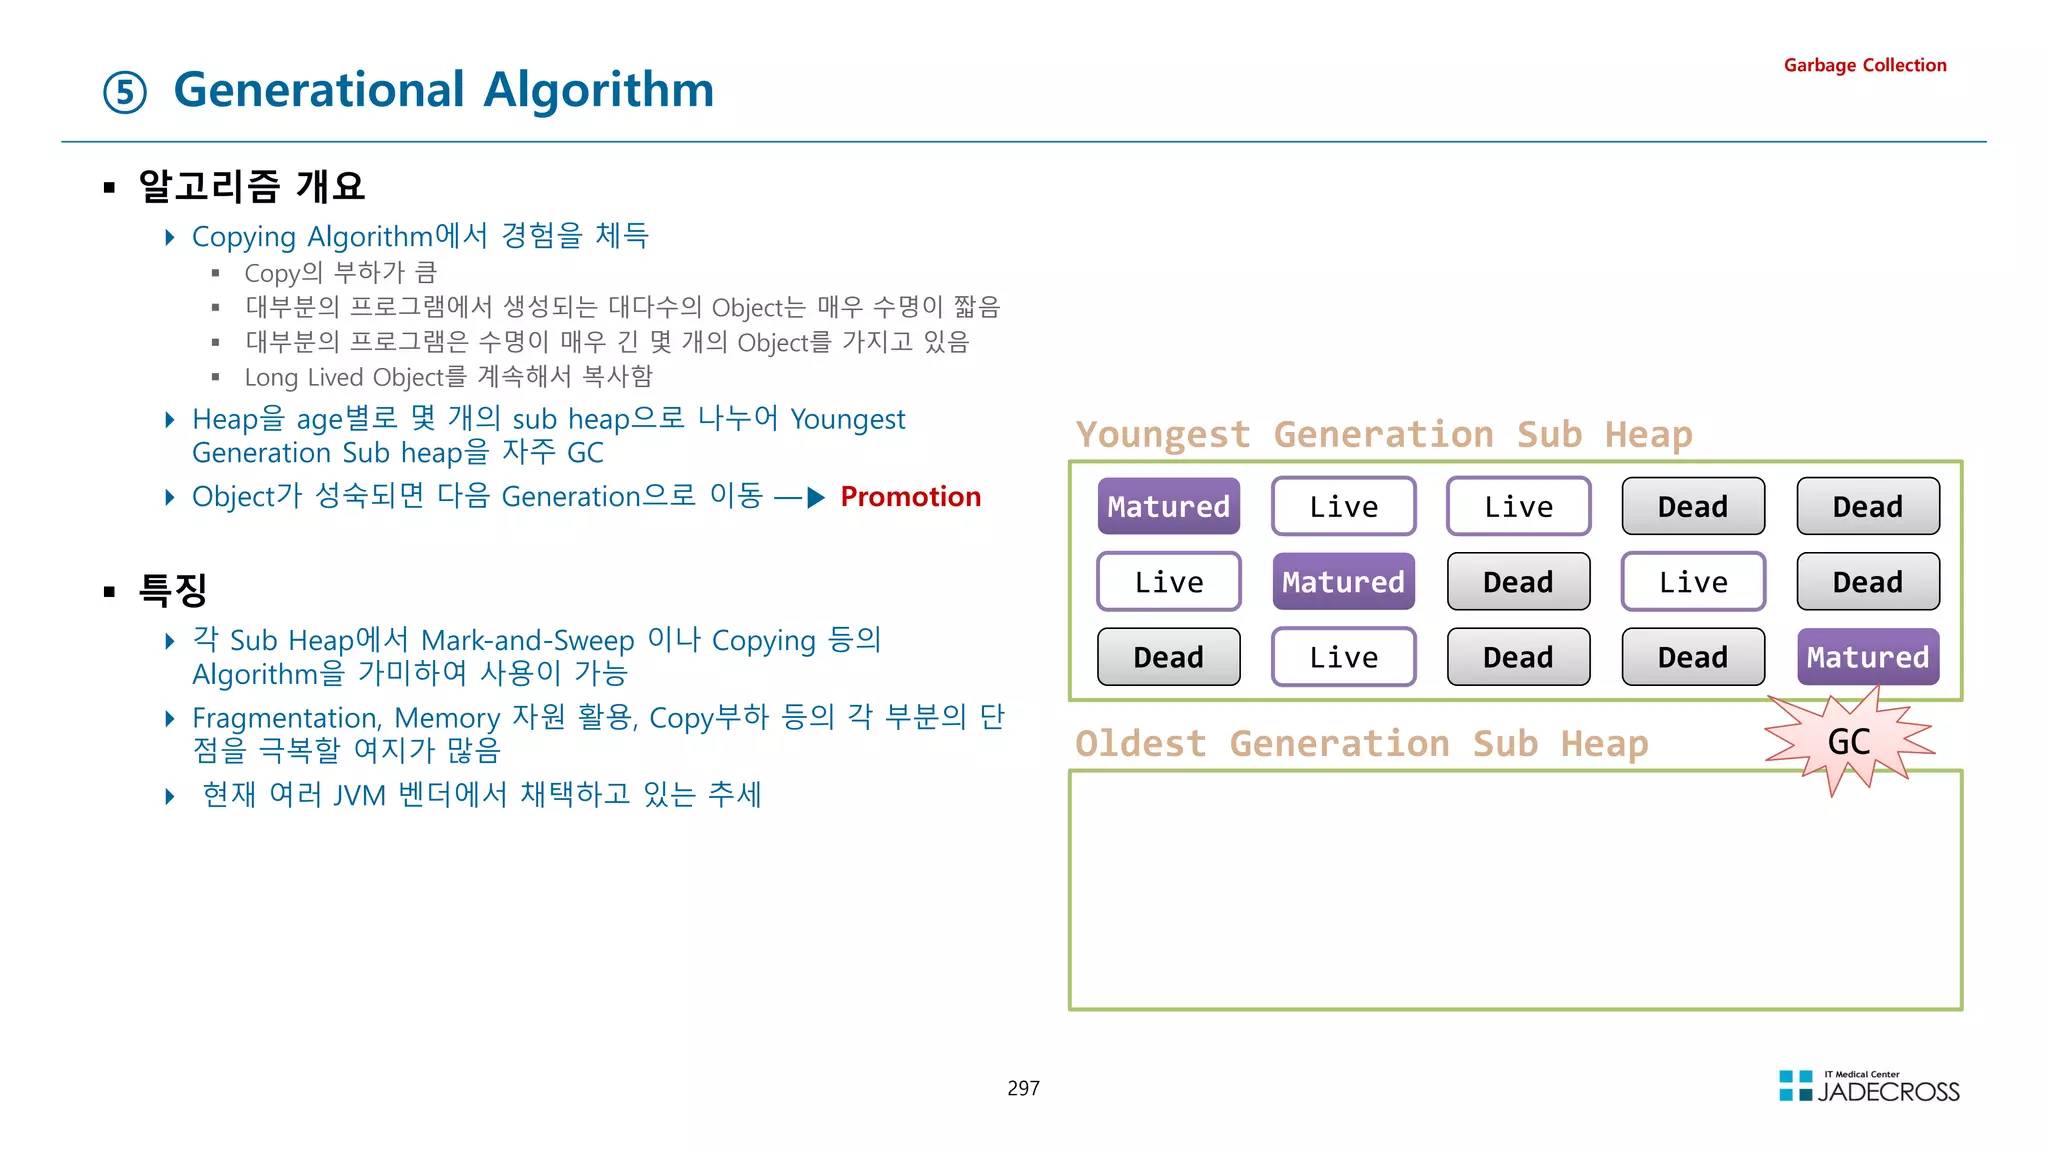
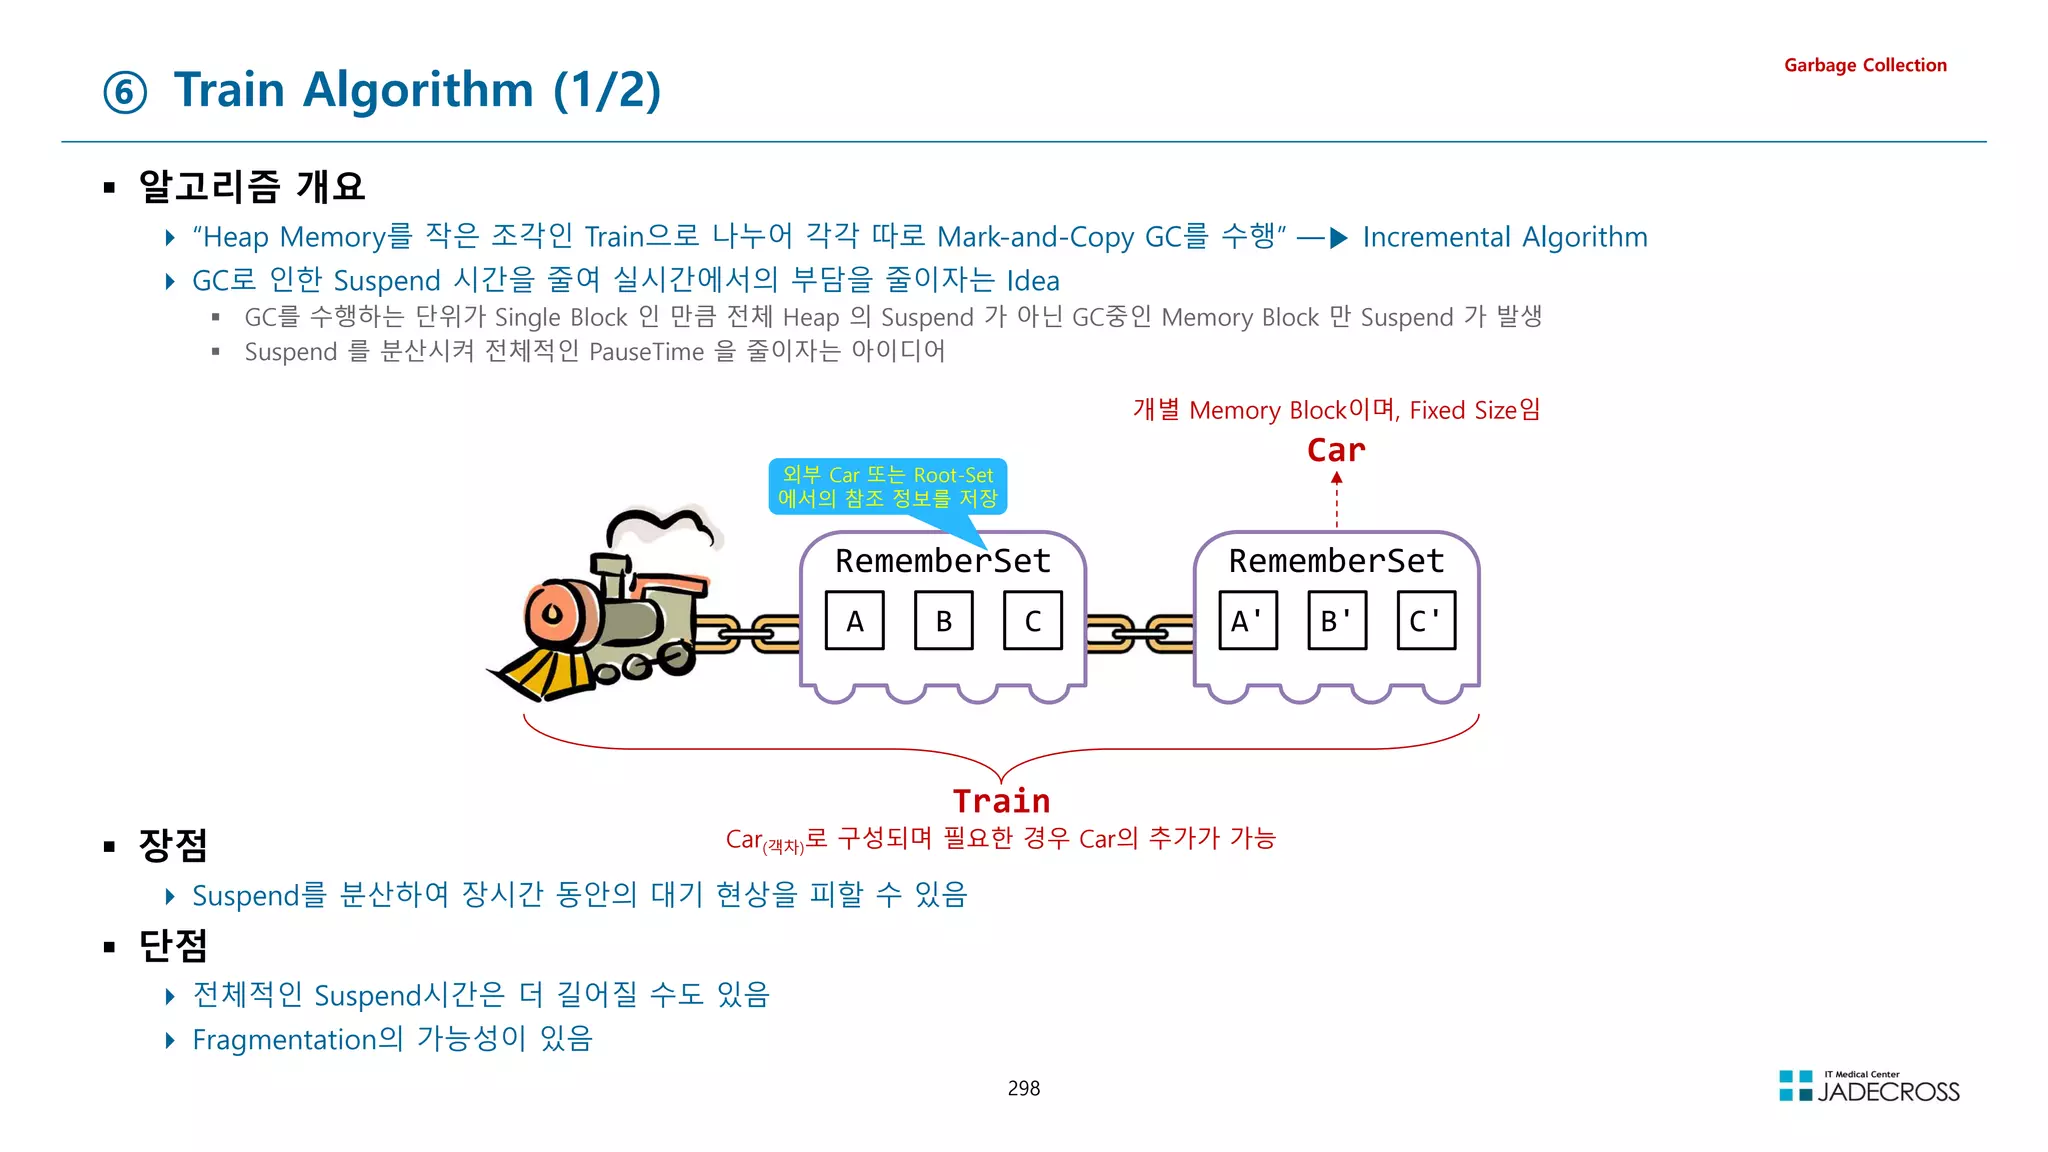
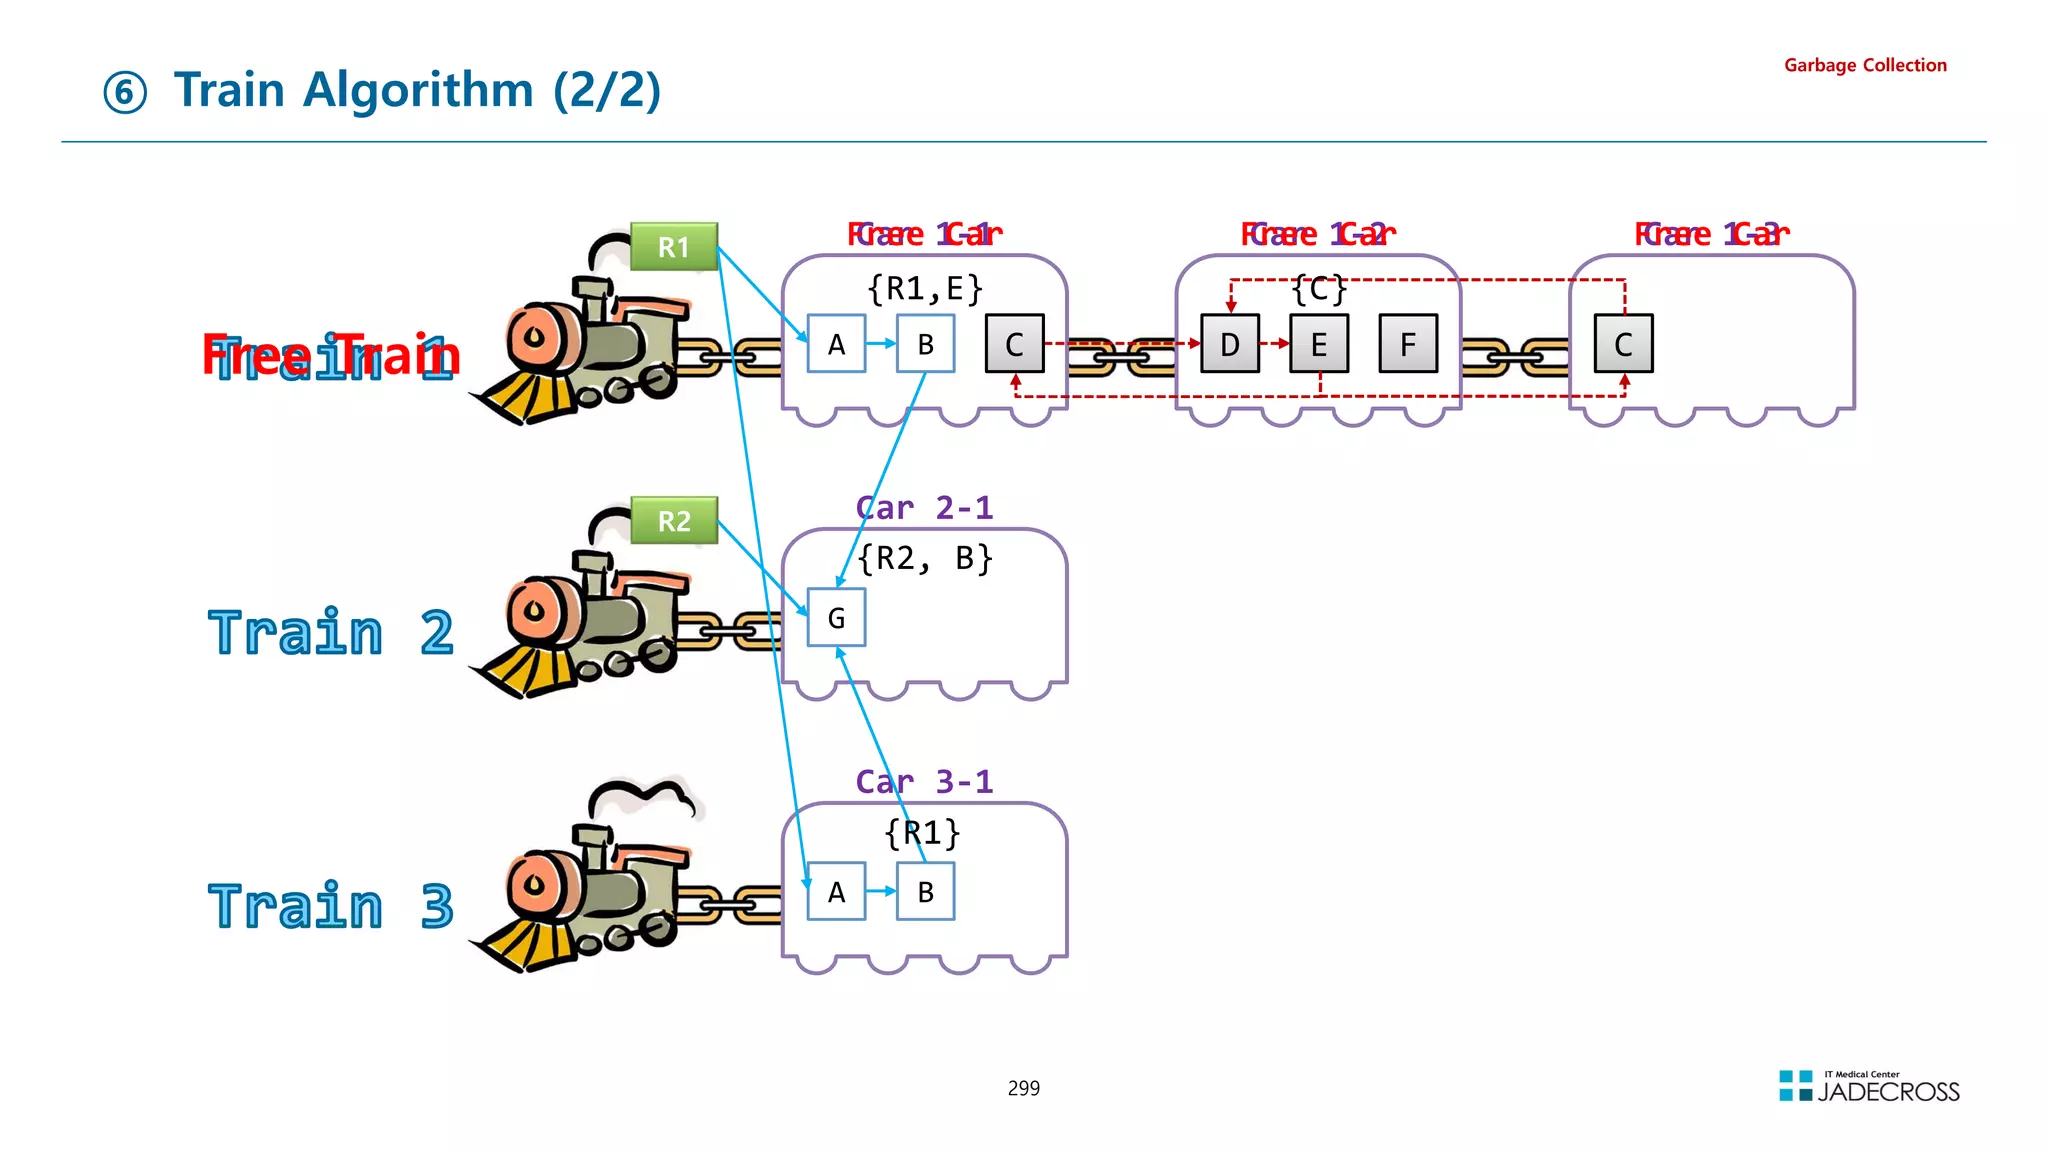
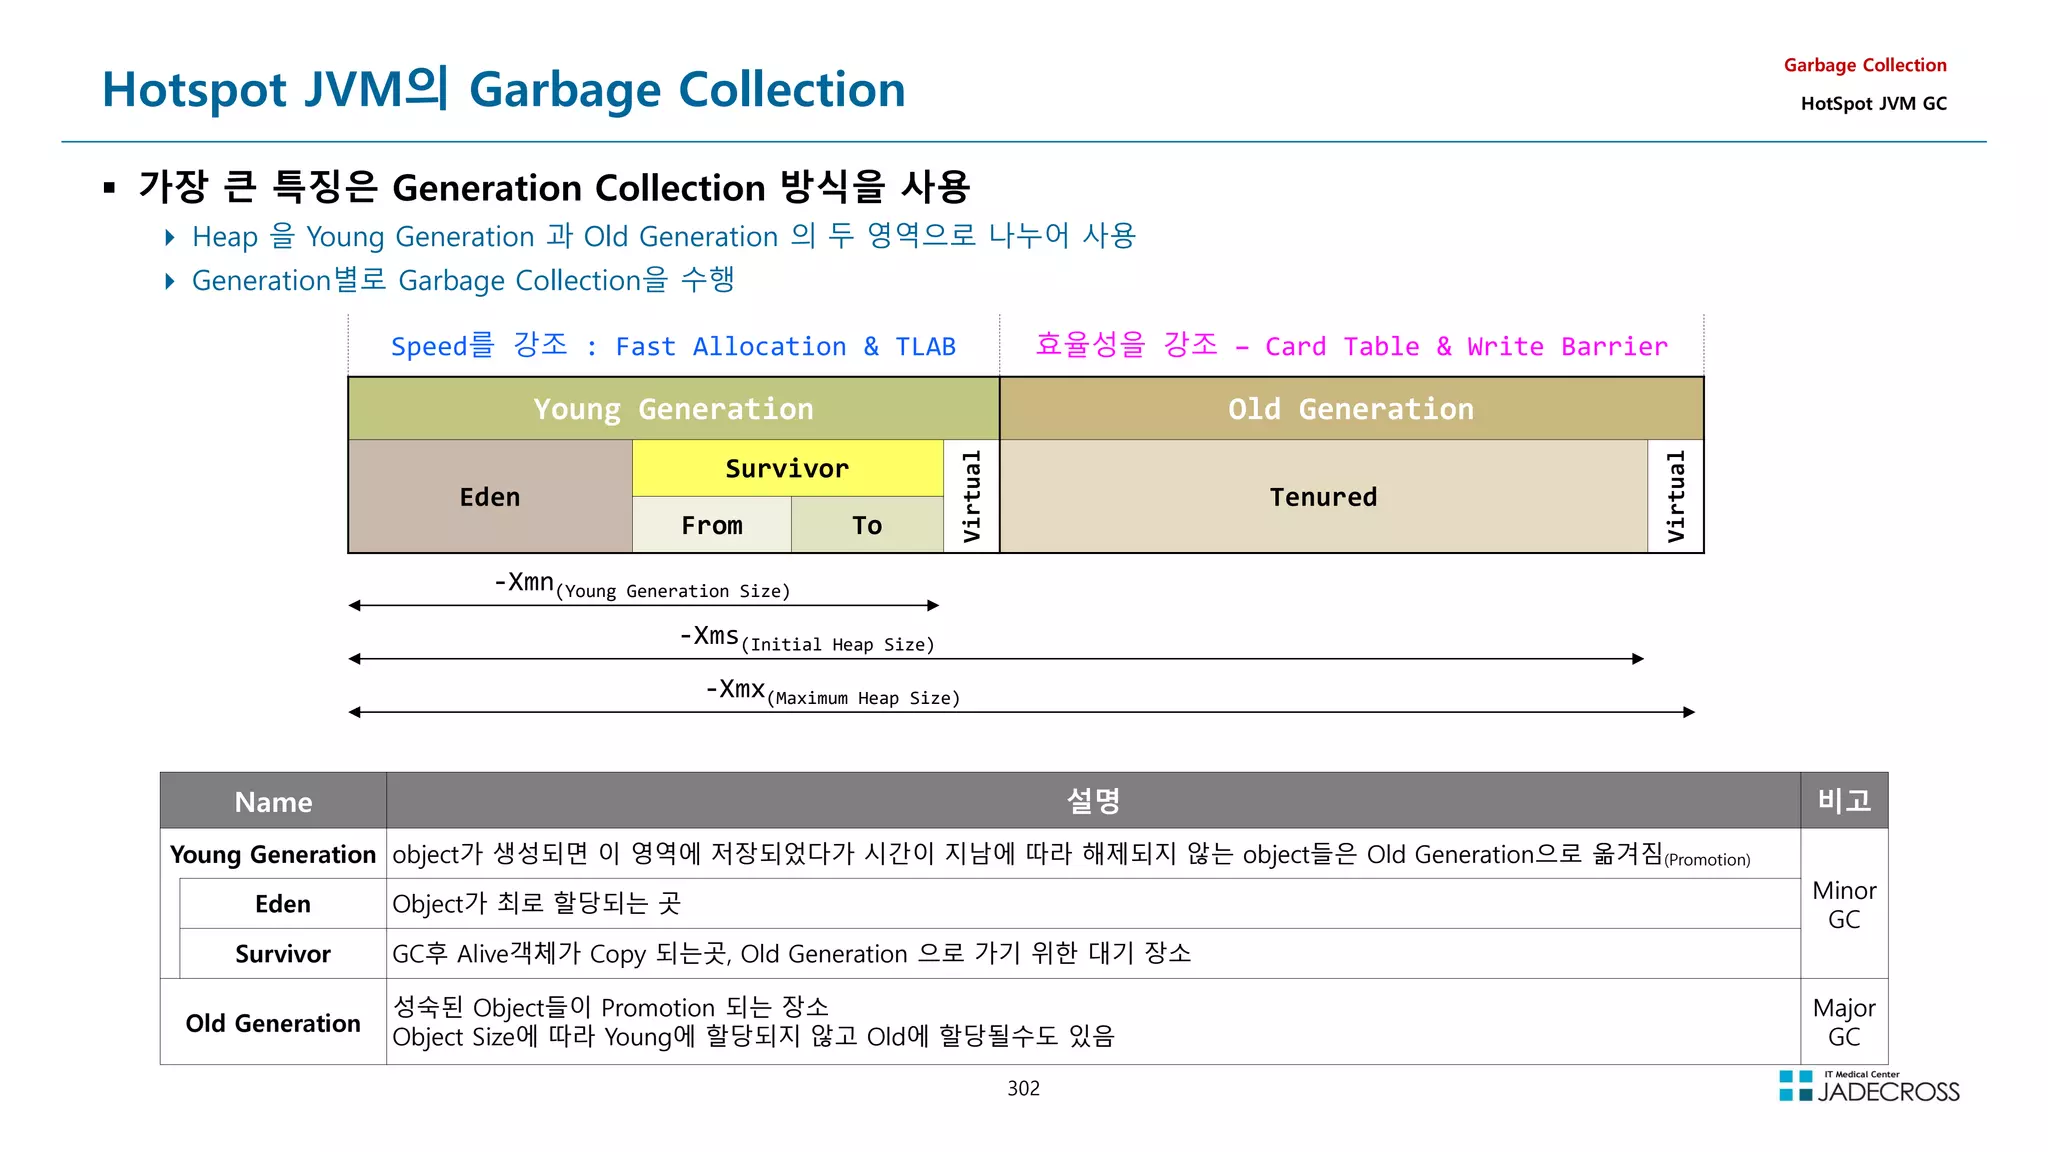
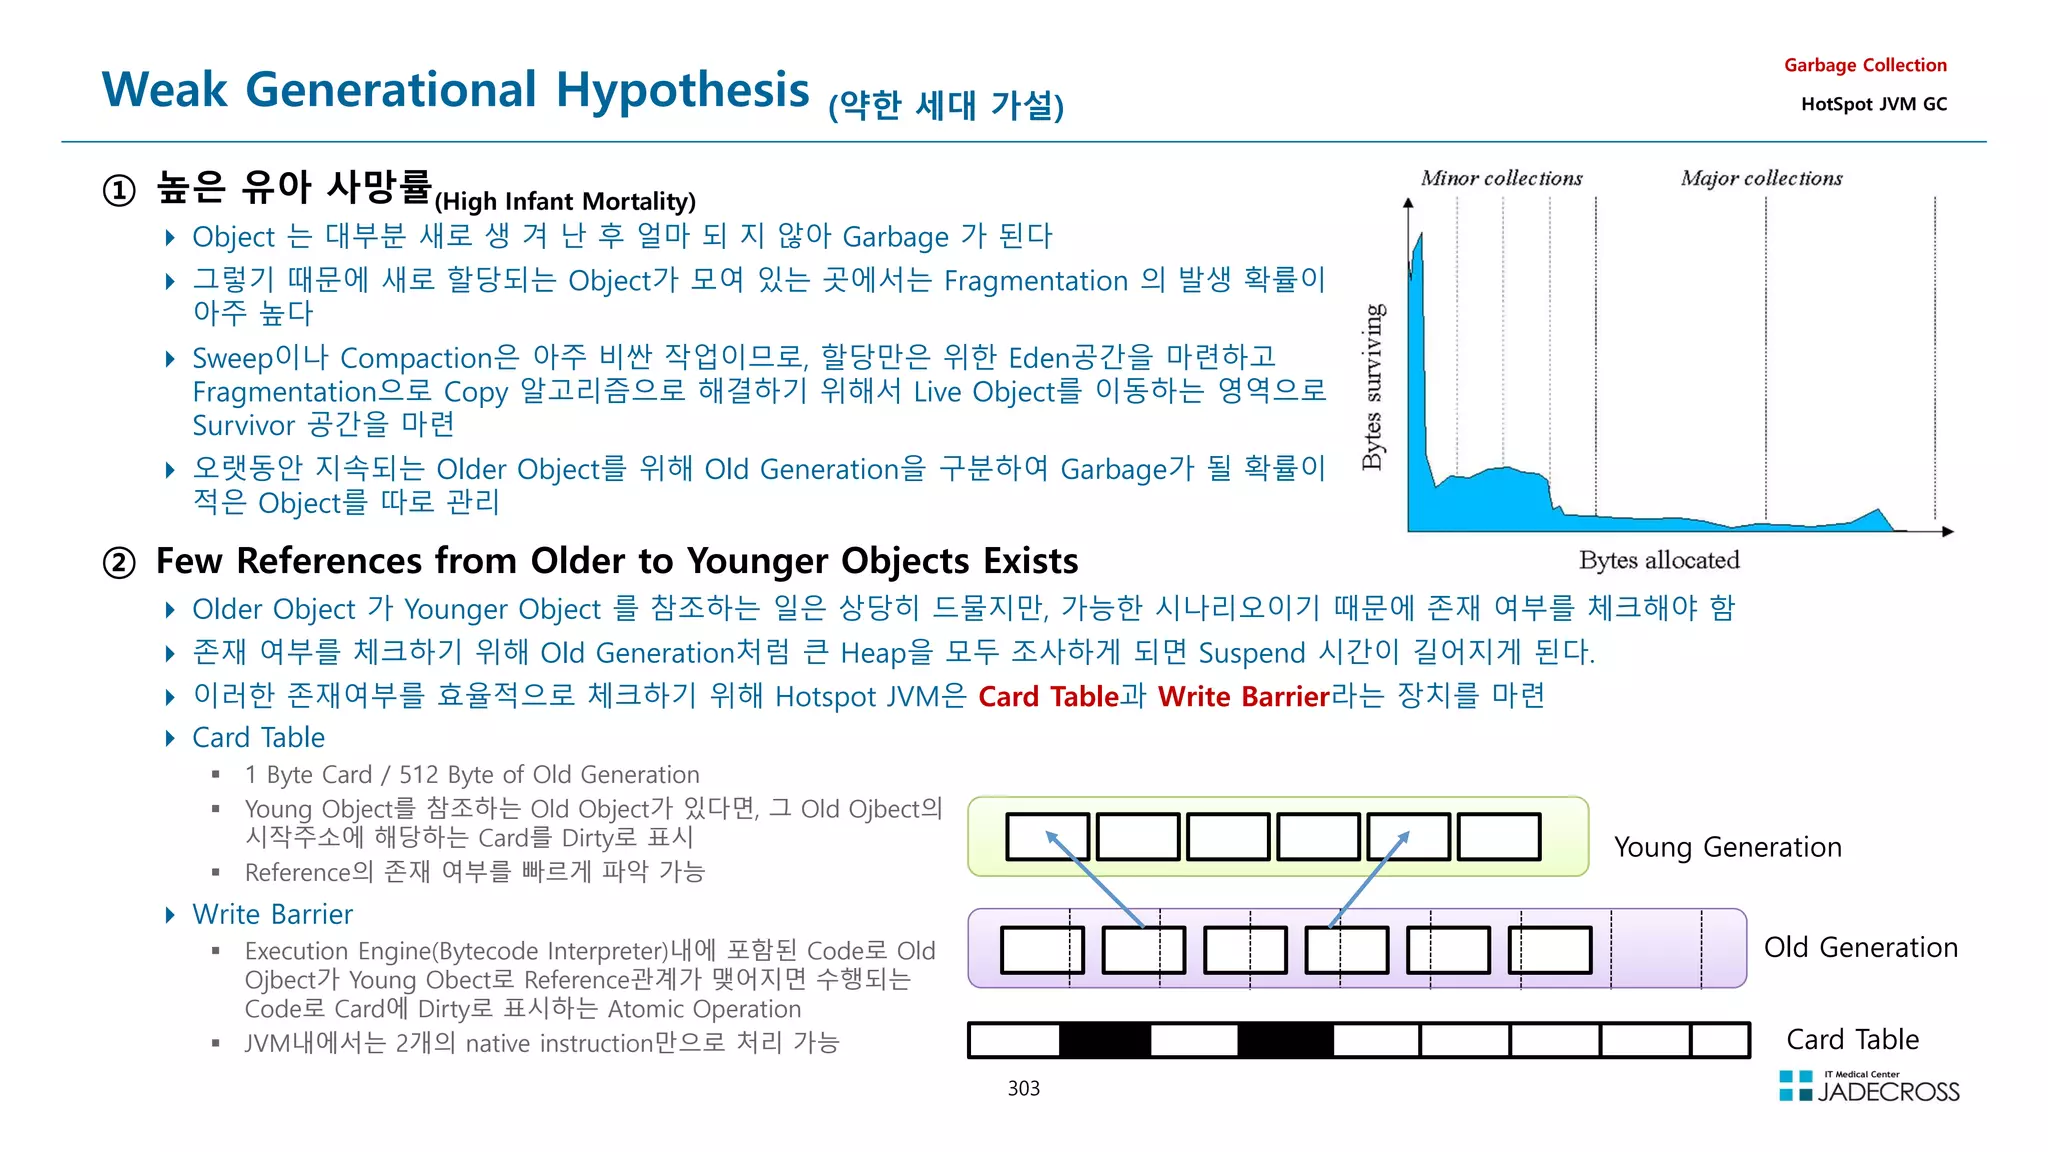
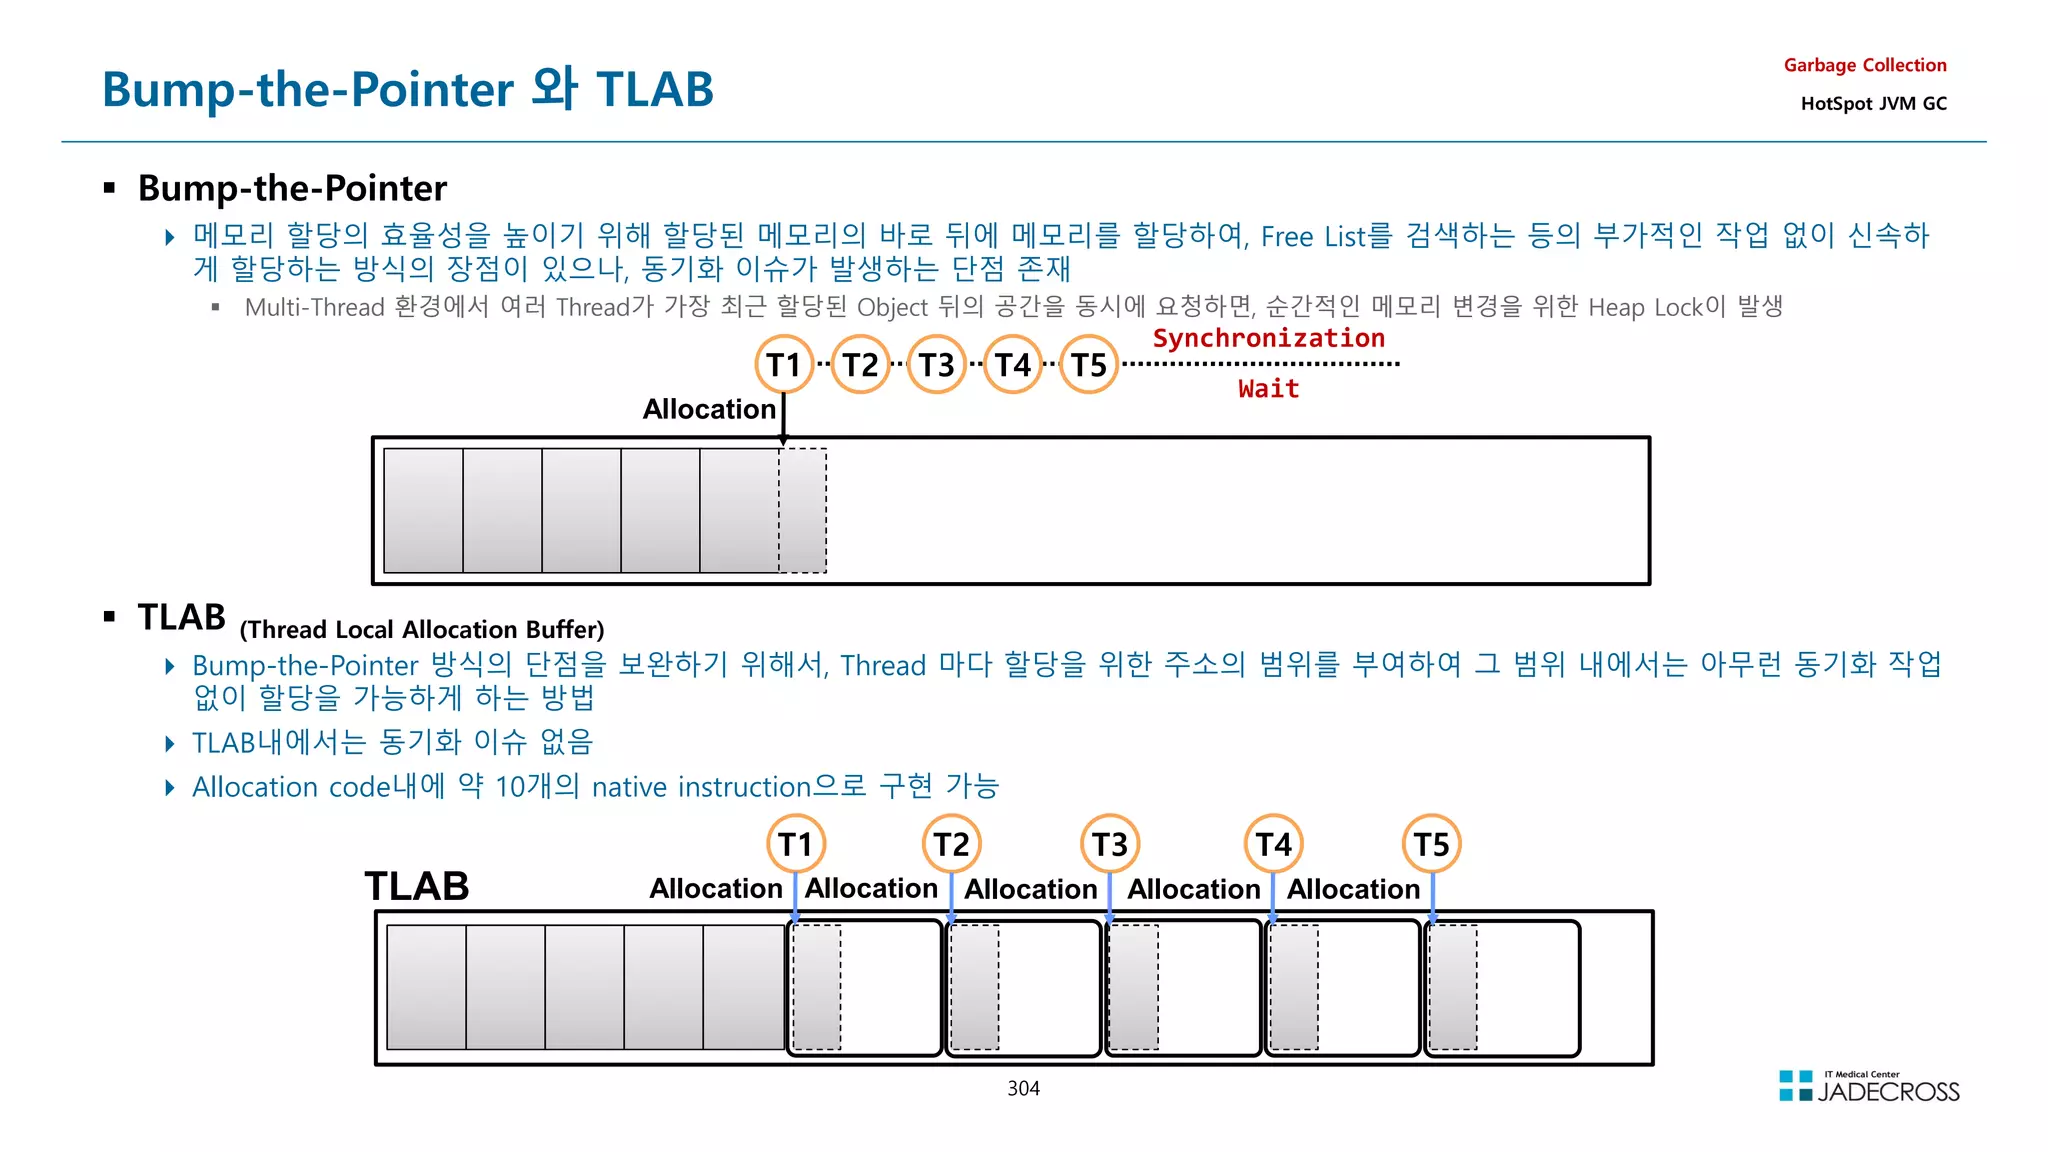
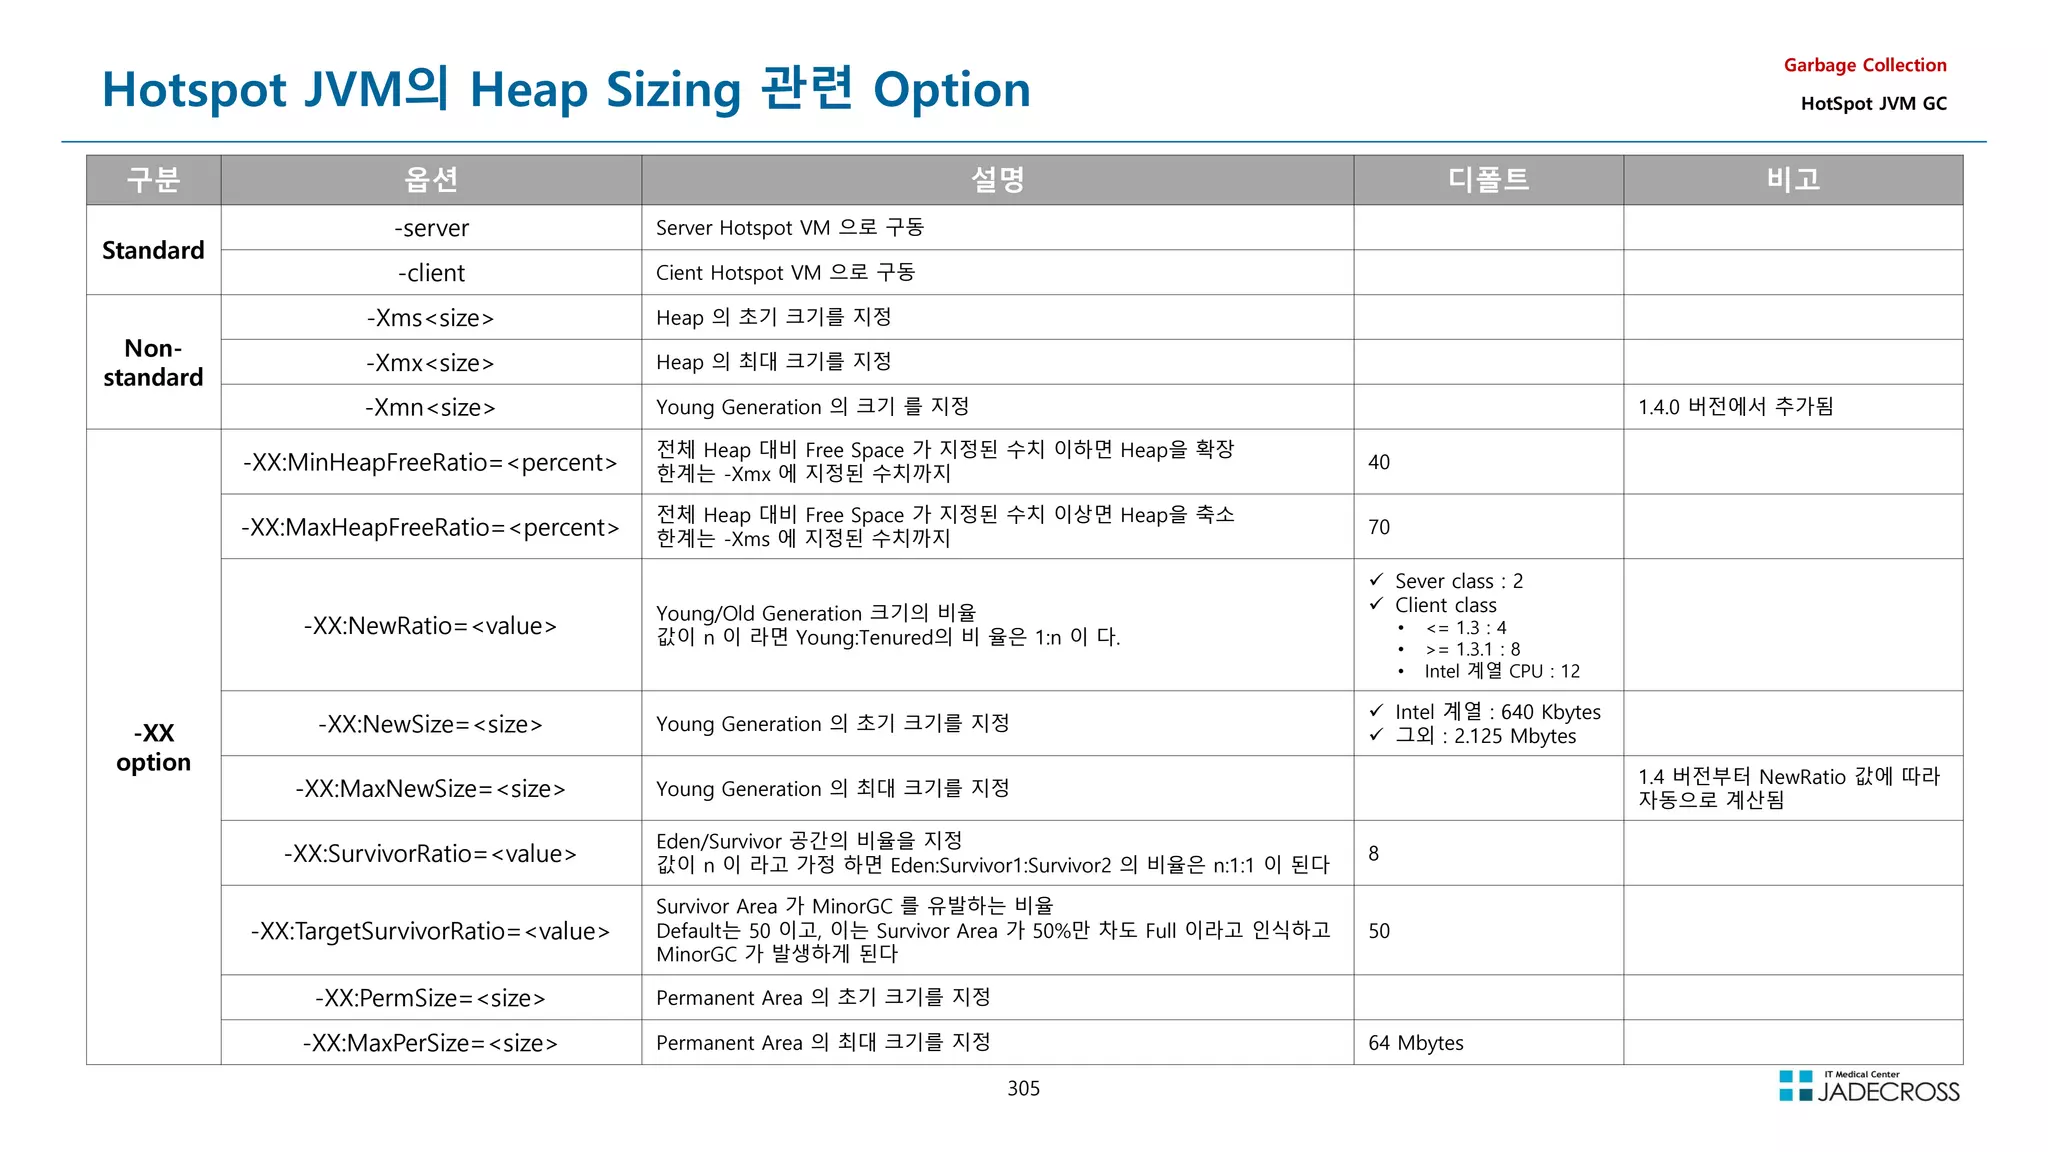
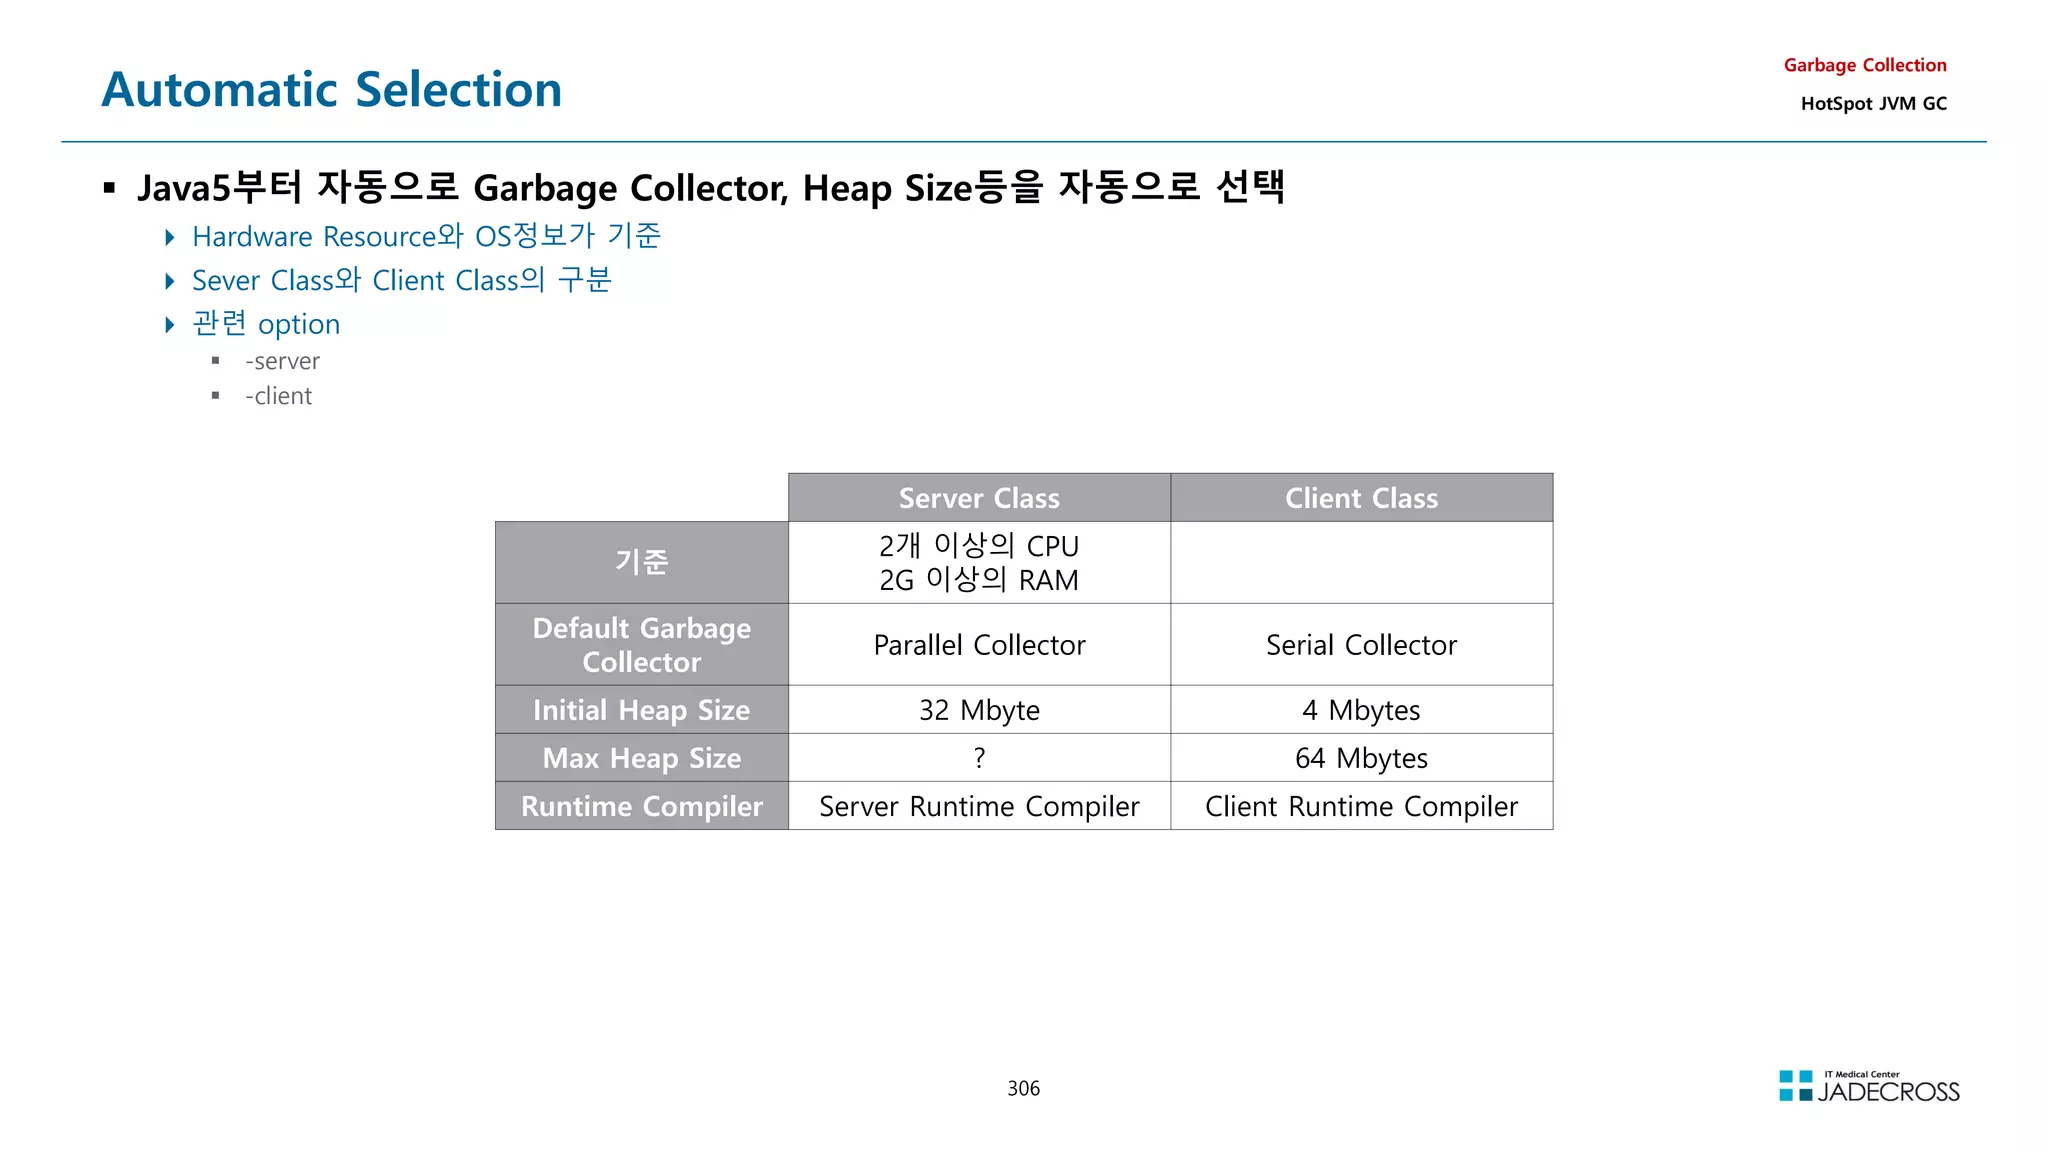
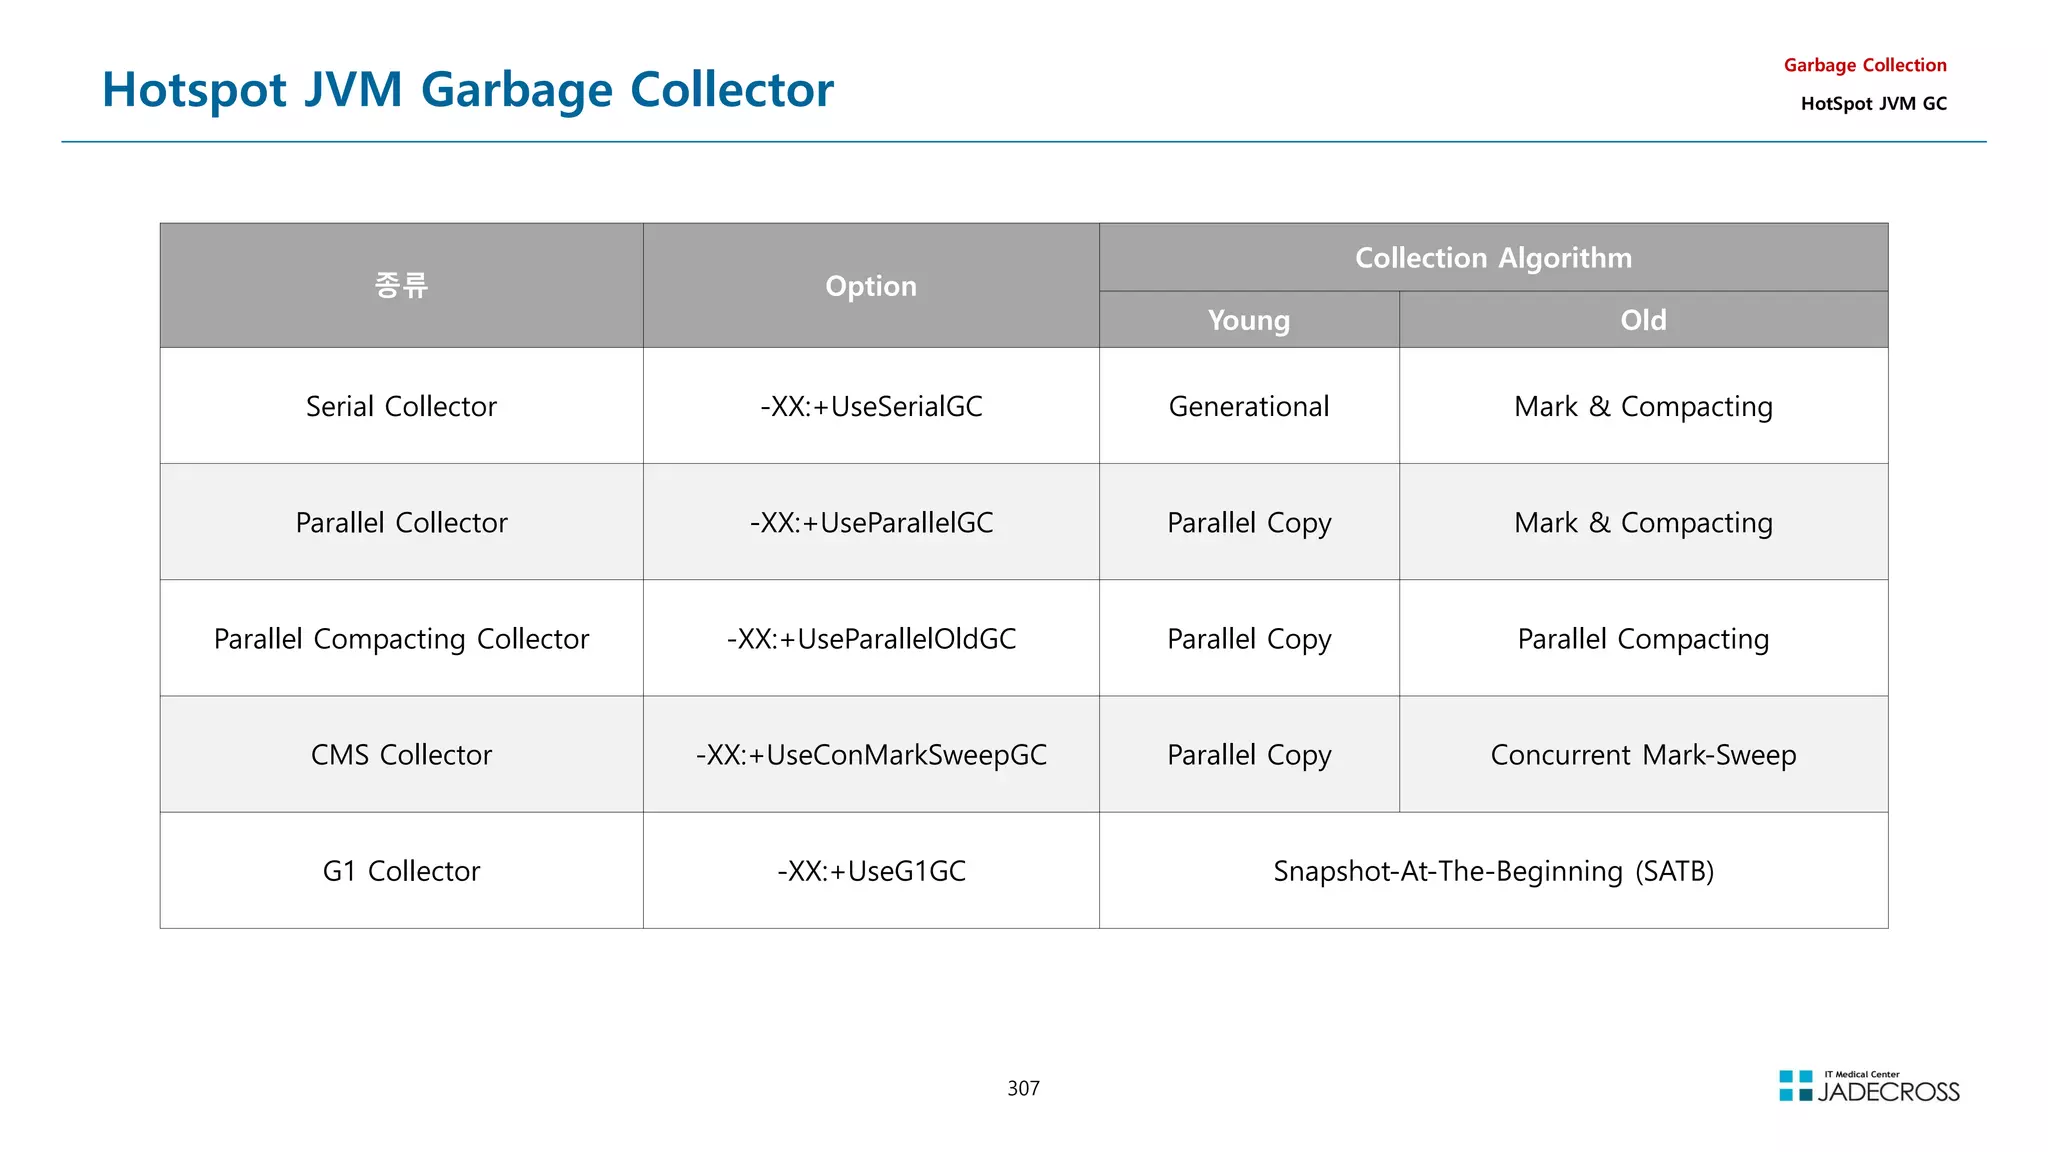
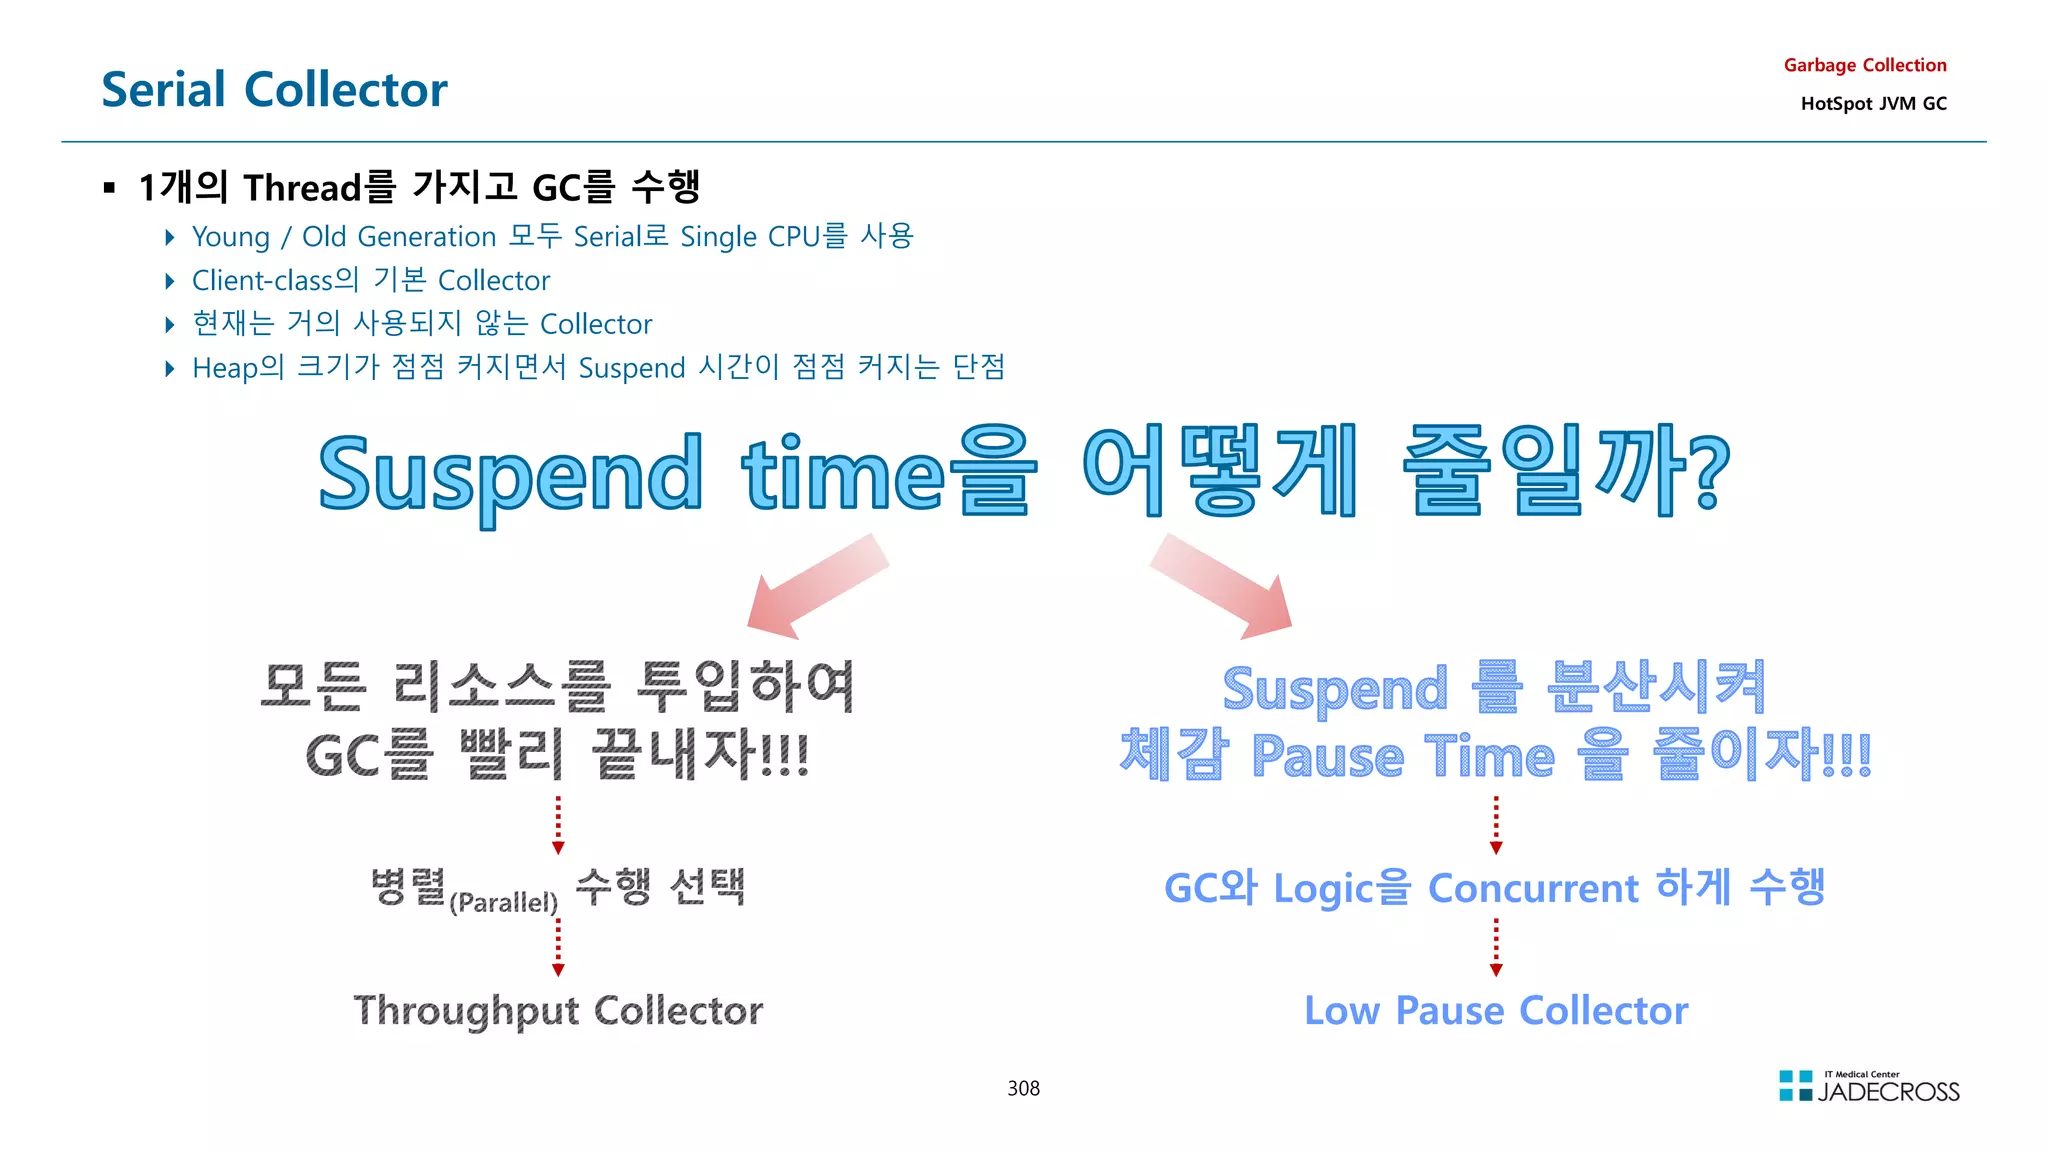

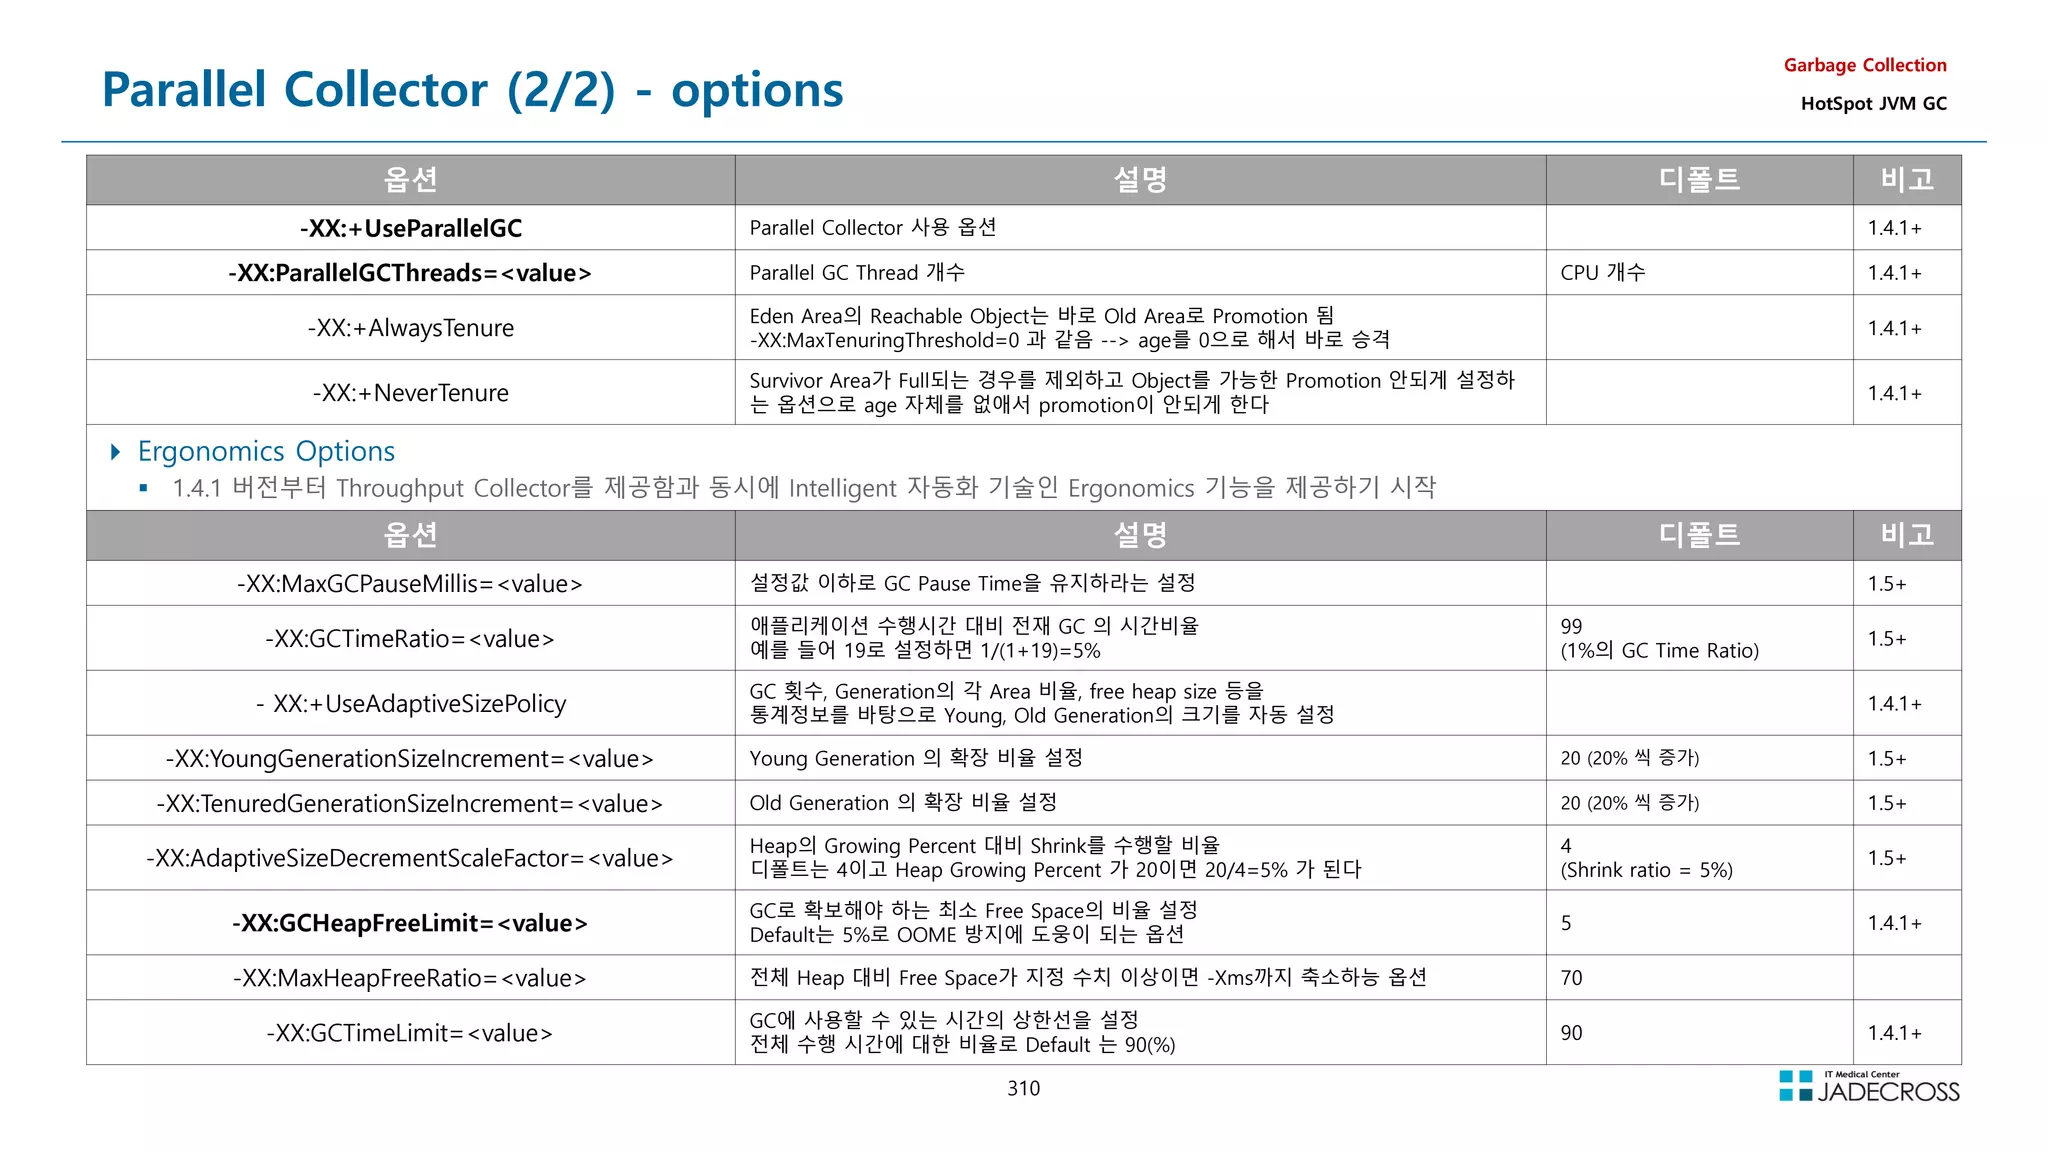
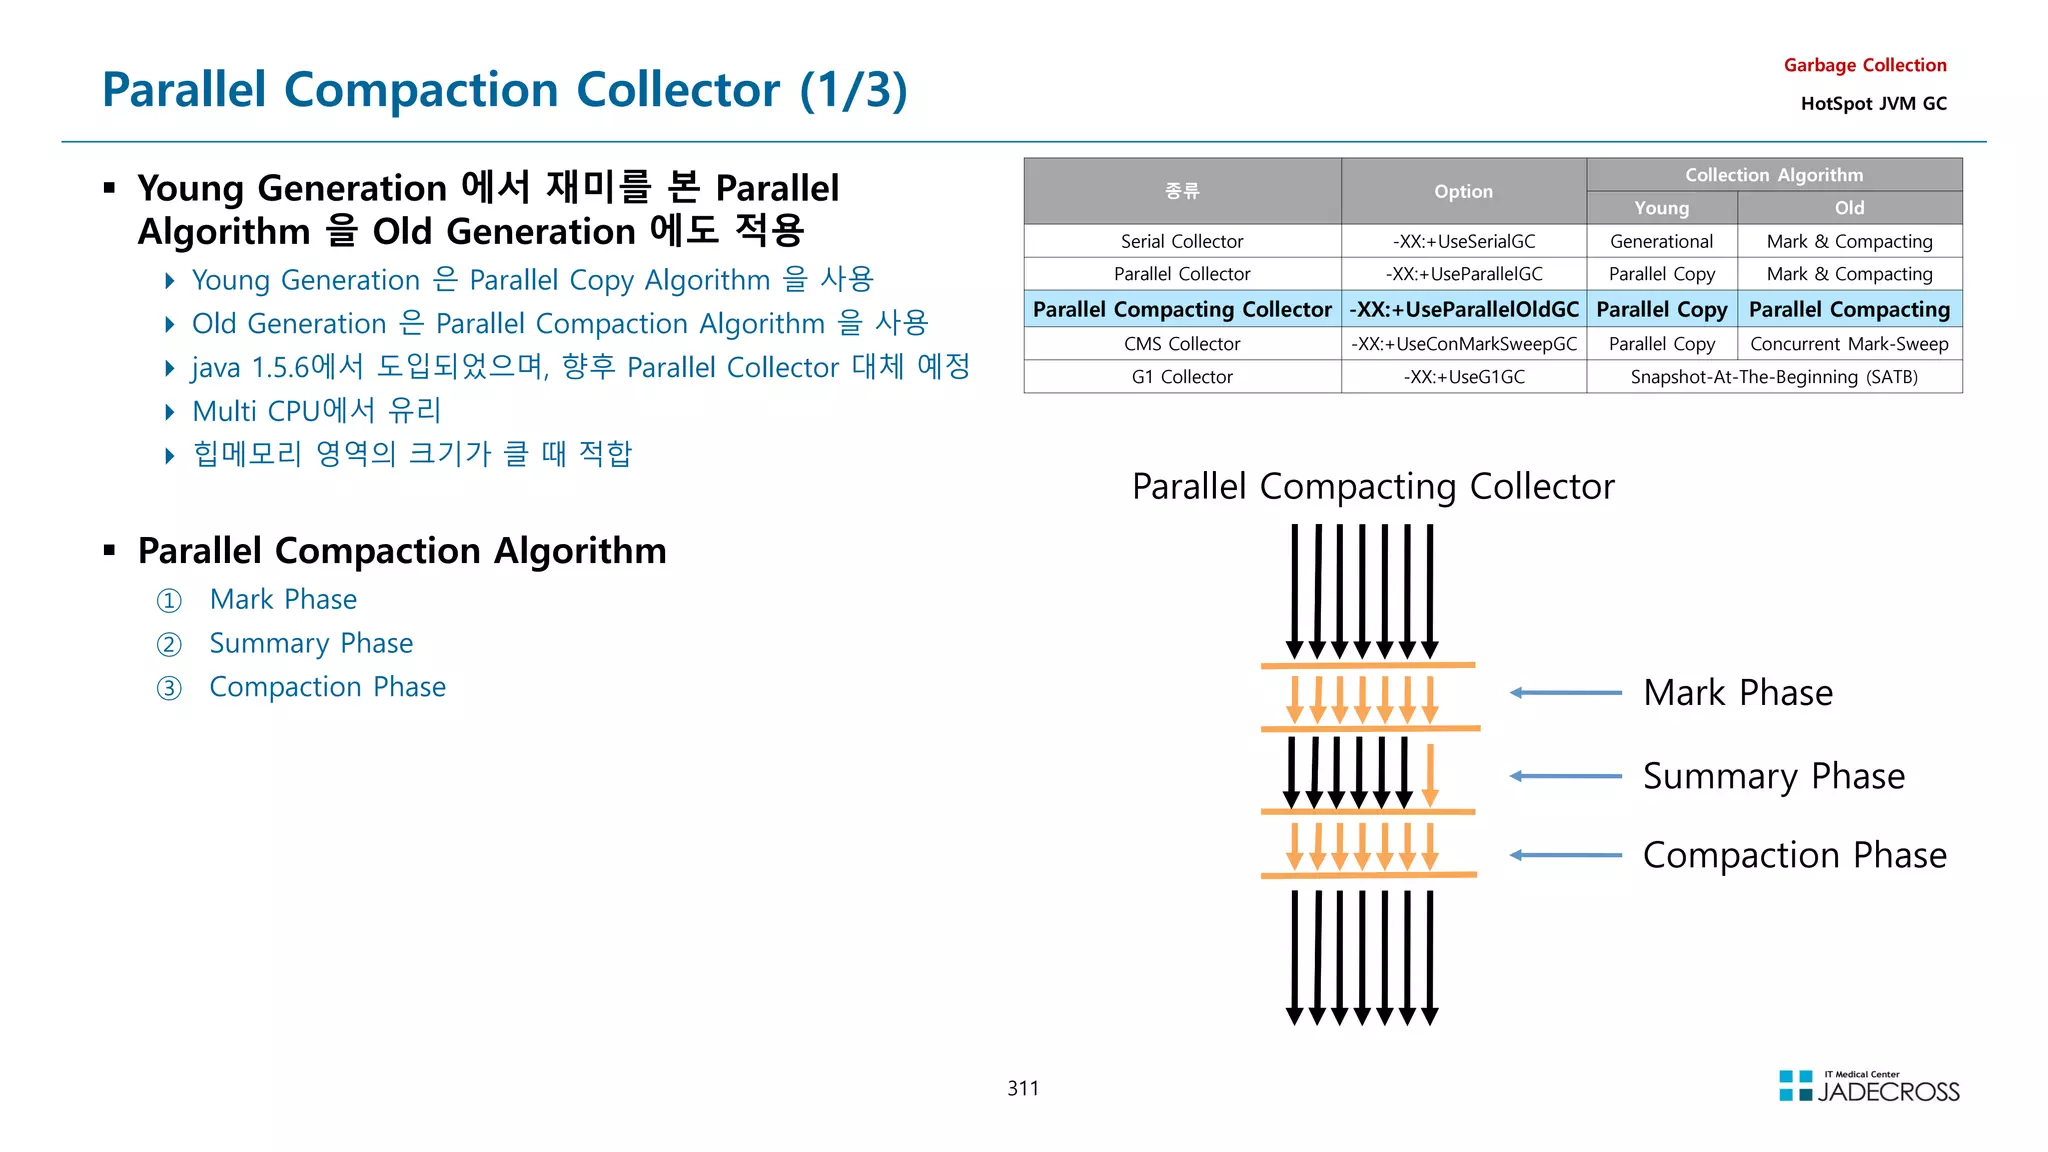
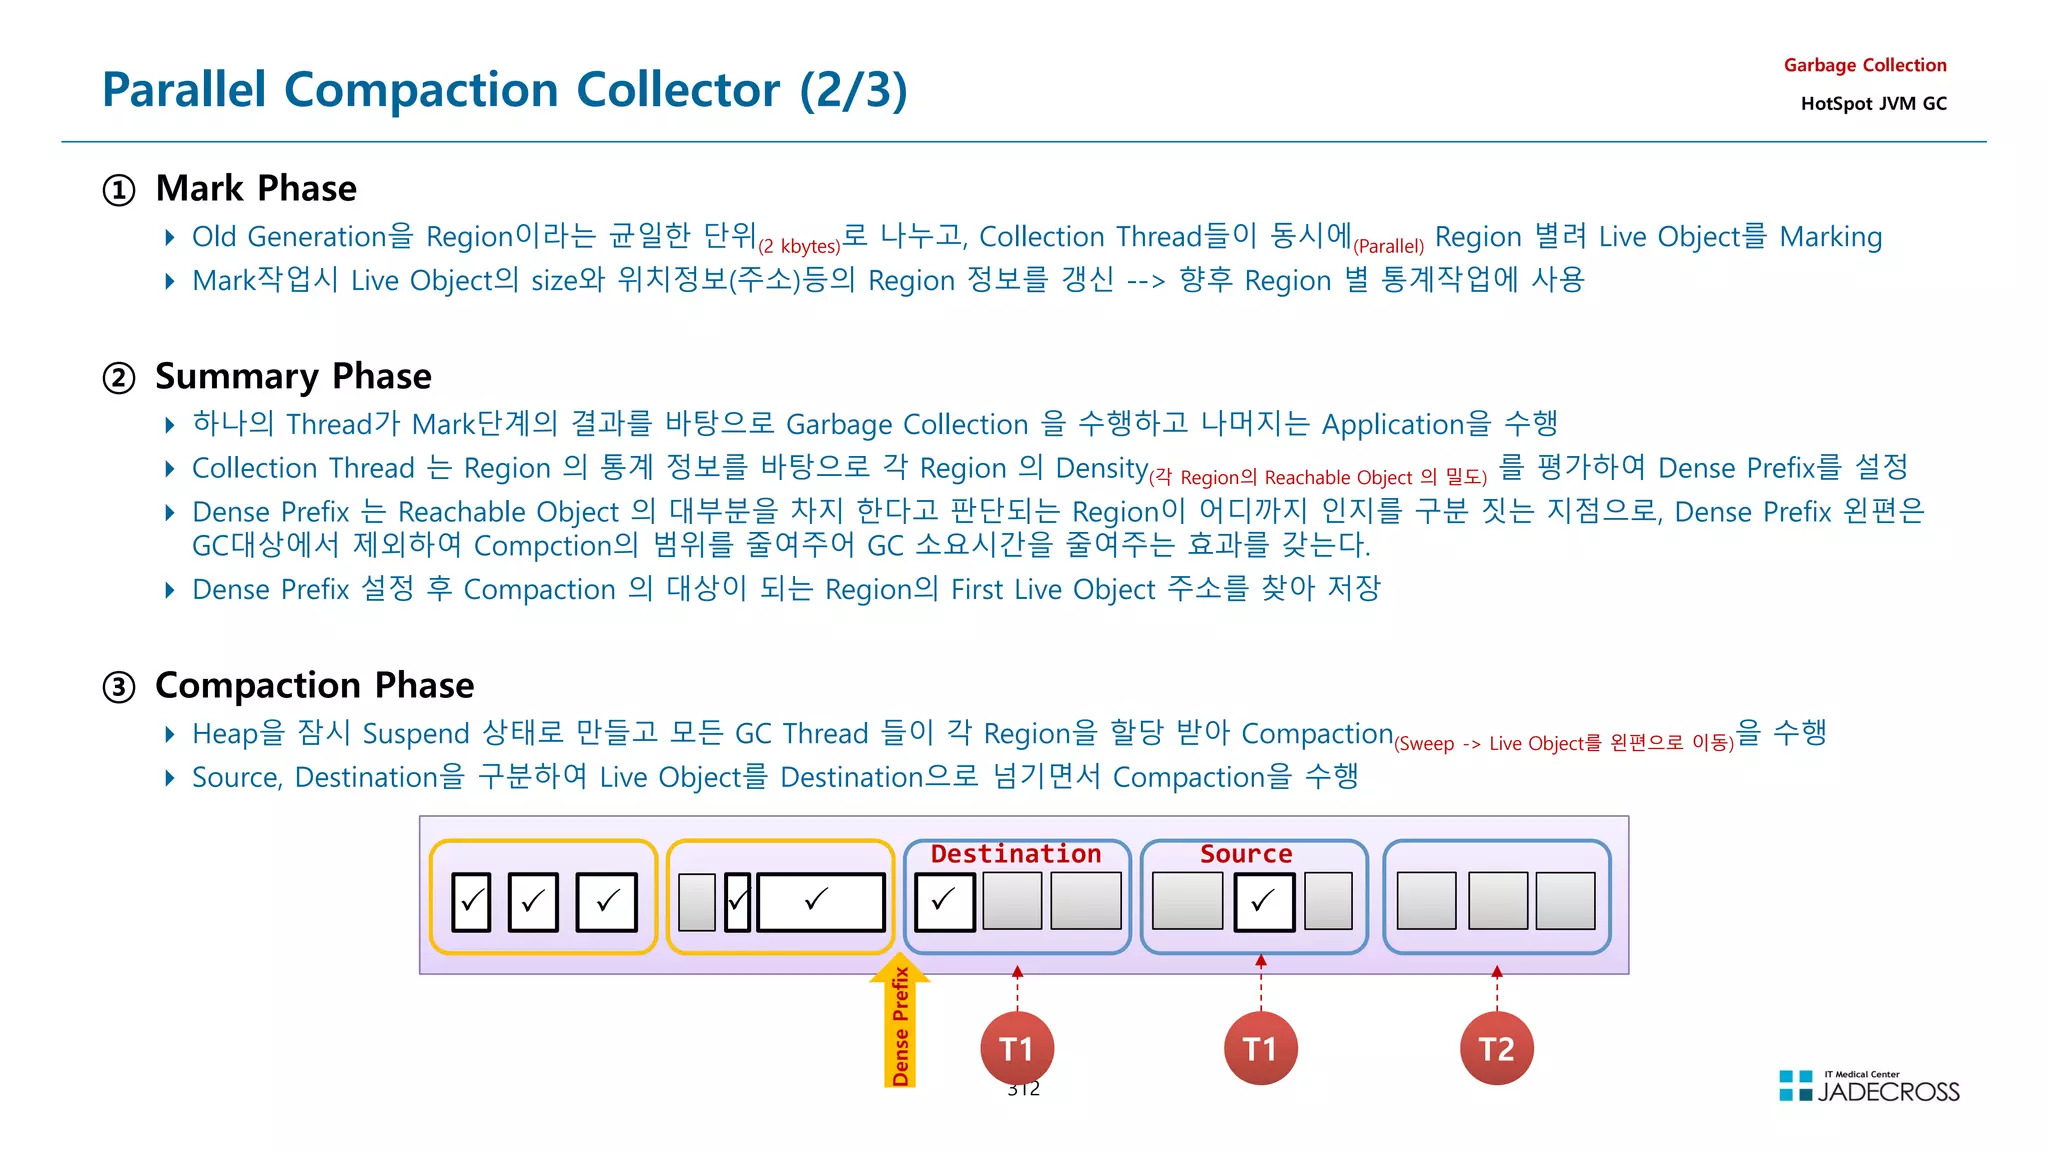
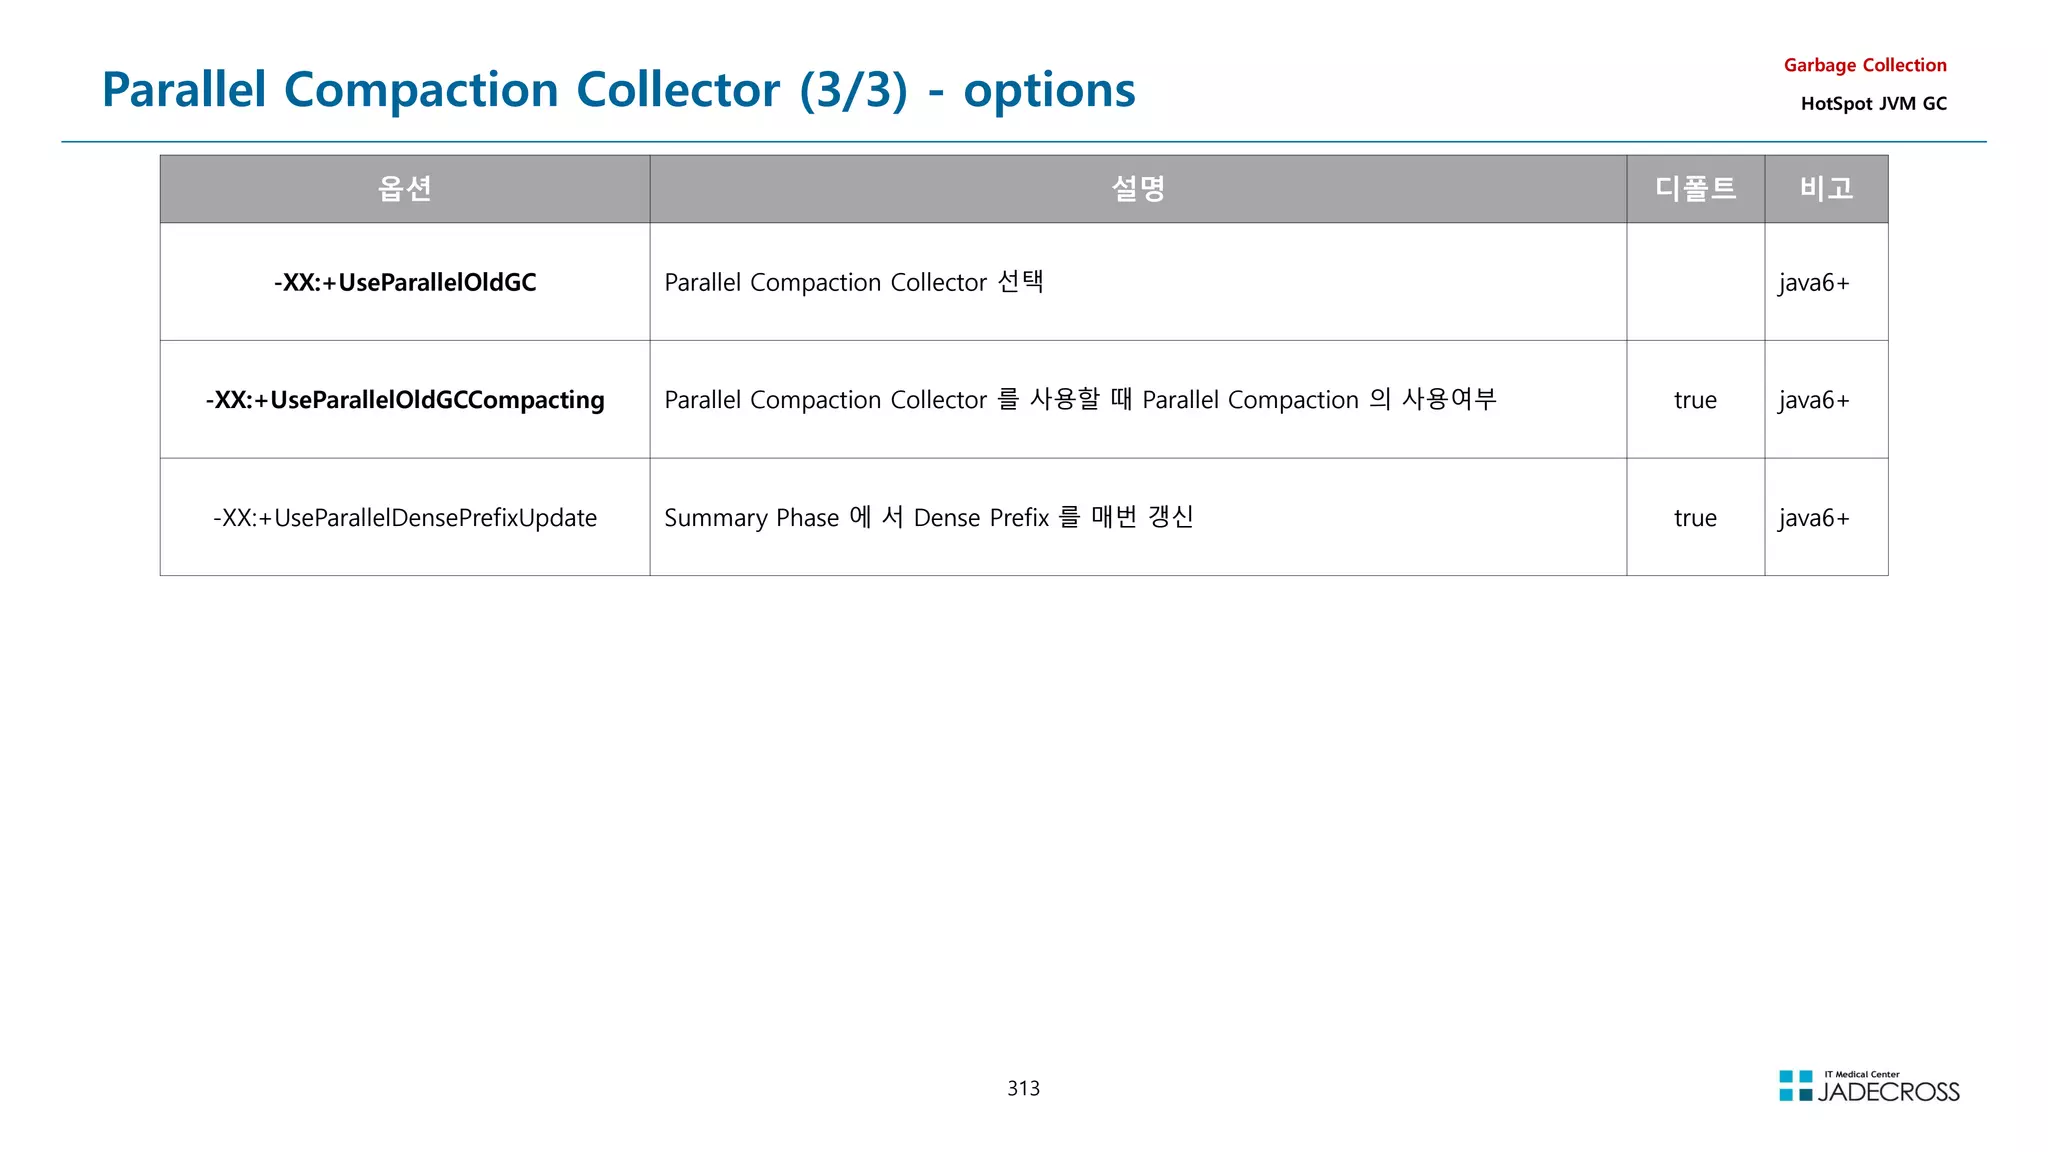
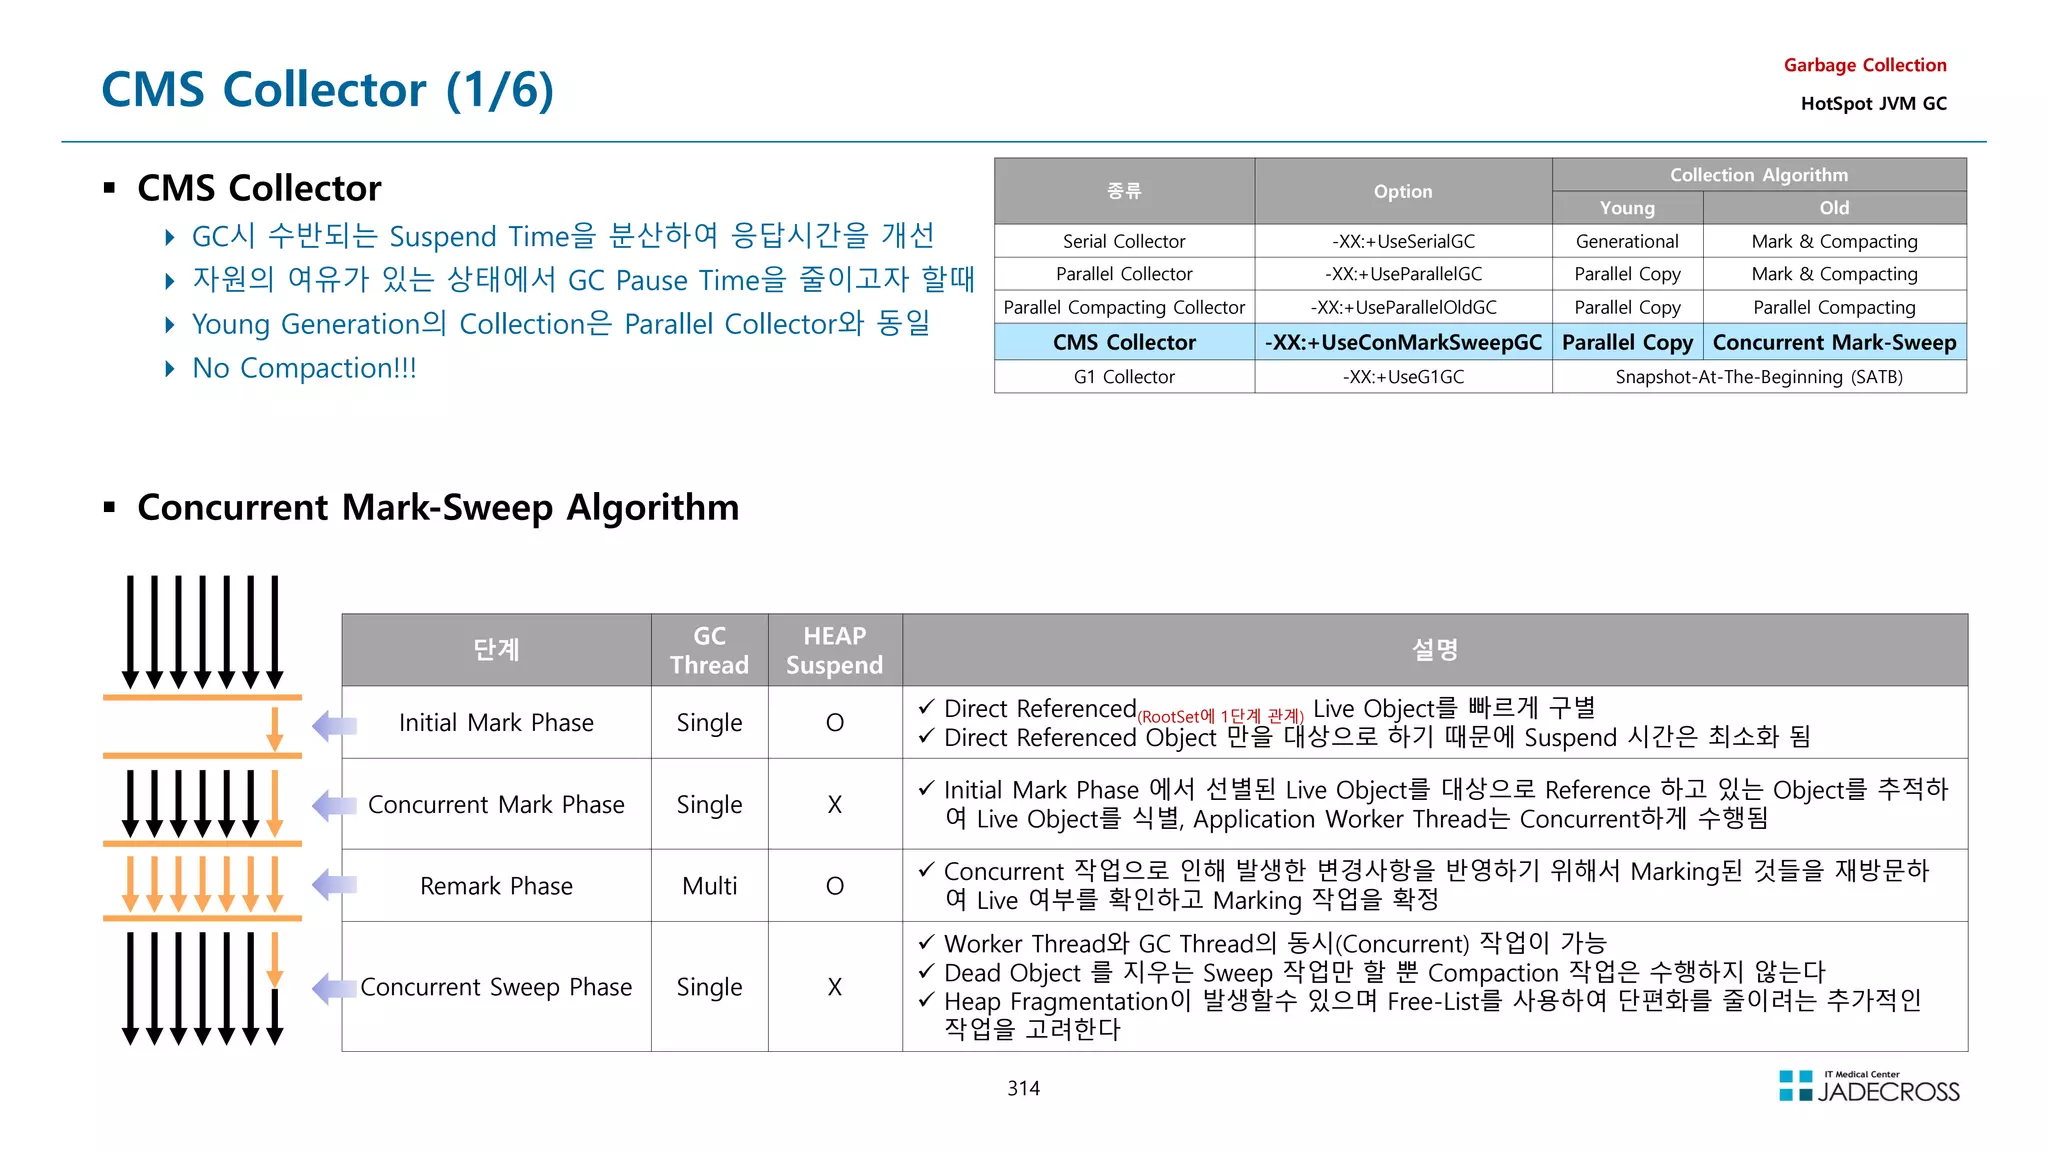
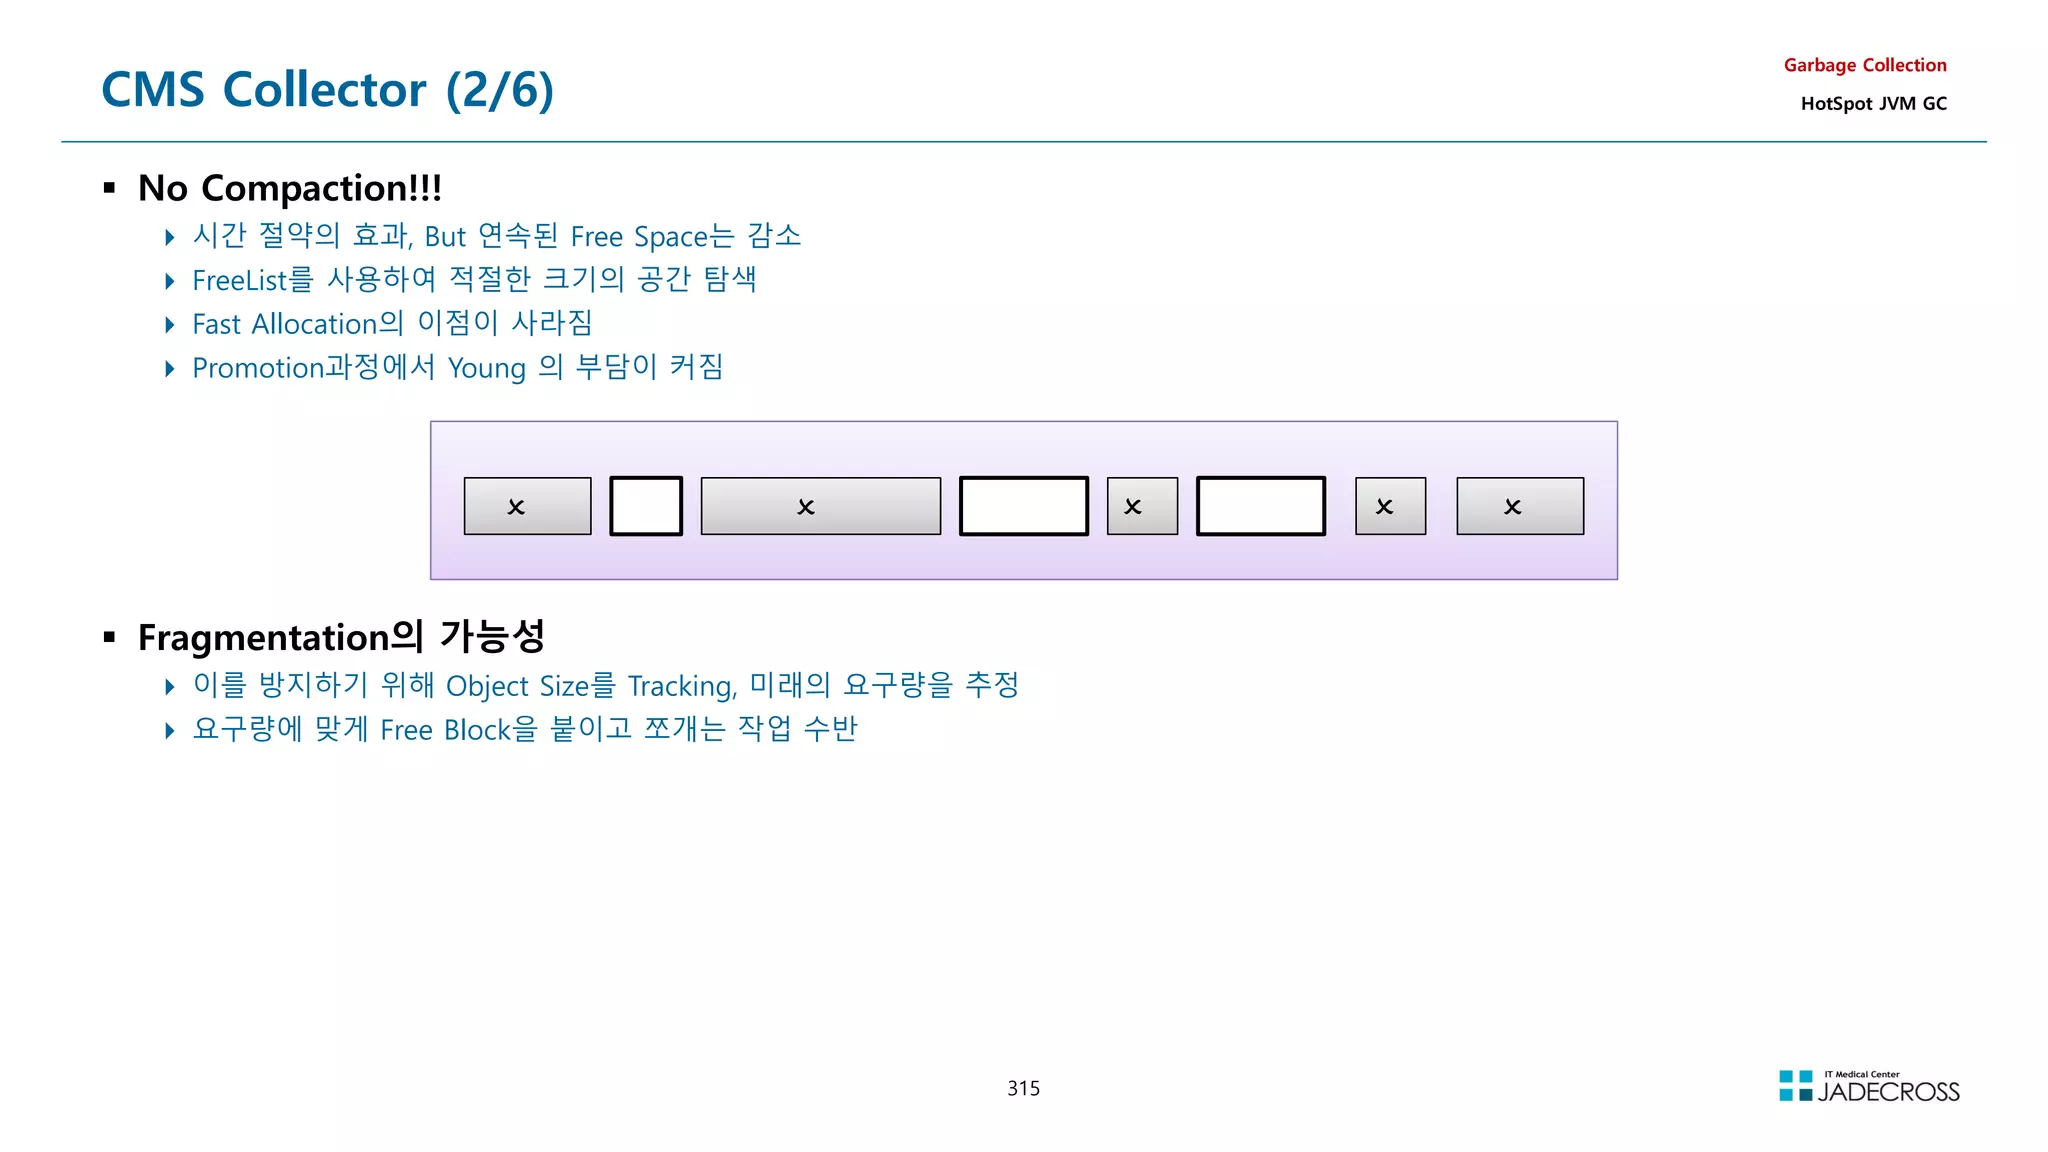
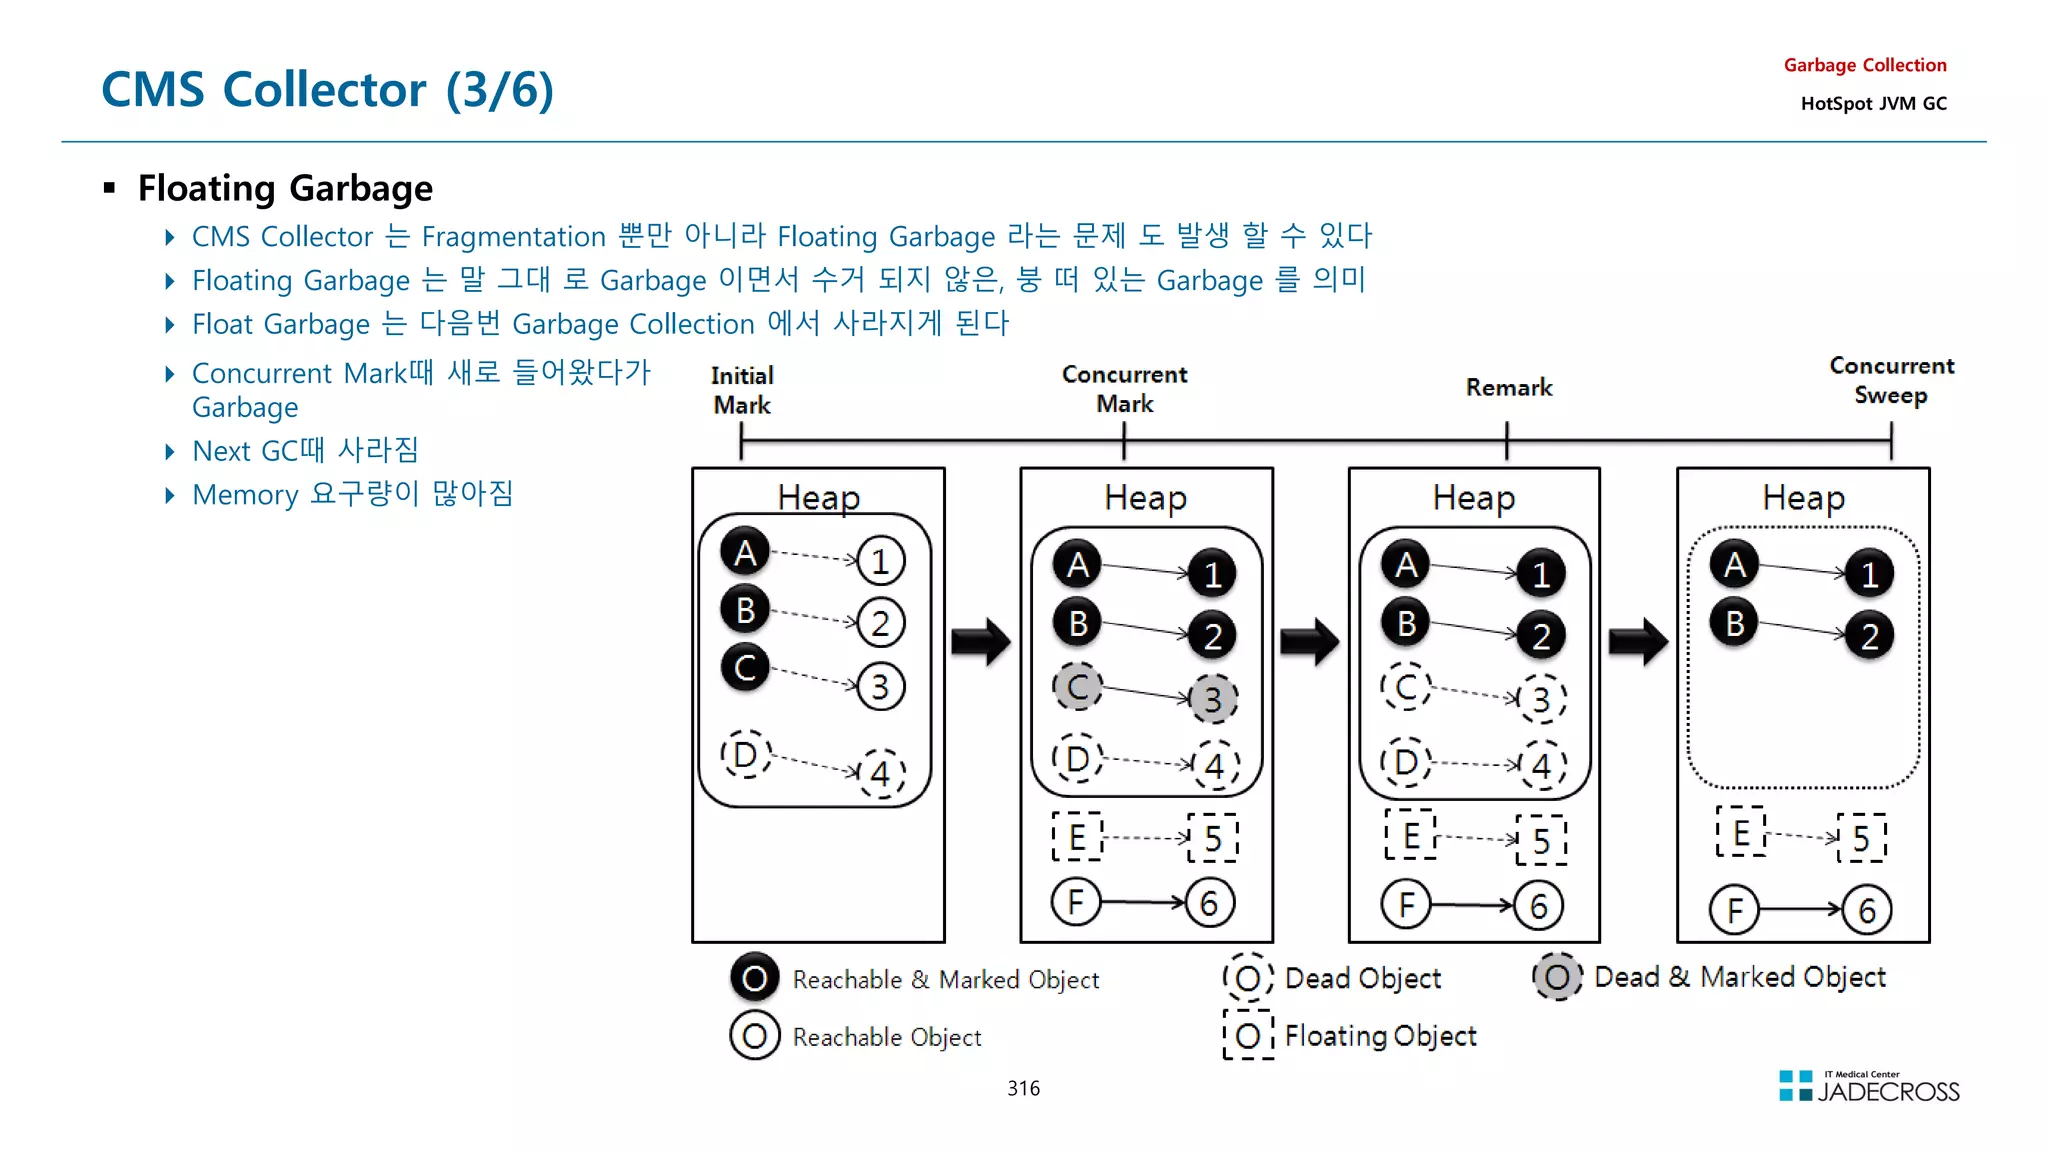
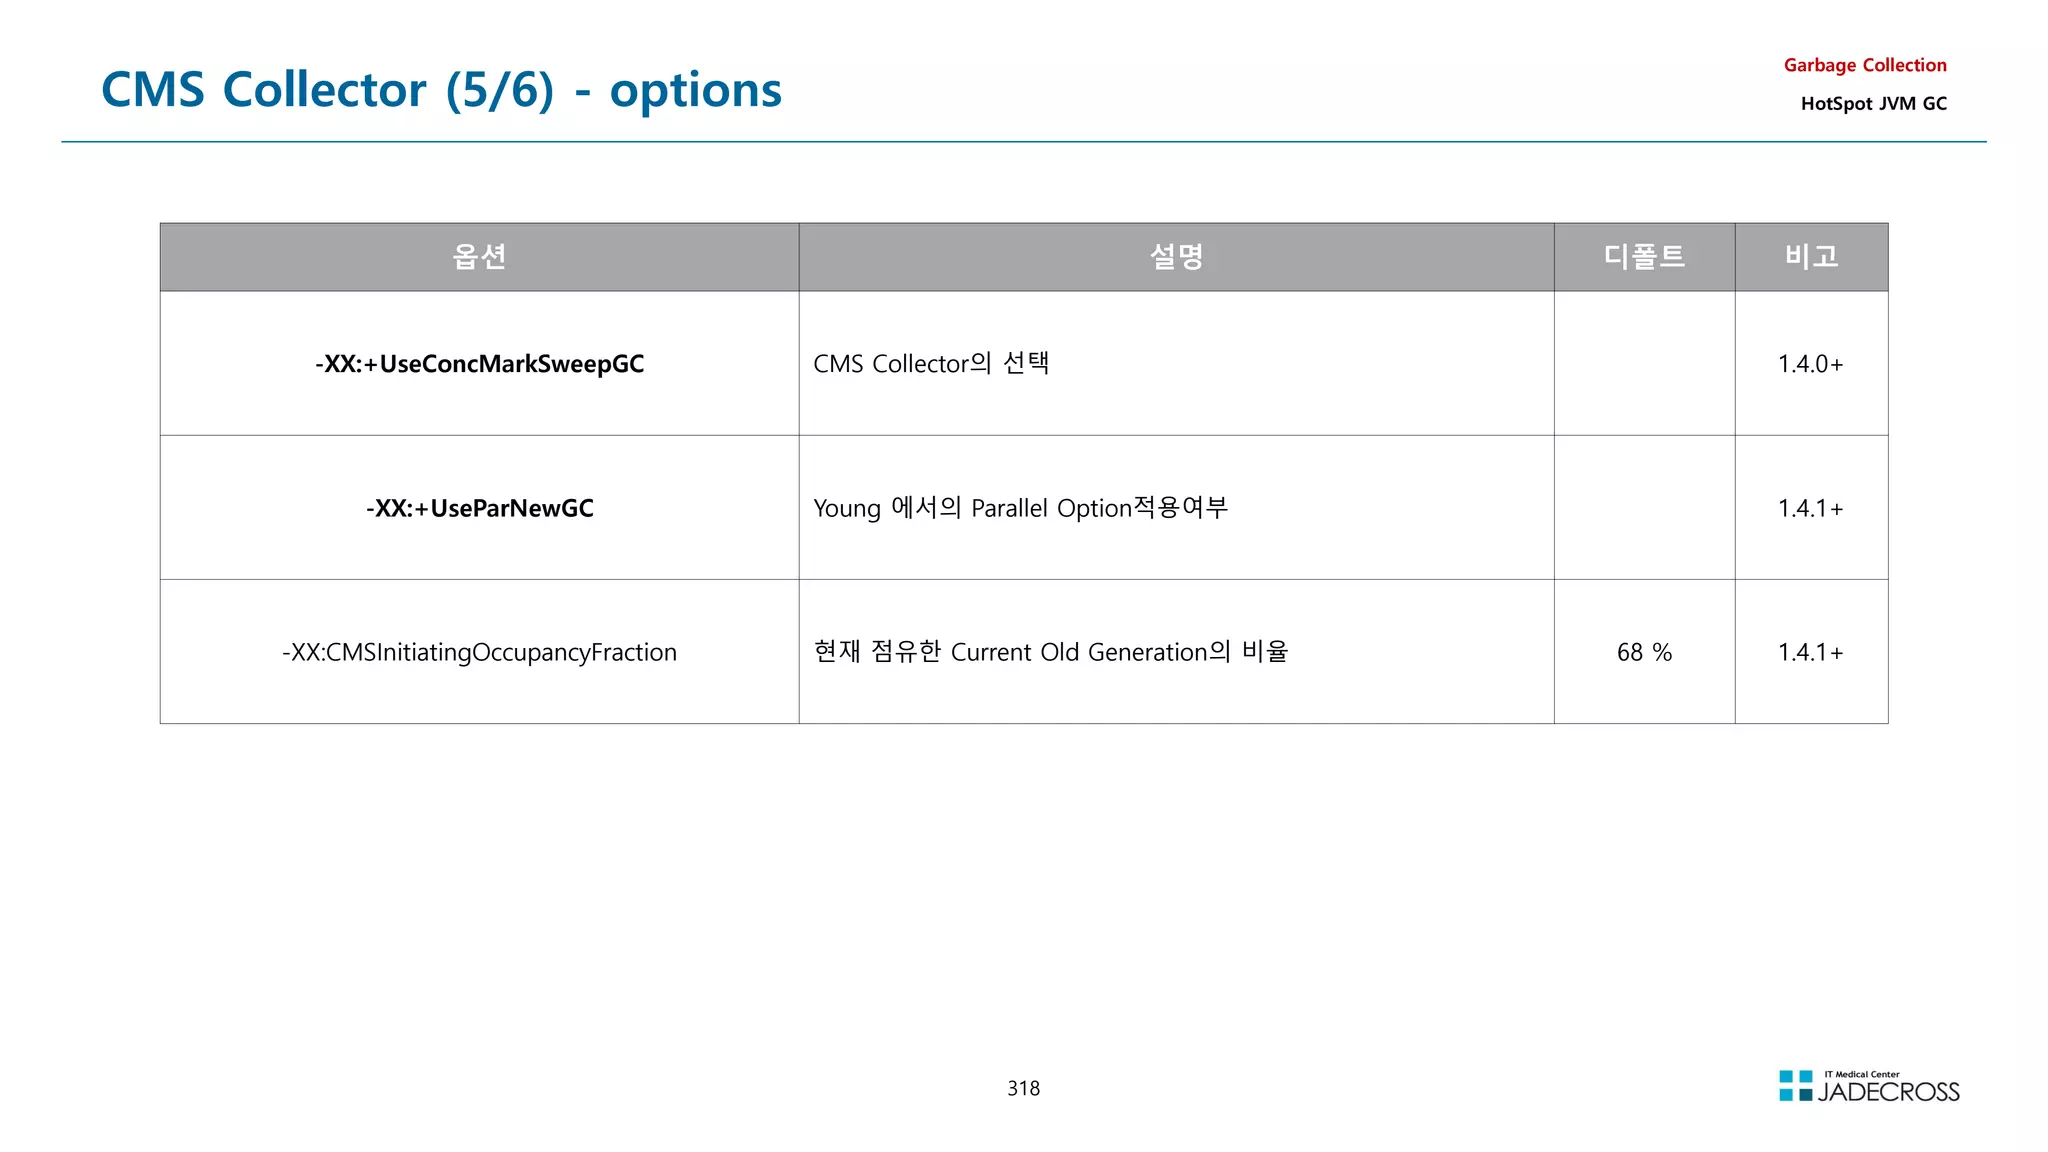
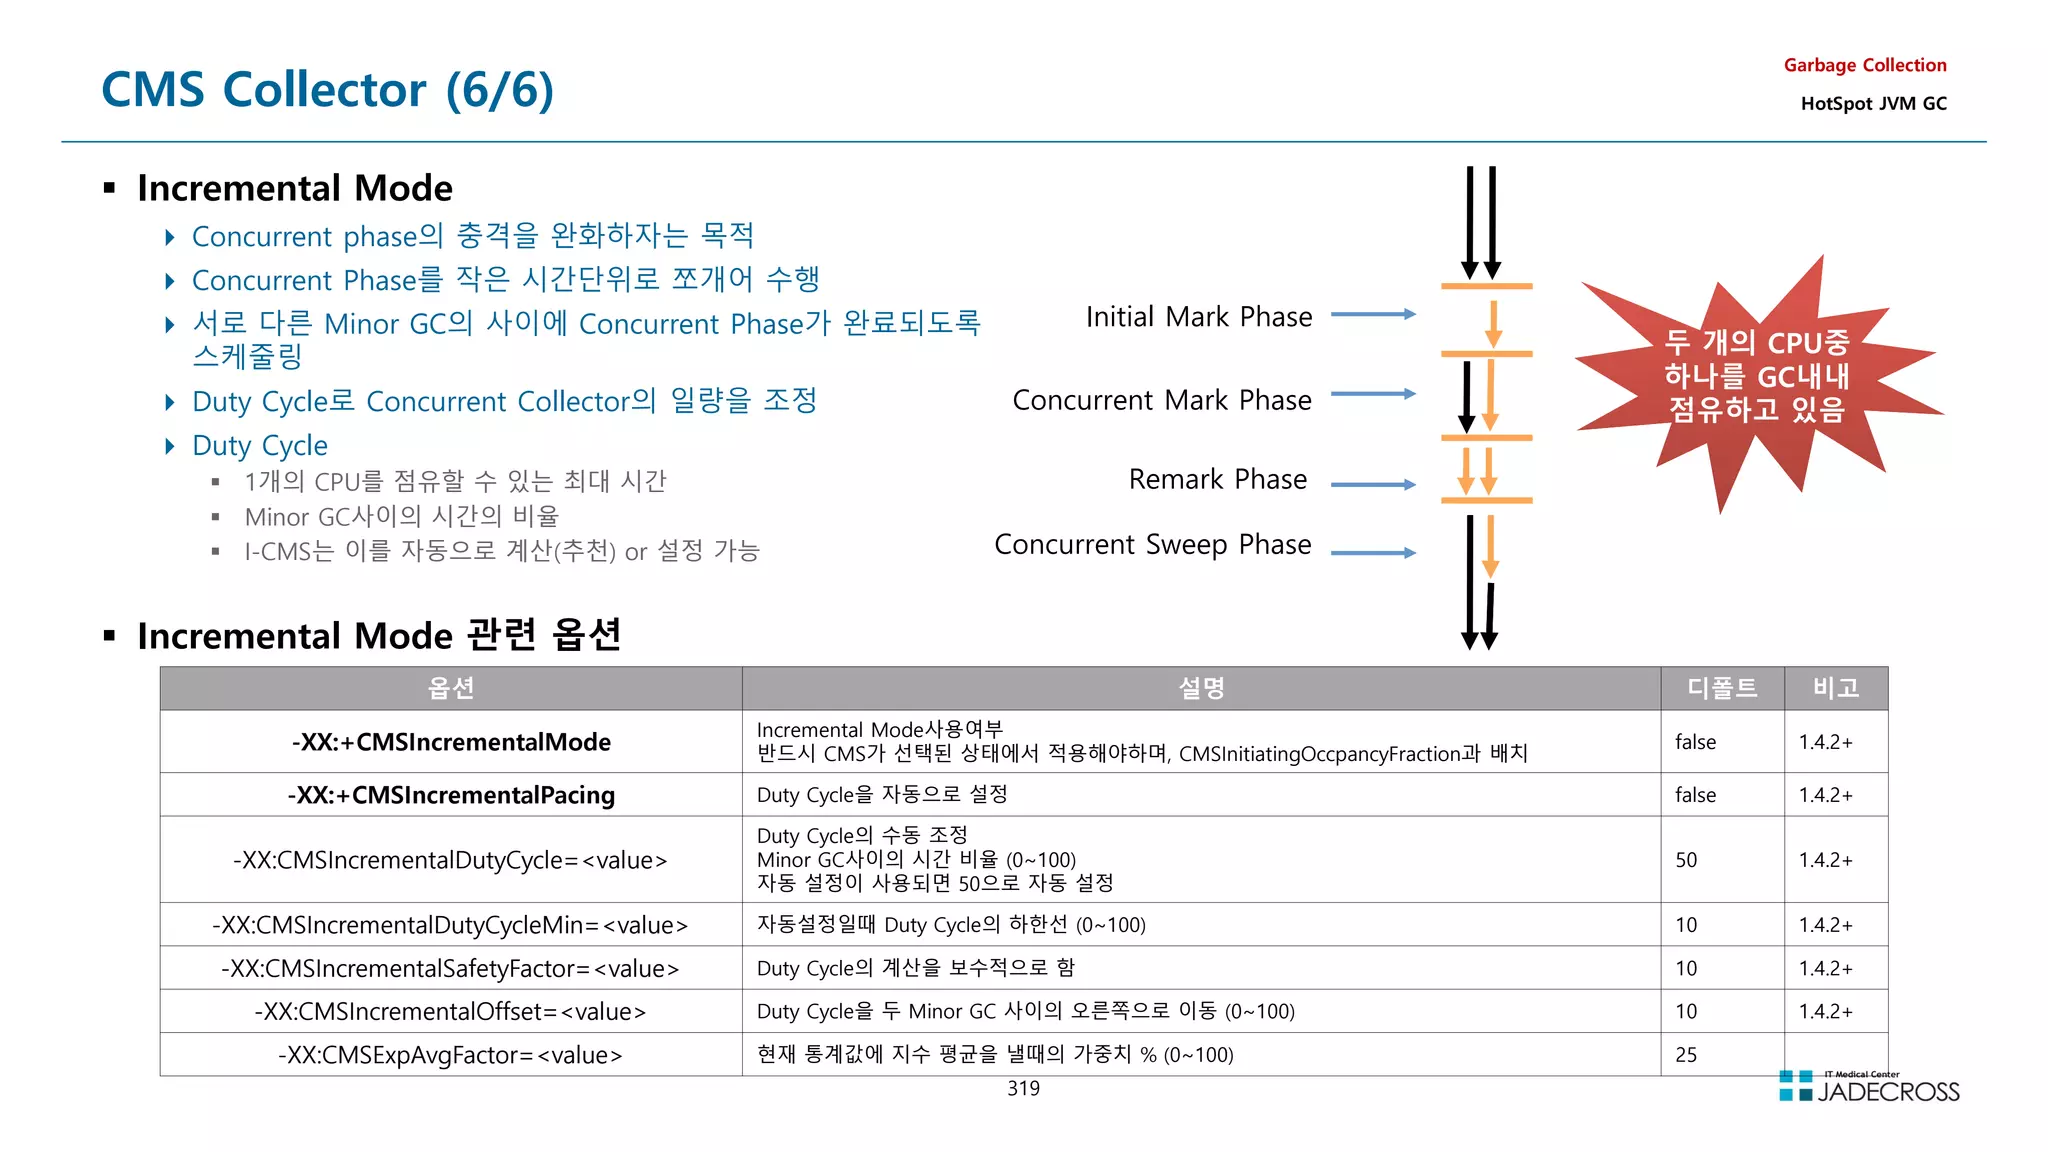
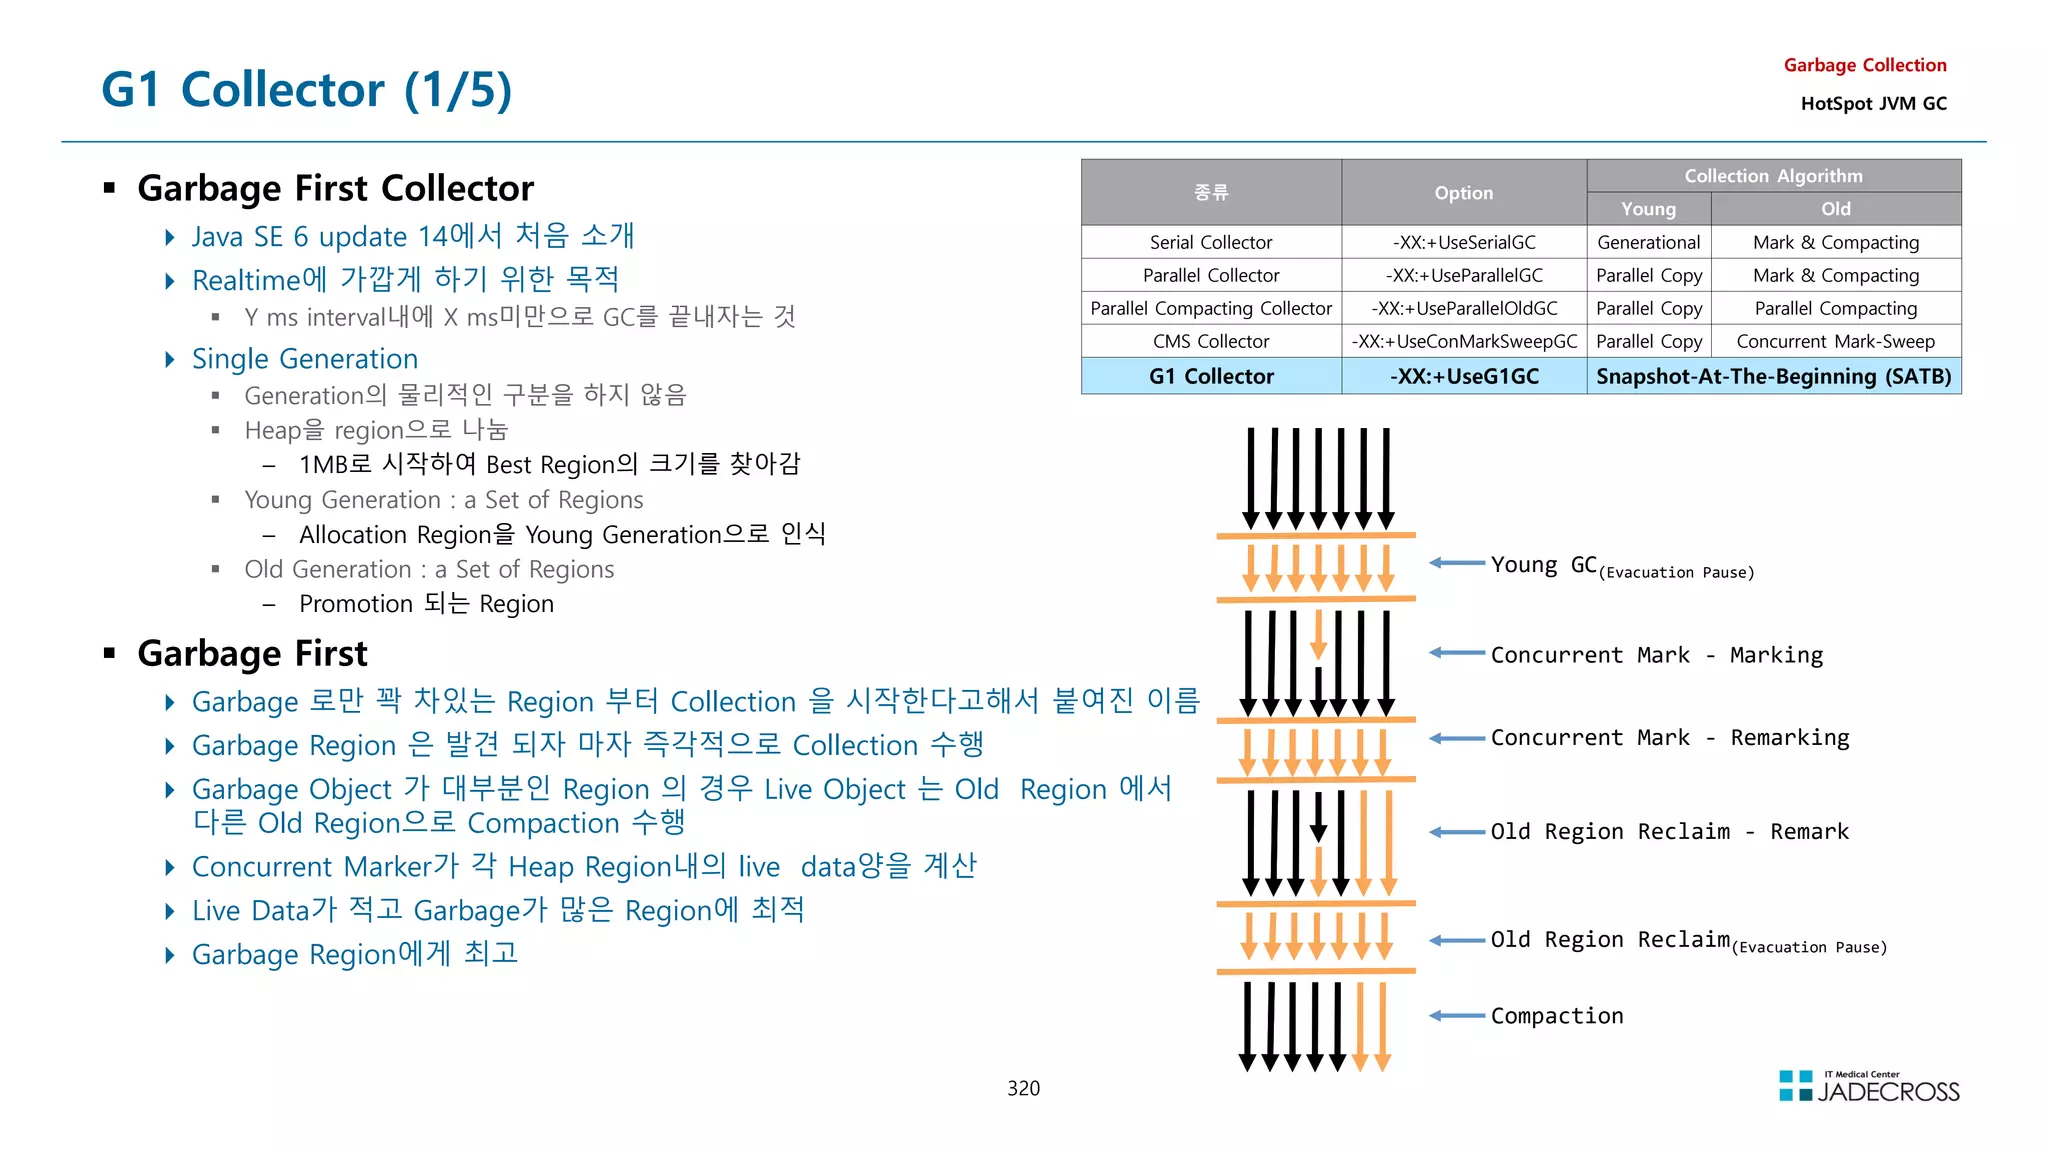
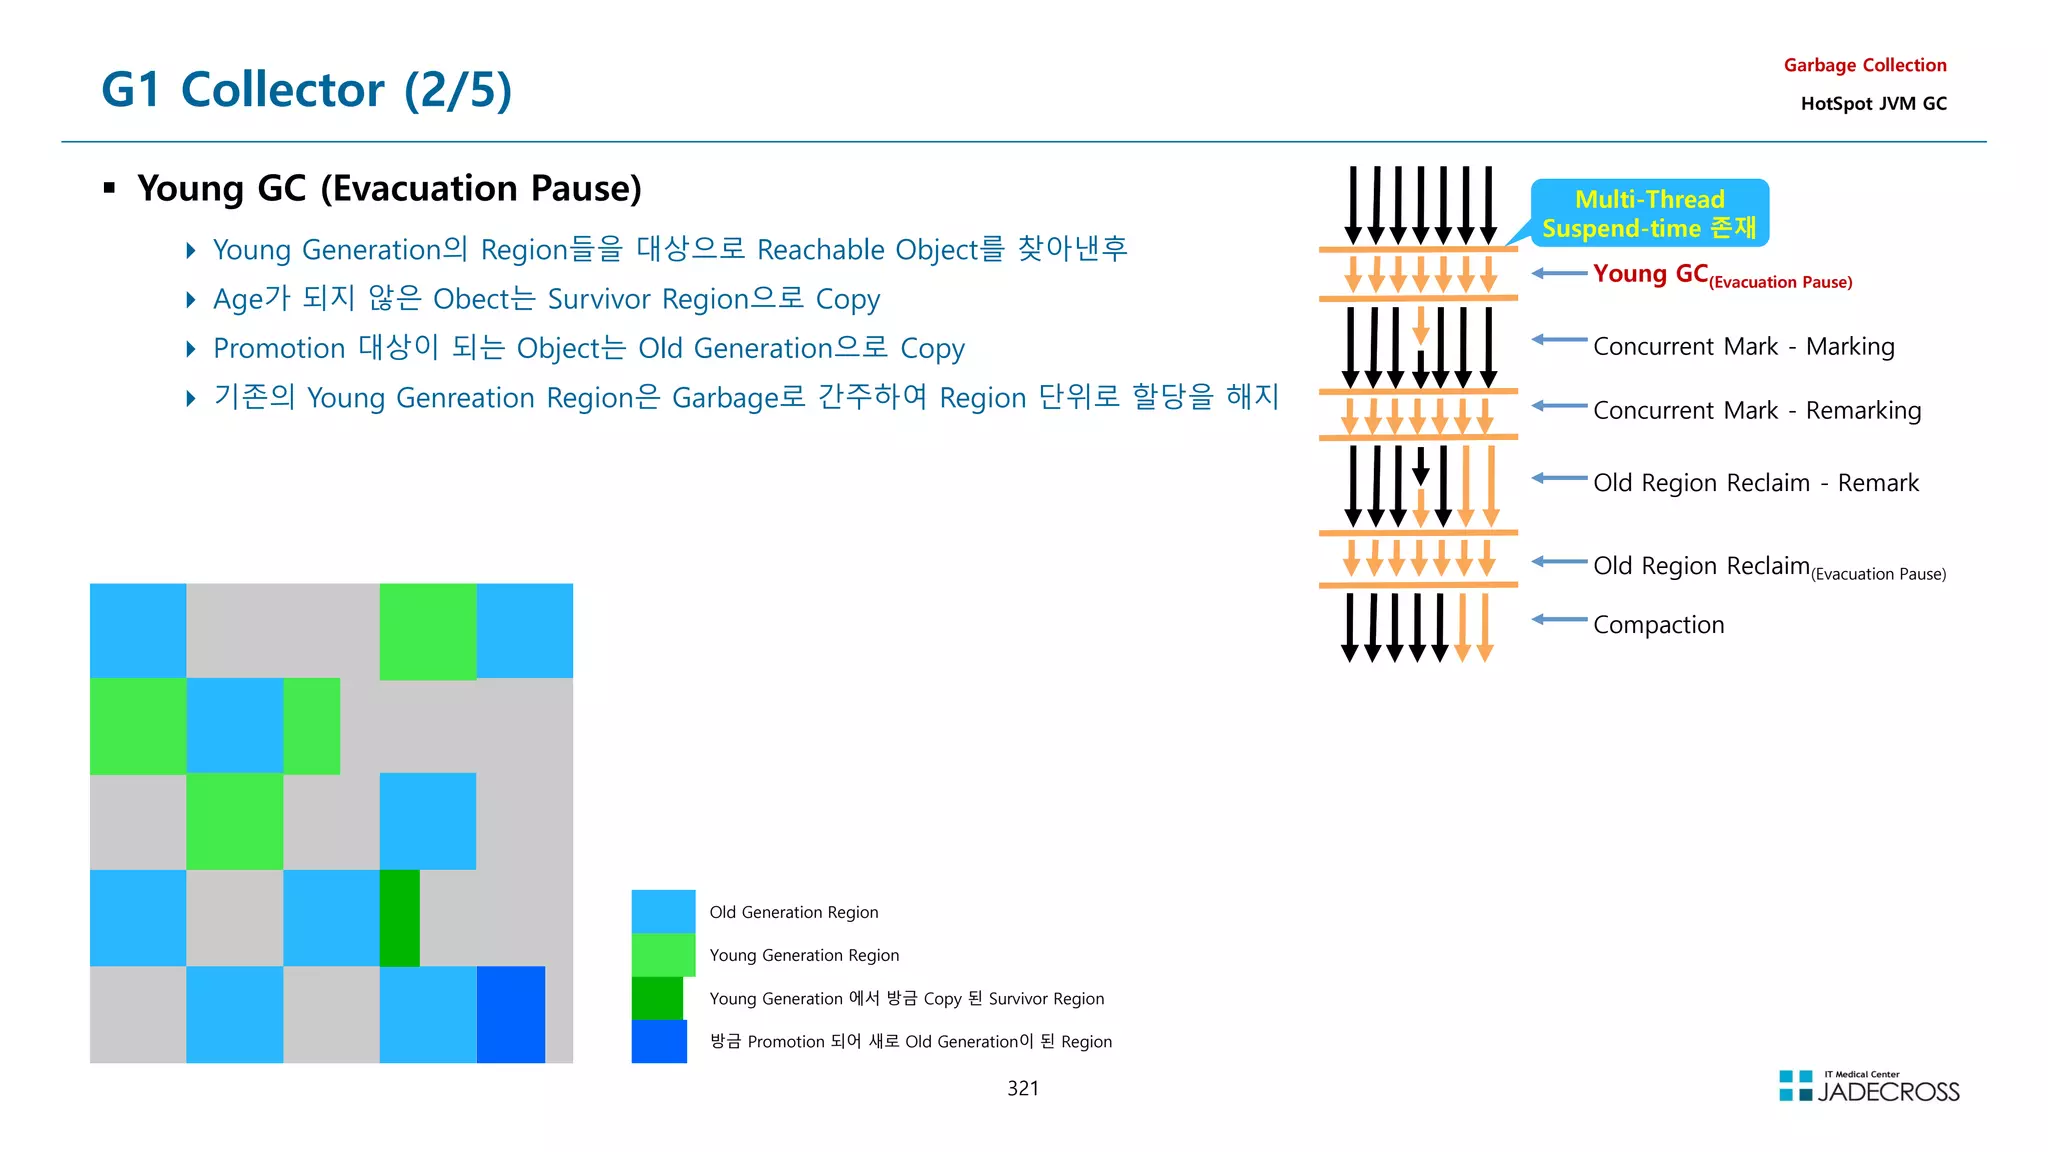
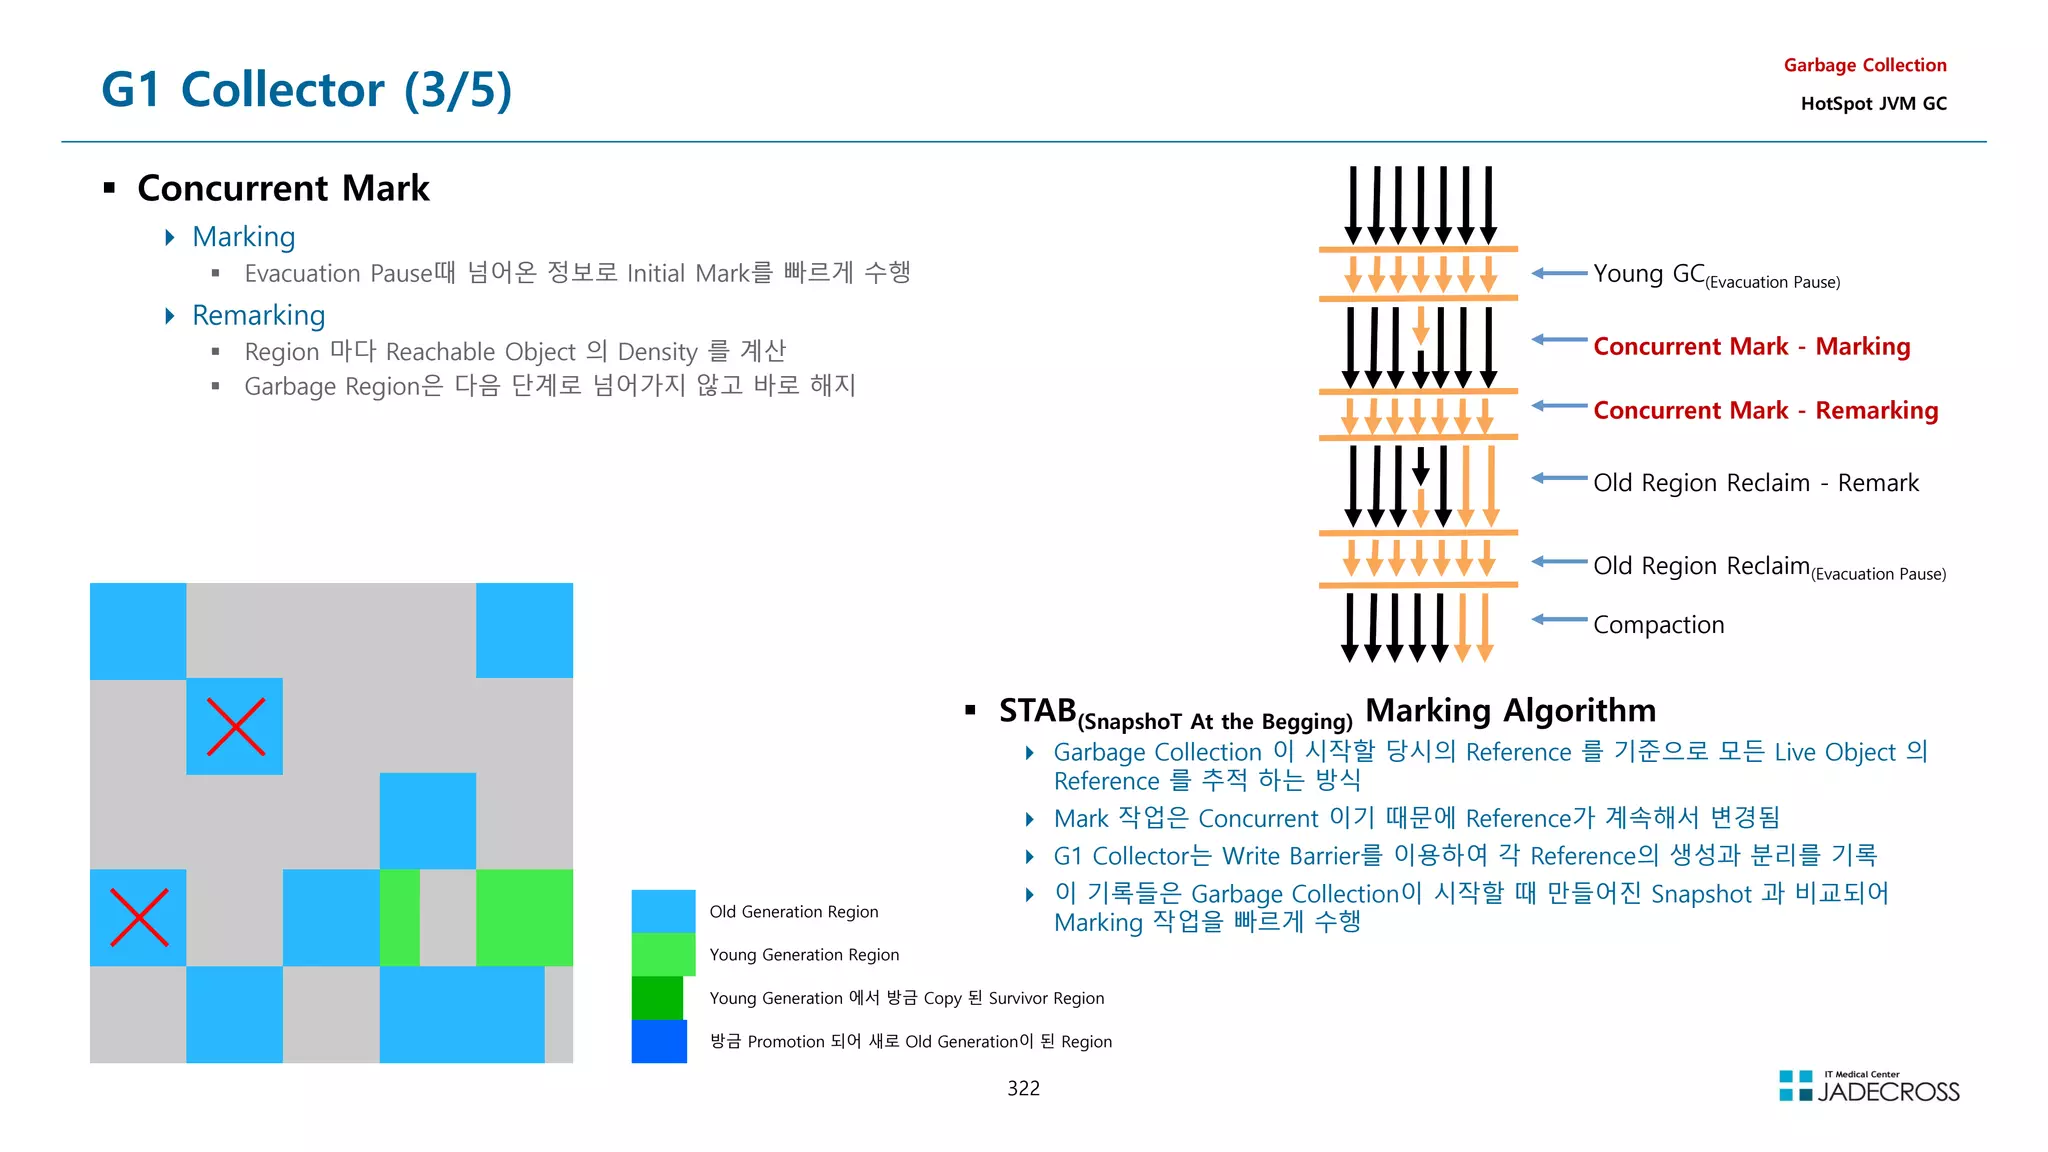
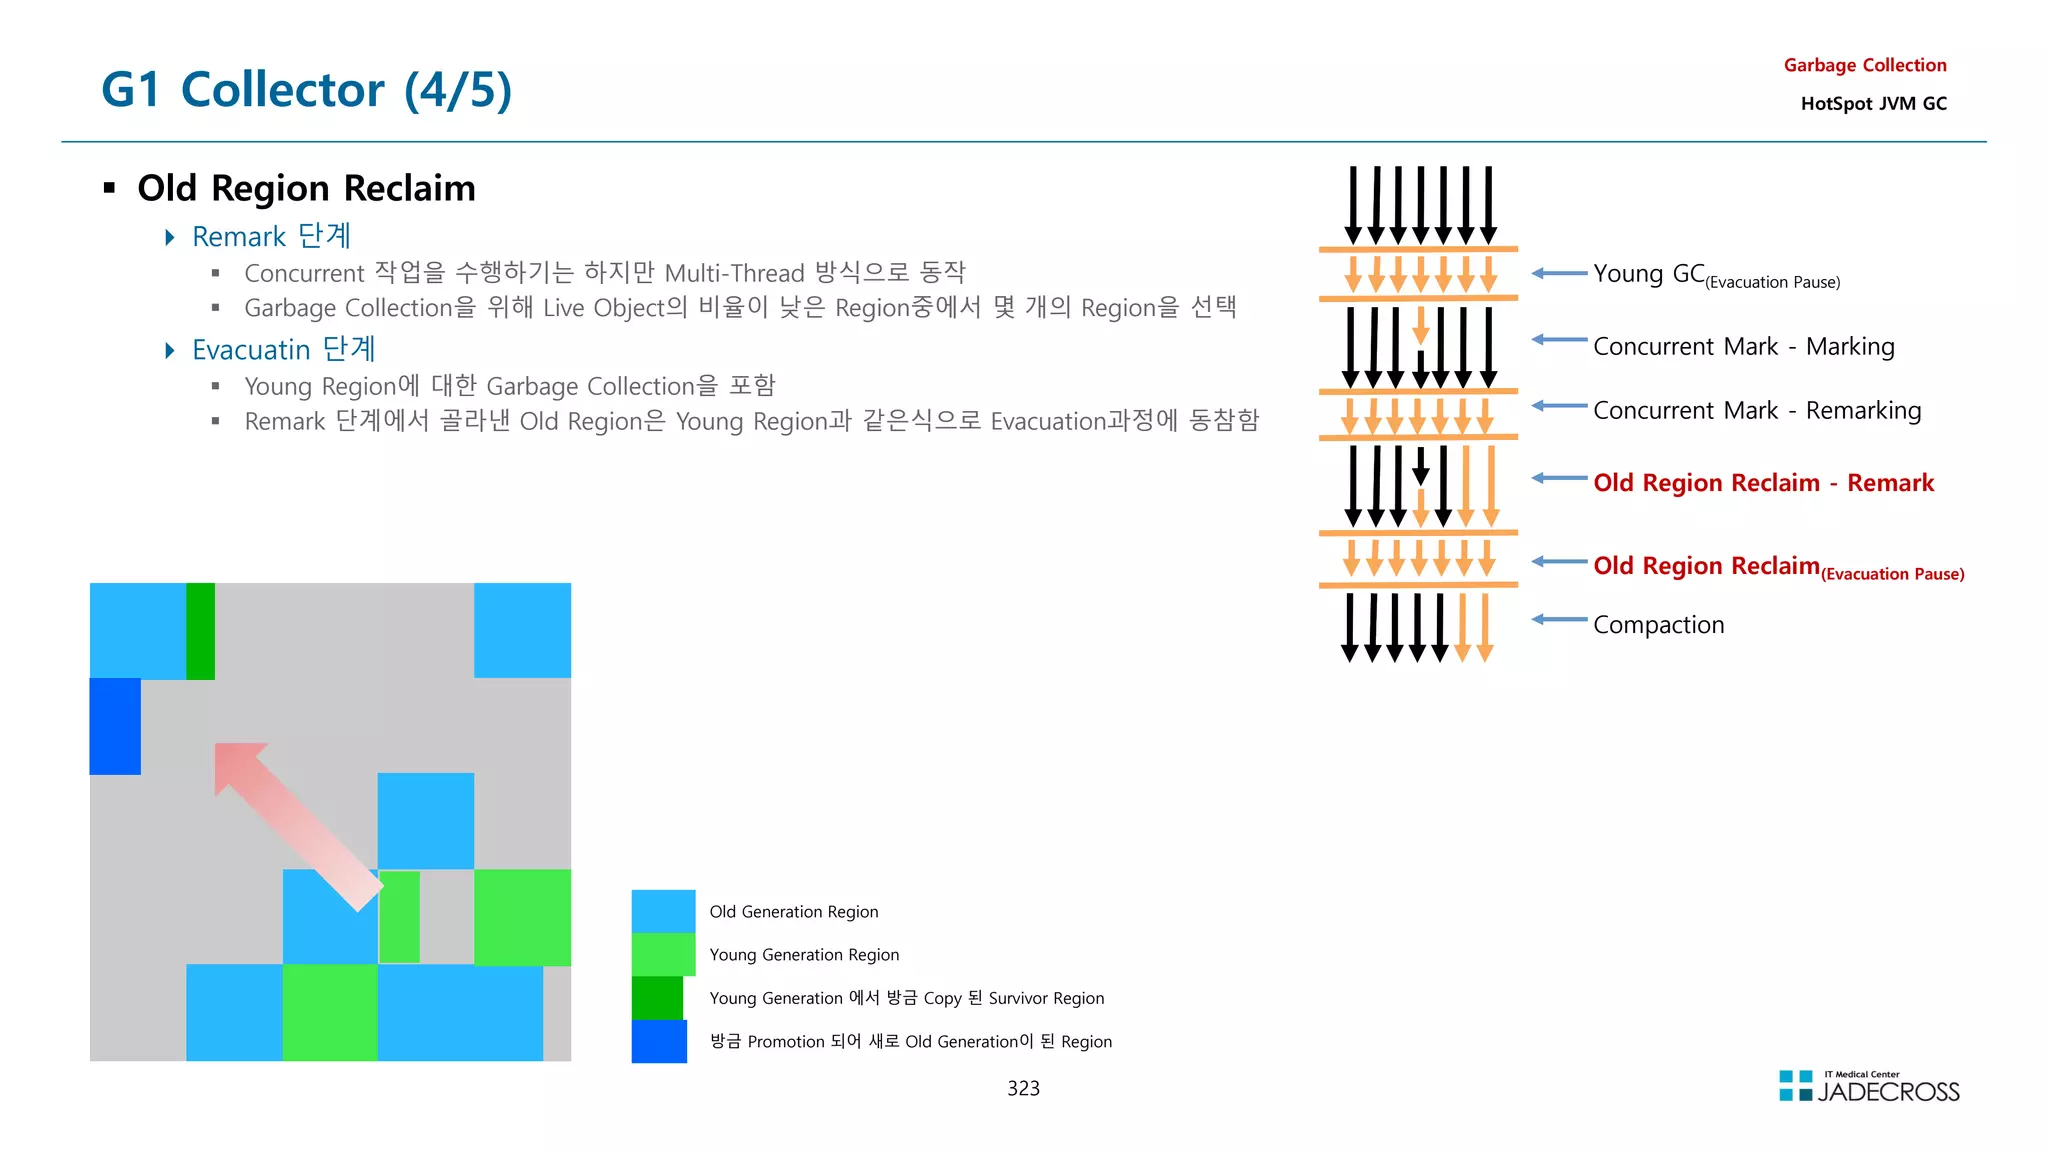
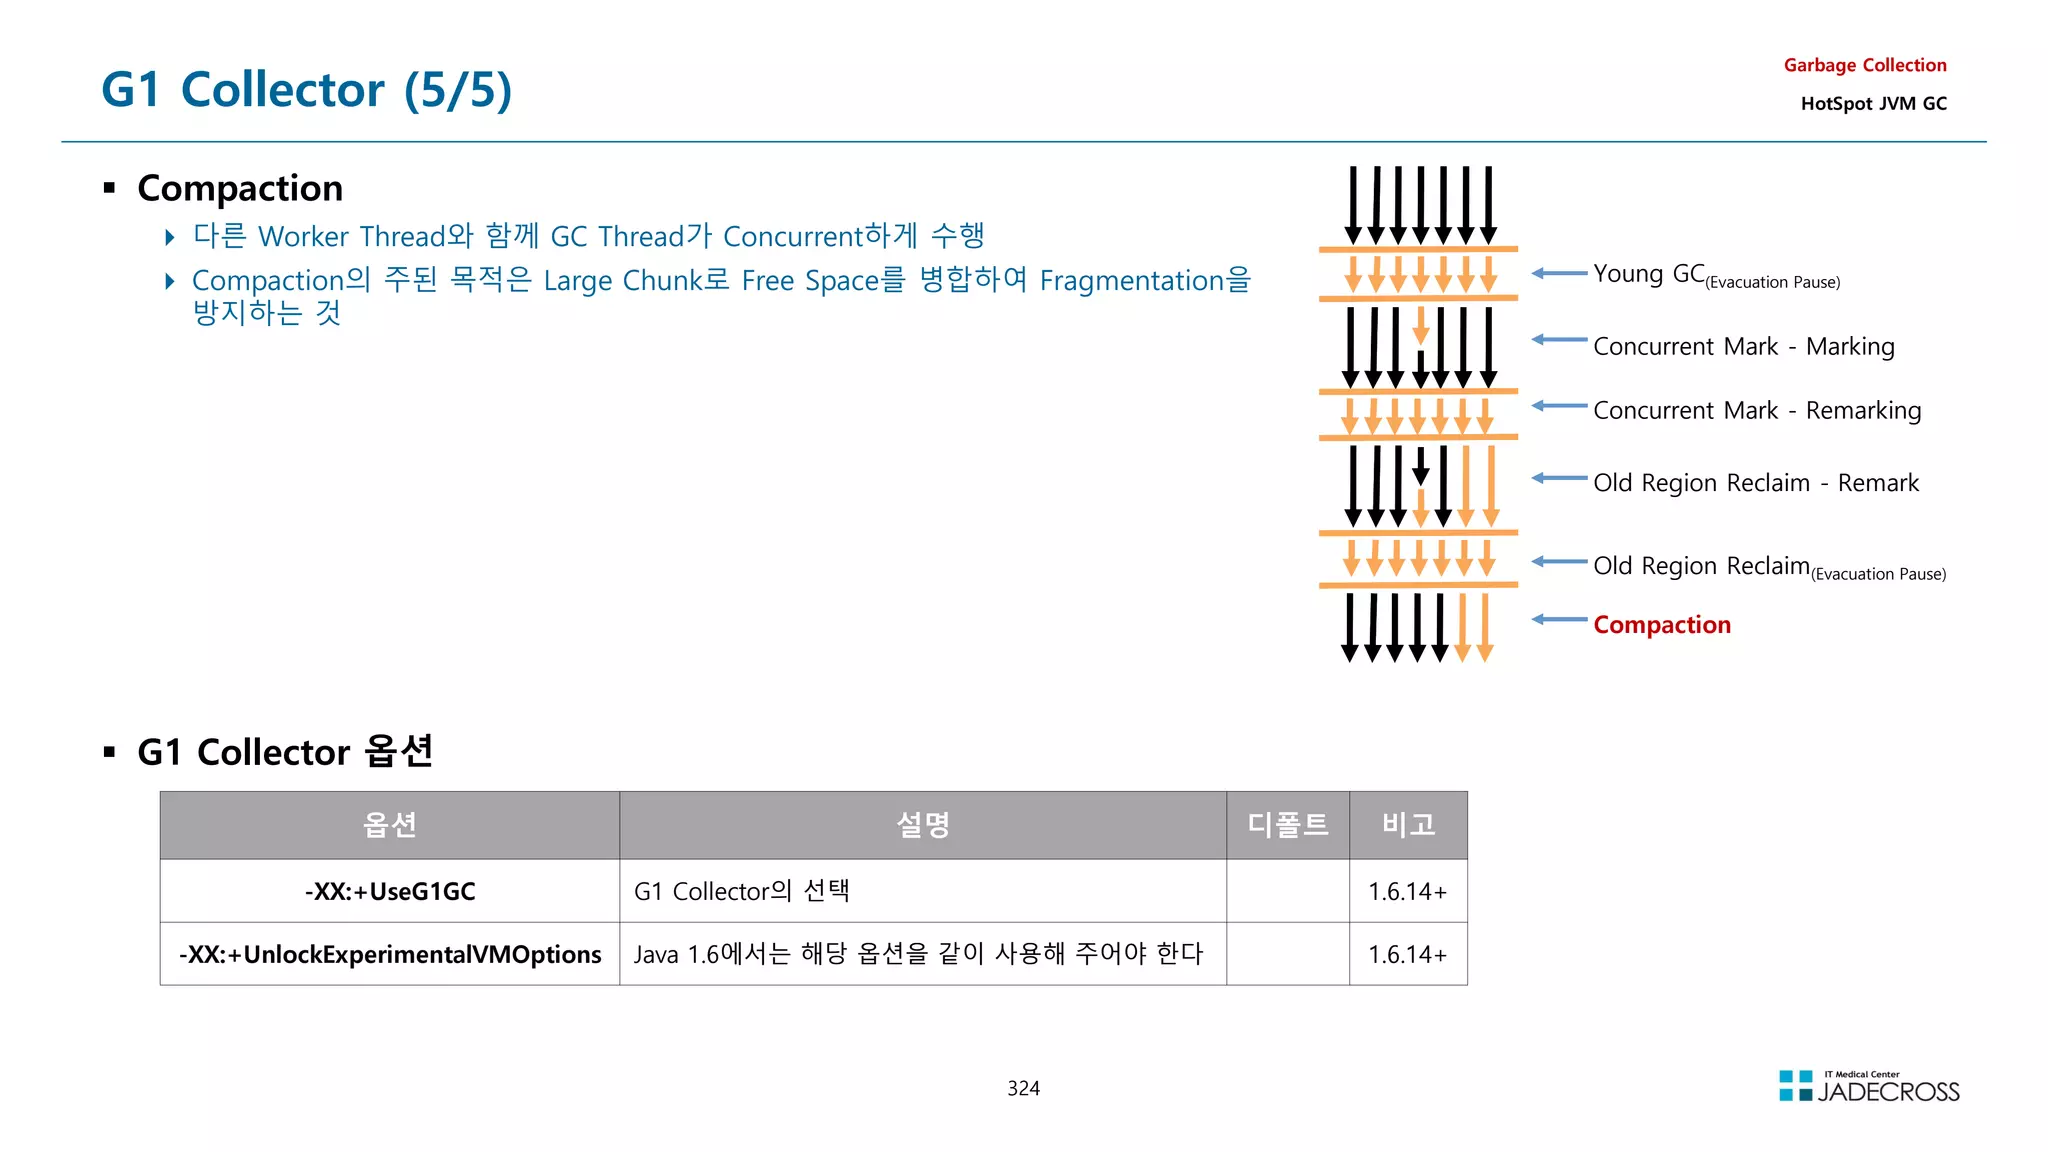
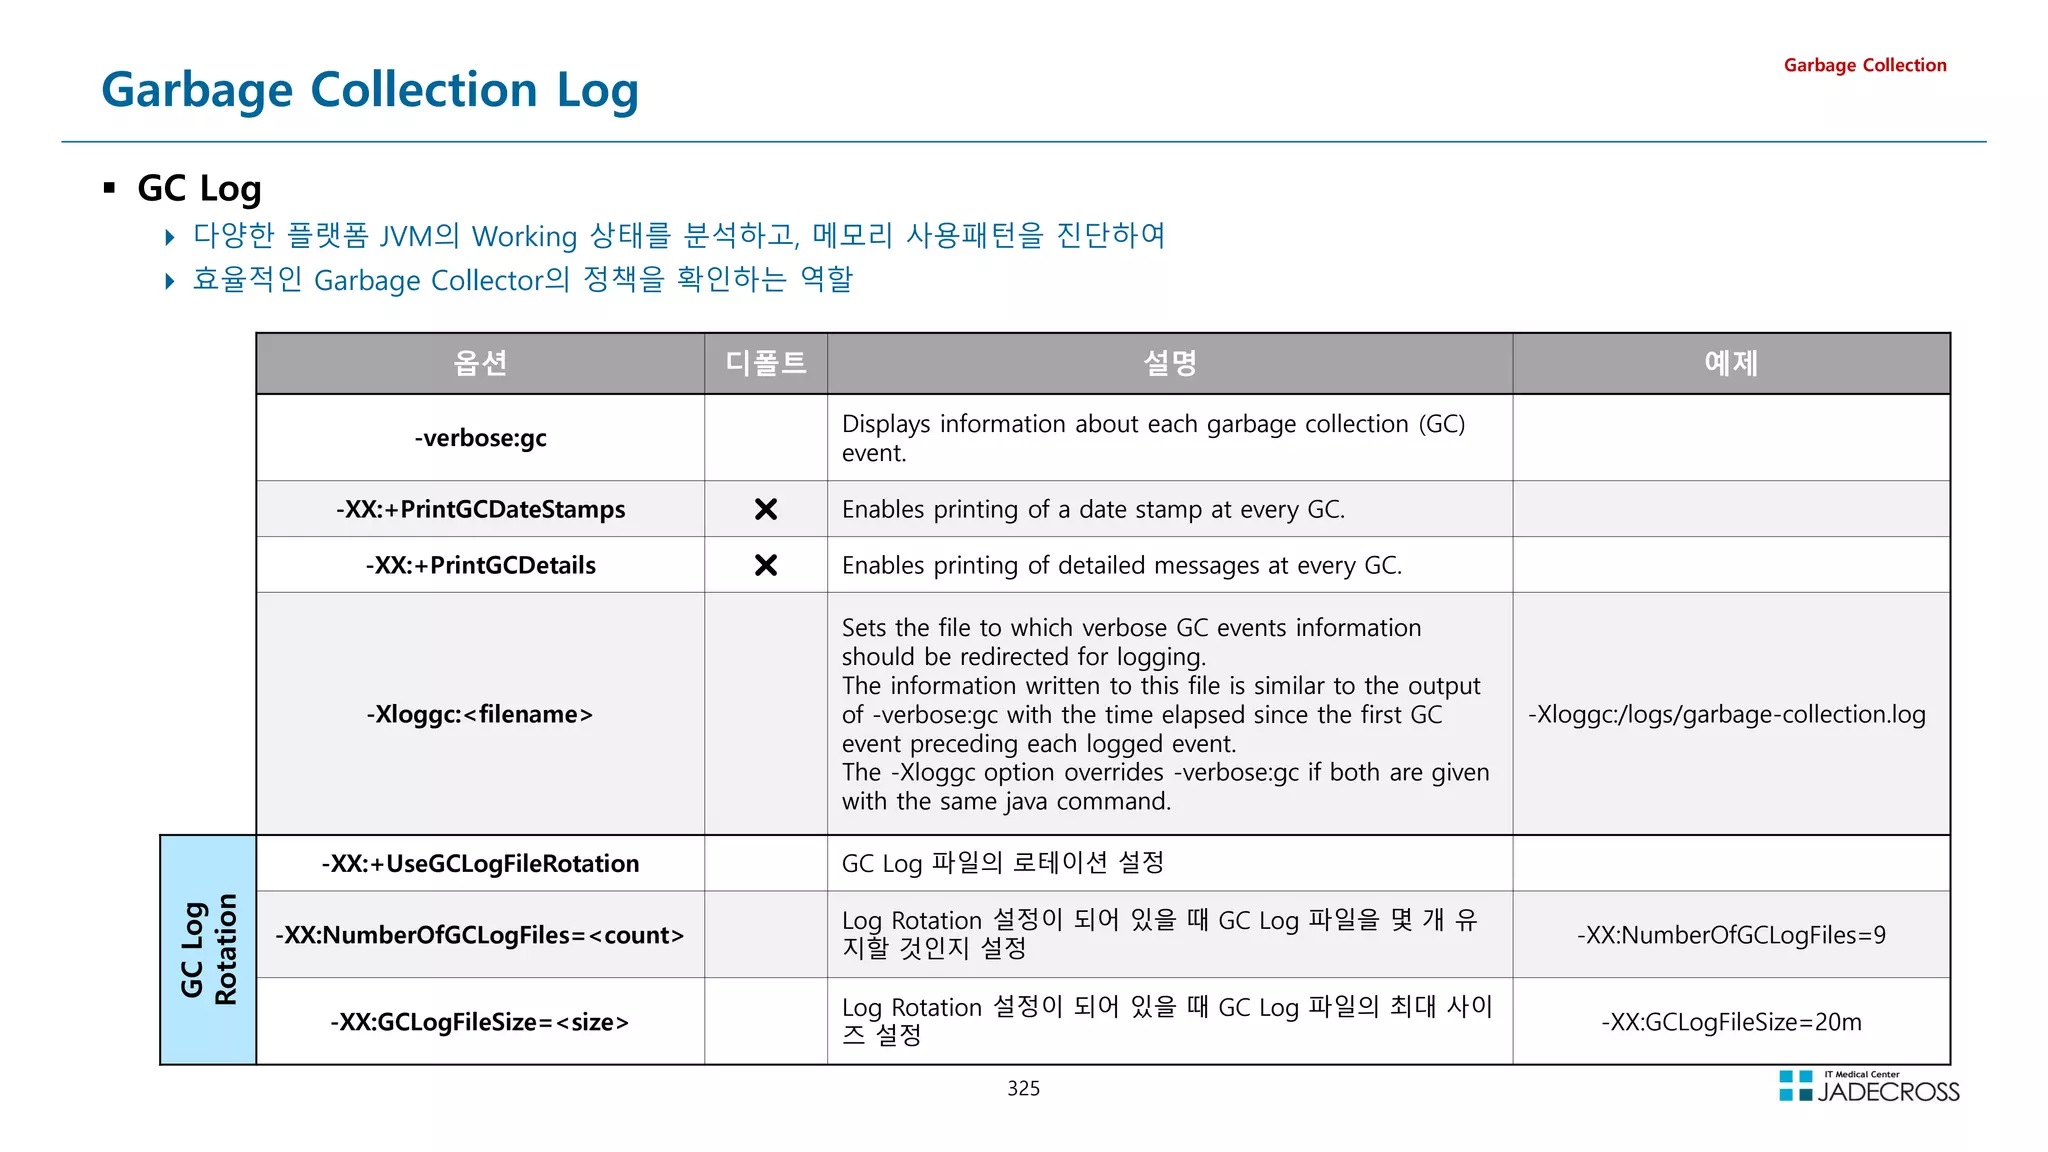
![326
LAB) GC Log Options (1/6)
-verbose:gc
Displays information about each garbage collection (GC) event.
Garbage Collection
GC Log Options
Tomcat v8.5 서버 실행 옵션에 아래 GC 옵션을 추가하고 실행한 후 로그 관찰
-verbose:gc
[GC (Allocation Failure) 131584K-9178K(502784K), 0.1448691 secs]
[GC (Allocation Failure) 140762K-27224K(502784K), 0.2055852 secs]
[GC (Allocation Failure) 158808K-36104K(502784K), 0.1789760 secs]
[GC (Allocation Failure) 167688K-52455K(502784K), 0.1289453 secs]
[GC (Allocation Failure) 184039K-60665K(502784K), 0.0896248 secs]
[GC (GCLocker Initiated GC) 72319K-52000K(452608K), 0.0166015 secs]
[GC (Metadata GC Threshold) 56673K-52145K(433664K), 0.1266670 secs]
[Full GC (Metadata GC Threshold) 52145K-12811K(433664K), 0.1238041 secs]
[GC (Allocation Failure) 94219K-19504K(476160K), 0.0067237 secs]
[GC (Allocation Failure) 97328K-19019K(475648K), 0.0178124 secs]
[GC (Allocation Failure) 96843K-17027K(476672K), 0.0049137 secs]](https://image.slidesharecdn.com/jvm-230511085906-be6f1201/75/JVM_-pdf-326-2048.jpg)
![327
LAB) GC Log Options (2/6)
-XX:+PrintGCDetails
Enables printing of detailed messages at every GC.
Garbage Collection
GC Log Options
Tomcat v8.5 서버 실행 옵션에 아래 GC 옵션을 추가하고 실행한 후 로그 관찰
-XX:+PrintGCDetails
[GC (Allocation Failure) [PSYoungGen: 131584K-10780K(153088K)] 131584K-10796K(502784K), 0.0180295 secs] [Times: user=0.04 sys=0.01, real=0.02 secs]
[GC (Allocation Failure) [PSYoungGen: 142364K-21486K(153088K)] 142380K-27004K(502784K), 0.0201897 secs] [Times: user=0.02 sys=0.00, real=0.02 secs]
[GC (Allocation Failure) [PSYoungGen: 153070K-21476K(153088K)] 158588K-37153K(502784K), 0.0194495 secs] [Times: user=0.04 sys=0.02, real=0.02 secs]
[GC (Allocation Failure) [PSYoungGen: 153060K-21482K(153088K)] 168737K-51899K(502784K), 0.0283827 secs] [Times: user=0.07 sys=0.00, real=0.03 secs]
[GC (Allocation Failure) [PSYoungGen: 153066K-21475K(153088K)] 183483K-60278K(502784K), 0.0202653 secs] [Times: user=0.04 sys=0.01, real=0.02 secs]
[GC (Metadata GC Threshold) [PSYoungGen: 30735K-12879K(104960K)] 69538K-51690K(454656K), 0.0147922 secs] [Times: user=0.04 sys=0.00, real=0.01 secs]
[Full GC (Metadata GC Threshold) [PSYoungGen: 12879K-0K(104960K)] [ParOldGen: 38811K-13236K(349696K)] 51690K-13236K(454656K), [Metaspace: 20492K-
20492K(1069056K)], 0.0624606 secs] [Times: user=0.11 sys=0.04, real=0.07 secs]
[GC (Allocation Failure) [PSYoungGen: 83456K-7072K(90624K)] 96692K-20316K(440320K), 0.0049683 secs] [Times: user=0.01 sys=0.00, real=0.00 secs]
[GC (Allocation Failure) [PSYoungGen: 90528K-6064K(126976K)] 103772K-19316K(476672K), 0.0074023 secs] [Times: user=0.02 sys=0.00, real=0.01 secs]](https://image.slidesharecdn.com/jvm-230511085906-be6f1201/75/JVM_-pdf-327-2048.jpg)
![328
LAB) GC Log Options (3/6)
-XX:+PrintGCDateStamps
Enables printing of a date stamp at every GC.
Garbage Collection
GC Log Options
Tomcat v8.5 서버 실행 옵션에 아래 GC 옵션을 추가하고 실행한 후 로그 관찰
-XX:+PrintGCDetails
-XX:+PrintGCDateStamps
2021-11-04T11:18:55.542+0900: [GC (Allocation Failure) [PSYoungGen: 131584K-10795K(153088K)] 131584K-10811K(502784K), 0.0161892 secs] [Times: user=0.02 sys=0.01, real=0.02 secs]
2021-11-04T11:18:56.745+0900: [GC (Allocation Failure) [PSYoungGen: 142379K-21479K(153088K)] 142395K-27003K(502784K), 0.0224907 secs] [Times: user=0.04 sys=0.00, real=0.02 secs]
2021-11-04T11:18:57.313+0900: [GC (Allocation Failure) [PSYoungGen: 153063K-21484K(153088K)] 158587K-38391K(502784K), 0.0313958 secs] [Times: user=0.05 sys=0.01, real=0.02 secs]
2021-11-04T11:18:57.899+0900: [GC (Allocation Failure) [PSYoungGen: 153068K-21500K(153088K)] 169975K-52601K(502784K), 0.0274147 secs] [Times: user=0.07 sys=0.01, real=0.02 secs]
2021-11-04T11:18:58.361+0900: [GC (Allocation Failure) [PSYoungGen: 153084K-21476K(153088K)] 184185K-59813K(502784K), 0.0277766 secs] [Times: user=0.05 sys=0.01, real=0.02 secs]
2021-11-04T11:18:58.539+0900: [GC (Metadata GC Threshold) [PSYoungGen: 35331K-12929K(105984K)] 73669K-51274K(455680K), 0.0145059 secs] [Times: user=0.03 sys=0.00, real=0.01 secs]
2021-11-04T11:18:58.553+0900: [Full GC (Metadata GC Threshold) [PSYoungGen: 12929K-0K(105984K)] [ParOldGen: 38345K-13288K(349696K)] 51274K-13288K(455680K), [Metaspace: 20520K-
20520K(1069056K)], 0.0943705 secs] [Times: user=0.24 sys=0.05, real=0.10 secs]
2021-11-04T11:18:59.647+0900: [GC (Allocation Failure) [PSYoungGen: 84480K-7041K(91648K)] 97768K-20337K(441344K), 0.0057647 secs] [Times: user=0.01 sys=0.00, real=0.01 secs]](https://image.slidesharecdn.com/jvm-230511085906-be6f1201/75/JVM_-pdf-328-2048.jpg)
![329
LAB) GC Log Options (4/6)
-Xloggc:filepath
Sets the file to which verbose GC events information should be redirected for logging.
The information written to this file is similar to the output of -verbose:gc with the time elapsed since the first GC event preceding each logged event.
The -Xloggc option overrides -verbose:gc if both are given with the same java command.
filename 에 %t 를 추가하면 파일명에 현재날짜가 추가됨
Garbage Collection
GC Log Options
Tomcat v8.5 서버 실행 옵션에 아래 GC 옵션을 추가하고 서버를 실행하여
정상기동 된것을 확인하고 서버 종료
-XX:+PrintGCDetails
-XX:+PrintGCDateStamps
-Xloggc:/root/lab/gclog/gc01_%t.log
GC 로그 파일 내용 확인
[root@jvmedu ~]# ls -l ~/lab/gclog/
-rw-r--r-- 1 root root 3504 Nov 4 12:18 gc01_2021-11-04_12-16-59.log
[root@jvmedu gclog]# cat ~/lab/gclog/c01_2021-11-04_12-16-59.log
OpenJDK 64-Bit Server VM (25.302-b08) for linux-amd64 JRE (1.8.0_302-b08), built on Jul 20 2021 21:30:31 by jenkins with gcc 7.5.0
Memory: 4k page, physical 4044812k(1694060k free), swap 4064252k(4064252k free)
CommandLine flags: -XX:InitialHeapSize=536870912 -XX:MaxHeapSize=536870912 -XX:+PrintGC -XX:+PrintGCDateStamps -XX:+PrintGCDetails -XX:+PrintGCTimeStamps -XX:+UseCompressedClassPointers -
XX:+UseCompressedOops -XX:+UseParallelGC
2021-11-04T12:17:09.746+0900: 10.191: [GC (Allocation Failure) [PSYoungGen: 131584K-9066K(153088K)] 131584K-9146K(502784K), 0.1489668 secs] [Times: user=0.00 sys=0.48, real=0.15 secs]
2021-11-04T12:17:11.702+0900: 12.146: [GC (Allocation Failure) [PSYoungGen: 140650K-21482K(153088K)] 140730K-26263K(502784K), 0.2348150 secs] [Times: user=0.00 sys=0.57, real=0.23 secs]
2021-11-04T12:17:12.648+0900: 13.093: [GC (Allocation Failure) [PSYoungGen: 153066K-21474K(153088K)] 157847K-35892K(502784K), 0.1946861 secs] [Times: user=0.03 sys=0.42, real=0.19 secs]
2021-11-04T12:17:14.185+0900: 14.630: [Full GC (Metadata GC Threshold) [PSYoungGen: 12805K-0K(101888K)] [ParOldGen: 38941K-13174K(349696K)] 51747K-13174K(451584K), [Metaspace: 20531K-
20531K(1069056K)], 0.1761207 secs] [Times: user=0.29 sys=0.30, real=0.18 secs]
2021-11-04T12:17:15.664+0900: 16.109: [GC (Allocation Failure) [PSYoungGen: 80384K-6670K(87552K)] 93558K-19852K(437248K), 0.0196809 secs] [Times: user=0.04 sys=0.00, real=0.02 secs]
~~~
Heap
PSYoungGen total 126464K, used 25320K [0x00000000f5580000, 0x0000000100000000, 0x0000000100000000)
eden space 78336K, 31% used [0x00000000f5580000,0x00000000f6df21f8,0x00000000fa200000)
from space 48128K, 0% used [0x00000000fa200000,0x00000000fa248000,0x00000000fd100000)
to space 47616K, 0% used [0x00000000fd180000,0x00000000fd180000,0x0000000100000000)
ParOldGen total 349696K, used 17116K [0x00000000e0000000, 0x00000000f5580000, 0x00000000f5580000)
object space 349696K, 4% used [0x00000000e0000000,0x00000000e10b73f0,0x00000000f5580000)
Metaspace used 31323K, capacity 32012K, committed 32256K, reserved 1077248K
class space used 3660K, capacity 3825K, committed 3840K, reserved 1048576K](https://image.slidesharecdn.com/jvm-230511085906-be6f1201/75/JVM_-pdf-329-2048.jpg)
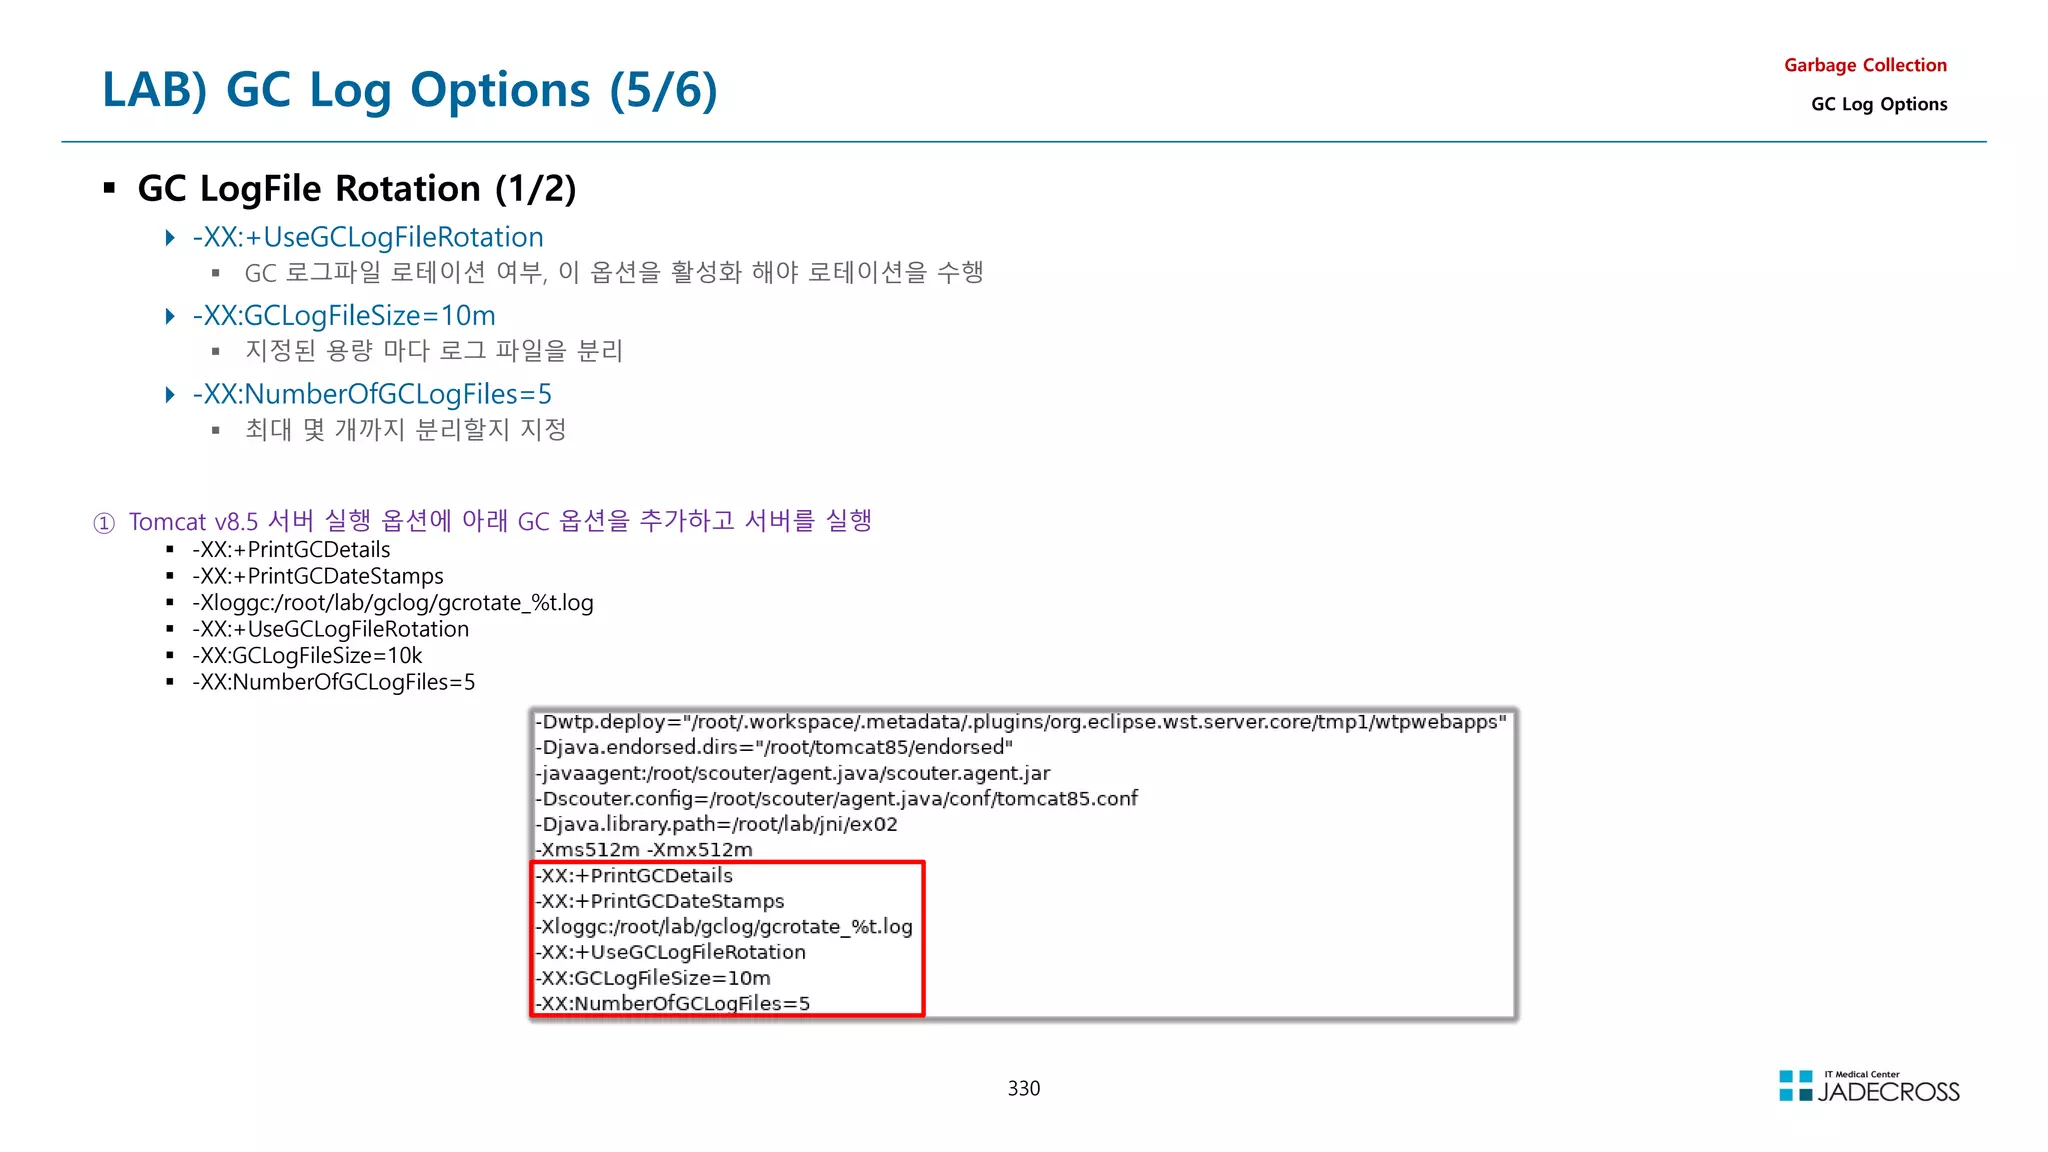
![331
LAB) GC Log Options (6/6)
GC LogFile Rotation (2/2)
Garbage Collection
GC Log Options
② jadeedu_jvmswjava_toolapache-jmeter-5.4.1bin 폴더 하위의 jmeter.bat 파일 실행
③ 부하스크립트 파일 오픈 후 “UTG05_Heap OOM” Thread Group을 Enable한 후 부하를 발생시키고 로그파일 로테이션 관찰
스크립트 파일 : jadeedu_jvmswjava_toolapache-jmeter-5.4.1jmxJvmTroubleshoot.jmx
Enable Thread Group : UTG05_Heap OOM
부하 발생 ④ GC 로그파일 로테이션 관찰
[root@jvmedu ~]# watch ls -lh ~/lab/gclog/](https://image.slidesharecdn.com/jvm-230511085906-be6f1201/75/JVM_-pdf-331-2048.jpg)
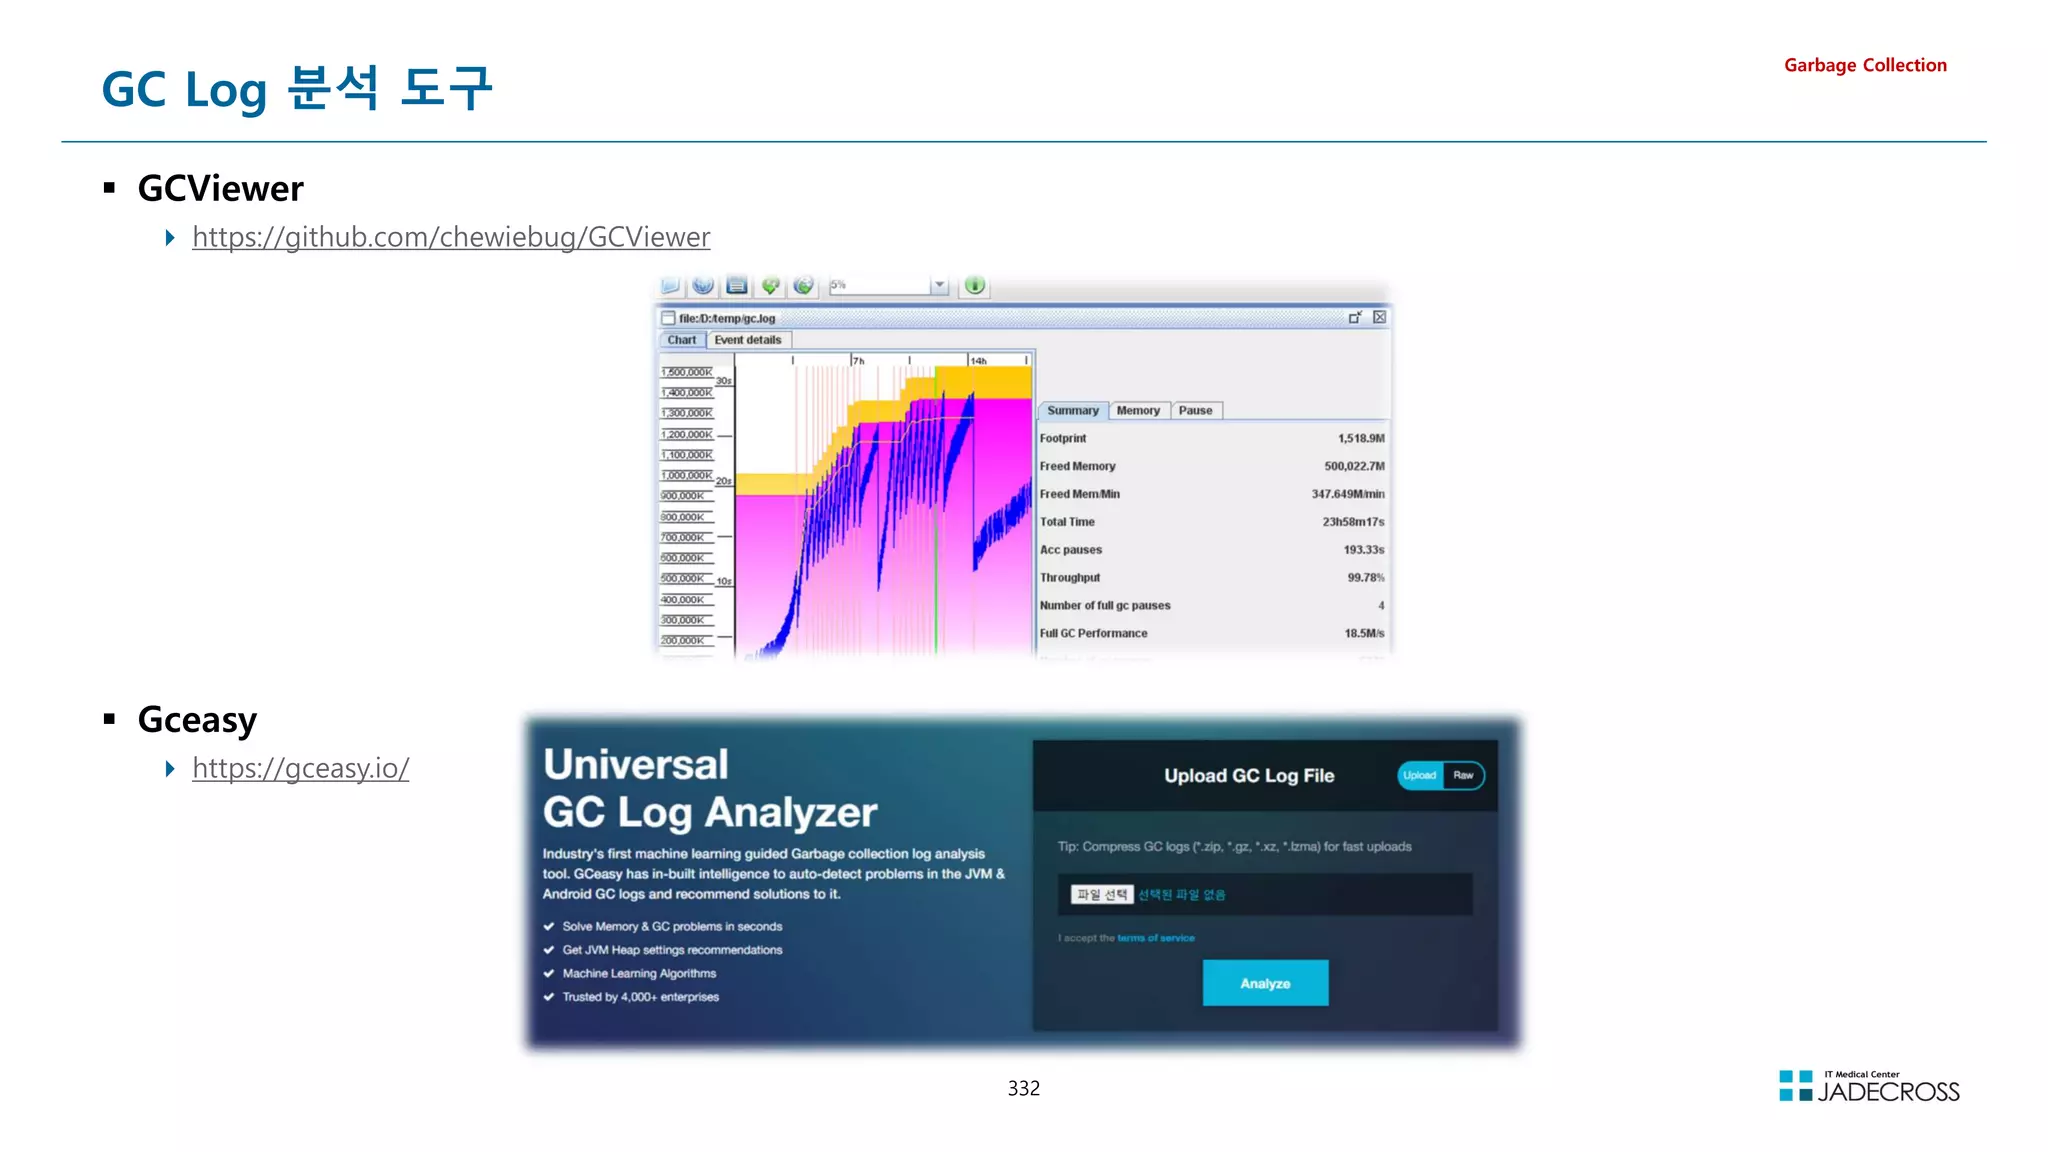
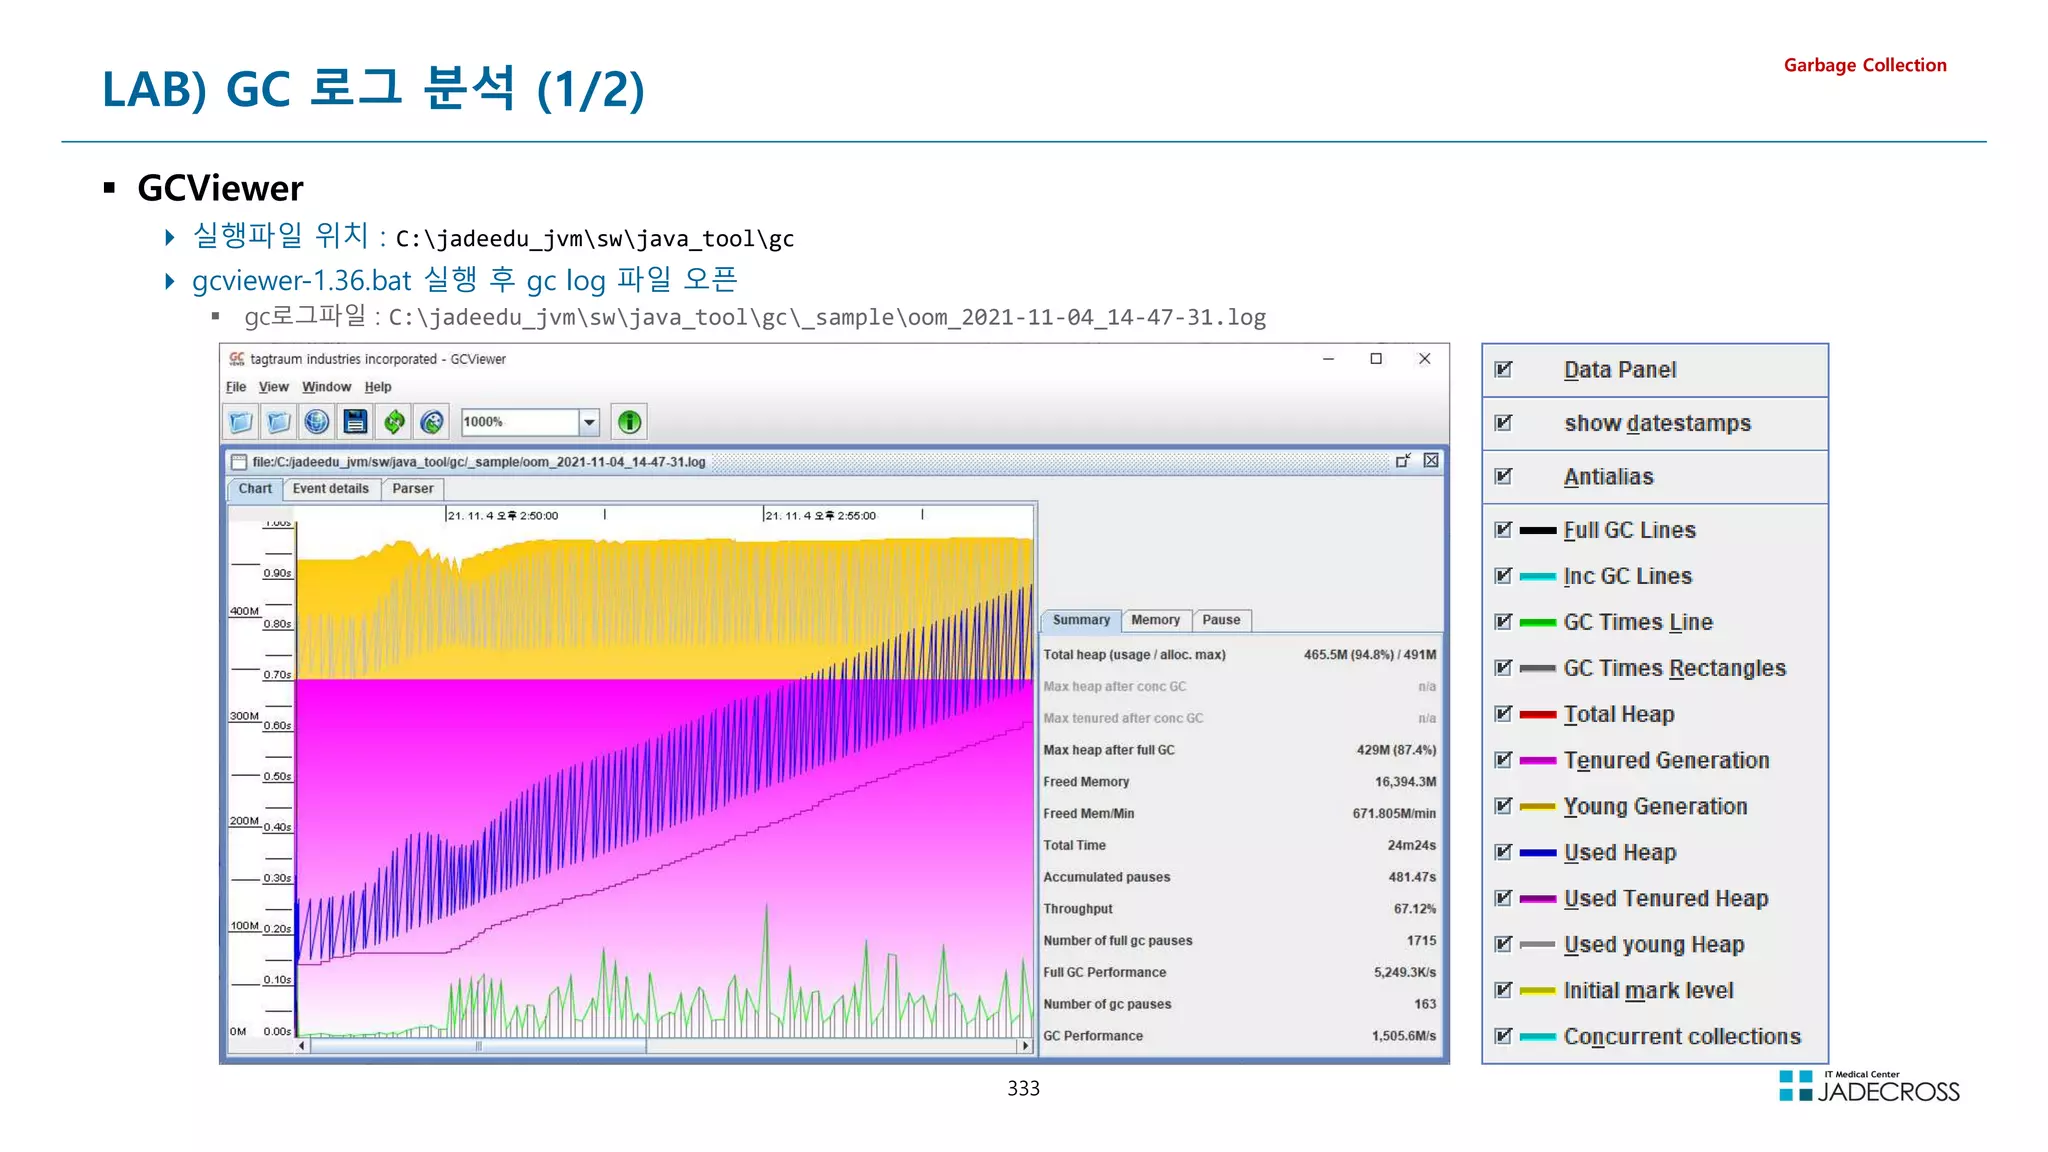
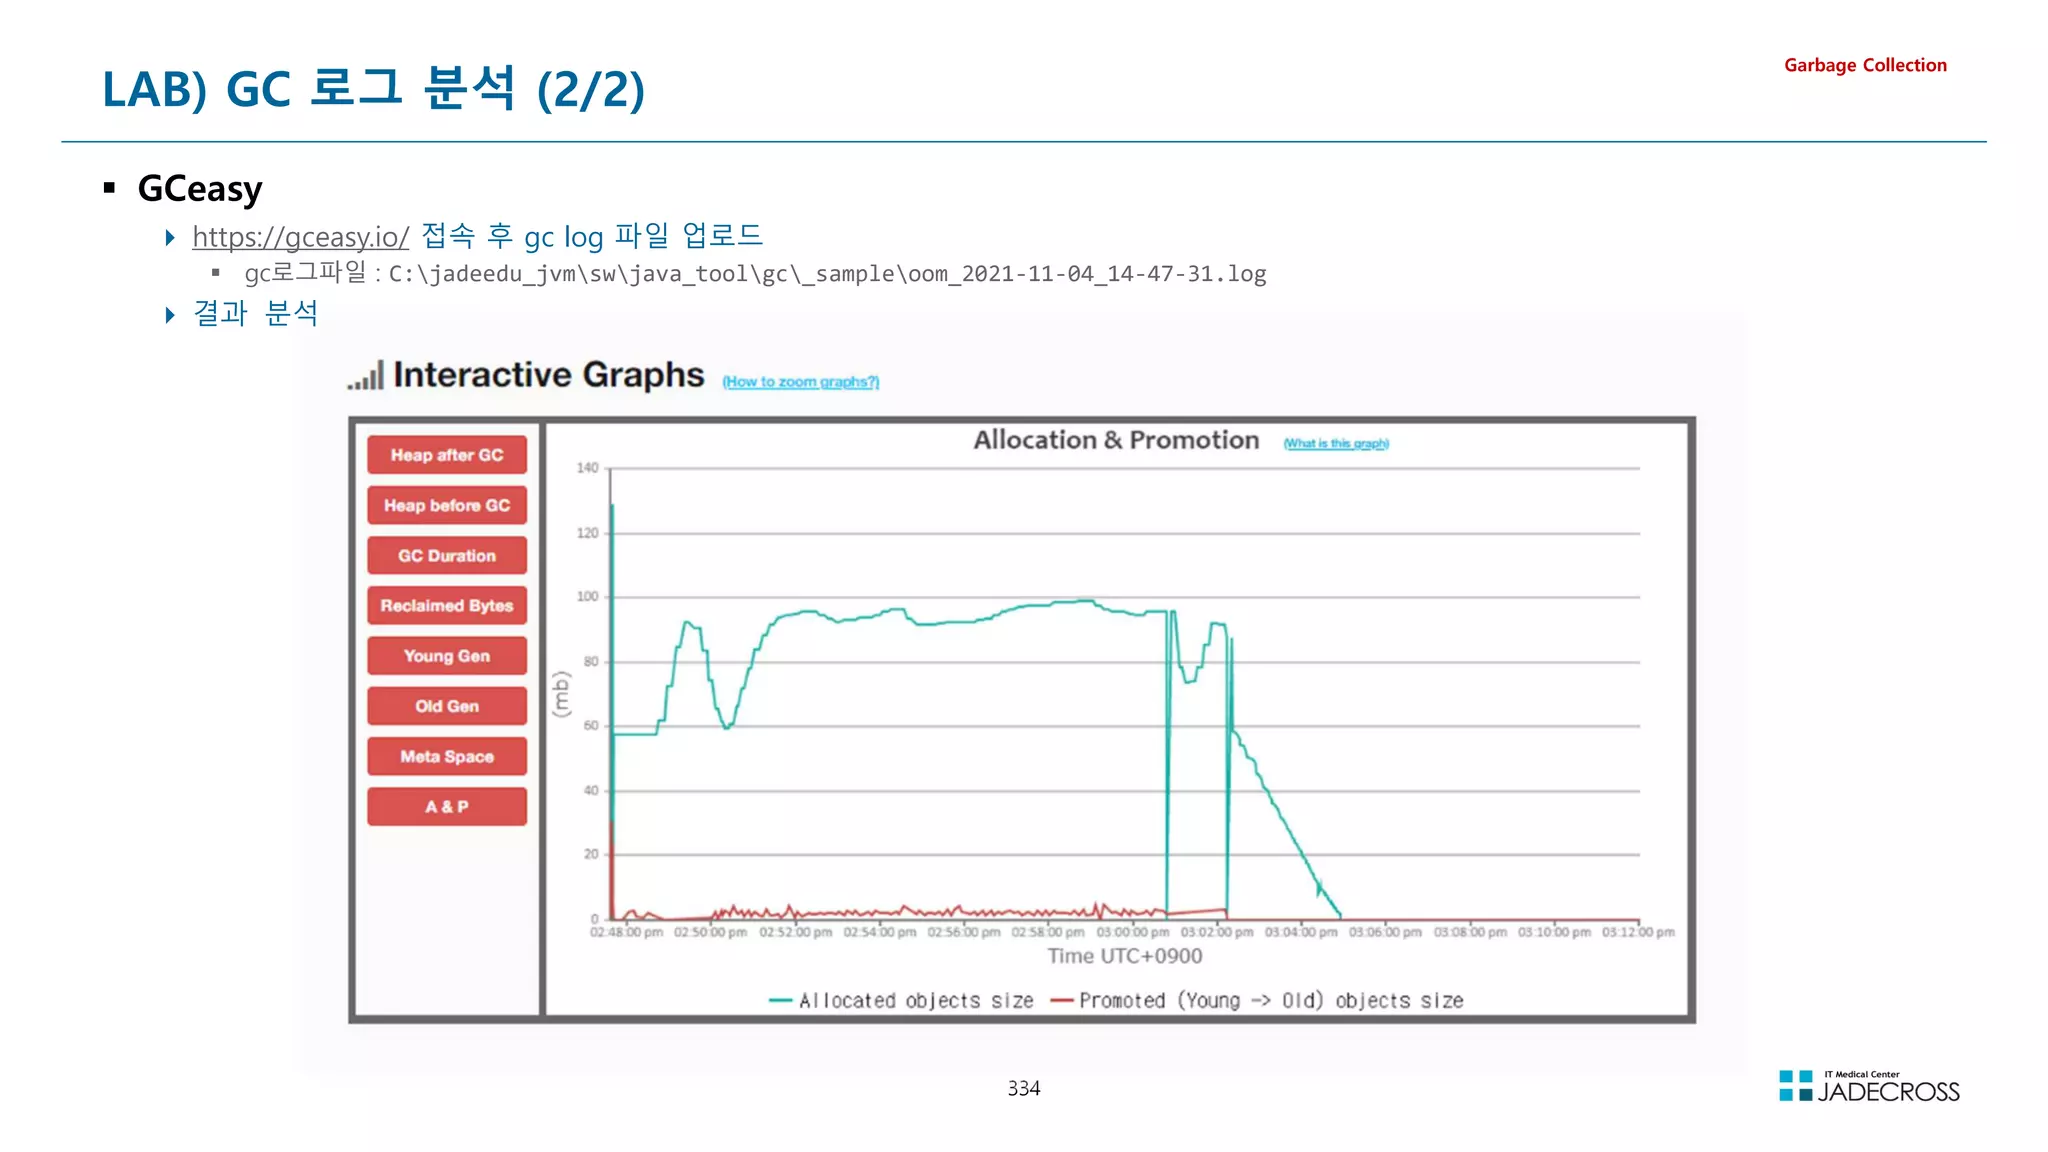


![[Td 2015]녹슨 c++ 코드에 모던 c++로 기름칠하기(옥찬호)](https://cdn.slidesharecdn.com/ss_thumbnails/td2015cc-151104051810-lva1-app6891-thumbnail.jpg?width=640&height=640&fit=bounds)

![[TechDays Korea 2015] 녹슨 C++ 코드에 모던 C++로 기름칠하기](https://cdn.slidesharecdn.com/ss_thumbnails/techdayskorea2015cc-151029112639-lva1-app6891-thumbnail.jpg?width=640&height=640&fit=bounds)


![[170403 2주차]C언어 A반](https://cdn.slidesharecdn.com/ss_thumbnails/170403-2ca-170403032249-thumbnail.jpg?width=640&height=640&fit=bounds)


