Download to read offline

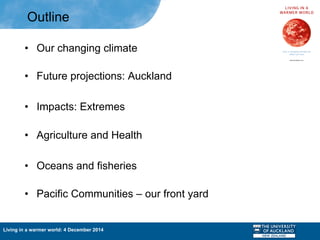
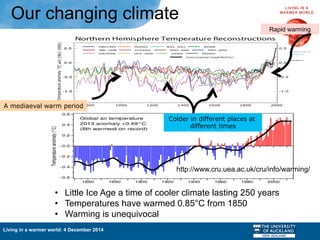

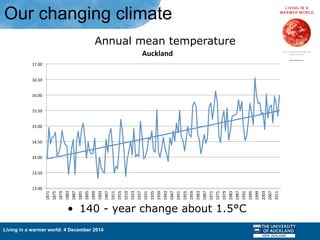
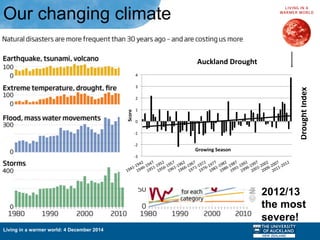
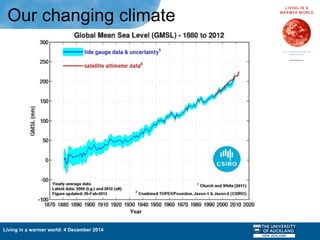
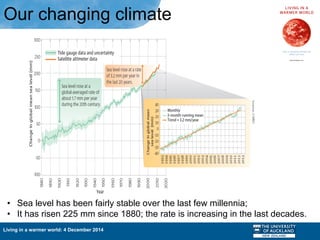
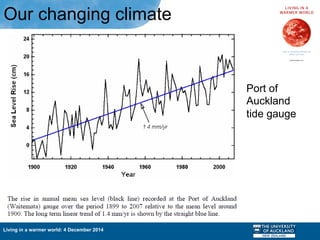
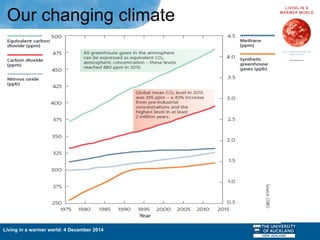
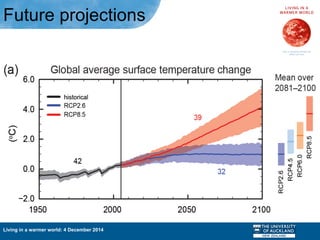
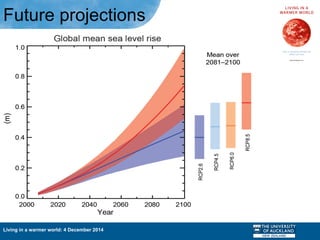
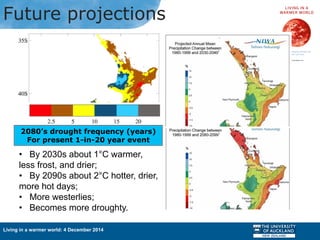
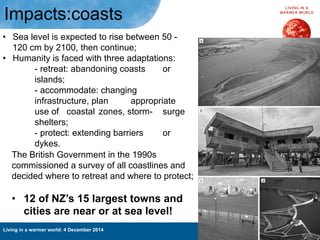
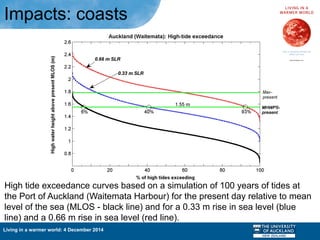
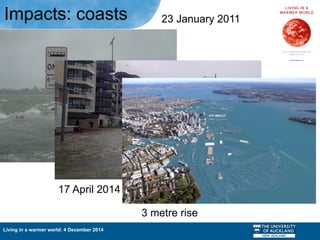
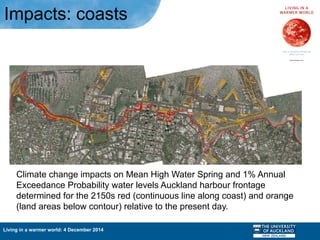
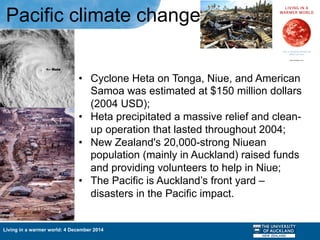
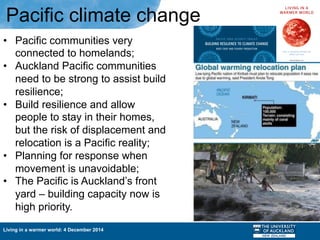
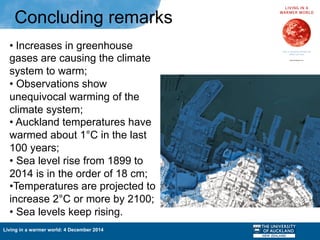

The document summarizes the impacts of climate change on Auckland, New Zealand. It discusses how the climate is changing, with temperatures increasing about 1 degree Celsius over the past 100 years. Future projections estimate temperatures increasing another 2 degrees Celsius or more by 2100. This warming will lead to more extreme weather like droughts and flooding. Coastal areas will also be impacted by rising sea levels estimated at 50-120 centimeters by 2100. Sectors like agriculture, fisheries and health will all be affected by these changes. Pacific island communities will also face threats from climate change like stronger cyclones.


![Climate: Past, Present, Future [Prof John McClatchey]](https://cdn.slidesharecdn.com/ss_thumbnails/uhiclimatechangev2johnmcclatchey-100705044157-phpapp01-thumbnail.jpg?width=640&height=640&fit=bounds)


