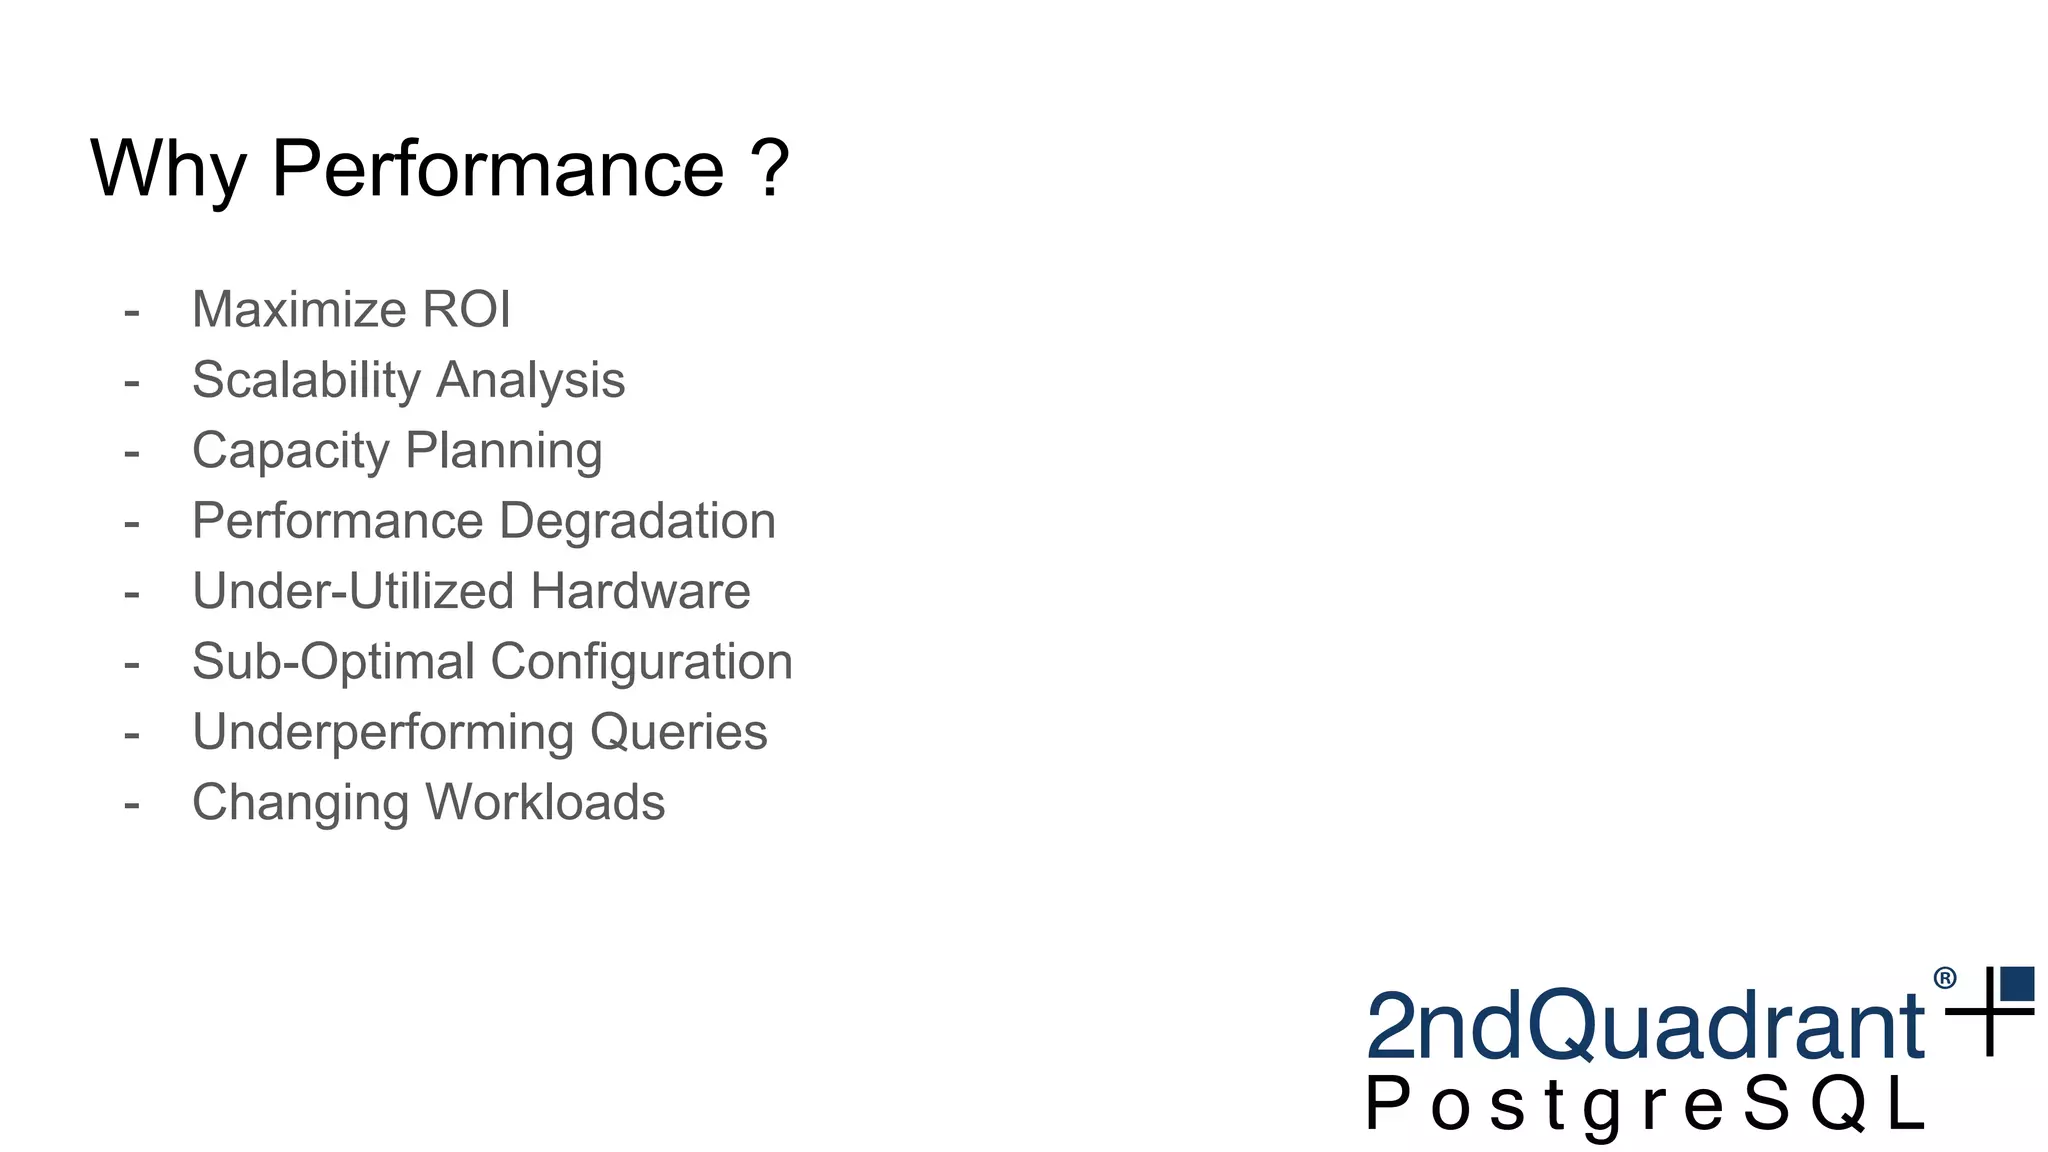
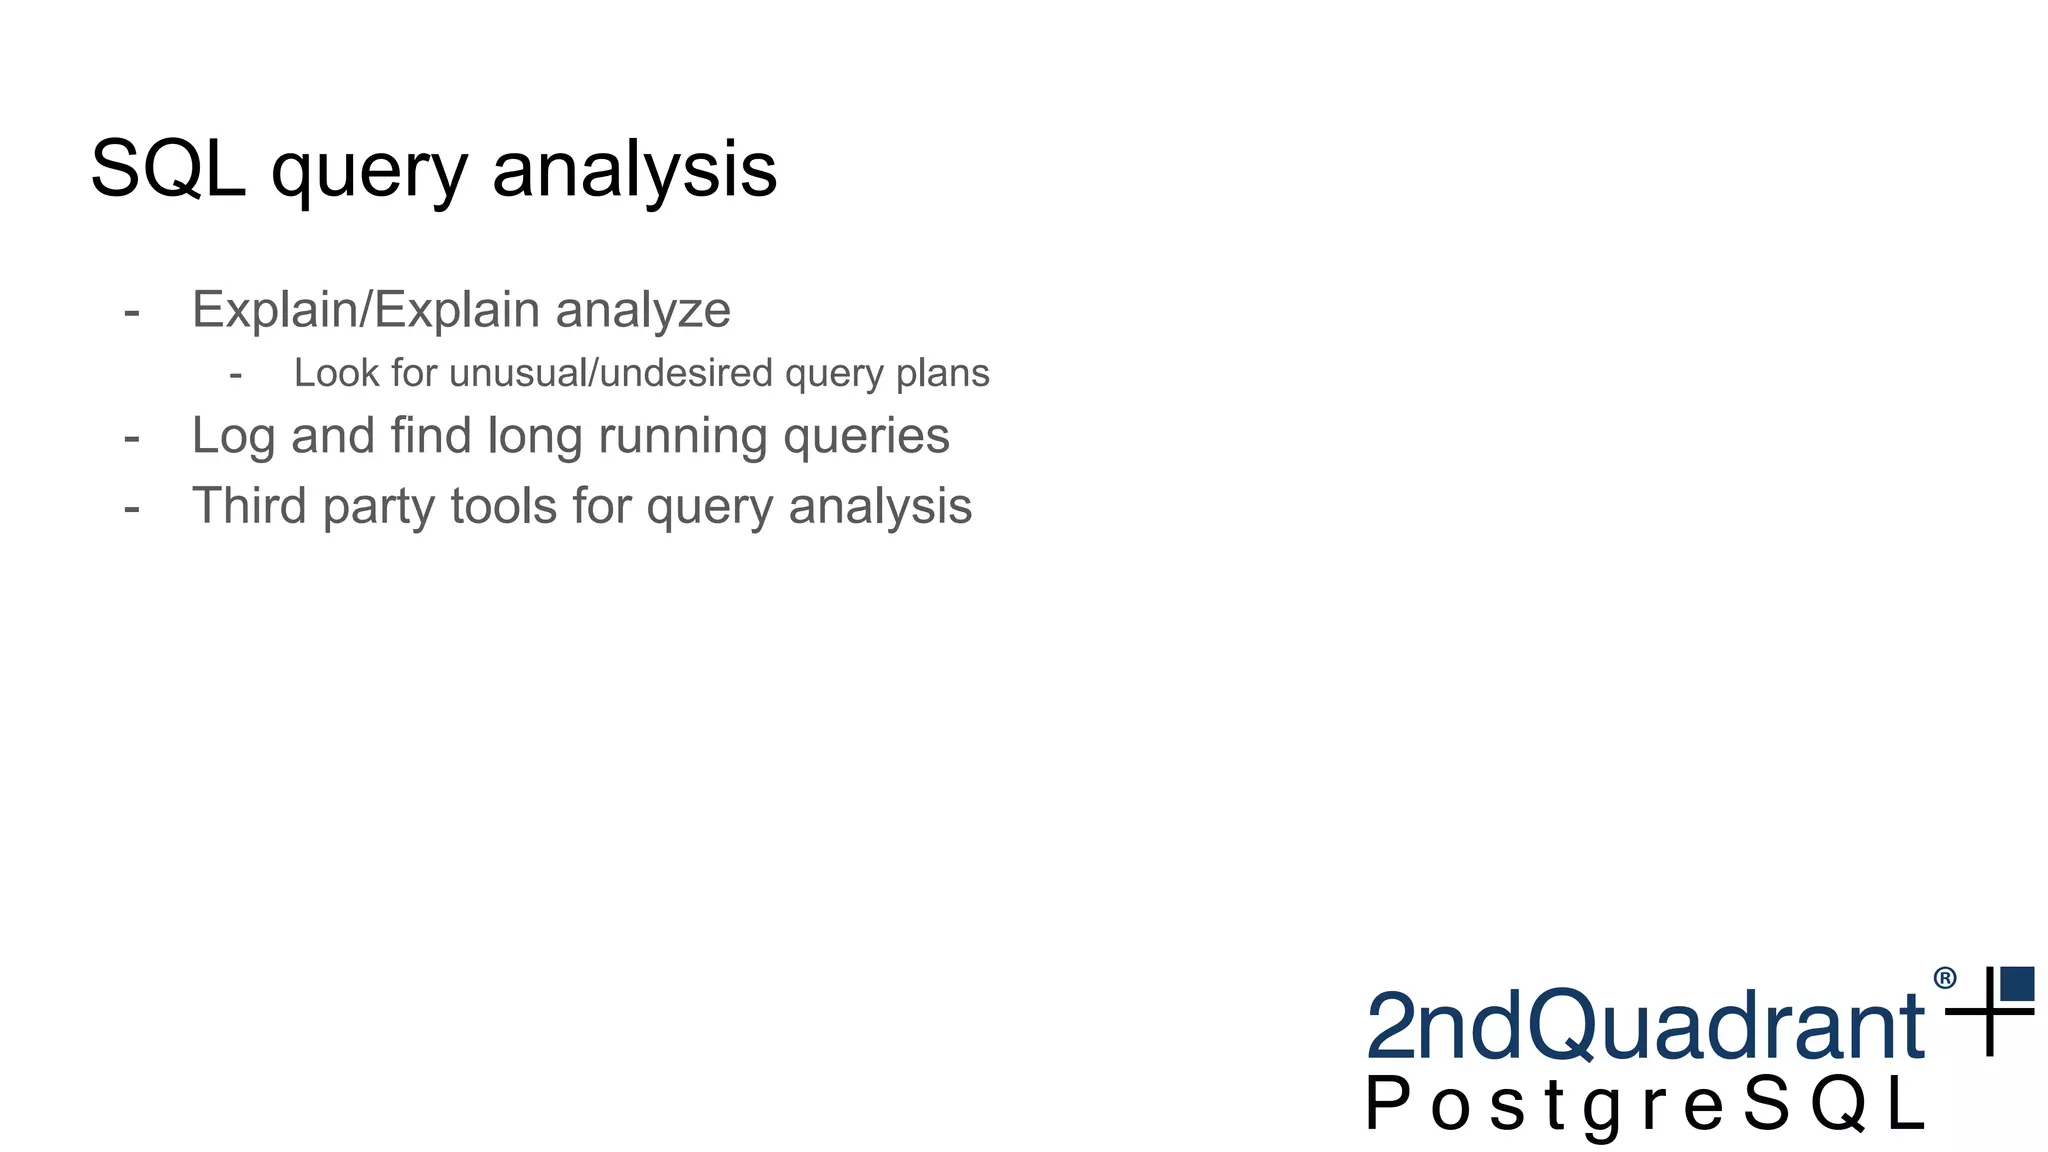
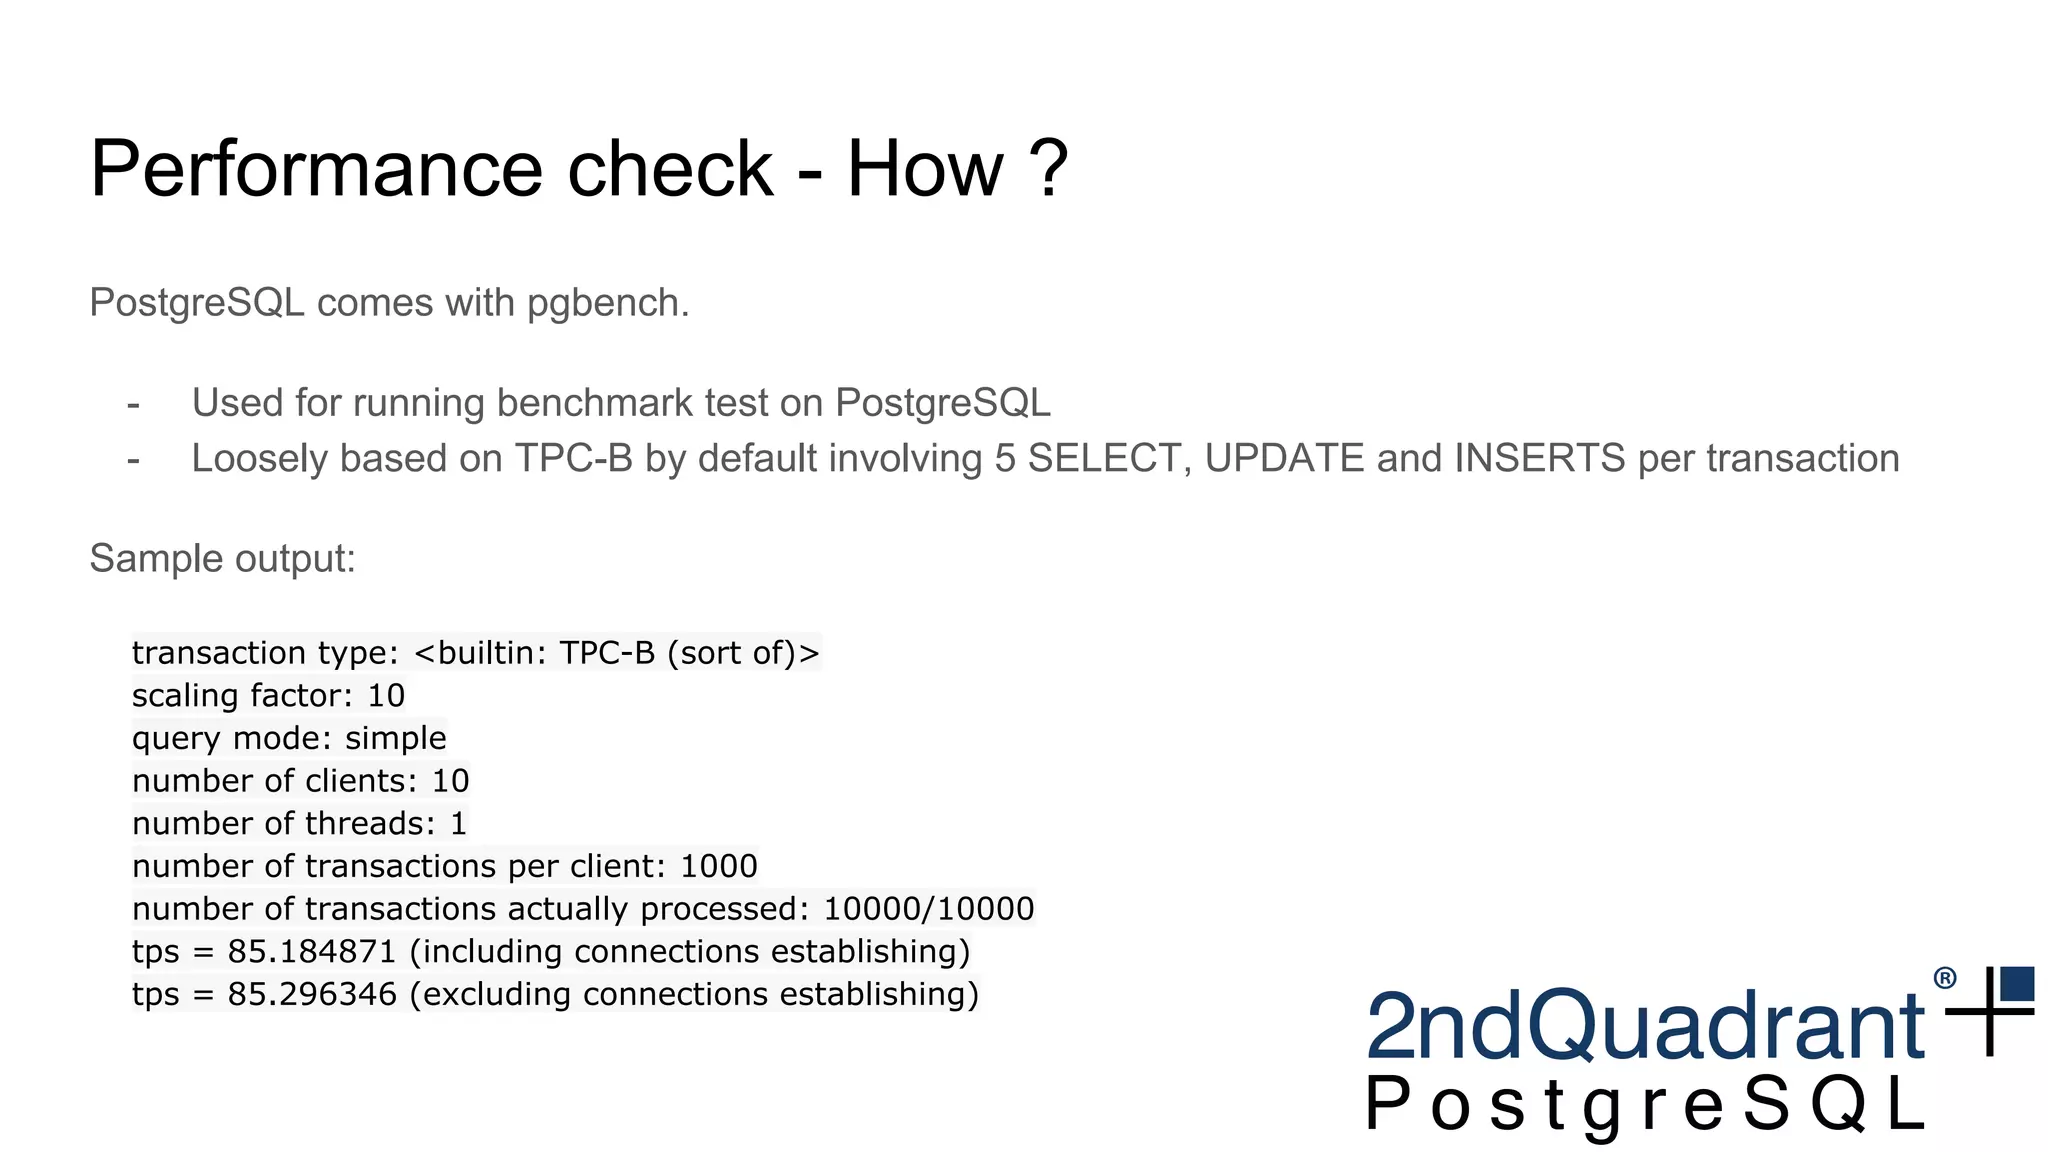
PostgreSQL - Performance
Muhammad Haroon
PUG January 2017, Islamabad
Who am I ??
● Working in PostgreSQL space @ 2ndQuadrant
● Part of PostgreSQL family for more than a decade
● Work in almost all areas of PostgreSQL from development to professional services
● Past stints with PostgreSQL family include
○ EnterpriseDB
○ OpenSCG
● Headed Engineering & IT efforts @ IBEX
● Served as Principal Architect/Product Owner @ TRG
Email: haroon@2ndQuadrant.com
: contact.mharoon@gmail.com
Skype: contact.haroon
Why Performance ?
- Maximize ROI
- Scalability Analysis
- Capacity Planning
- Performance Degradation
- Under-Utilized Hardware
- Sub-Optimal Configuration
- Underperforming Queries
- Changing Workloads
Performance - What’s the deal?
- Application
- Database
- Hardware
Application analysis
- How does the application interact with database ?
- Read intensive ?
- Write intensive ?
- Analytical queries ?
Storage analysis
- Rotational Media VS Solid state
- Direct storage VS network storage
- RAID ?
SQL query analysis
- Explain/Explain analyze
- Look for unusual/undesired query plans
- Log and find long running queries
- Third party tools for query analysis
PostgreSQL architecture (for reference)
Optional PostgreSQL processes
- Autovacuum launcher
- Logger
- Archiver
- Stats collector
- WAL sender/receiver
- Additional background processes for parallel processing (9.6)
PostgreSQL configuration - postgresql.conf
- Generally located inside the data directory
- Configs are in key-value pair format
- Config parameters can be set via command line at startup as well
- Additional config files can be used by ‘include’ directive
Configuration (cont.)
- Database level configs
- User level
- Session level
- Transaction level
Change in some parameters can only be done via command line at startup or postgresql.conf. Some changes might requires a server
reload or restart.
Parameters - Memory
- shared_buffers
- work_mem
- temp_buffer
- maintenance_work_mem
Query planner parameters
- random_page_cost
- seq_page_cost
- effective_cache_size
- enable_(parameter name) directives
Autovacuum
- Automatically vacuums and analyzes tables when vacuum/analyze thresholds
are met.
- autovacuum_* config settings in postgresql.conf
Performance check - How ?
PostgreSQL comes with pgbench.
- Used for running benchmark test on PostgreSQL
- Loosely based on TPC-B by default involving 5 SELECT, UPDATE and INSERTS per transaction
Sample output:
transaction type: <builtin: TPC-B (sort of)>
scaling factor: 10
query mode: simple
number of clients: 10
number of threads: 1
number of transactions per client: 1000
number of transactions actually processed: 10000/10000
tps = 85.184871 (including connections establishing)
tps = 85.296346 (excluding connections establishing)
Monitoring
- Run pgbench often
- Use tools like top, iostat
- Keep an eye on Bloating
- Long running queries
- Number of connections
- Disk
- pg_buffercache
Thank you for your time
Questions ?
● Worried about the health of your databases ?
● Need customized PostgreSQL suited to your
needs?
● Looking for PostgreSQL training ?
● Need help migrating to PostgreSQL ?
● Need PostgreSQL production support ?
● Got specific PostgreSQL needs ?
● Looking for cloud and/or hybrid high availability
clusters ?
Let us help you!
Email: haroon@2ndQuadrant.com
Skype: contact.haroon

Islamabad PUG - 7th Meetup - performance tuning

  • 1.
    PostgreSQL - Performance MuhammadHaroon PUG January 2017, Islamabad
  • 2.
    Who am I?? ● Working in PostgreSQL space @ 2ndQuadrant ● Part of PostgreSQL family for more than a decade ● Work in almost all areas of PostgreSQL from development to professional services ● Past stints with PostgreSQL family include ○ EnterpriseDB ○ OpenSCG ● Headed Engineering & IT efforts @ IBEX ● Served as Principal Architect/Product Owner @ TRG Email: haroon@2ndQuadrant.com : contact.mharoon@gmail.com Skype: contact.haroon
  • 3.
    Why Performance ? -Maximize ROI - Scalability Analysis - Capacity Planning - Performance Degradation - Under-Utilized Hardware - Sub-Optimal Configuration - Underperforming Queries - Changing Workloads
  • 4.
    Performance - What’sthe deal? - Application - Database - Hardware
  • 5.
    Application analysis - Howdoes the application interact with database ? - Read intensive ? - Write intensive ? - Analytical queries ?
  • 6.
    Storage analysis - RotationalMedia VS Solid state - Direct storage VS network storage - RAID ?
  • 7.
    SQL query analysis -Explain/Explain analyze - Look for unusual/undesired query plans - Log and find long running queries - Third party tools for query analysis
  • 8.
  • 9.
    Optional PostgreSQL processes -Autovacuum launcher - Logger - Archiver - Stats collector - WAL sender/receiver - Additional background processes for parallel processing (9.6)
  • 10.
    PostgreSQL configuration -postgresql.conf - Generally located inside the data directory - Configs are in key-value pair format - Config parameters can be set via command line at startup as well - Additional config files can be used by ‘include’ directive
  • 11.
    Configuration (cont.) - Databaselevel configs - User level - Session level - Transaction level Change in some parameters can only be done via command line at startup or postgresql.conf. Some changes might requires a server reload or restart.
  • 12.
    Parameters - Memory -shared_buffers - work_mem - temp_buffer - maintenance_work_mem
  • 13.
    Query planner parameters -random_page_cost - seq_page_cost - effective_cache_size - enable_(parameter name) directives
  • 14.
    Autovacuum - Automatically vacuumsand analyzes tables when vacuum/analyze thresholds are met. - autovacuum_* config settings in postgresql.conf
  • 15.
    Performance check -How ? PostgreSQL comes with pgbench. - Used for running benchmark test on PostgreSQL - Loosely based on TPC-B by default involving 5 SELECT, UPDATE and INSERTS per transaction Sample output: transaction type: <builtin: TPC-B (sort of)> scaling factor: 10 query mode: simple number of clients: 10 number of threads: 1 number of transactions per client: 1000 number of transactions actually processed: 10000/10000 tps = 85.184871 (including connections establishing) tps = 85.296346 (excluding connections establishing)
  • 16.
    Monitoring - Run pgbenchoften - Use tools like top, iostat - Keep an eye on Bloating - Long running queries - Number of connections - Disk - pg_buffercache
  • 17.
    Thank you foryour time Questions ? ● Worried about the health of your databases ? ● Need customized PostgreSQL suited to your needs? ● Looking for PostgreSQL training ? ● Need help migrating to PostgreSQL ? ● Need PostgreSQL production support ? ● Got specific PostgreSQL needs ? ● Looking for cloud and/or hybrid high availability clusters ? Let us help you! Email: haroon@2ndQuadrant.com Skype: contact.haroon