Computer Vision(CSE5233)
Introduction toImage
& Processing and Image
Prof Jhalak Dutta
Computer Science &Engineering Dept.
Heritage Institute of Technology, Kolkata(HITK)
2.
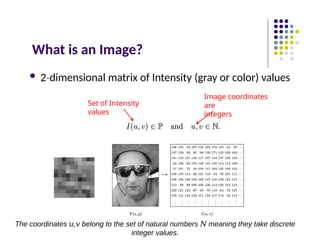
What is anImage?
Set of Intensity
values
2 dimensional
‐ matrix of Intensity (gray or color) values
Image coordinates
are
integers
The coordinates , belong to the set of natural numbers meaning they take discrete
𝑢 𝑣 𝑁
integer values.
3.
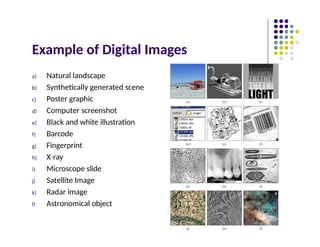
Example of DigitalImages
a) Natural landscape
b) Synthetically generated scene
c) Poster graphic
d) Computer screenshot
e) Black and white illustration
f) Barcode
g) Fingerprint
h) X ray
‐
i) Microscope slide
j) Satellite Image
k) Radar image
l) Astronomical object
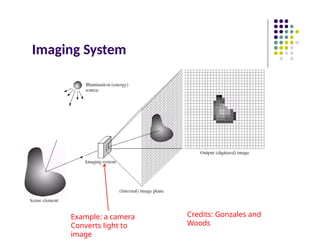
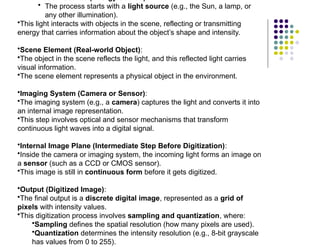
Illumination Source (EnergySource):
• The process starts with a light source (e.g., the Sun, a lamp, or
any other illumination).
•This light interacts with objects in the scene, reflecting or transmitting
energy that carries information about the object’s shape and intensity.
•Scene Element (Real-world Object):
•The object in the scene reflects the light, and this reflected light carries
visual information.
•The scene element represents a physical object in the environment.
•Imaging System (Camera or Sensor):
•The imaging system (e.g., a camera) captures the light and converts it into
an internal image representation.
•This step involves optical and sensor mechanisms that transform
continuous light waves into a digital signal.
•Internal Image Plane (Intermediate Step Before Digitization):
•Inside the camera or imaging system, the incoming light forms an image on
a sensor (such as a CCD or CMOS sensor).
•This image is still in continuous form before it gets digitized.
•Output (Digitized Image):
•The final output is a discrete digital image, represented as a grid of
pixels with intensity values.
•This digitization process involves sampling and quantization, where:
•Sampling defines the spatial resolution (how many pixels are used).
•Quantization determines the intensity resolution (e.g., 8-bit grayscale
has values from 0 to 255).
6.
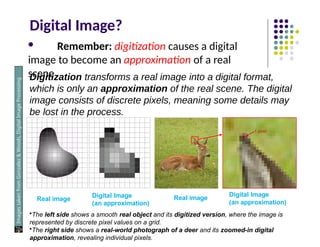
Digital Image?
Remember:digitization causes a digital
image to become an approximation of a real
scene
1 pixel
Images
taken
from
Gonzalez
&
Woods,
Digital
Image
Processing
(2002)
Real image
Digital Image
(an approximation)
Real image
Digital Image
(an approximation)
Digitization transforms a real image into a digital format,
which is only an approximation of the real scene. The digital
image consists of discrete pixels, meaning some details may
be lost in the process.
•The left side shows a smooth real object and its digitized version, where the image is
represented by discrete pixel values on a grid.
•The right side shows a real-world photograph of a deer and its zoomed-in digital
approximation, revealing individual pixels.
7.
Digital Image
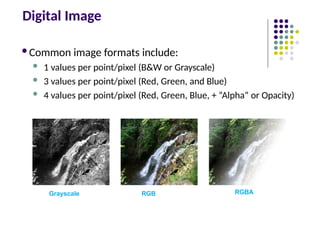
Common imageformats include:
1 values per point/pixel (B&W or Grayscale)
3 values per point/pixel (Red, Green, and Blue)
4 values per point/pixel (Red, Green, Blue, + “Alpha” or Opacity)
Grayscale RGB RGBA
8.
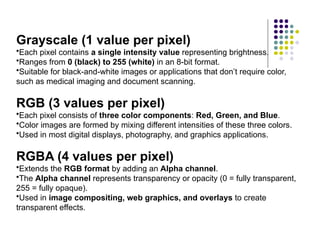
Grayscale (1 valueper pixel)
•Each pixel contains a single intensity value representing brightness.
•Ranges from 0 (black) to 255 (white) in an 8-bit format.
•Suitable for black-and-white images or applications that don’t require color,
such as medical imaging and document scanning.
RGB (3 values per pixel)
•Each pixel consists of three color components: Red, Green, and Blue.
•Color images are formed by mixing different intensities of these three colors.
•Used in most digital displays, photography, and graphics applications.
RGBA (4 values per pixel)
•Extends the RGB format by adding an Alpha channel.
•The Alpha channel represents transparency or opacity (0 = fully transparent,
255 = fully opaque).
•Used in image compositing, web graphics, and overlays to create
transparent effects.
9.
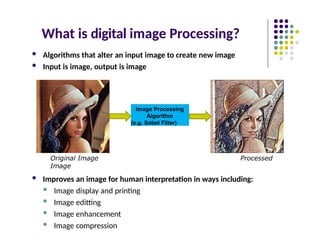
What is digitalimage Processing?
Algorithms that alter an input image to create new image
Input is image, output is image
Original Image Processed
Image
Improves an image for human interpretation in ways including:
Image display and printing
Image editting
Image enhancement
Image compression
Image Processing
Algorithm
(e.g. Sobel Filter)
10.
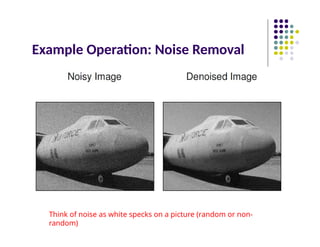
Example Operation: NoiseRemoval
Think of noise as white specks on a picture (random or non-
random)
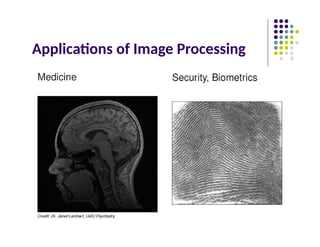
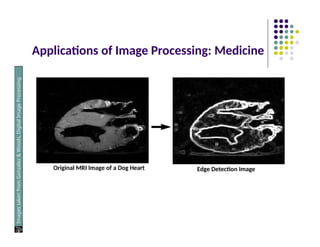
Applications of ImageProcessing: Medicine
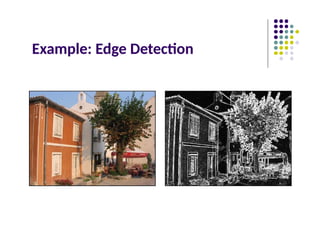
Original MRI Image of a Dog Heart Edge Detection Image
Images
taken
from
Gonzalez
&
Woods,
Digital
Image
Processing
(2002)
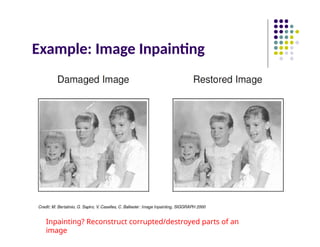
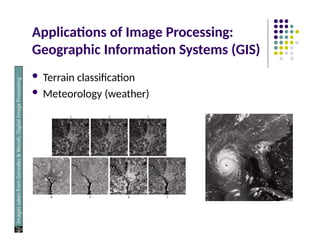
Applications of ImageProcessing:
Geographic Information Systems (GIS)
Terrain classification
Meteorology (weather)
Images
taken
from
Gonzalez
&
Woods,
Digital
Image
Processing
(2002)
21.
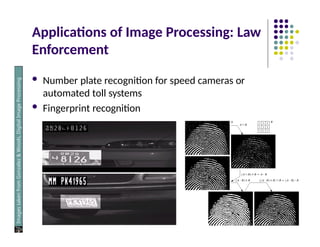
Applications of ImageProcessing: Law
Enforcement
Number plate recognition for speed cameras or
automated toll systems
Fingerprint recognition
Images
taken
from
Gonzalez
&
Woods,
Digital
Image
Processing
(2002)
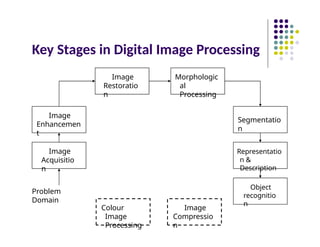
Key Stages inDigital Image Processing
Image
Acquisitio
n
Image
Restoratio
n
Morphologic
al
Processing
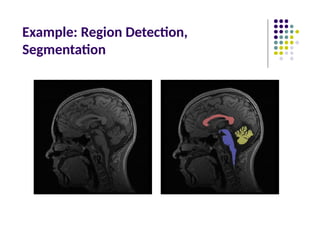
Segmentatio
n
Object
recognitio
n
Image
Enhancemen
t
Representatio
n &
Description
Problem
Domain
Colour
Image
Processing
Image
Compressio
n
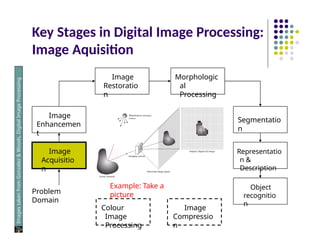
25.
Key Stages inDigital Image Processing:
Image Aquisition
Image
Acquisitio
n
Image
Restoratio
n
Morphologic
al
Processing
Segmentatio
n
Object
recognitio
n
Image
Enhancemen
t
Representatio
n &
Description
Problem
Domain
Colour
Image
Processing
Image
Compressio
n
Images
taken
from
Gonzalez
&
Woods,
Digital
Image
Processing
(2002)
Example: Take a
picture
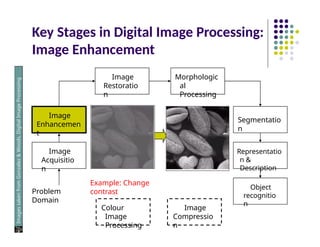
26.
Key Stages inDigital Image Processing:
Image Enhancement
Image
Acquisitio
n
Image
Restoratio
n
Morphologic
al
Processing
Segmentatio
n
Object
recognitio
n
Image
Enhancemen
t
Representatio
n &
Description
Problem
Domain
Colour
Image
Processing
Image
Compressio
n
Images
taken
from
Gonzalez
&
Woods,
Digital
Image
Processing
(2002)
Example: Change
contrast
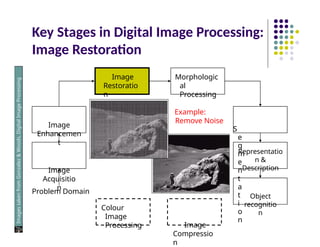
27.
Key Stages inDigital Image Processing:
Image Restoration
Image
Restoratio
n
Image
Enhancemen
t
Image
Acquisitio
n
Problem Domain
Colour
Image
Processing
Representatio
n &
Description
Object
recognitio
n
Image
Compressio
n
Morphologic
al
Processing
Example:
Remove Noise
S
e
g
m
e
n
t
a
t
i
o
n
Images
taken
from
Gonzalez
&
Woods,
Digital
Image
Processing
(2002)
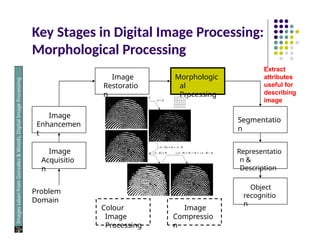
28.
Key Stages inDigital Image Processing:
Morphological Processing
Image
Acquisitio
n
Image
Restoratio
n
Morphologic
al
Processing
Segmentatio
n
Object
recognitio
n
Image
Enhancemen
t
Representatio
n &
Description
Problem
Domain
Colour
Image
Processing
Image
Compressio
n
Images
taken
from
Gonzalez
&
Woods,
Digital
Image
Processing
(2002)
Extract
attributes
useful for
describing
image
29.
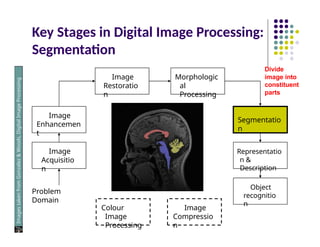
Key Stages inDigital Image Processing:
Segmentation
Image
Acquisitio
n
Image
Restoratio
n
Morphologic
al
Processing
Segmentatio
n
Object
recognitio
n
Image
Enhancemen
t
Representatio
n &
Description
Problem
Domain
Colour
Image
Processing
Image
Compressio
n
Images
taken
from
Gonzalez
&
Woods,
Digital
Image
Processing
(2002)
Divide
image into
constituent
parts
30.
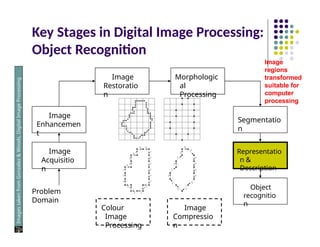
Key Stages inDigital Image Processing:
Object Recognition
Image
Acquisitio
n
Image
Restoratio
n
Morphologic
al
Processing
Segmentatio
n
Object
recognitio
n
Image
Enhancemen
t
Representatio
n &
Description
Problem
Domain
Colour
Image
Processing
Image
Compressio
n
Images
taken
from
Gonzalez
&
Woods,
Digital
Image
Processing
(2002)
Image
regions
transformed
suitable for
computer
processing
31.
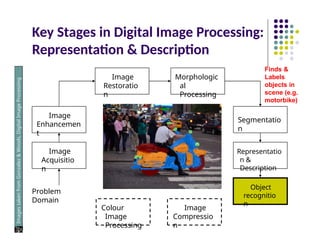
Key Stages inDigital Image Processing:
Representation & Description
Image
Acquisitio
n
Image
Restoratio
n
Morphologic
al
Processing
Segmentatio
n
Object
recognitio
n
Image
Enhancemen
t
Representatio
n &
Description
Problem
Domain
Colour
Image
Processing
Image
Compressio
n
Images
taken
from
Gonzalez
&
Woods,
Digital
Image
Processing
(2002)
Finds &
Labels
objects in
scene (e.g.
motorbike)
32.
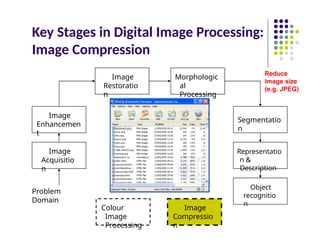
Key Stages inDigital Image Processing:
Image Compression
Image
Acquisitio
n
Image
Restoratio
n
Morphologic
al
Processing
Segmentatio
n
Object
recognitio
n
Image
Enhancemen
t
Representatio
n &
Description
Problem
Domain
Colour
Image
Processing
Image
Compressio
n
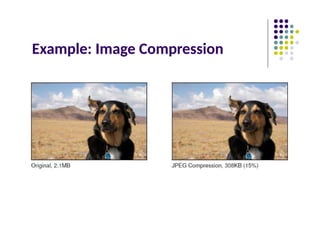
Reduce
image size
(e.g. JPEG)
33.
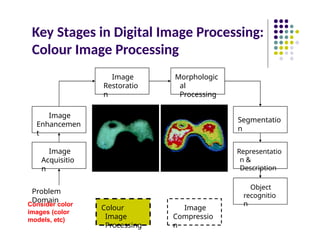
Key Stages inDigital Image Processing:
Colour Image Processing
Image
Acquisitio
n
Image
Restoratio
n
Morphologic
al
Processing
Segmentatio
n
Object
recognitio
n
Image
Enhancemen
t
Representatio
n &
Description
Problem
Domain
Colour
Image
Processing
Image
Compressio
n
Consider color
images (color
models, etc)
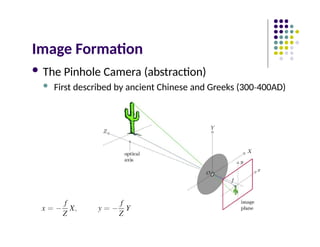
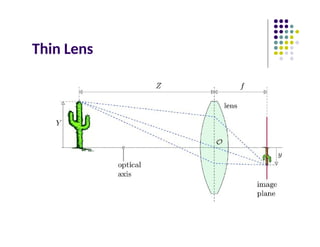
34.
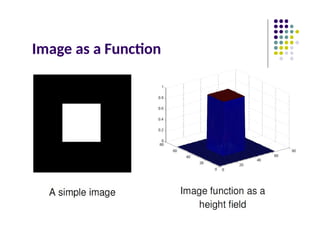
Image Formation
ThePinhole Camera (abstraction)
First described by ancient Chinese and Greeks (300 400AD)
‐
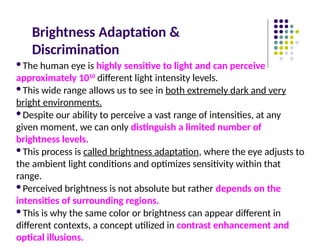
Brightness Adaptation &
Discrimination
Thehuman eye is highly sensitive to light and can perceive
approximately 1010
different light intensity levels.
This wide range allows us to see in both extremely dark and very
bright environments.
Despite our ability to perceive a vast range of intensities, at any
given moment, we can only distinguish a limited number of
brightness levels.
This process is called brightness adaptation, where the eye adjusts to
the ambient light conditions and optimizes sensitivity within that
range.
Perceived brightness is not absolute but rather depends on the
intensities of surrounding regions.
This is why the same color or brightness can appear different in
different contexts, a concept utilized in contrast enhancement and
optical illusions.
37.
Brightness Adaptation &
Discrimination:Mach Band Effect
Images
taken
from
Gonzalez
&
Woods,
Digital
Image
Processing
(2002)
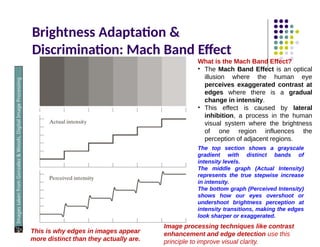
What is the Mach Band Effect?
• The Mach Band Effect is an optical
illusion where the human eye
perceives exaggerated contrast at
edges where there is a gradual
change in intensity.
• This effect is caused by lateral
inhibition, a process in the human
visual system where the brightness
of one region influences the
perception of adjacent regions.
The top section shows a grayscale
gradient with distinct bands of
intensity levels.
The middle graph (Actual Intensity)
represents the true stepwise increase
in intensity.
The bottom graph (Perceived Intensity)
shows how our eyes overshoot or
undershoot brightness perception at
intensity transitions, making the edges
look sharper or exaggerated.
This is why edges in images appear
more distinct than they actually are.
Image processing techniques like contrast
enhancement and edge detection use this
principle to improve visual clarity.
38.
Brightness Adaptation &Discrimination
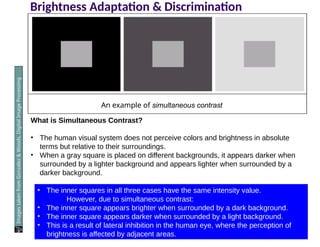
An example of simultaneous contrast
Images
taken
from
Gonzalez
&
Woods,
Digital
Image
Processing
(2002)
What is Simultaneous Contrast?
• The human visual system does not perceive colors and brightness in absolute
terms but relative to their surroundings.
• When a gray square is placed on different backgrounds, it appears darker when
surrounded by a lighter background and appears lighter when surrounded by a
darker background.
• The inner squares in all three cases have the same intensity value.
However, due to simultaneous contrast:
• The inner square appears brighter when surrounded by a dark background.
• The inner square appears darker when surrounded by a light background.
• This is a result of lateral inhibition in the human eye, where the perception of
brightness is affected by adjacent areas.
39.
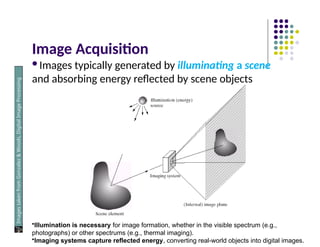
Image Acquisition
Images typicallygenerated by illuminating a scene
and absorbing energy reflected by scene objects
Images
taken
from
Gonzalez
&
Woods,
Digital
Image
Processing
(2002)
•Illumination is necessary for image formation, whether in the visible spectrum (e.g.,
photographs) or other spectrums (e.g., thermal imaging).
•Imaging systems capture reflected energy, converting real-world objects into digital images.
40.
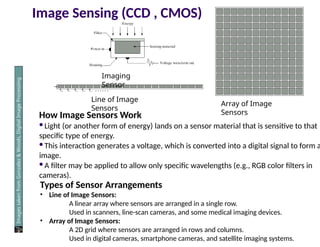
Image Sensing (CCD, CMOS)
Imaging
Sensor
Line of Image
Sensors
Array of Image
Sensors
Images
taken
from
Gonzalez
&
Woods,
Digital
Image
Processing
(2002)
How Image Sensors Work
Light (or another form of energy) lands on a sensor material that is sensitive to that
specific type of energy.
This interaction generates a voltage, which is converted into a digital signal to form a
image.
A filter may be applied to allow only specific wavelengths (e.g., RGB color filters in
cameras).
Types of Sensor Arrangements
• Line of Image Sensors:
A linear array where sensors are arranged in a single row.
Used in scanners, line-scan cameras, and some medical imaging devices.
• Array of Image Sensors:
A 2D grid where sensors are arranged in rows and columns.
Used in digital cameras, smartphone cameras, and satellite imaging systems.
41.
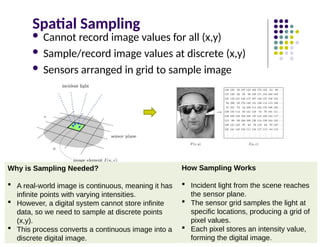
Spatial Sampling
Cannotrecord image values for all (x,y)
Sample/record image values at discrete (x,y)
Sensors arranged in grid to sample image
Why is Sampling Needed?
A real-world image is continuous, meaning it has
infinite points with varying intensities.
However, a digital system cannot store infinite
data, so we need to sample at discrete points
(x,y).
This process converts a continuous image into a
discrete digital image.
How Sampling Works
Incident light from the scene reaches
the sensor plane.
The sensor grid samples the light at
specific locations, producing a grid of
pixel values.
Each pixel stores an intensity value,
forming the digital image.
42.
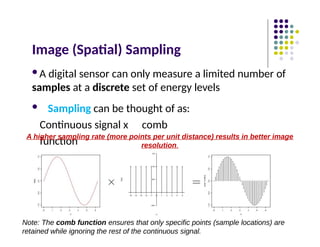
Image (Spatial) Sampling
Adigital sensor can only measure a limited number of
samples at a discrete set of energy levels
Sampling can be thought of as:
Continuous signal x comb
function
A higher sampling rate (more points per unit distance) results in better image
resolution.
Note: The comb function ensures that only specific points (sample locations) are
retained while ignoring the rest of the continuous signal.
43.
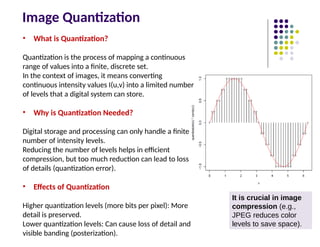
Image Quantization
• Whatis Quantization?
Quantization is the process of mapping a continuous
range of values into a finite, discrete set.
In the context of images, it means converting
continuous intensity values I(u,v) into a limited number
of levels that a digital system can store.
• Why is Quantization Needed?
Digital storage and processing can only handle a finite
number of intensity levels.
Reducing the number of levels helps in efficient
compression, but too much reduction can lead to loss
of details (quantization error).
• Effects of Quantization
Higher quantization levels (more bits per pixel): More
detail is preserved.
Lower quantization levels: Can cause loss of detail and
visible banding (posterization).
It is crucial in image
compression (e.g.,
JPEG reduces color
levels to save space).
44.
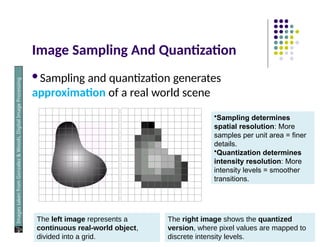
Image Sampling AndQuantization
Sampling and quantization generates
approximation of a real world scene
Images
taken
from
Gonzalez
&
Woods,
Digital
Image
Processing
(2002)
The left image represents a
continuous real-world object,
divided into a grid.
The right image shows the quantized
version, where pixel values are mapped to
discrete intensity levels.
•Sampling determines
spatial resolution: More
samples per unit area = finer
details.
•Quantization determines
intensity resolution: More
intensity levels = smoother
transitions.
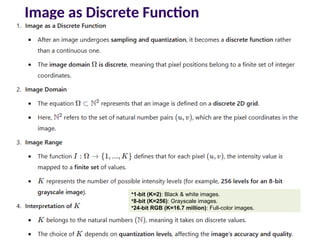
45.
Image as DiscreteFunction
•1-bit (K=2): Black & white images.
•8-bit (K=256): Grayscale images.
•24-bit RGB (K=16.7 million): Full-color images.
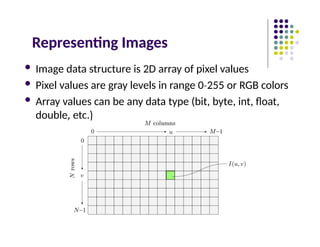
Representing Images
Imagedata structure is 2D array of pixel values
Pixel values are gray levels in range 0 255
‐ or RGB colors
Array values can be any data type (bit, byte, int, float,
double, etc.)
48.
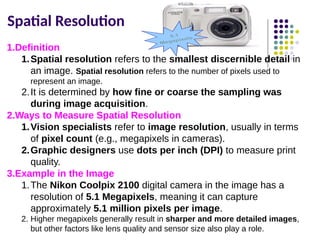
Spatial Resolution
1.Definition
1.Spatial resolutionrefers to the smallest discernible detail in
an image. Spatial resolution refers to the number of pixels used to
represent an image.
2.It is determined by how fine or coarse the sampling was
during image acquisition.
2.Ways to Measure Spatial Resolution
1.Vision specialists refer to image resolution, usually in terms
of pixel count (e.g., megapixels in cameras).
2.Graphic designers use dots per inch (DPI) to measure print
quality.
3.Example in the Image
1.The Nikon Coolpix 2100 digital camera in the image has a
resolution of 5.1 Megapixels, meaning it can capture
approximately 5.1 million pixels per image.
2. Higher megapixels generally result in sharper and more detailed images,
but other factors like lens quality and sensor size also play a role.
49.
Spatial Resolution
Images
taken
from
Gonzalez
&
Woods,
Digital
Image
Processing
(2002)
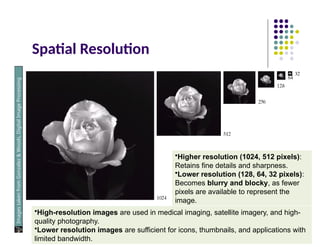
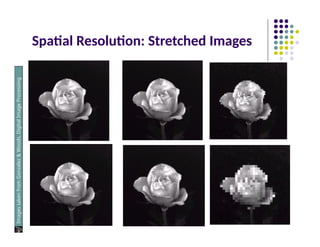
•Higher resolution(1024, 512 pixels):
Retains fine details and sharpness.
•Lower resolution (128, 64, 32 pixels):
Becomes blurry and blocky, as fewer
pixels are available to represent the
image.
•High-resolution images are used in medical imaging, satellite imagery, and high-
quality photography.
•Lower resolution images are sufficient for icons, thumbnails, and applications with
limited bandwidth.
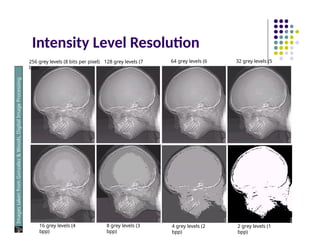
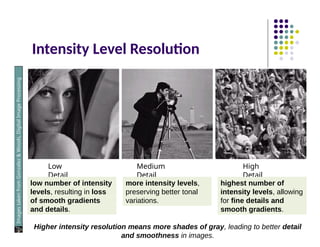
What is IntensityLevel Resolution?
• It represents how many different shades of
intensity an image can have.
• A higher intensity resolution allows for more
precise representation of details in an image.
• Intensity levels are determined by the number of
bits used to store each pixel.
Number of Bits
Number of Intensity
Levels
Examples
1 2 0, 1
2 4 00, 01, 10, 11
4 16 0000, 0101, 1111
8 256 00110011, 01010101
16 65,536 1010101010101010
•More bits per pixel = Higher intensity resolution = Better image quality.
•8-bit grayscale (256 levels) is standard for many imaging applications.
•Higher bit-depths (e.g., 16-bit, 24-bit) are used in medical imaging, photography, and
HDR imaging for better precision.
Saturation & Noise
Images
taken
from
Gonzalez
&
Woods,
Digital
Image
Processing
(2002)
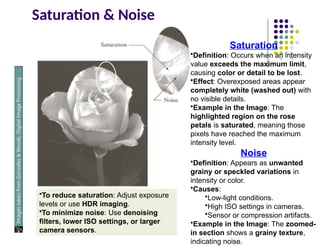
Saturation
•Definition:Occurs when an intensity
value exceeds the maximum limit,
causing color or detail to be lost.
•Effect: Overexposed areas appear
completely white (washed out) with
no visible details.
•Example in the Image: The
highlighted region on the rose
petals is saturated, meaning those
pixels have reached the maximum
intensity level.
Noise
•Definition: Appears as unwanted
grainy or speckled variations in
intensity or color.
•Causes:
•Low-light conditions.
•High ISO settings in cameras.
•Sensor or compression artifacts.
•Example in the Image: The zoomed-
in section shows a grainy texture,
indicating noise.
•To reduce saturation: Adjust exposure
levels or use HDR imaging.
•To minimize noise: Use denoising
filters, lower ISO settings, or larger
camera sensors.
54.
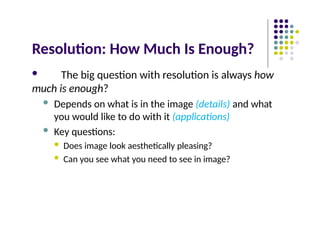
Resolution: How MuchIs Enough?
The big question with resolution is always how
much is enough?
Depends on what is in the image (details) and what
you would like to do with it (applications)
Key questions:
Does image look aesthetically pleasing?
Can you see what you need to see in image?
55.
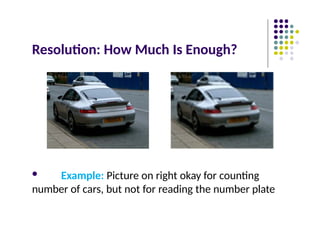
Resolution: How MuchIs Enough?
Example: Picture on right okay for counting
number of cars, but not for reading the number plate
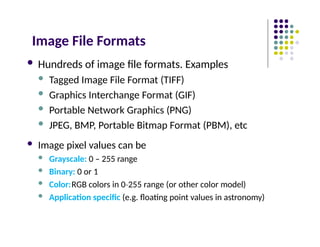
Image File Formats
Hundreds of image file formats. Examples
Tagged Image File Format (TIFF)
Graphics Interchange Format (GIF)
Portable Network Graphics (PNG)
JPEG, BMP, Portable Bitmap Format (PBM), etc
Image pixel values can be
Grayscale: 0 – 255 range
Binary: 0 or 1
Color:RGB colors in 0 255
‐ range (or other color model)
Application specific (e.g. floating point values in astronomy)