Download as PDF, PPTX


This document provides an overview of business analytics. It begins with defining key terms like data, databases, and the DIKW pyramid. It then discusses what business analytics is, the steps involved, and examples of its history. Different types of business analytics models are described, as well as the components and benefits. Various analysis tools like MOST and PESTLE are explained. Finally, emerging trends in business analytics are highlighted.
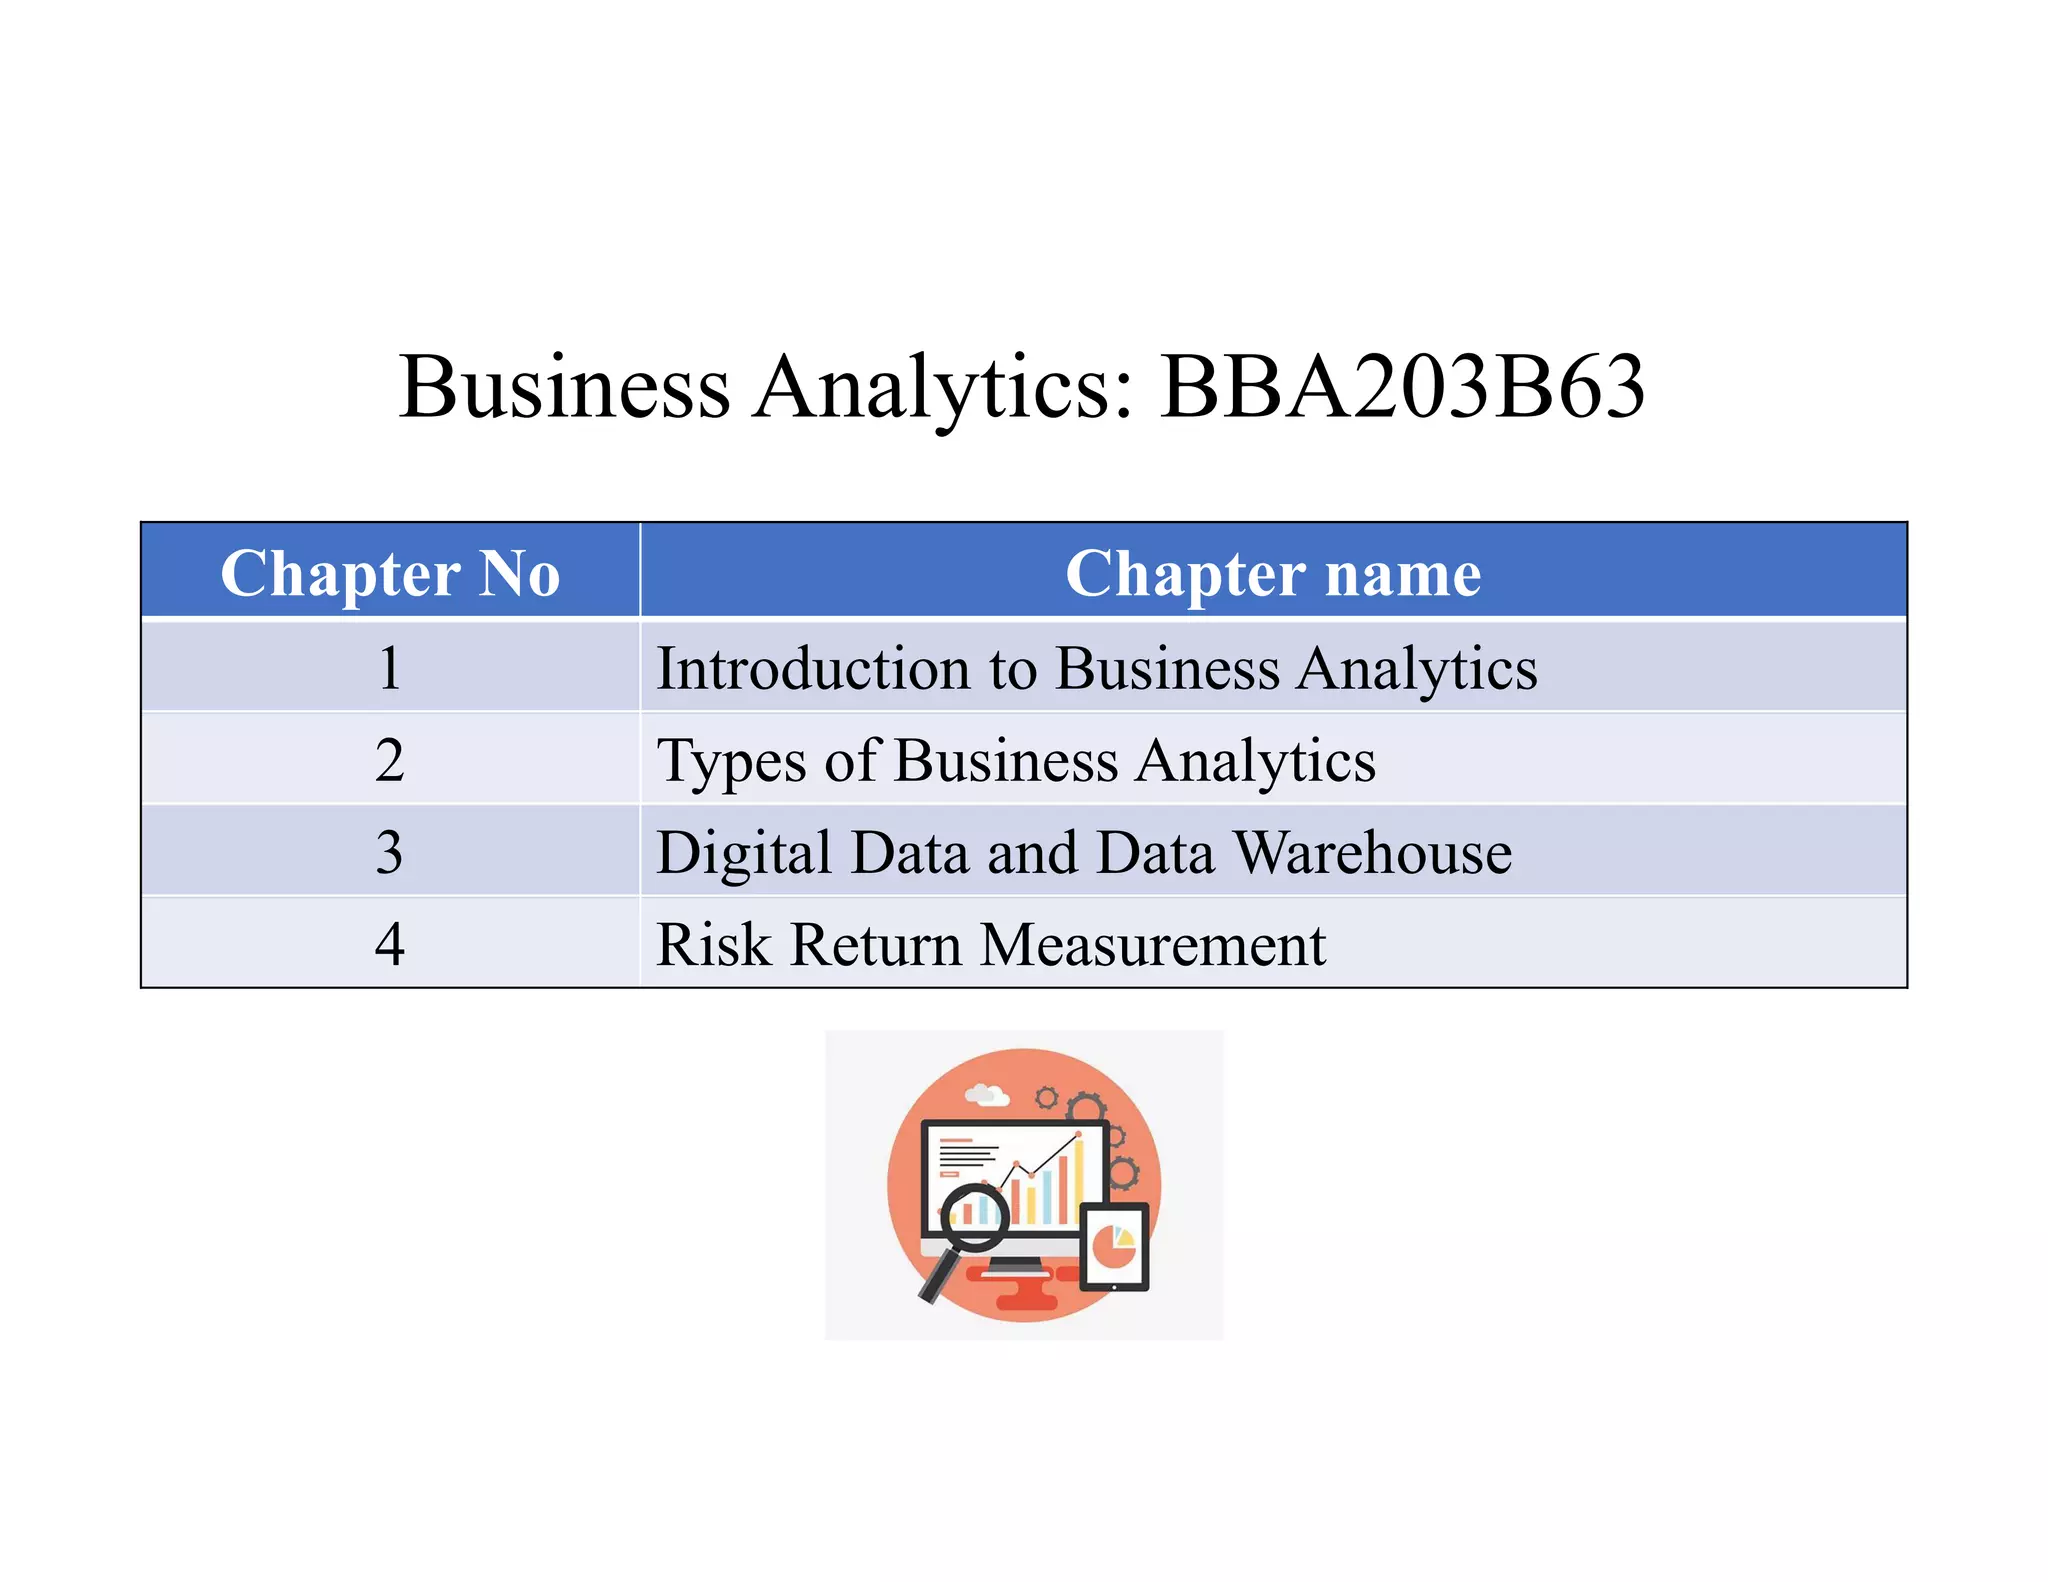
Introduction to Business Analytics course. Course code BBA203B63, offering 3 credits with evaluation structure.
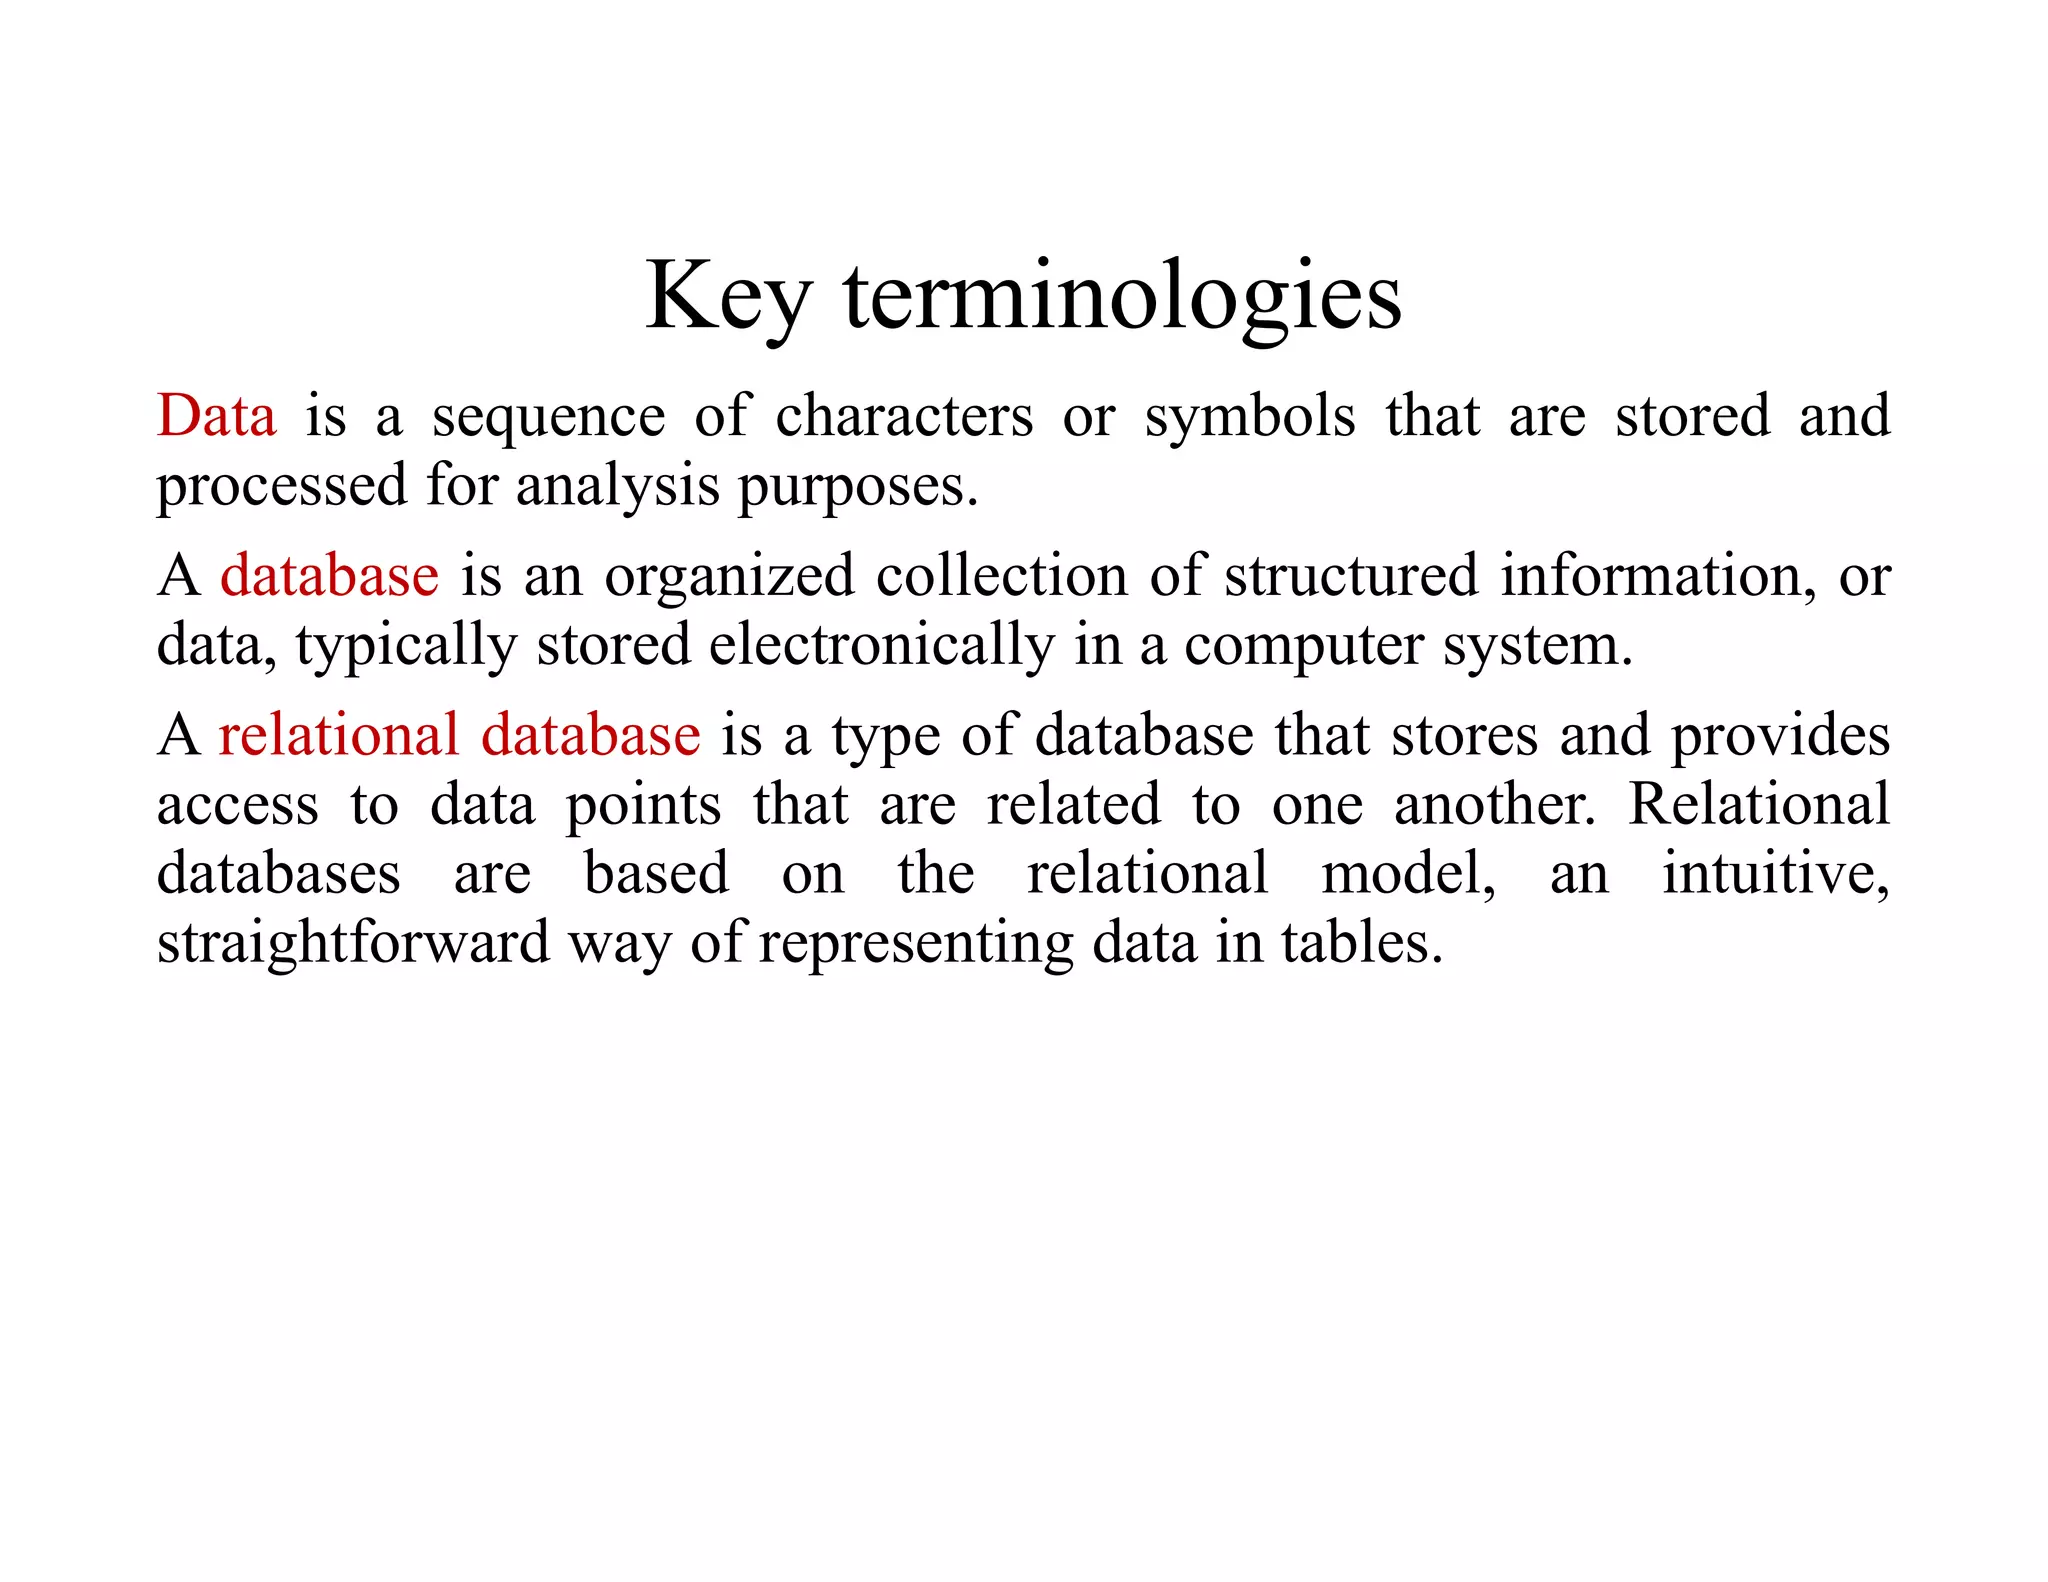
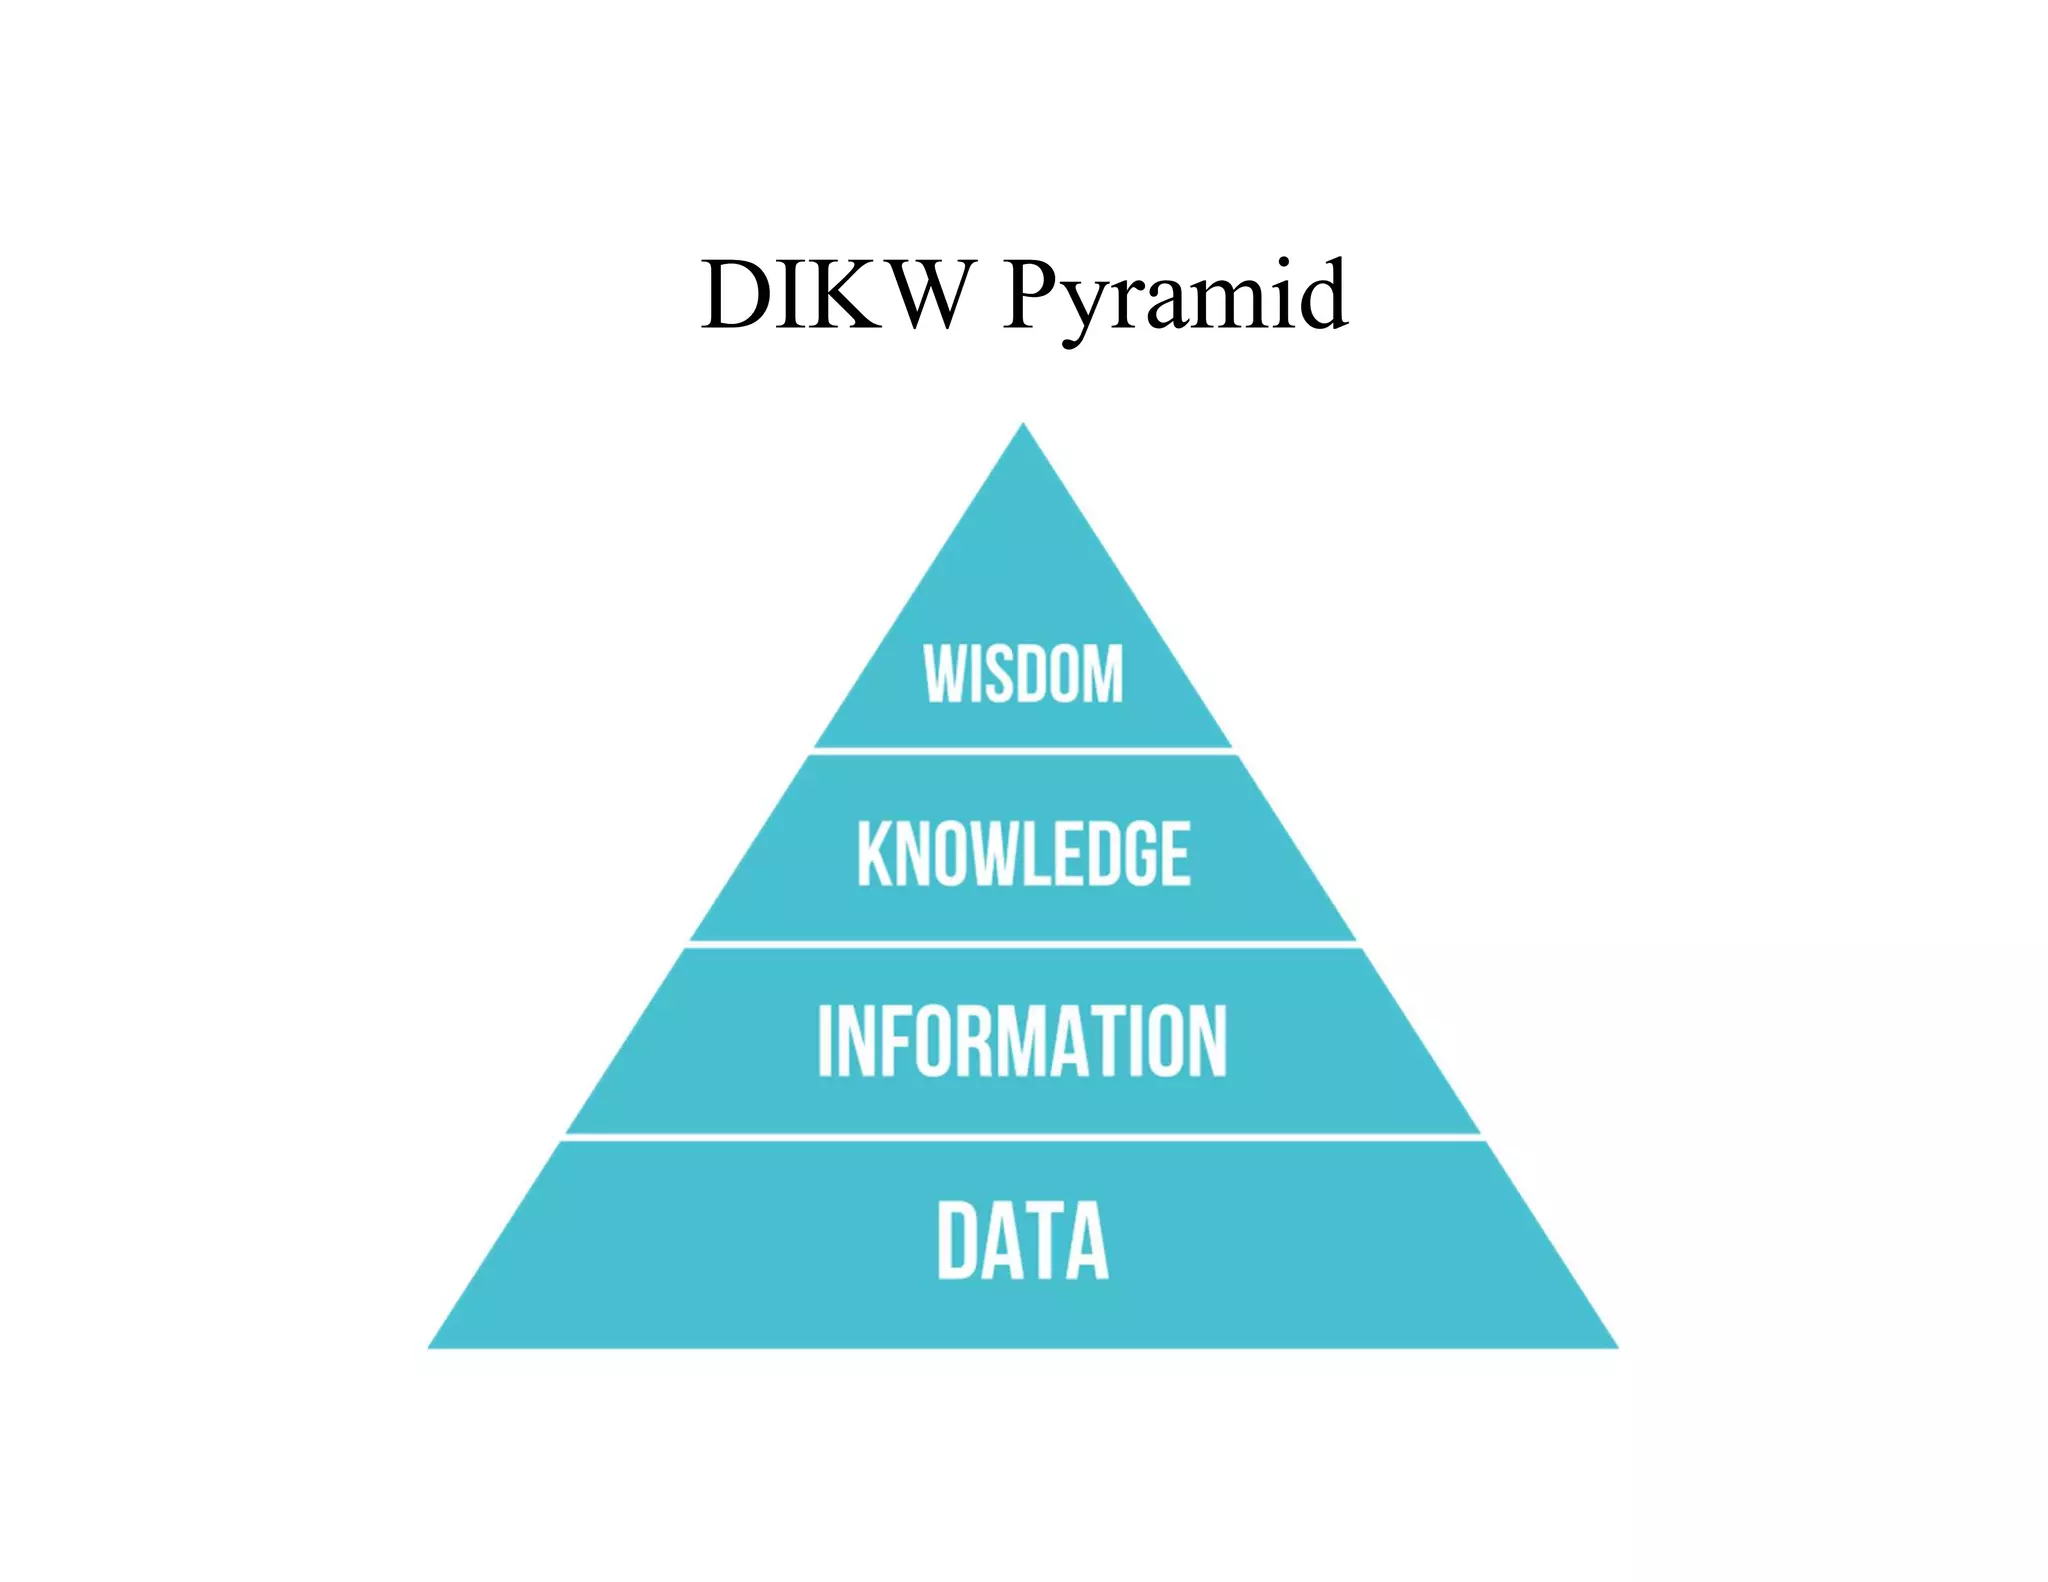
Introduction of key terms related to data and databases; defining analytics and its application in business.
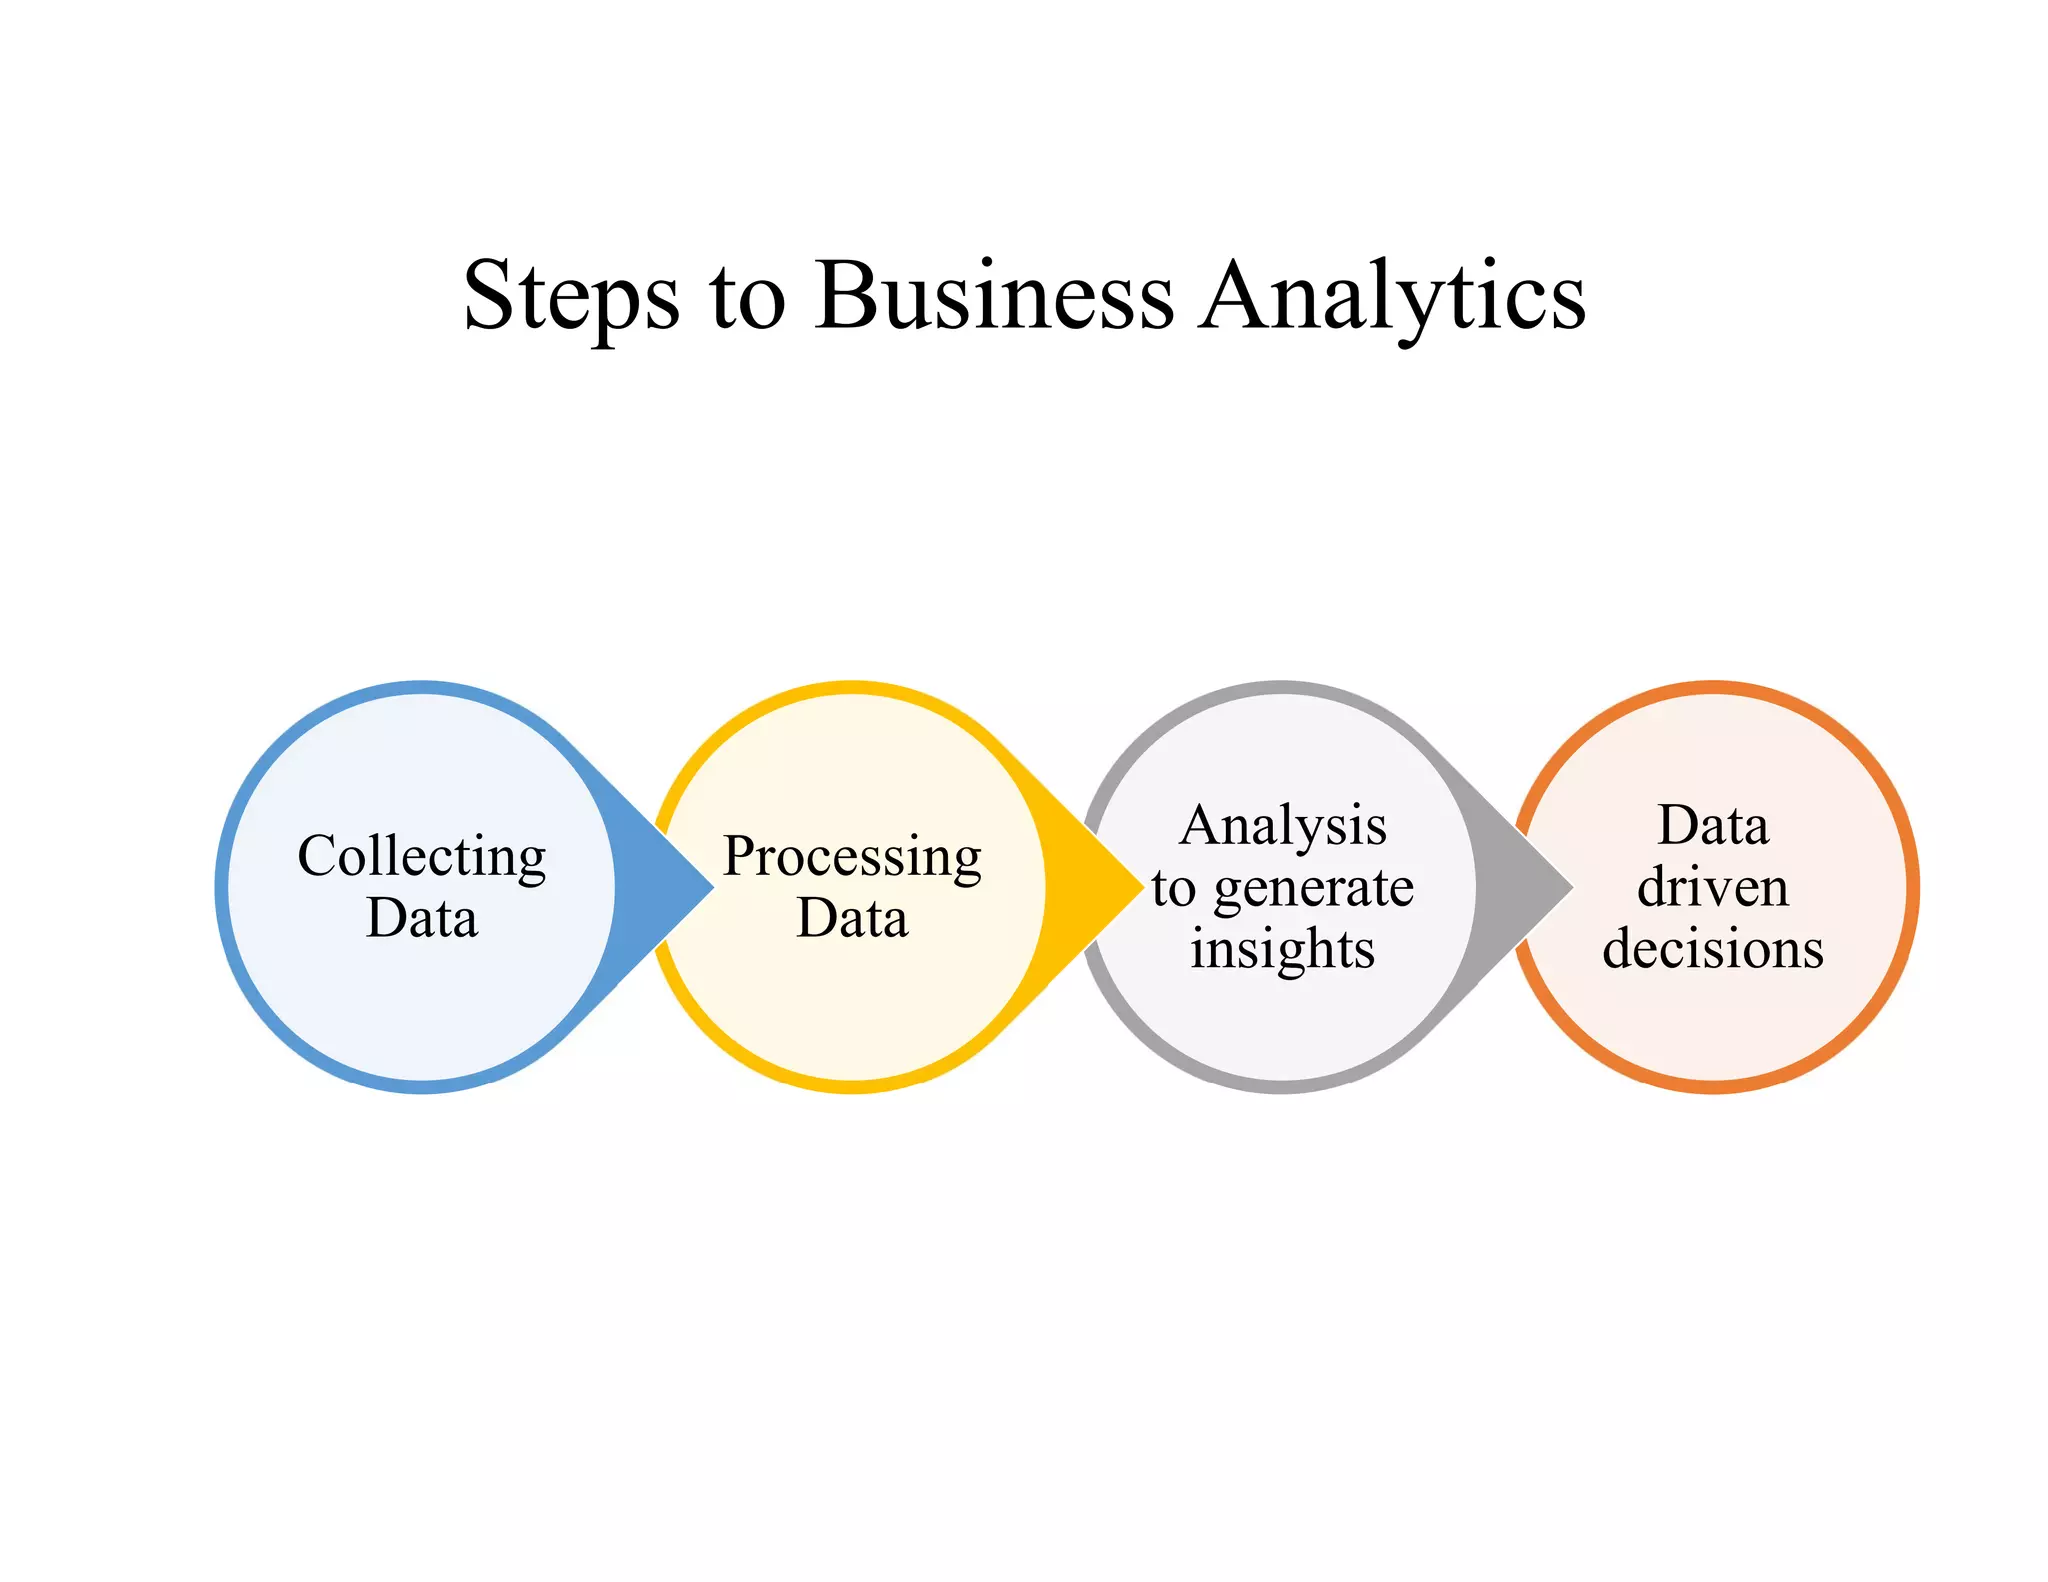
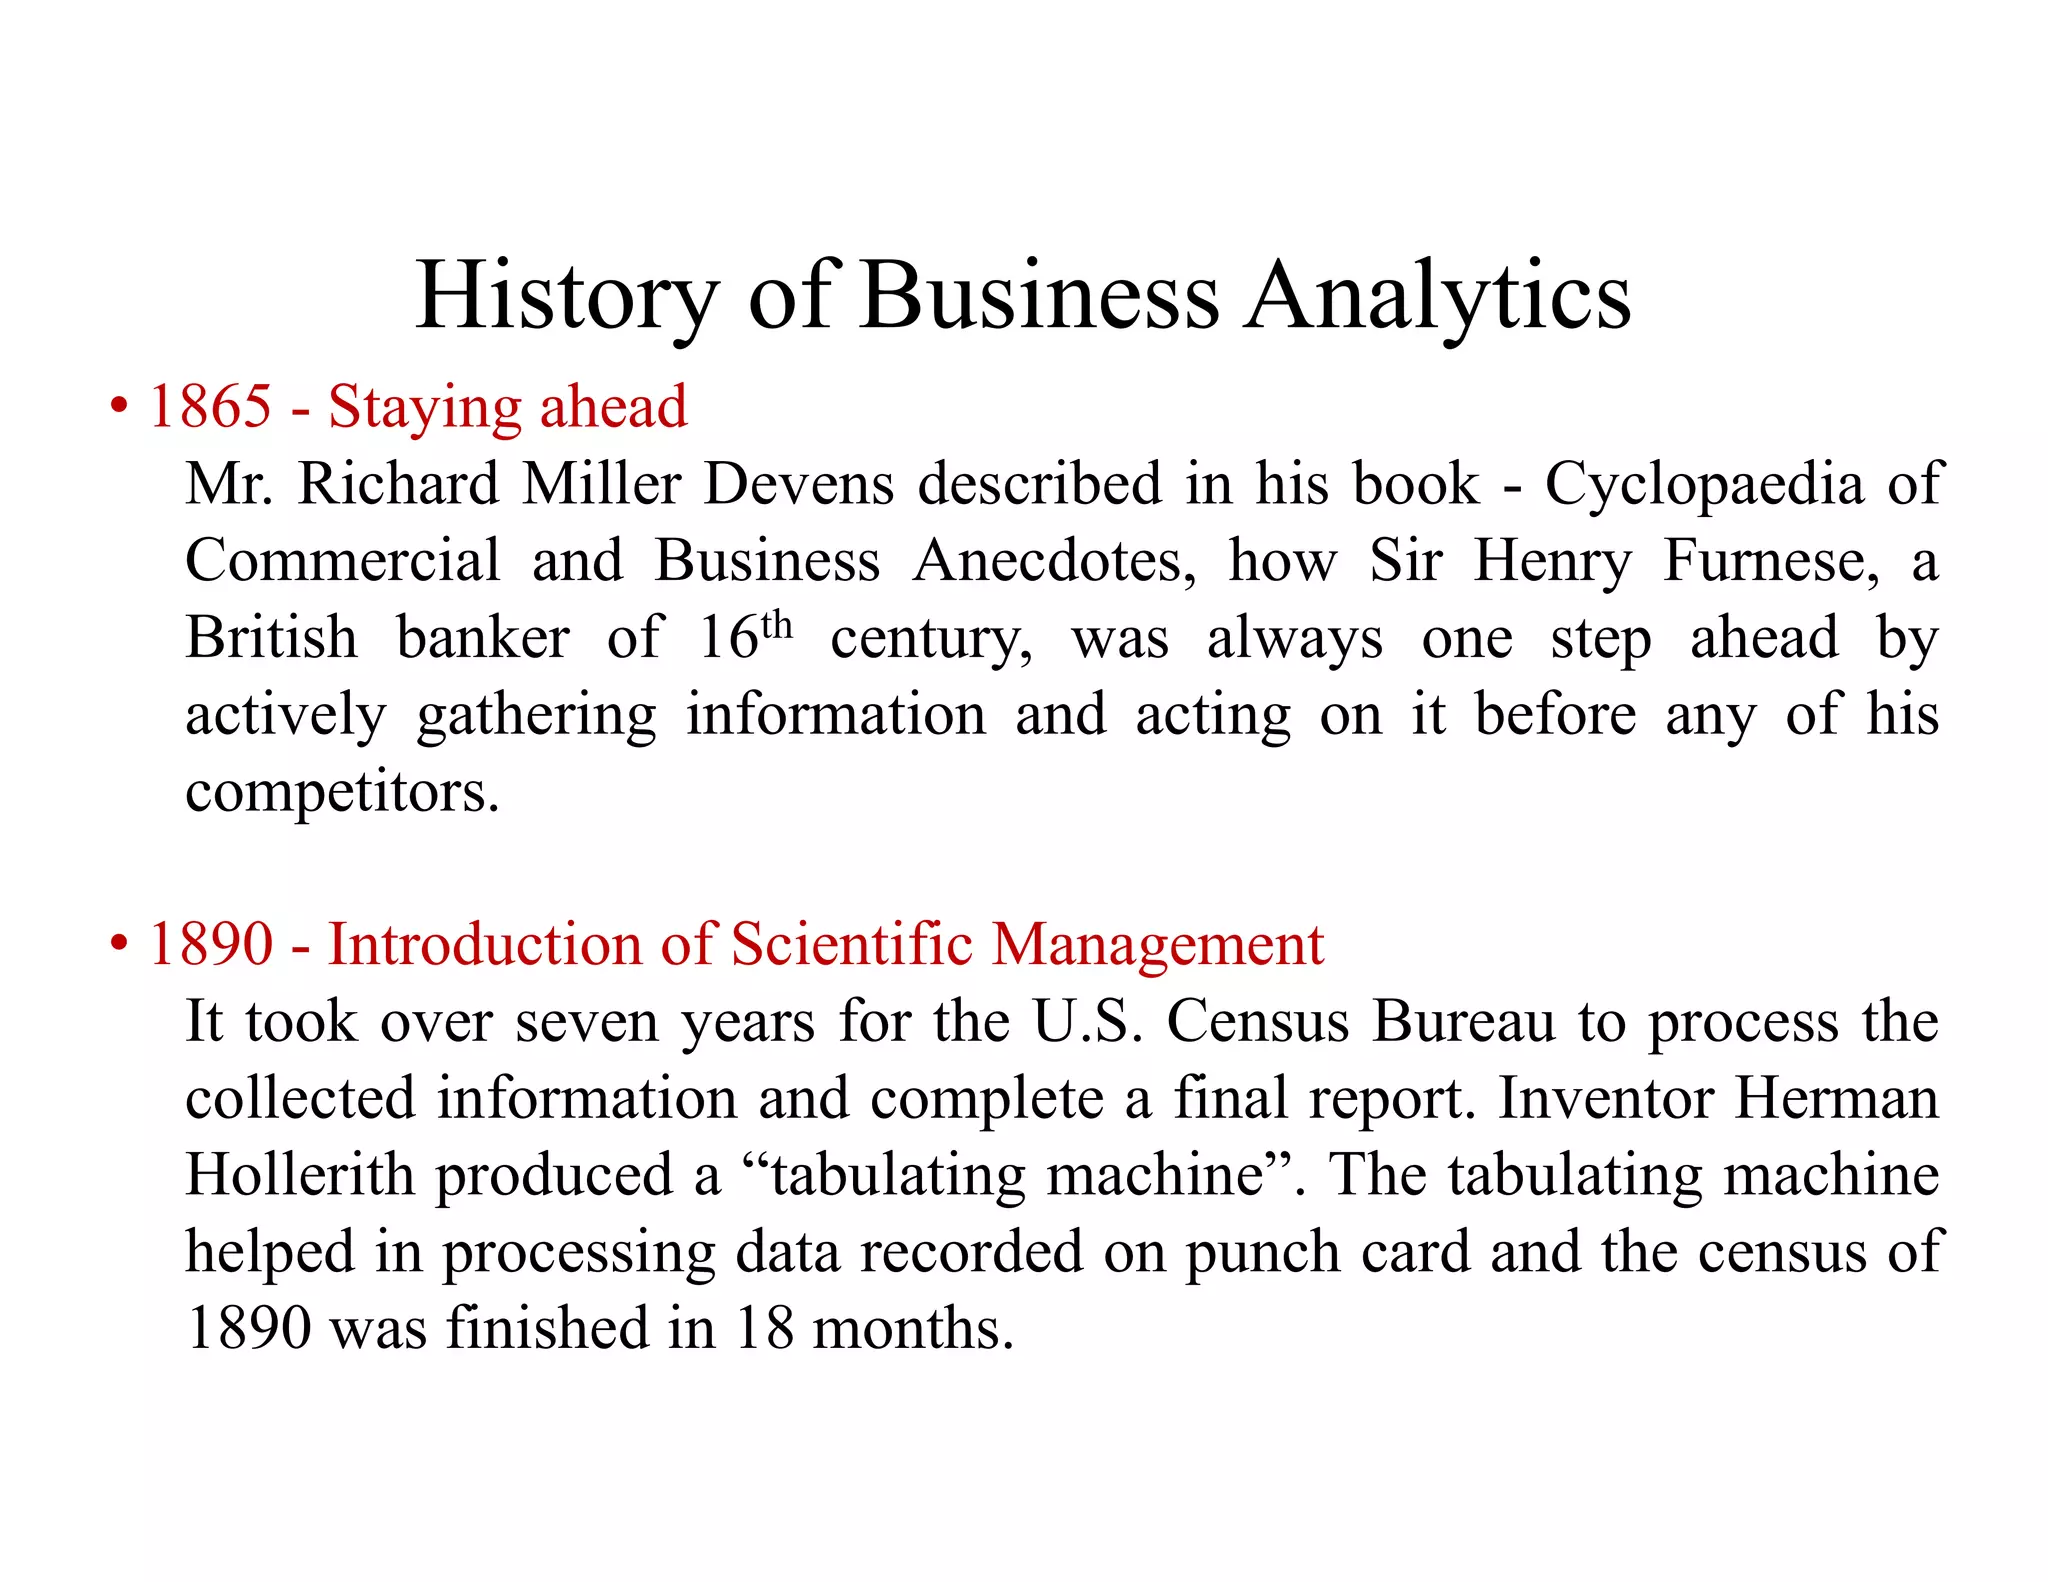
Steps in business analytics include data collection and analysis. Historical milestones from 1865 to 2005.
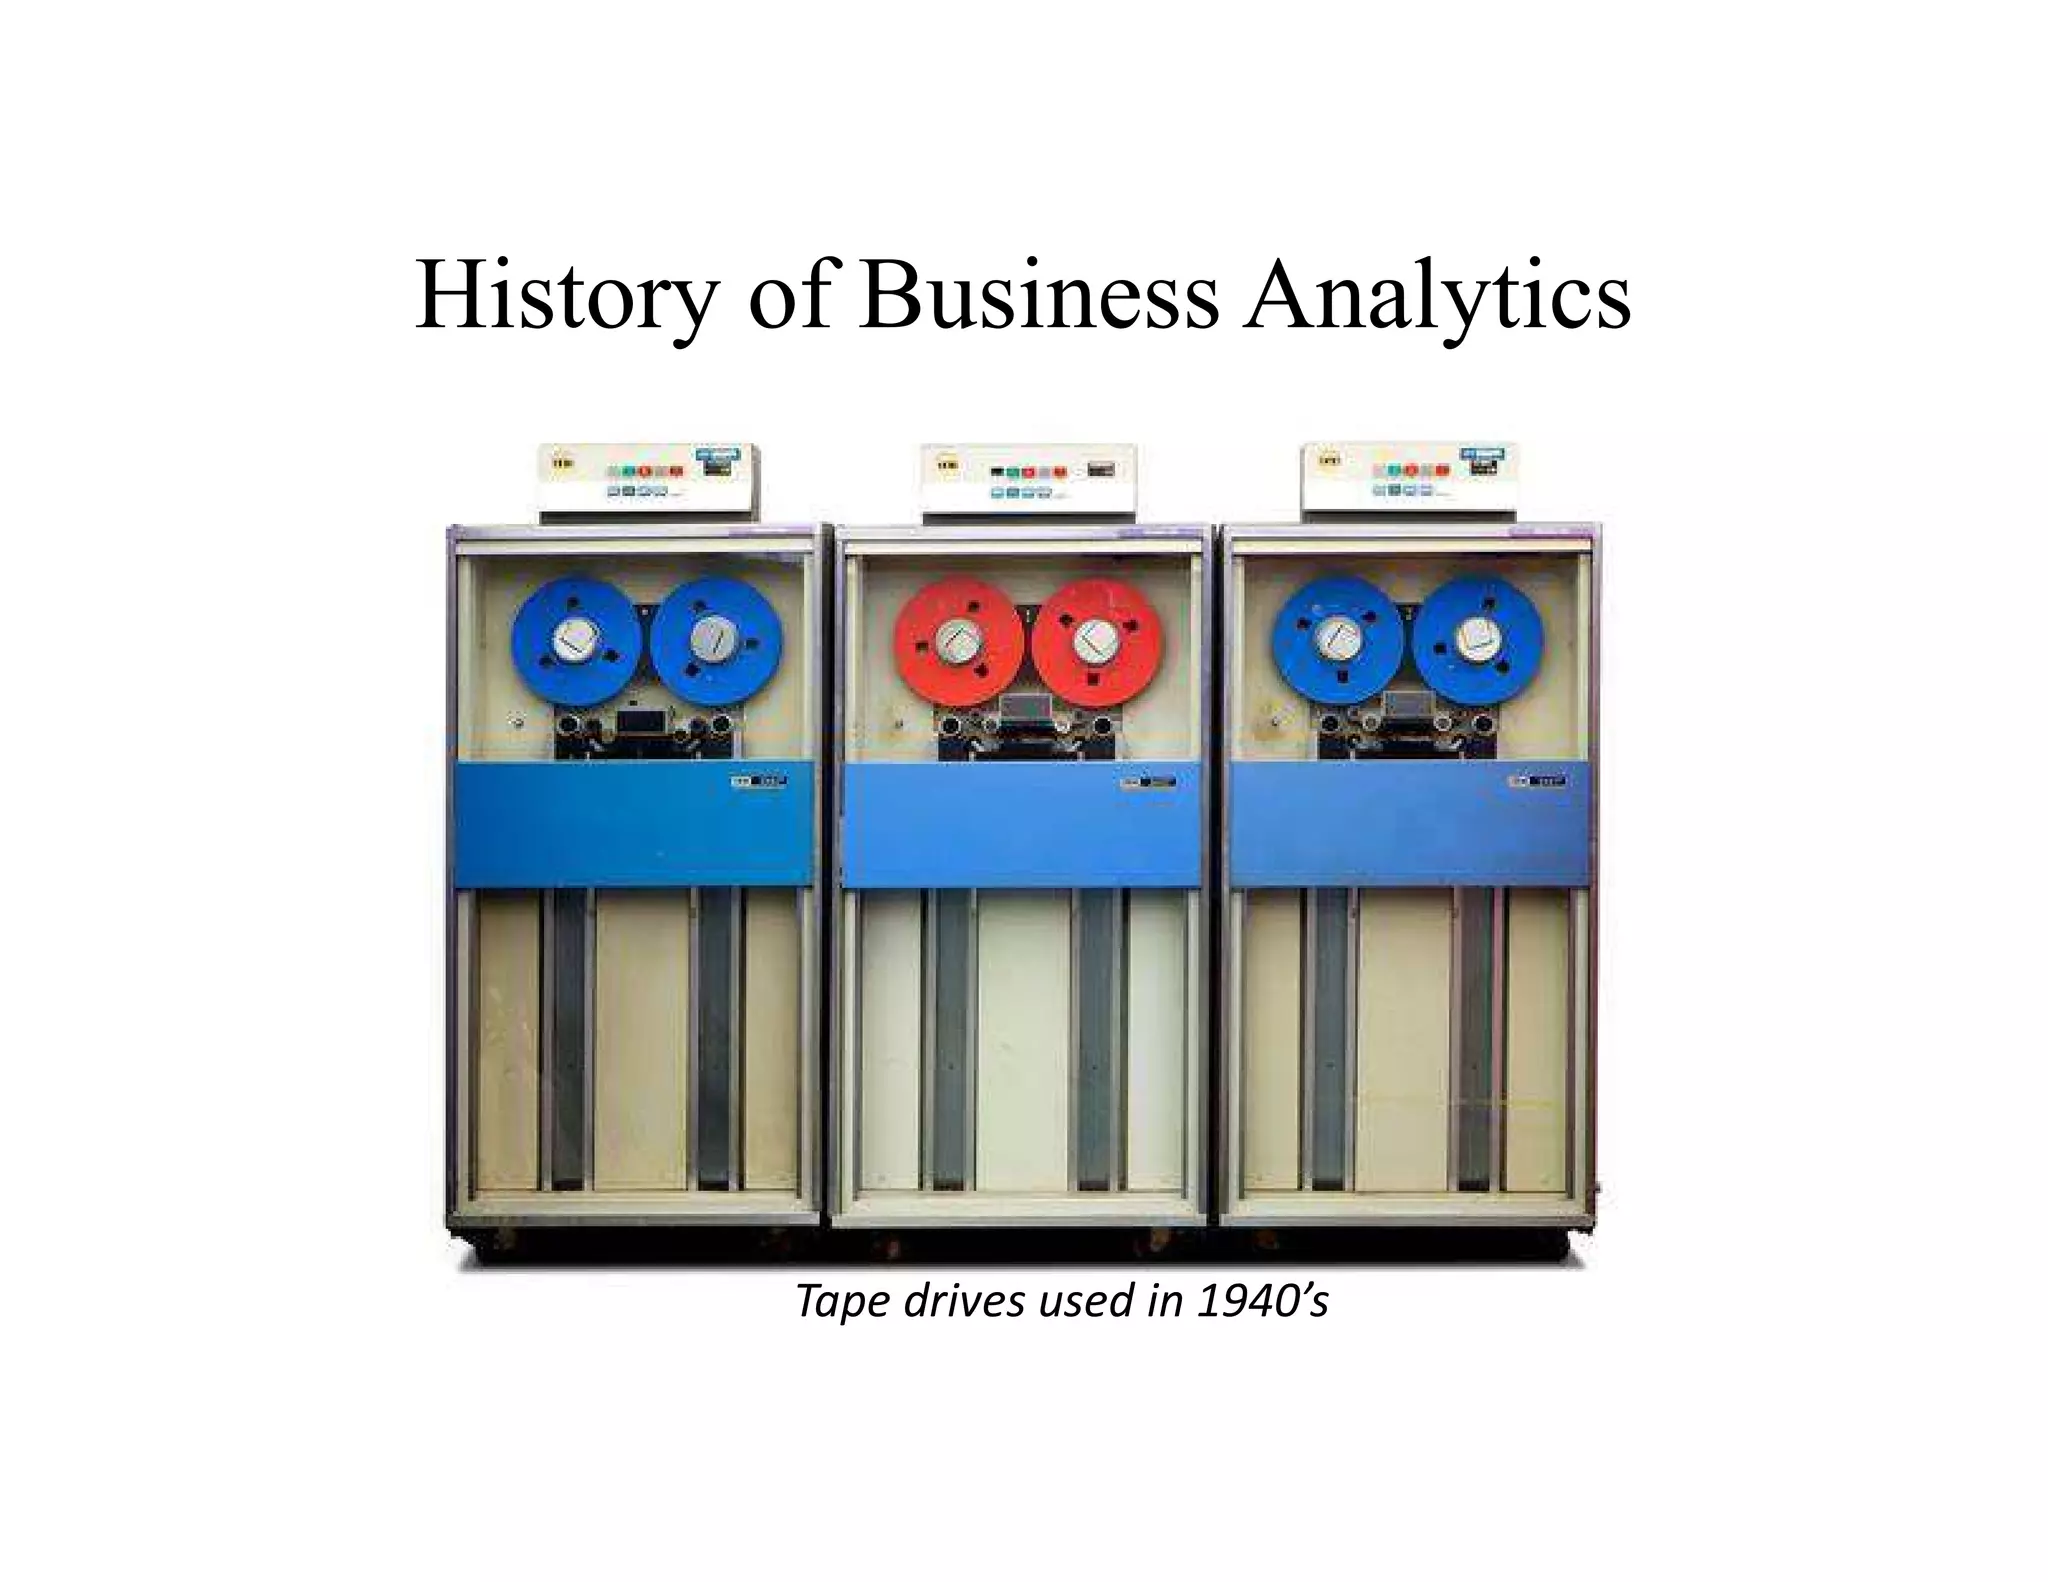
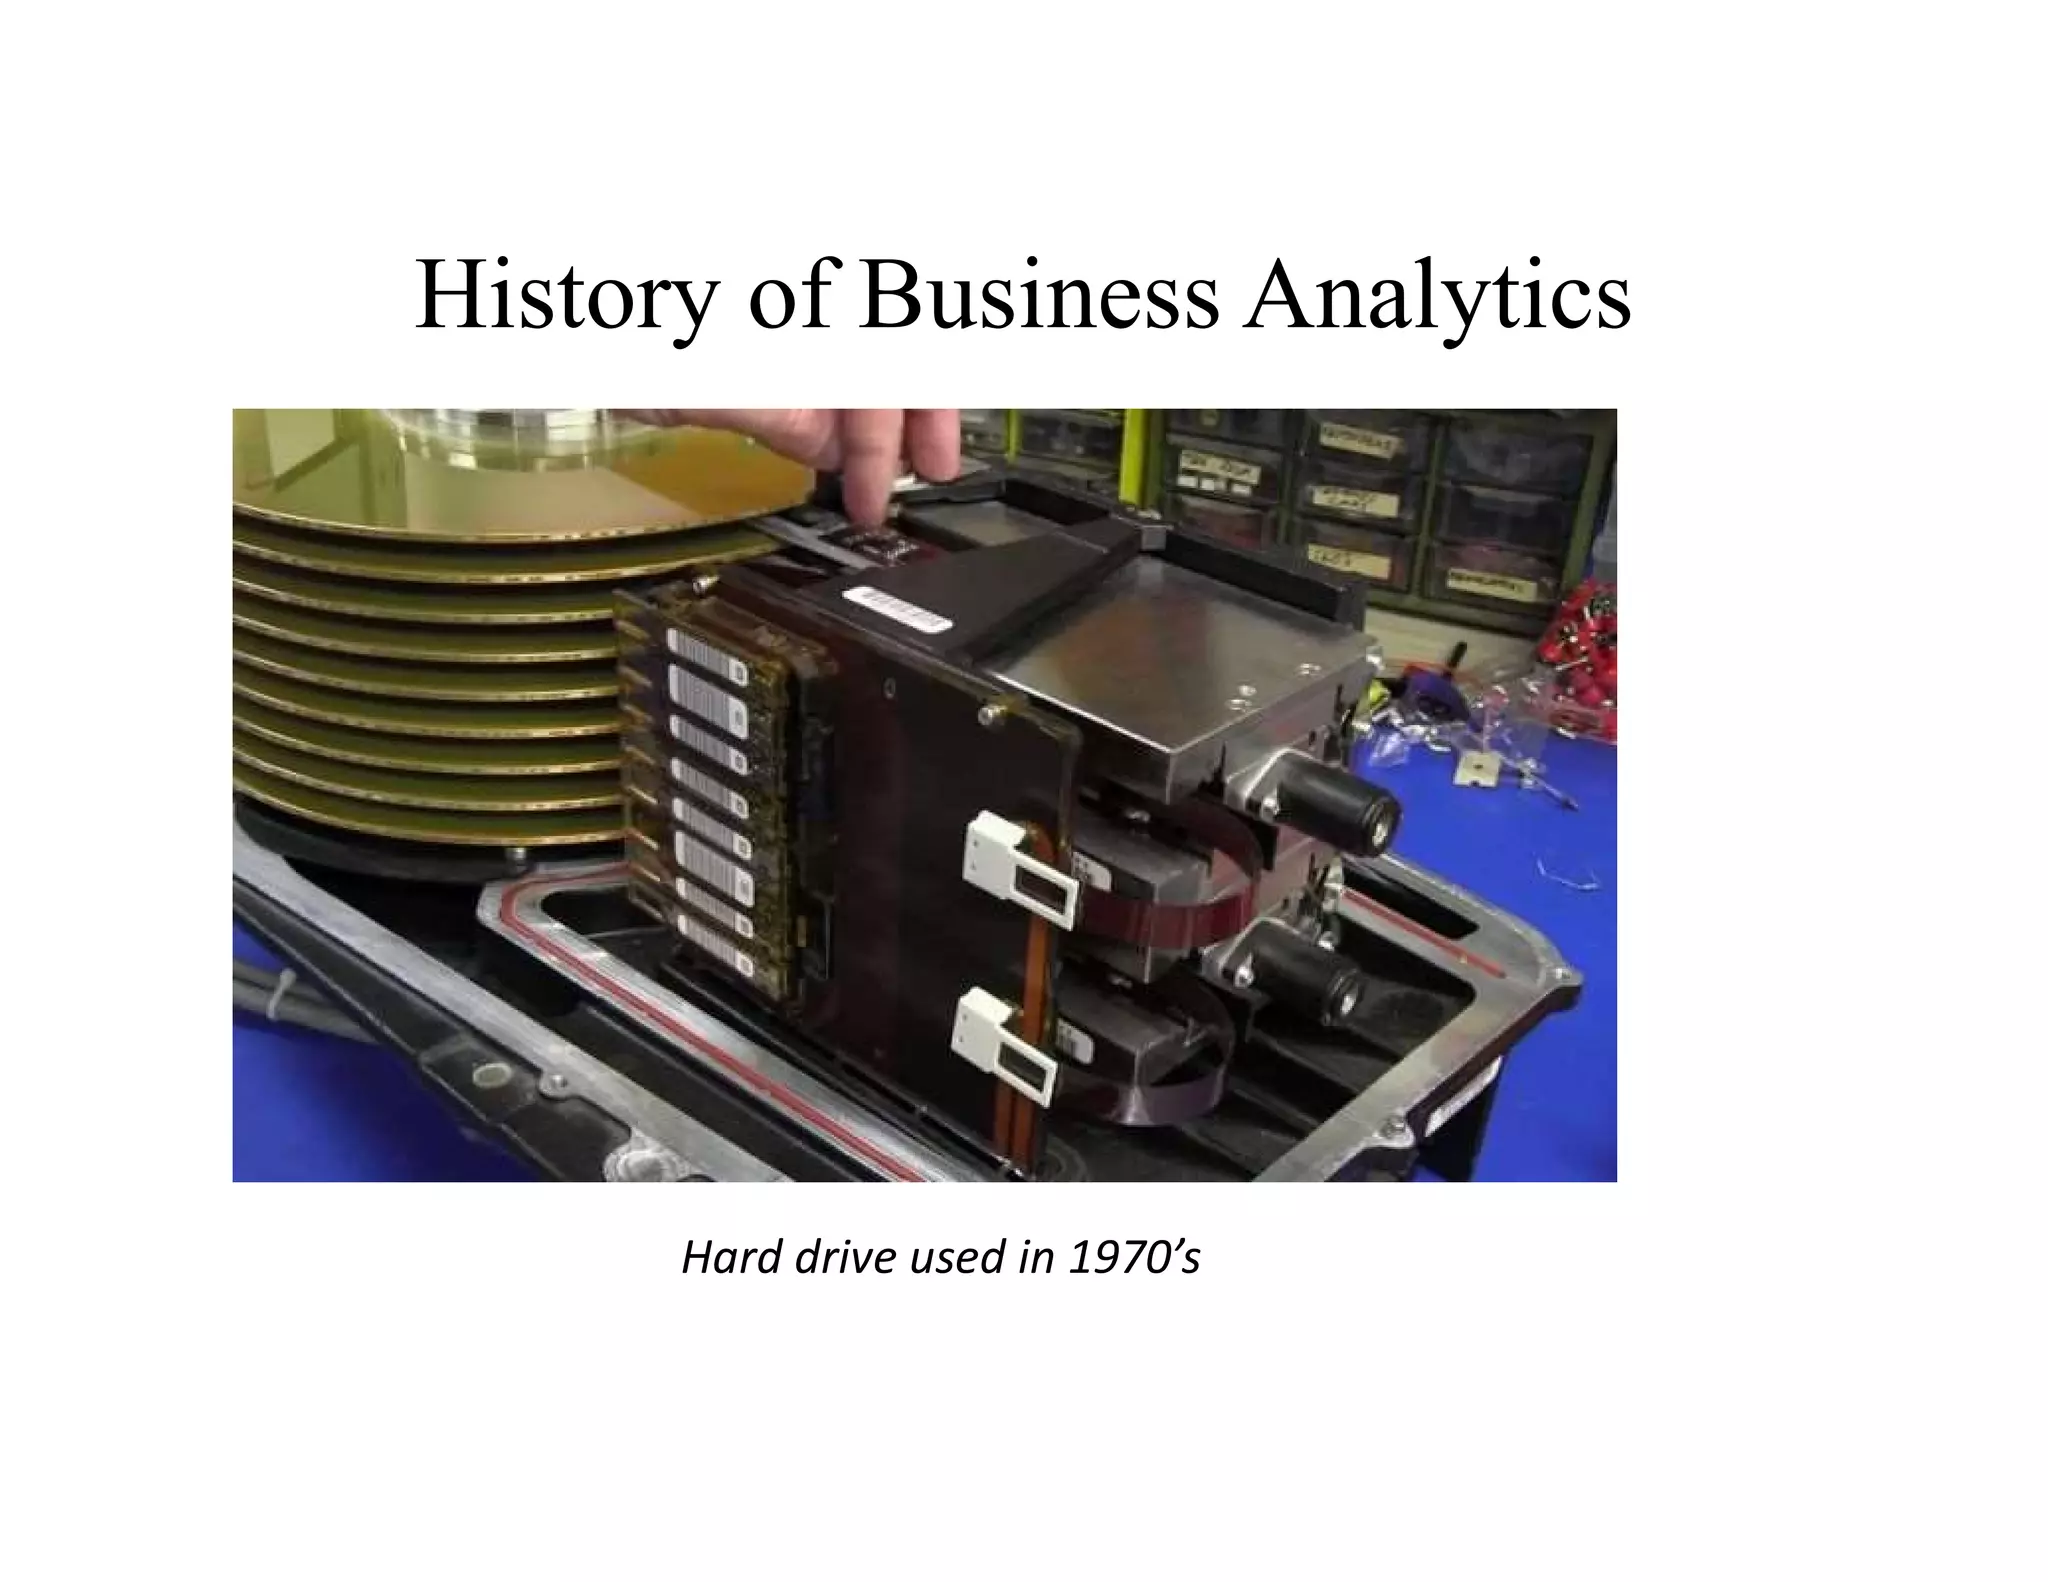
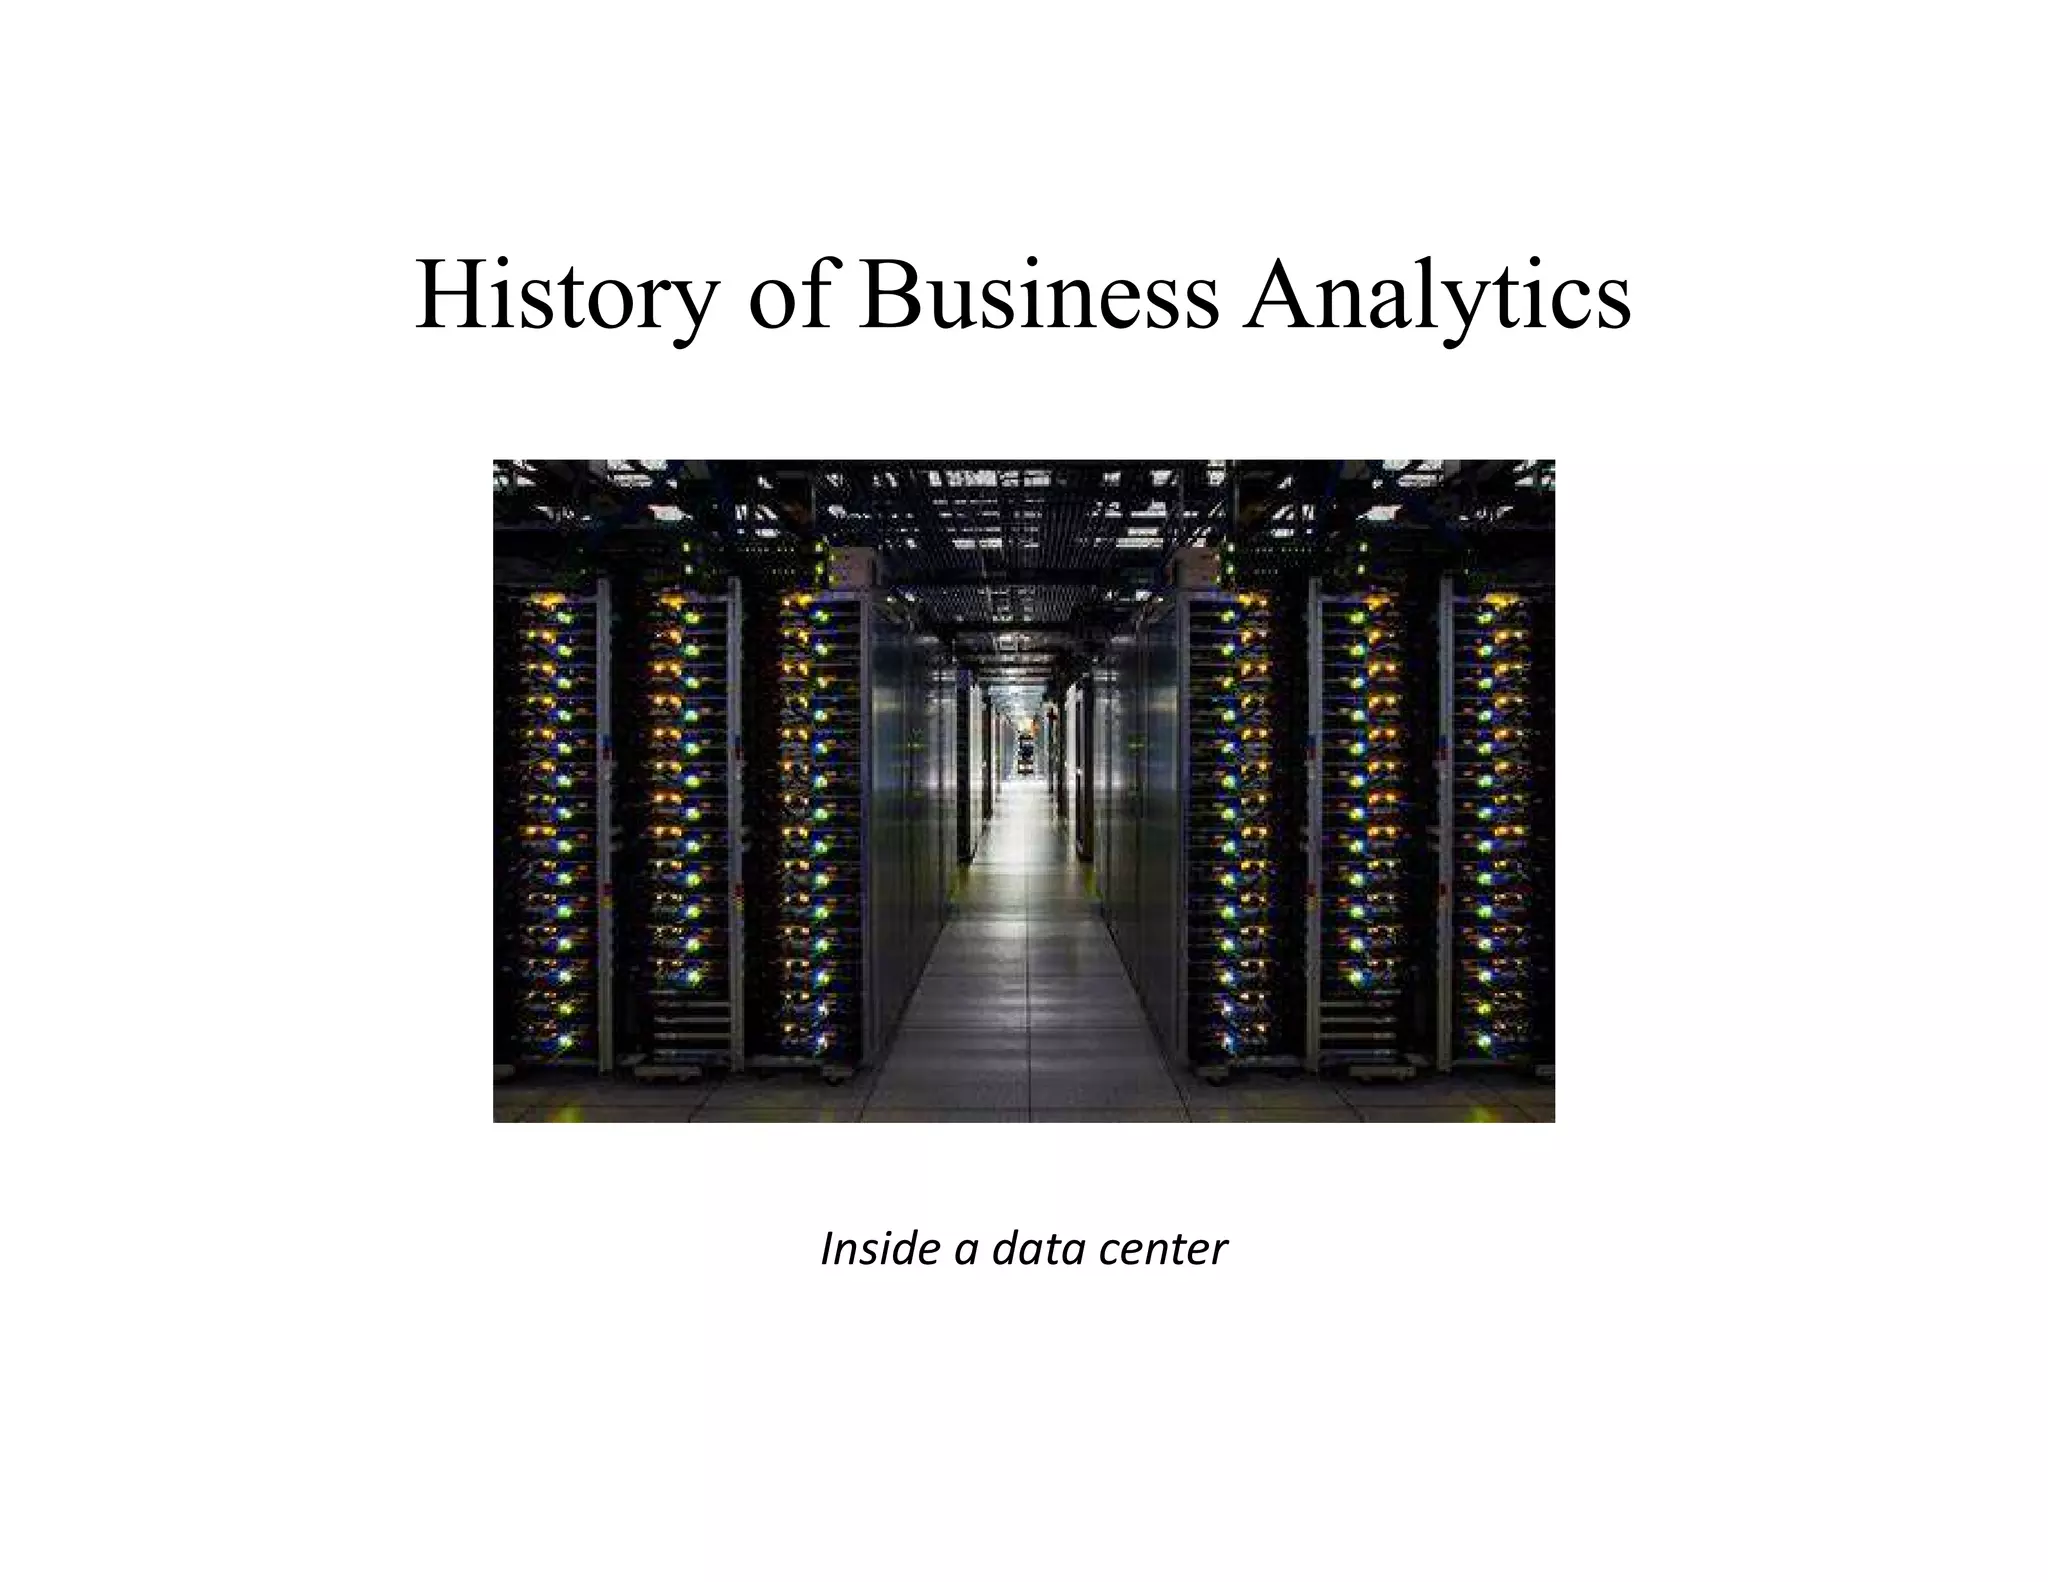
Visual representations of key historical tools in business analytics including punch cards and hard drives.
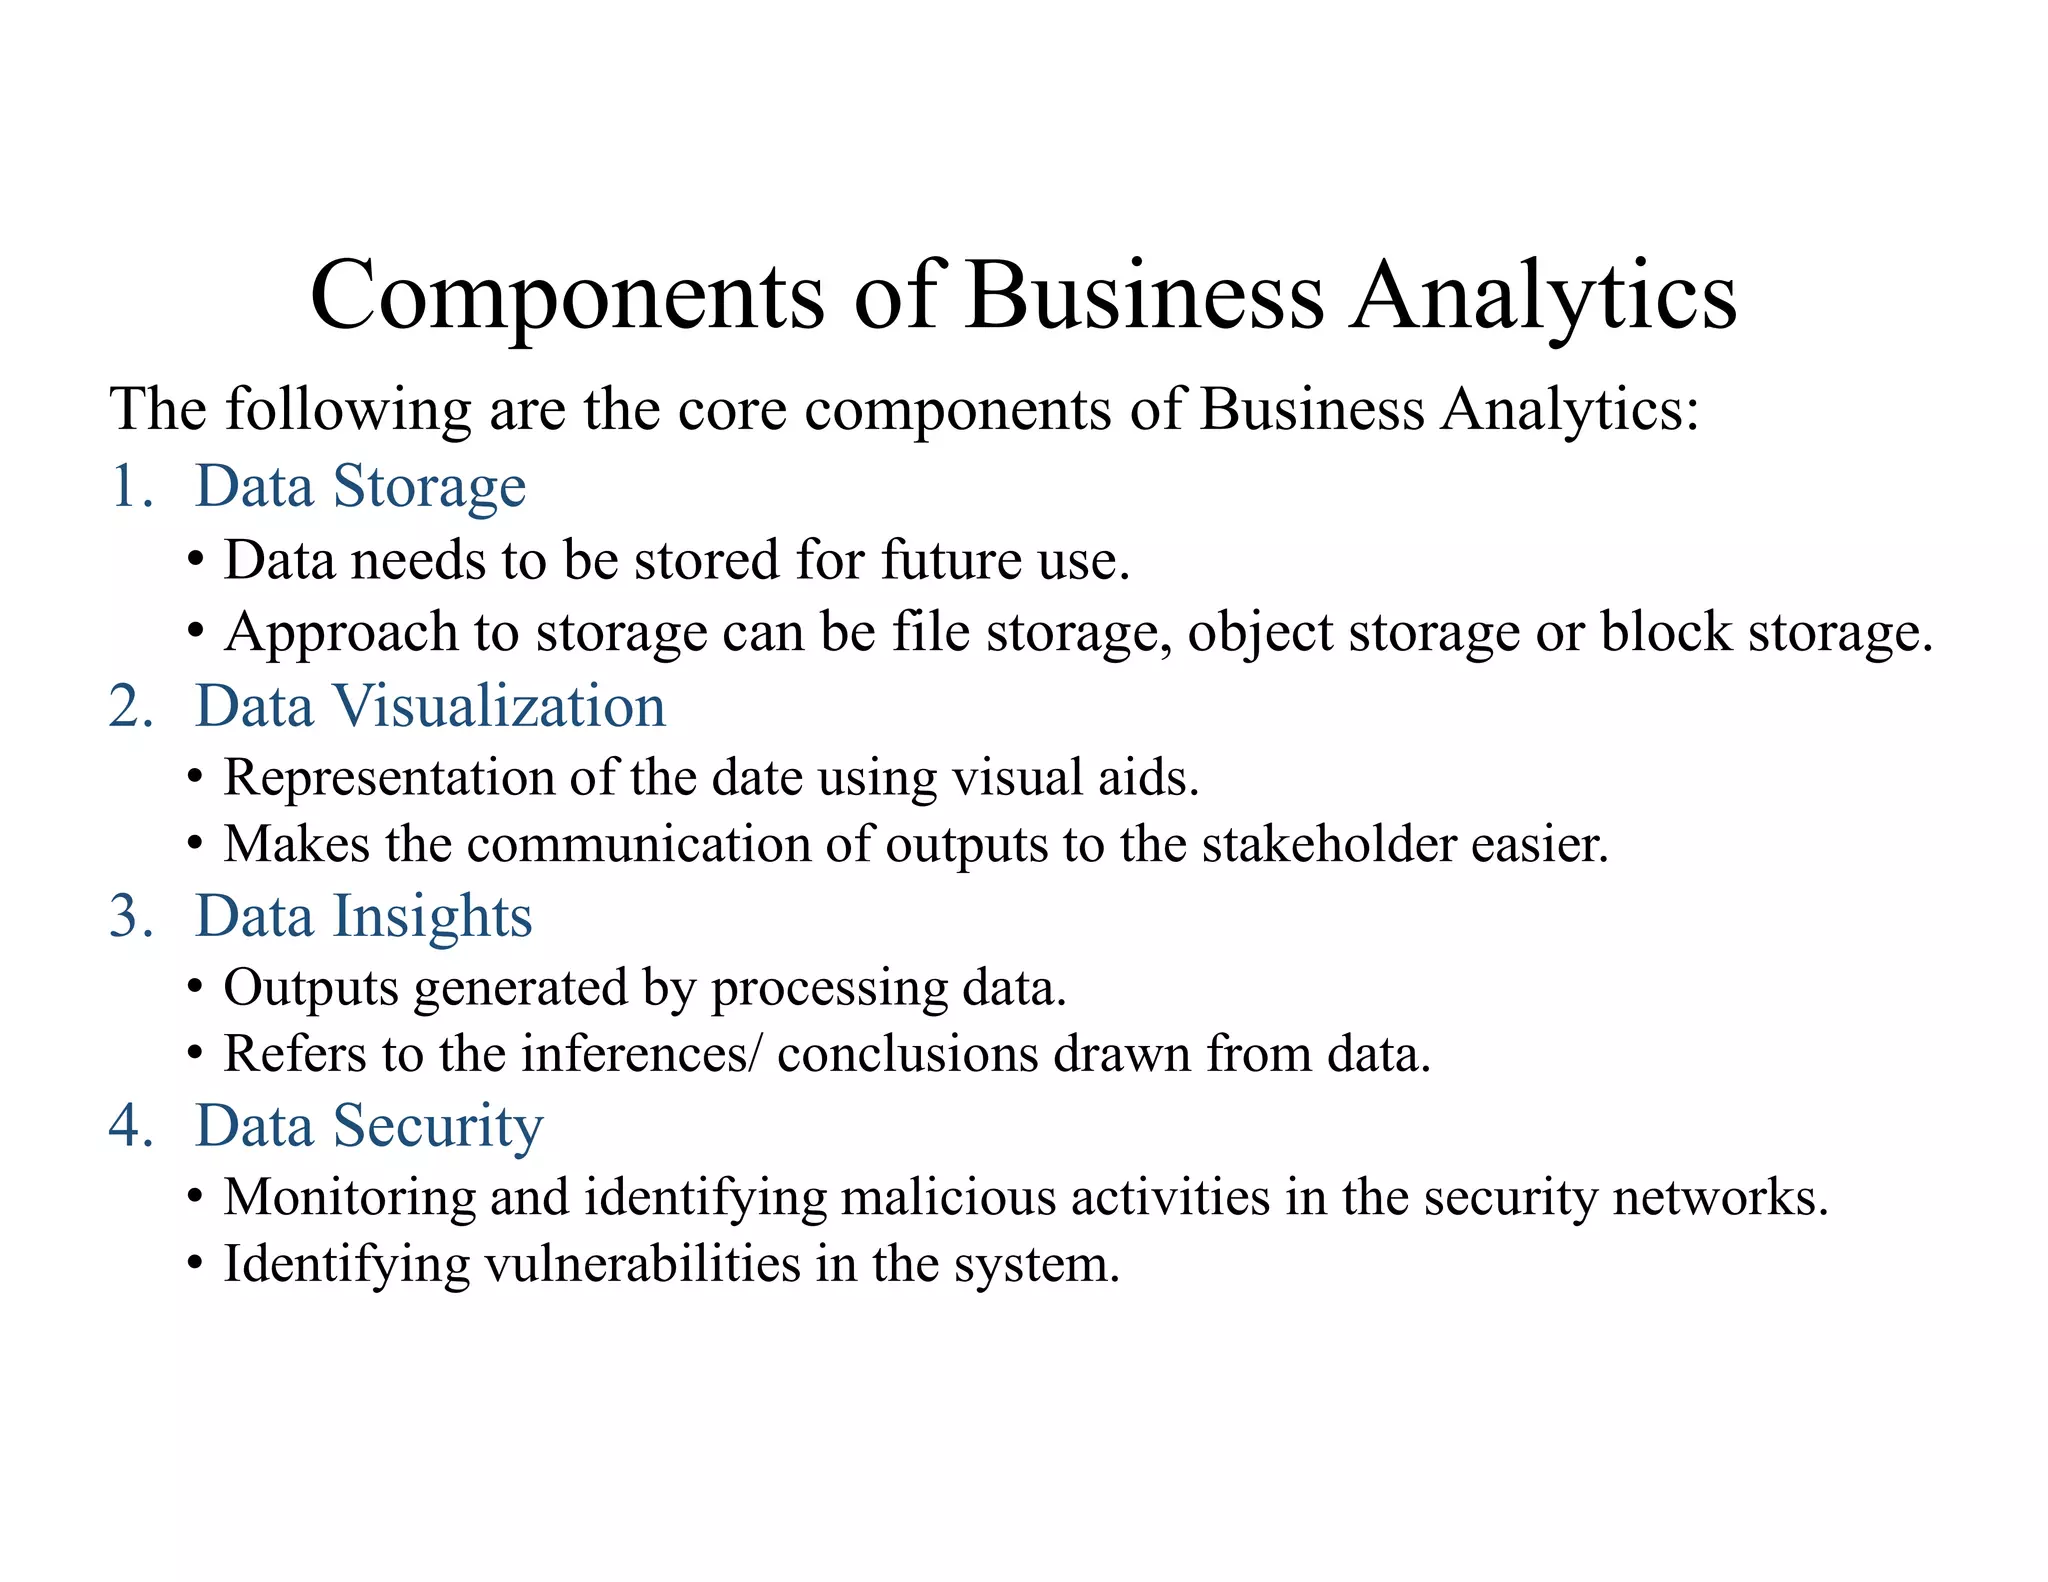
Identification of core components: Data Storage, Visualization, Insights, and Security.
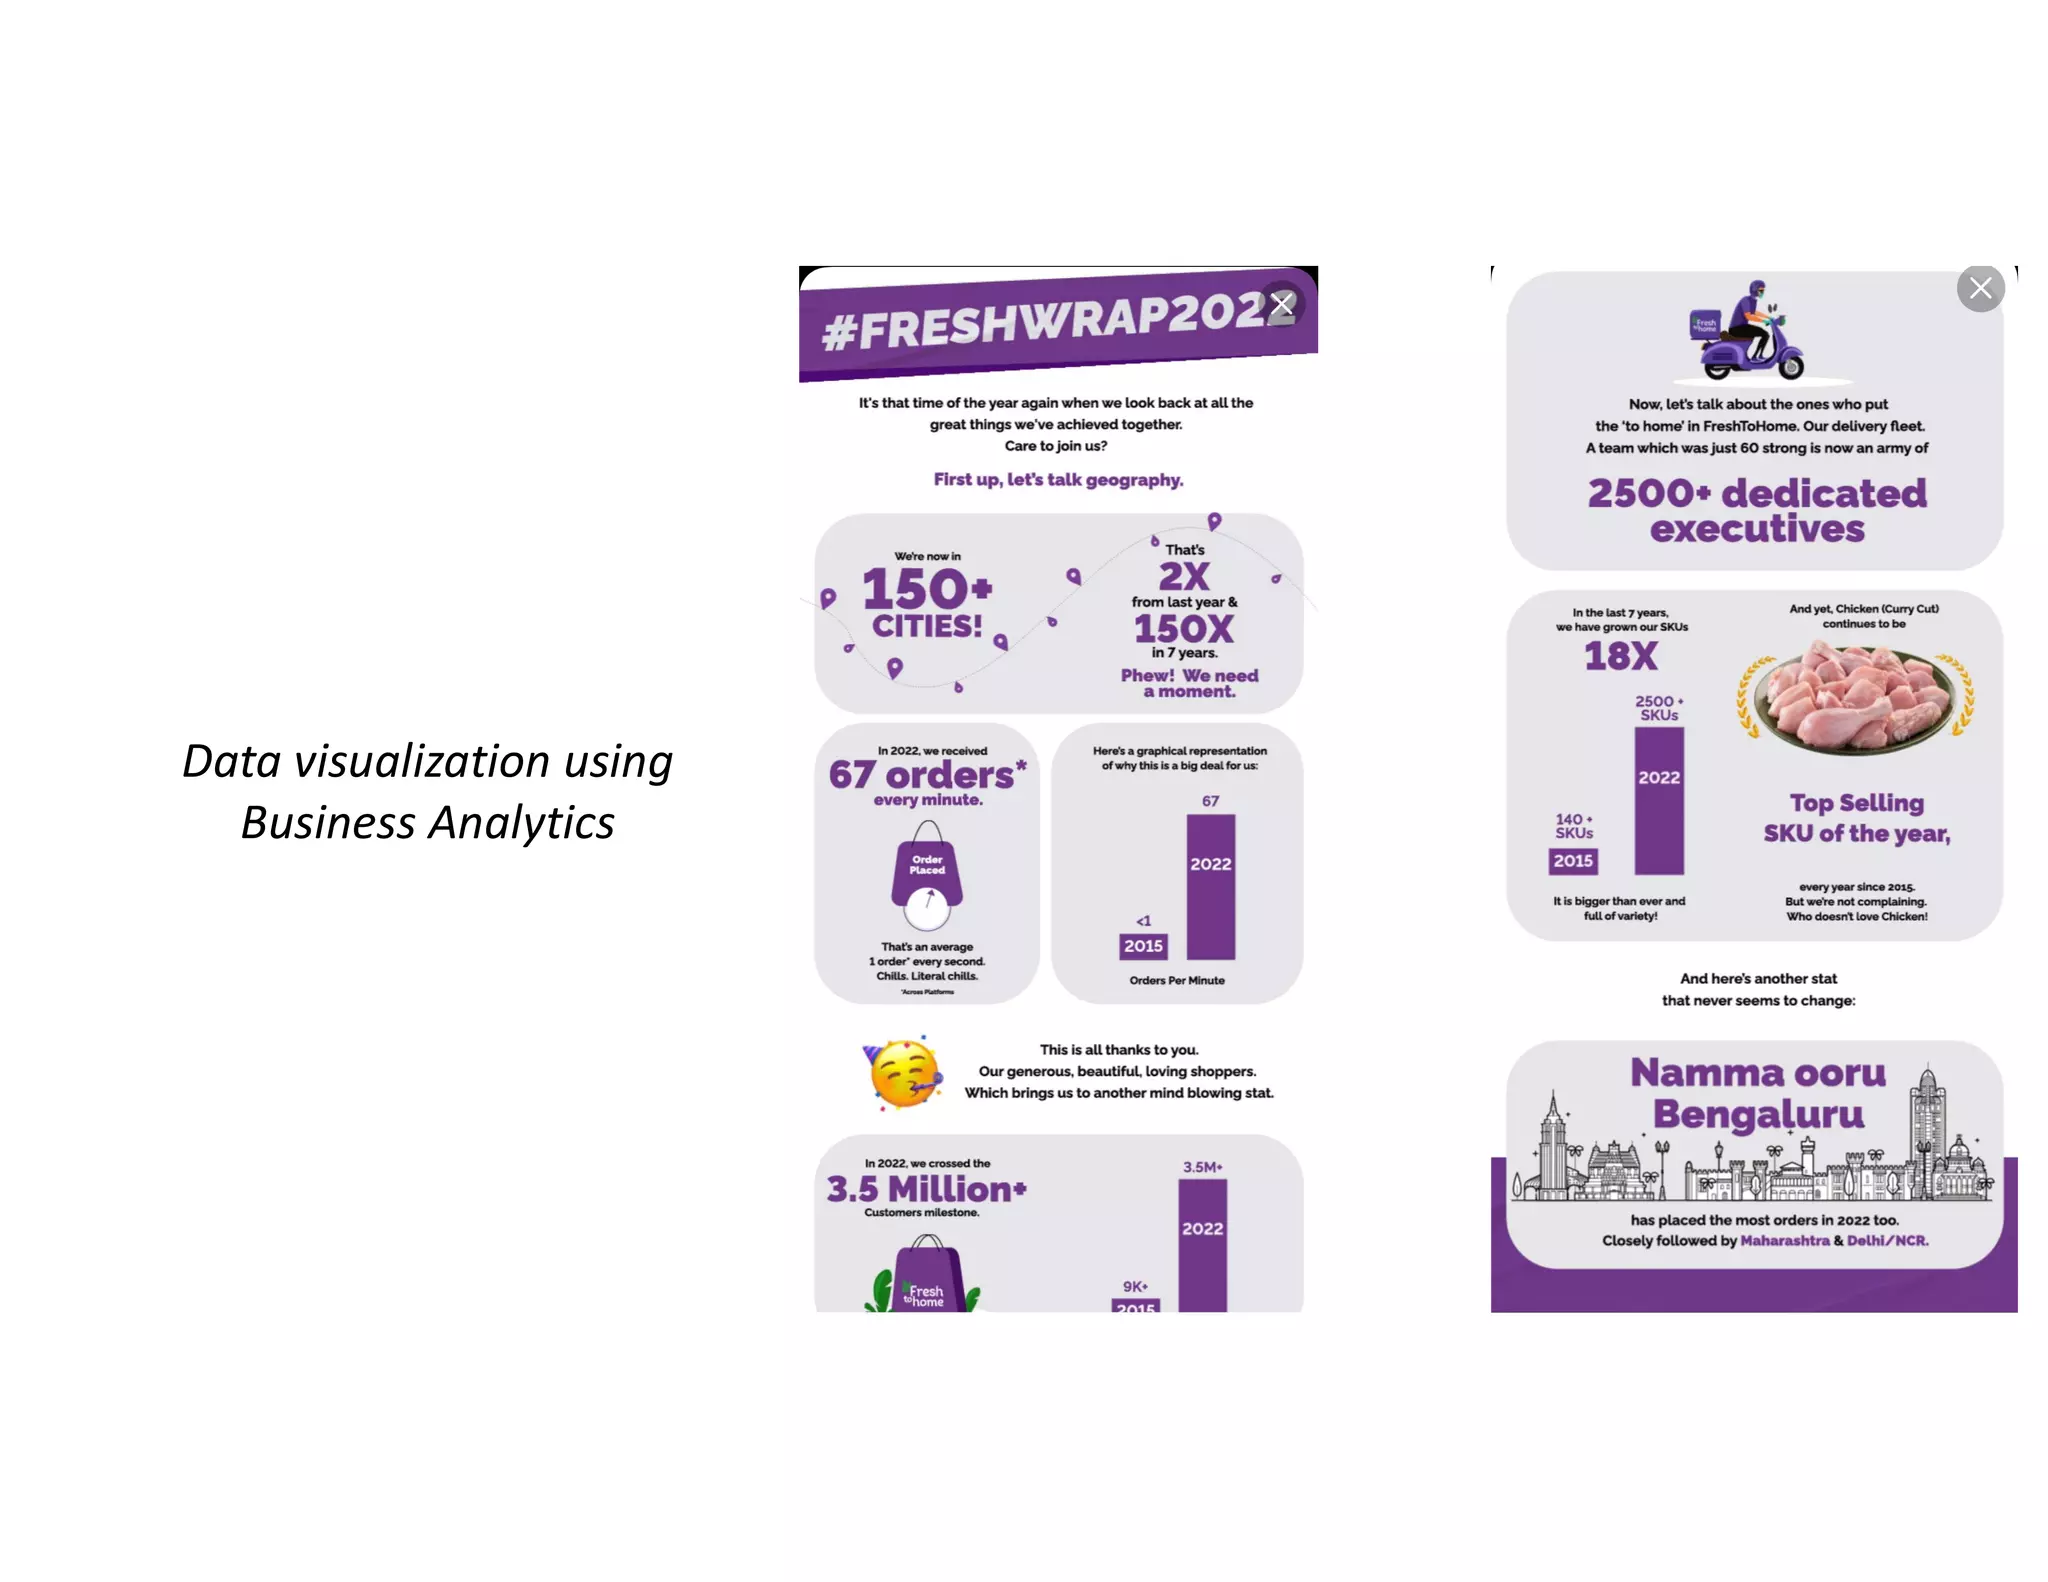
Importance of data visualization in business analytics to enhance communication of insights.
Advantages like data-driven decisions, enhanced efficiency, and improved decision-making processes.
Five types of business analytics: Descriptive, Diagnostic, Predictive, Prescriptive, and Cognitive.
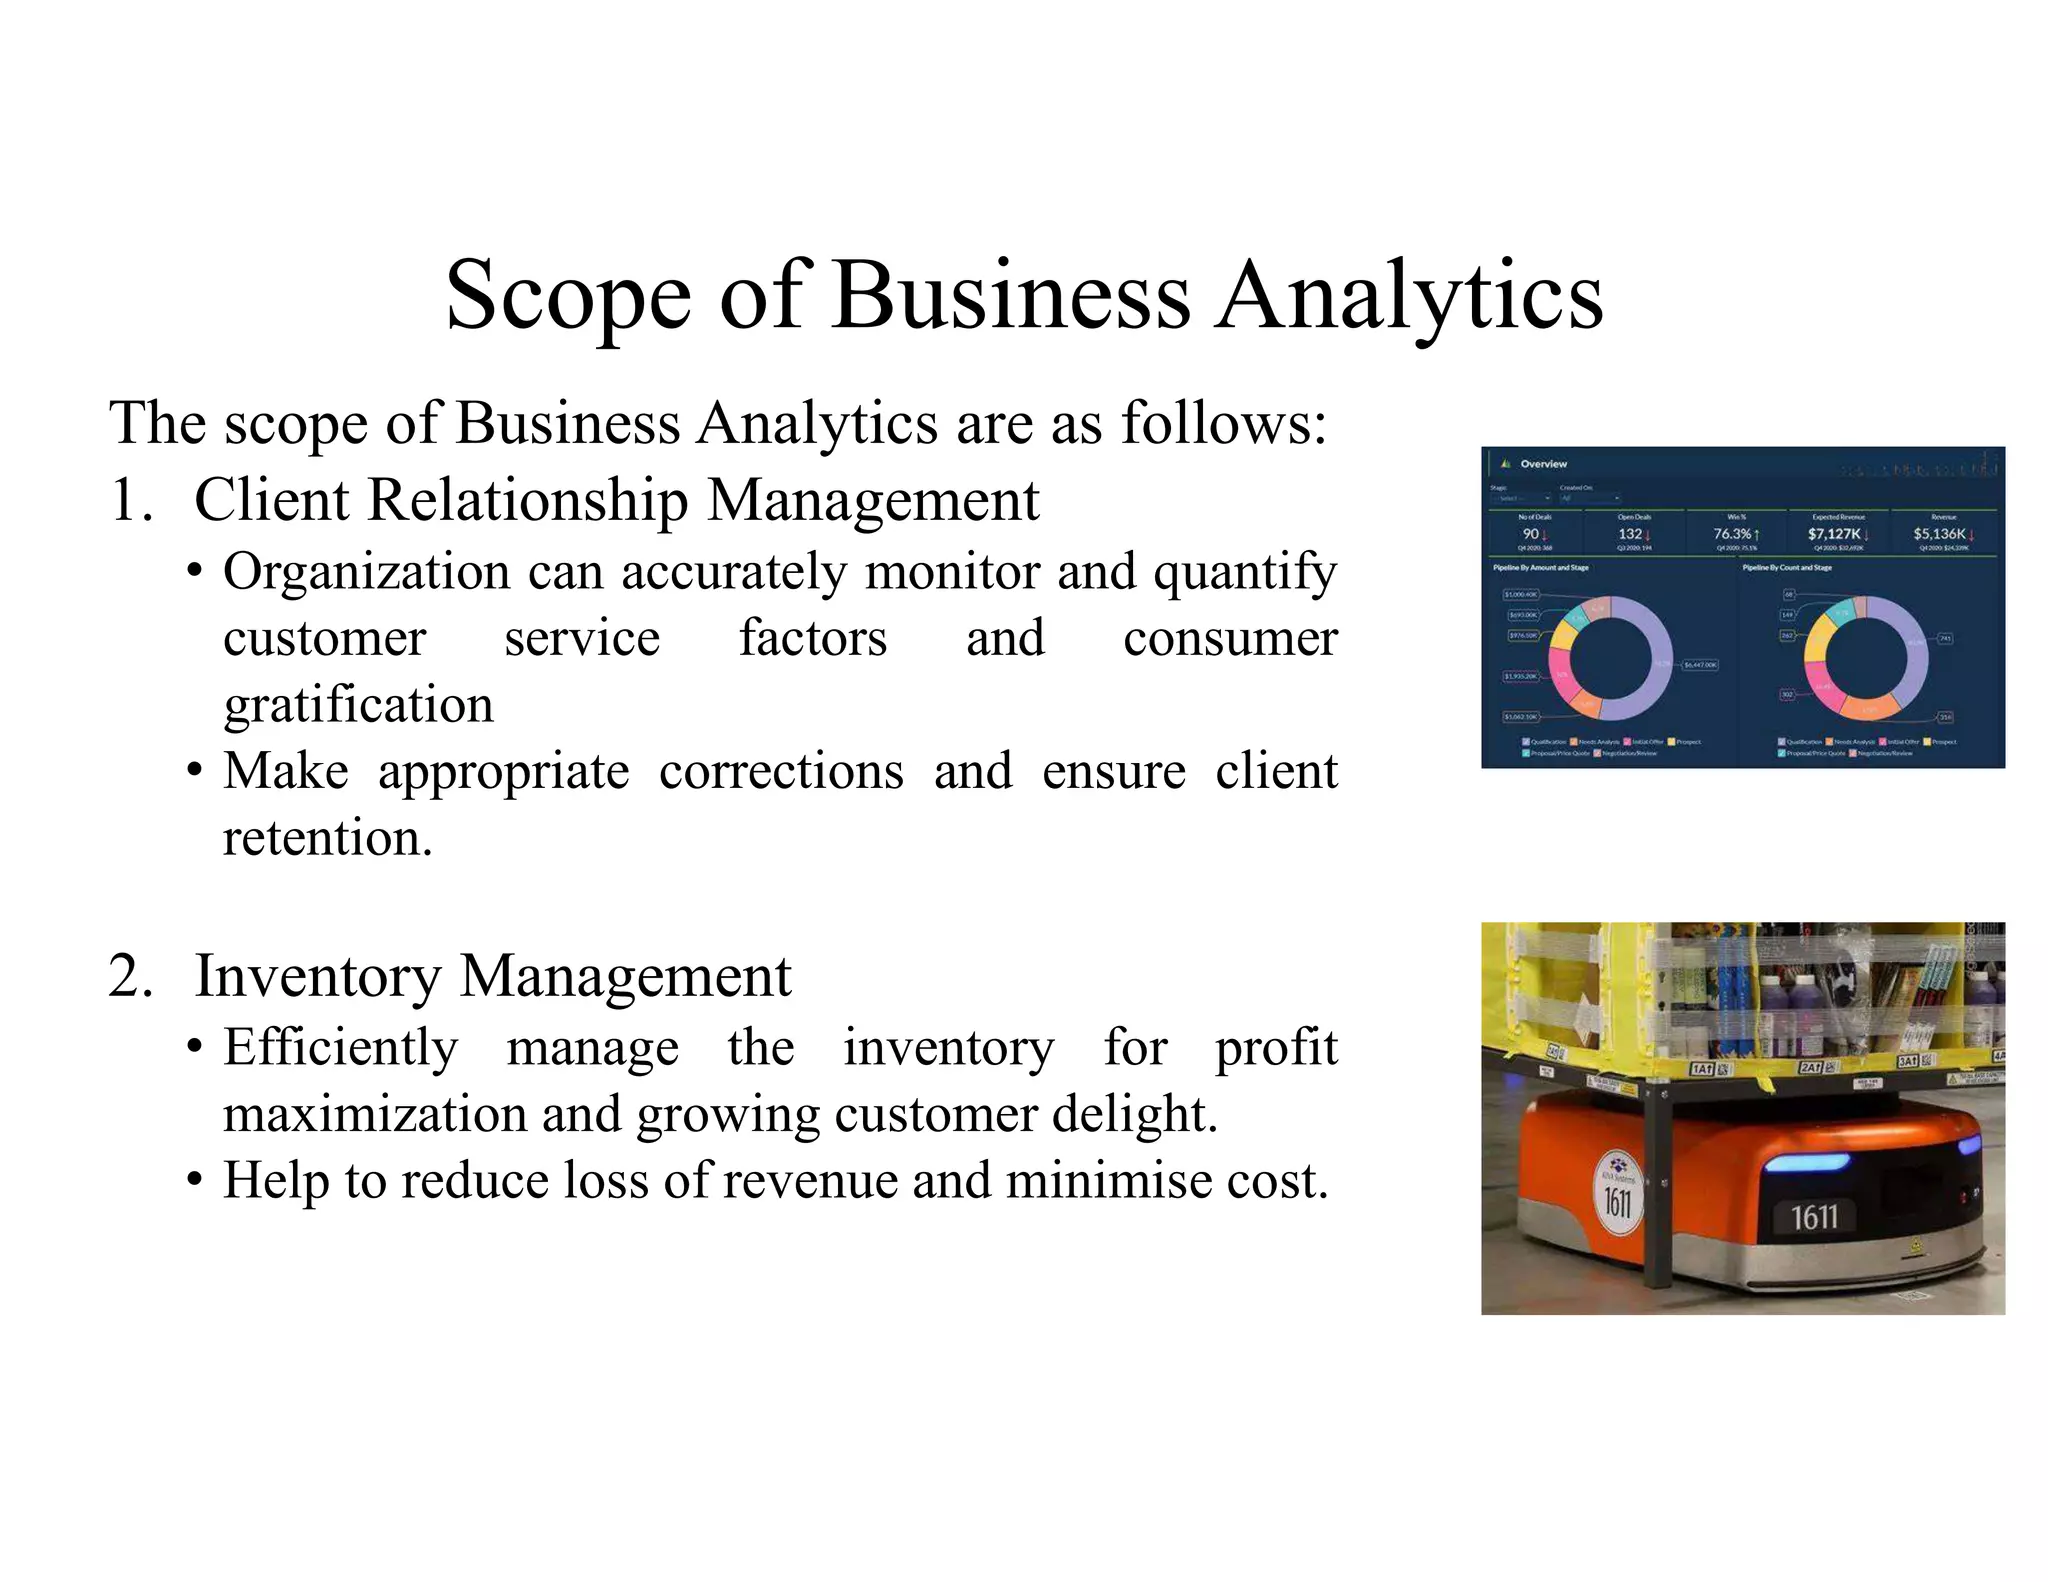
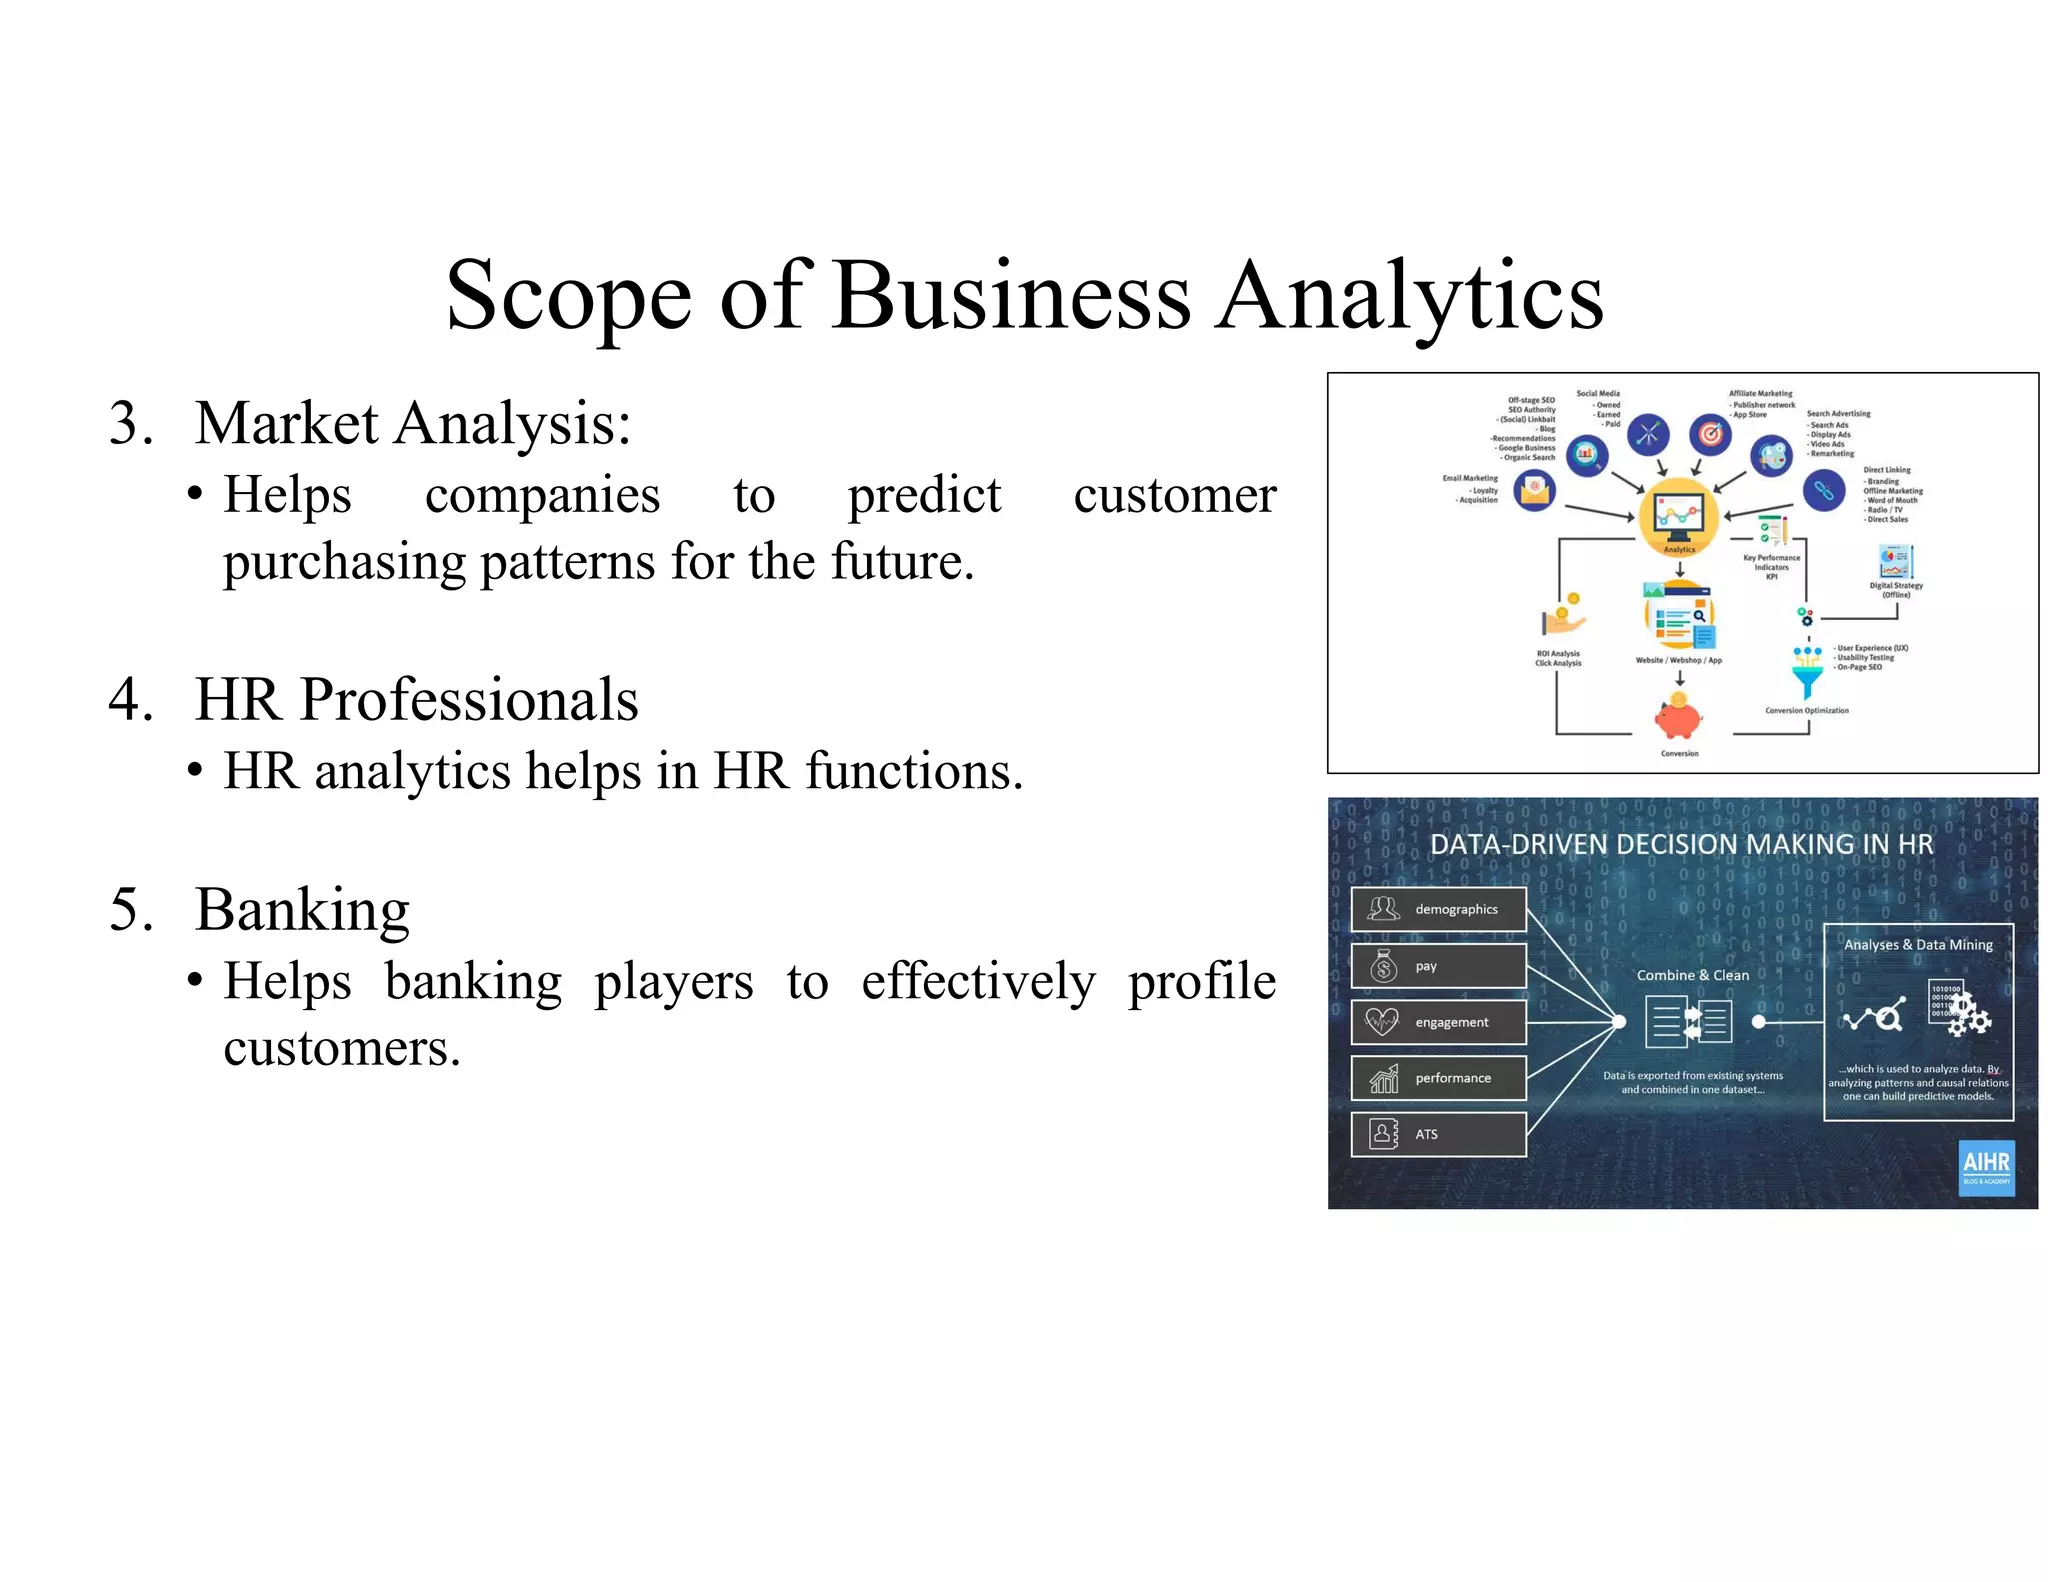
Application areas of business analytics: CRM, Inventory Management, Market Analysis, HR, and Banking.
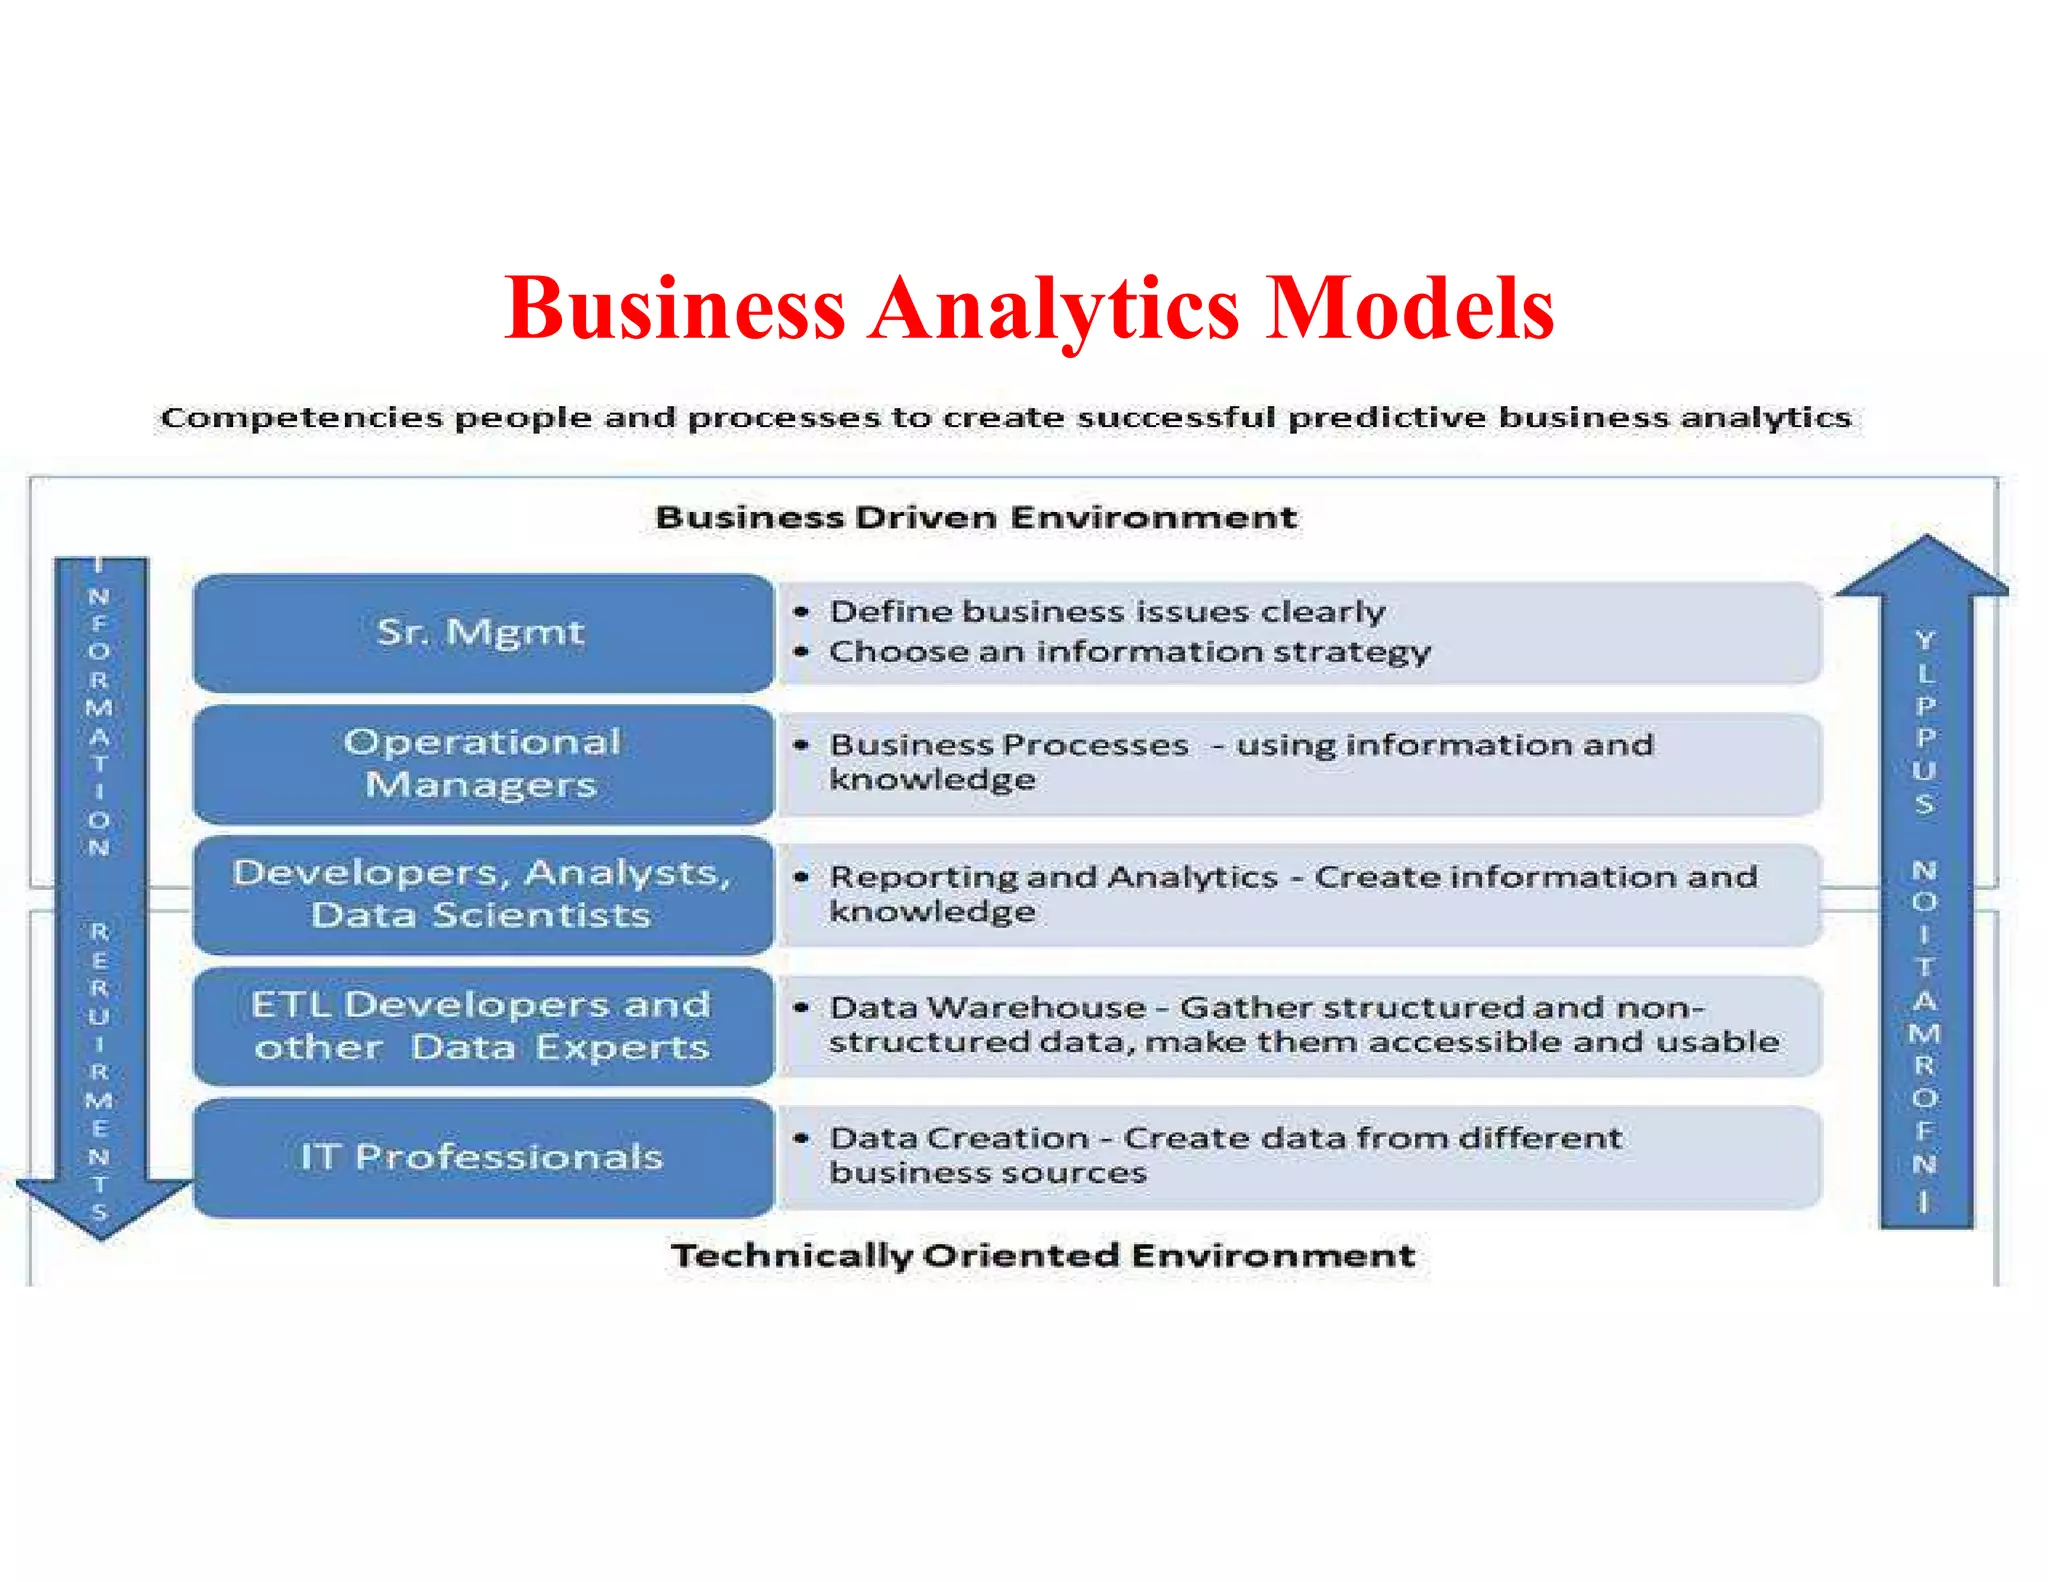
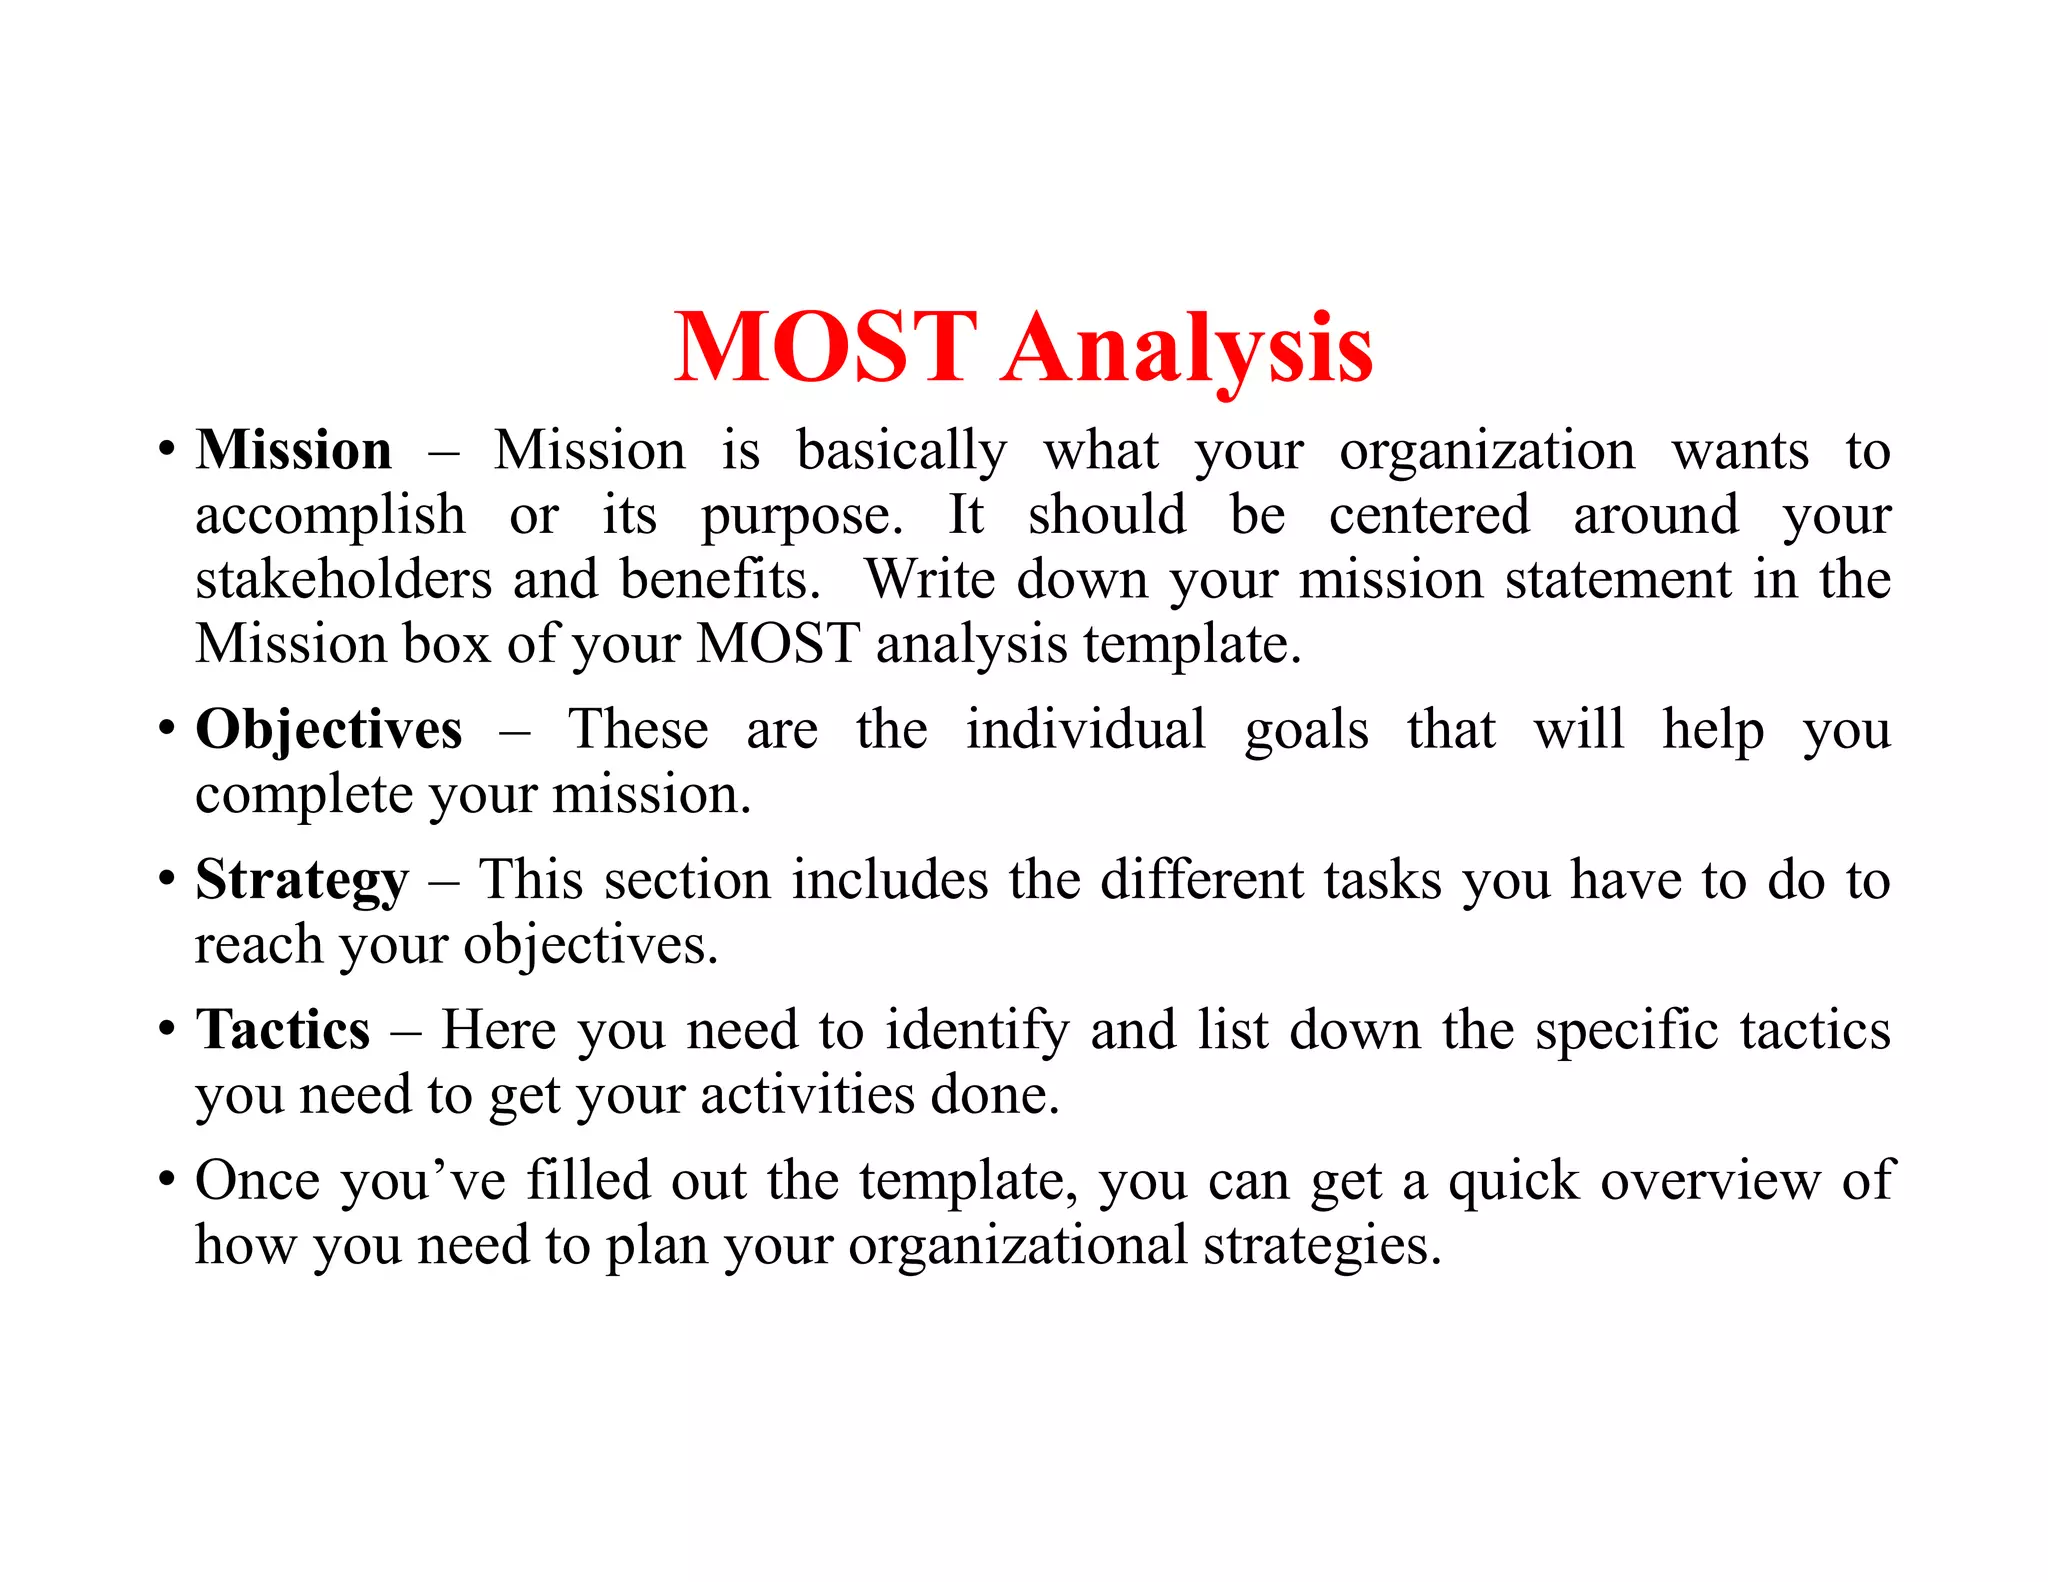
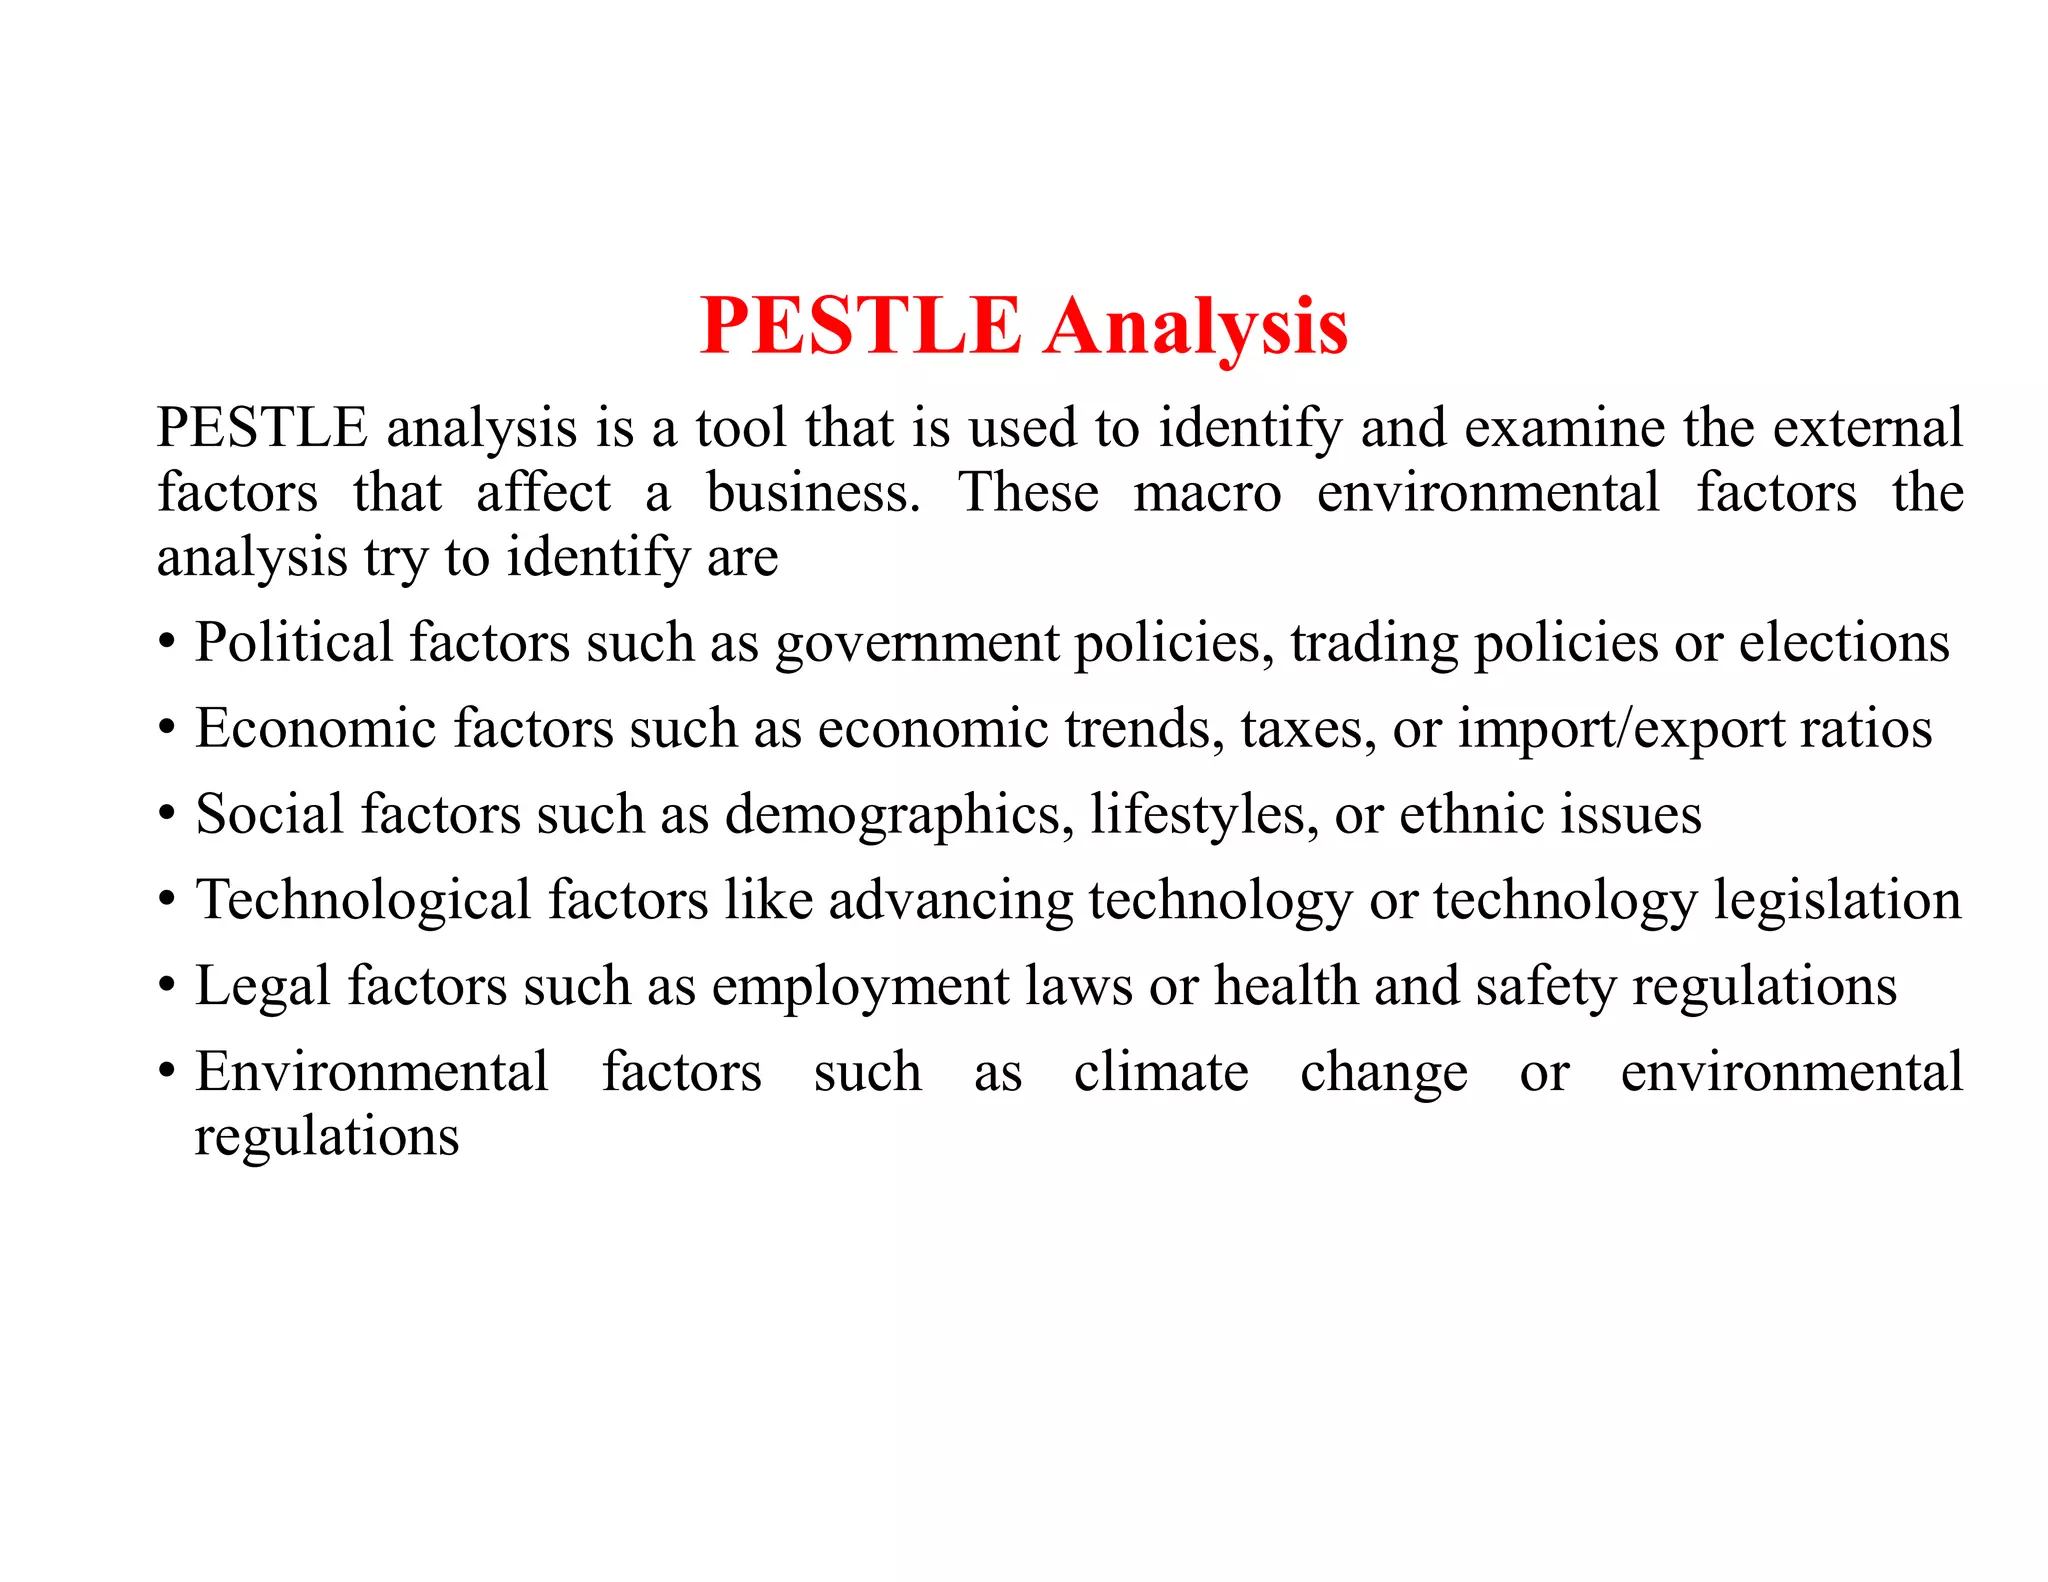
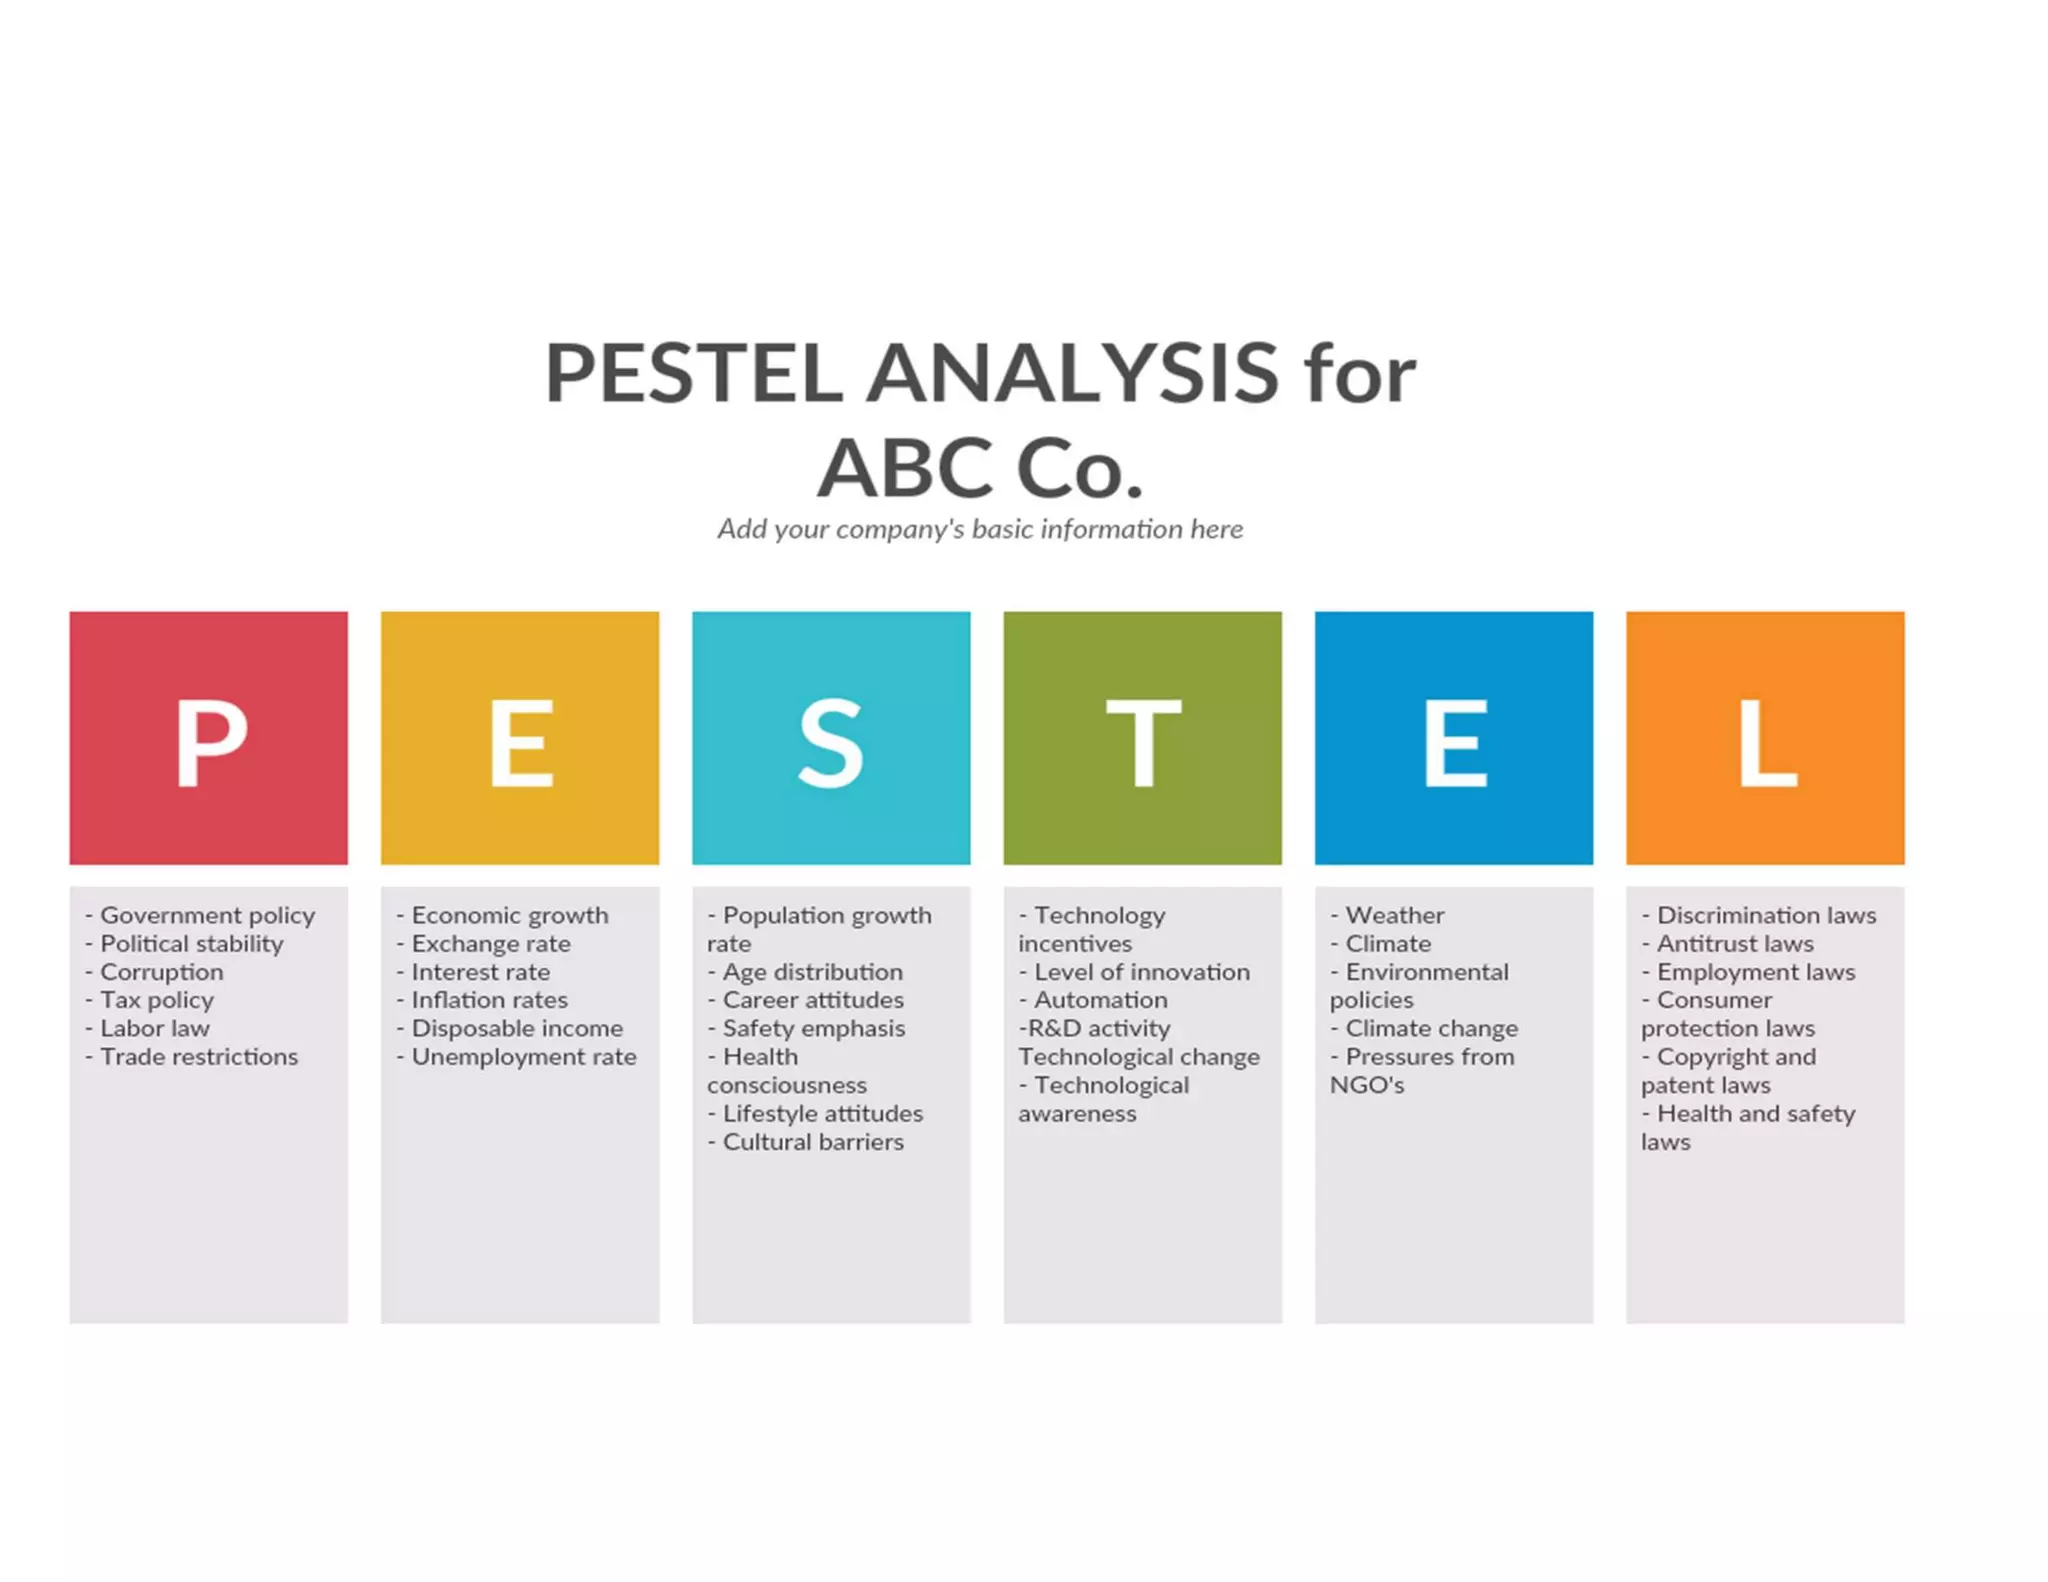
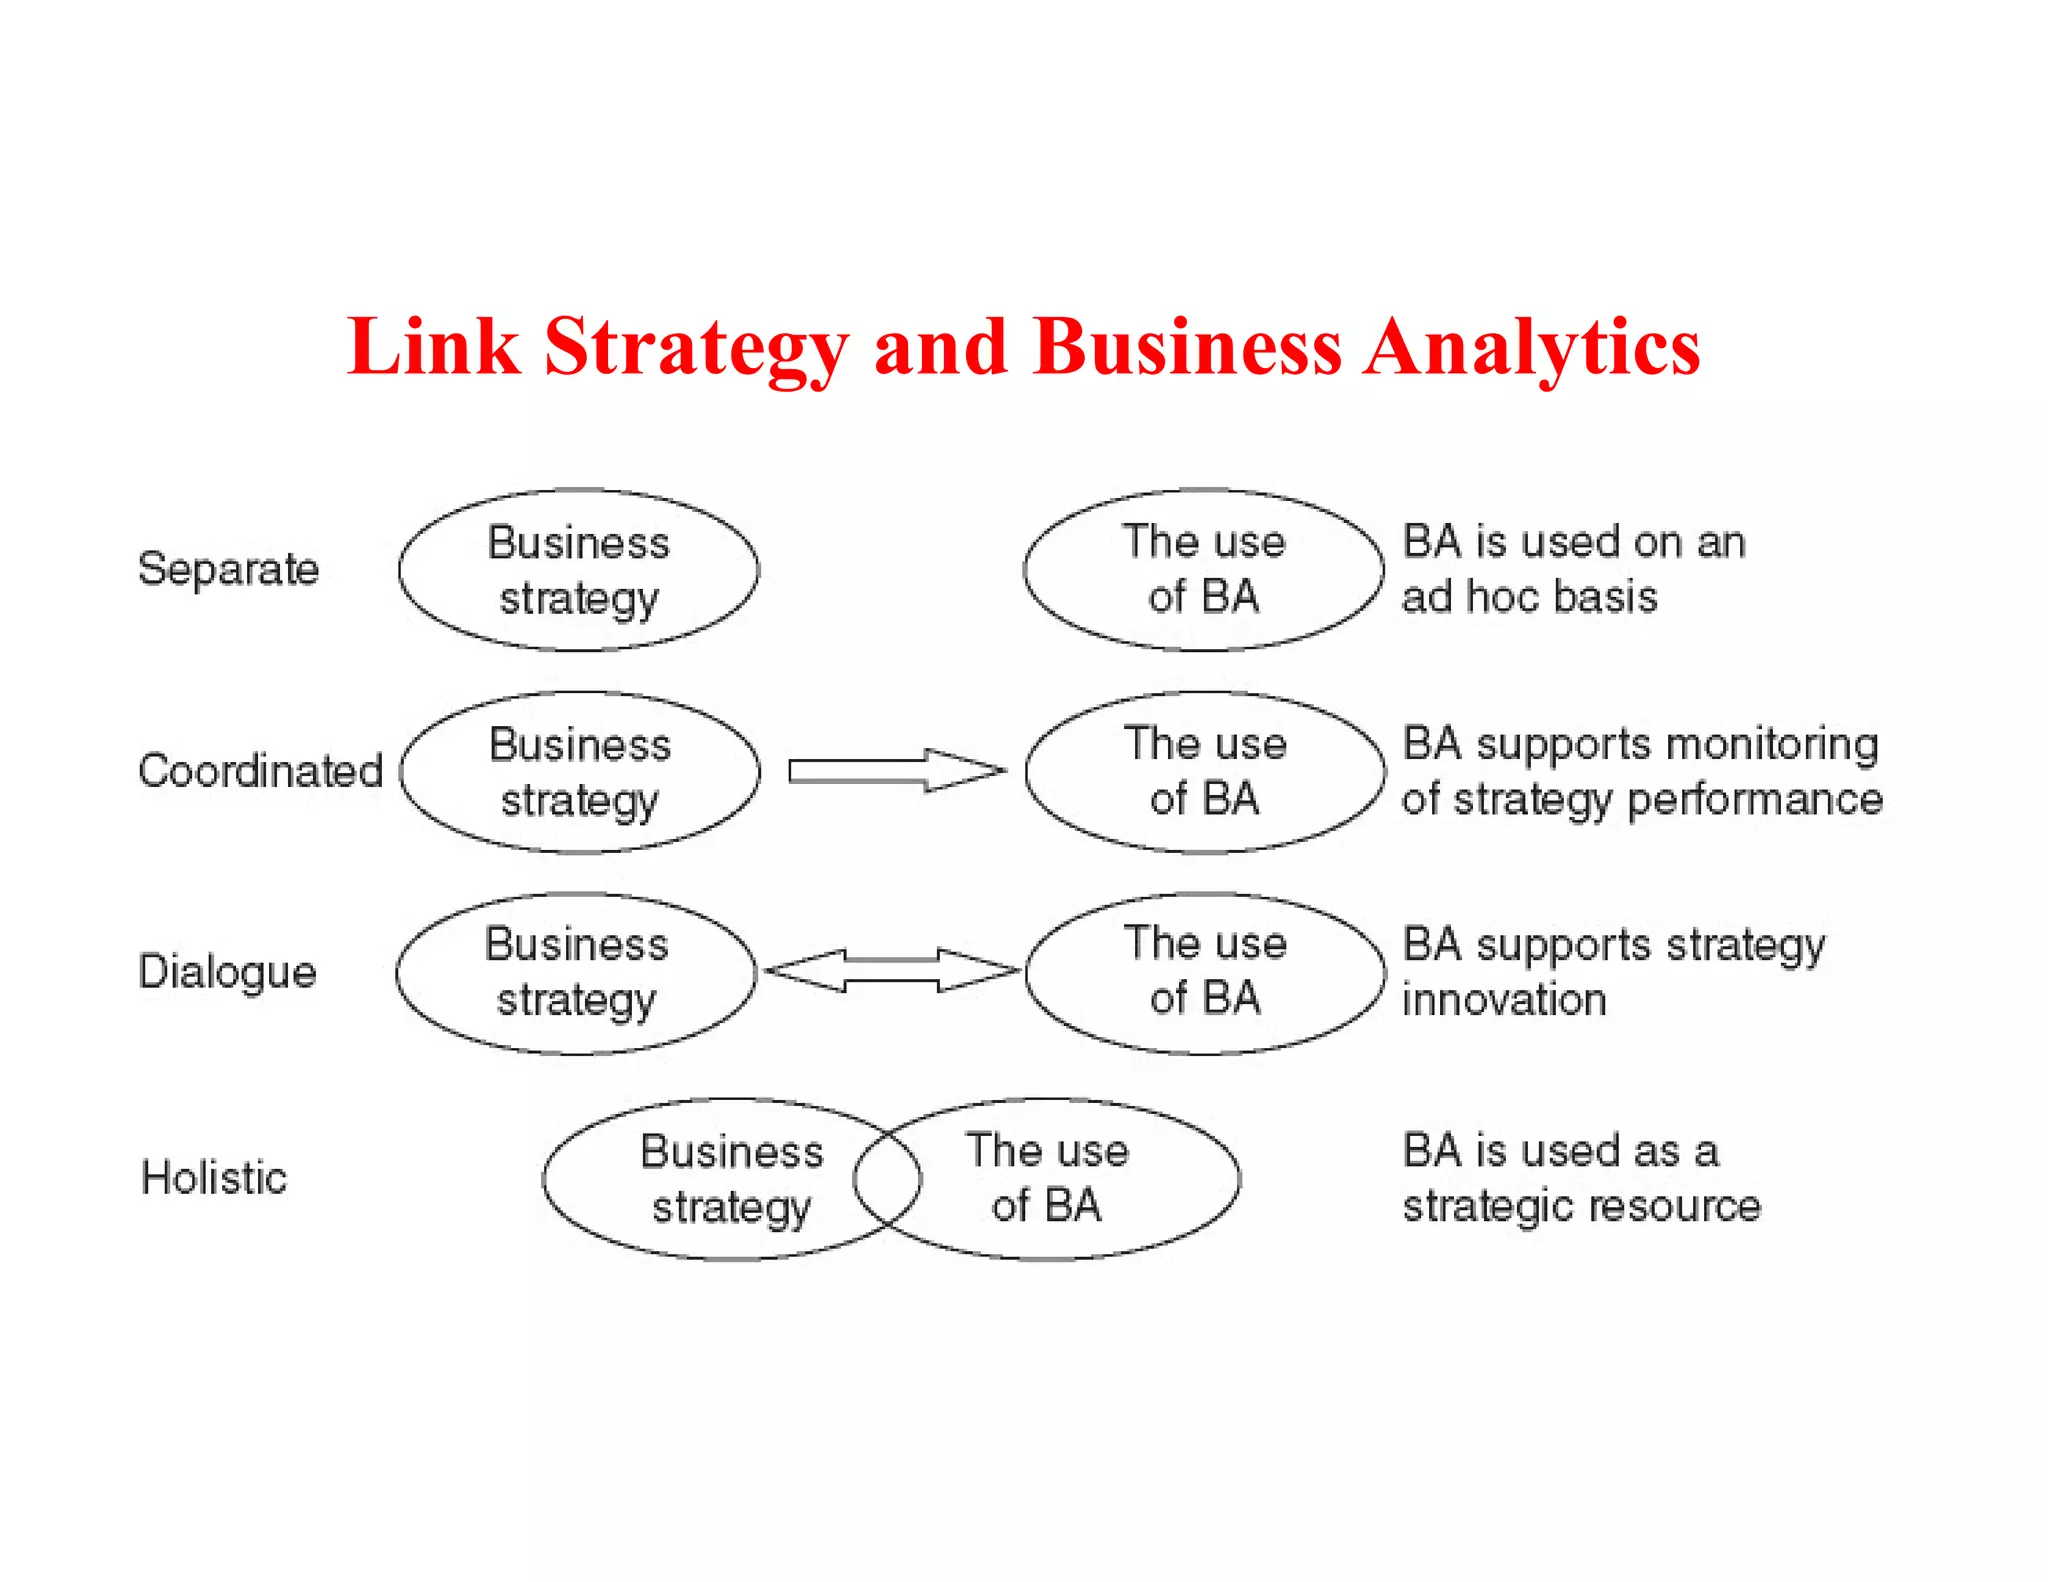
Discussion of models and strategic tools like MOST and PESTLE analysis for evaluating business conditions.
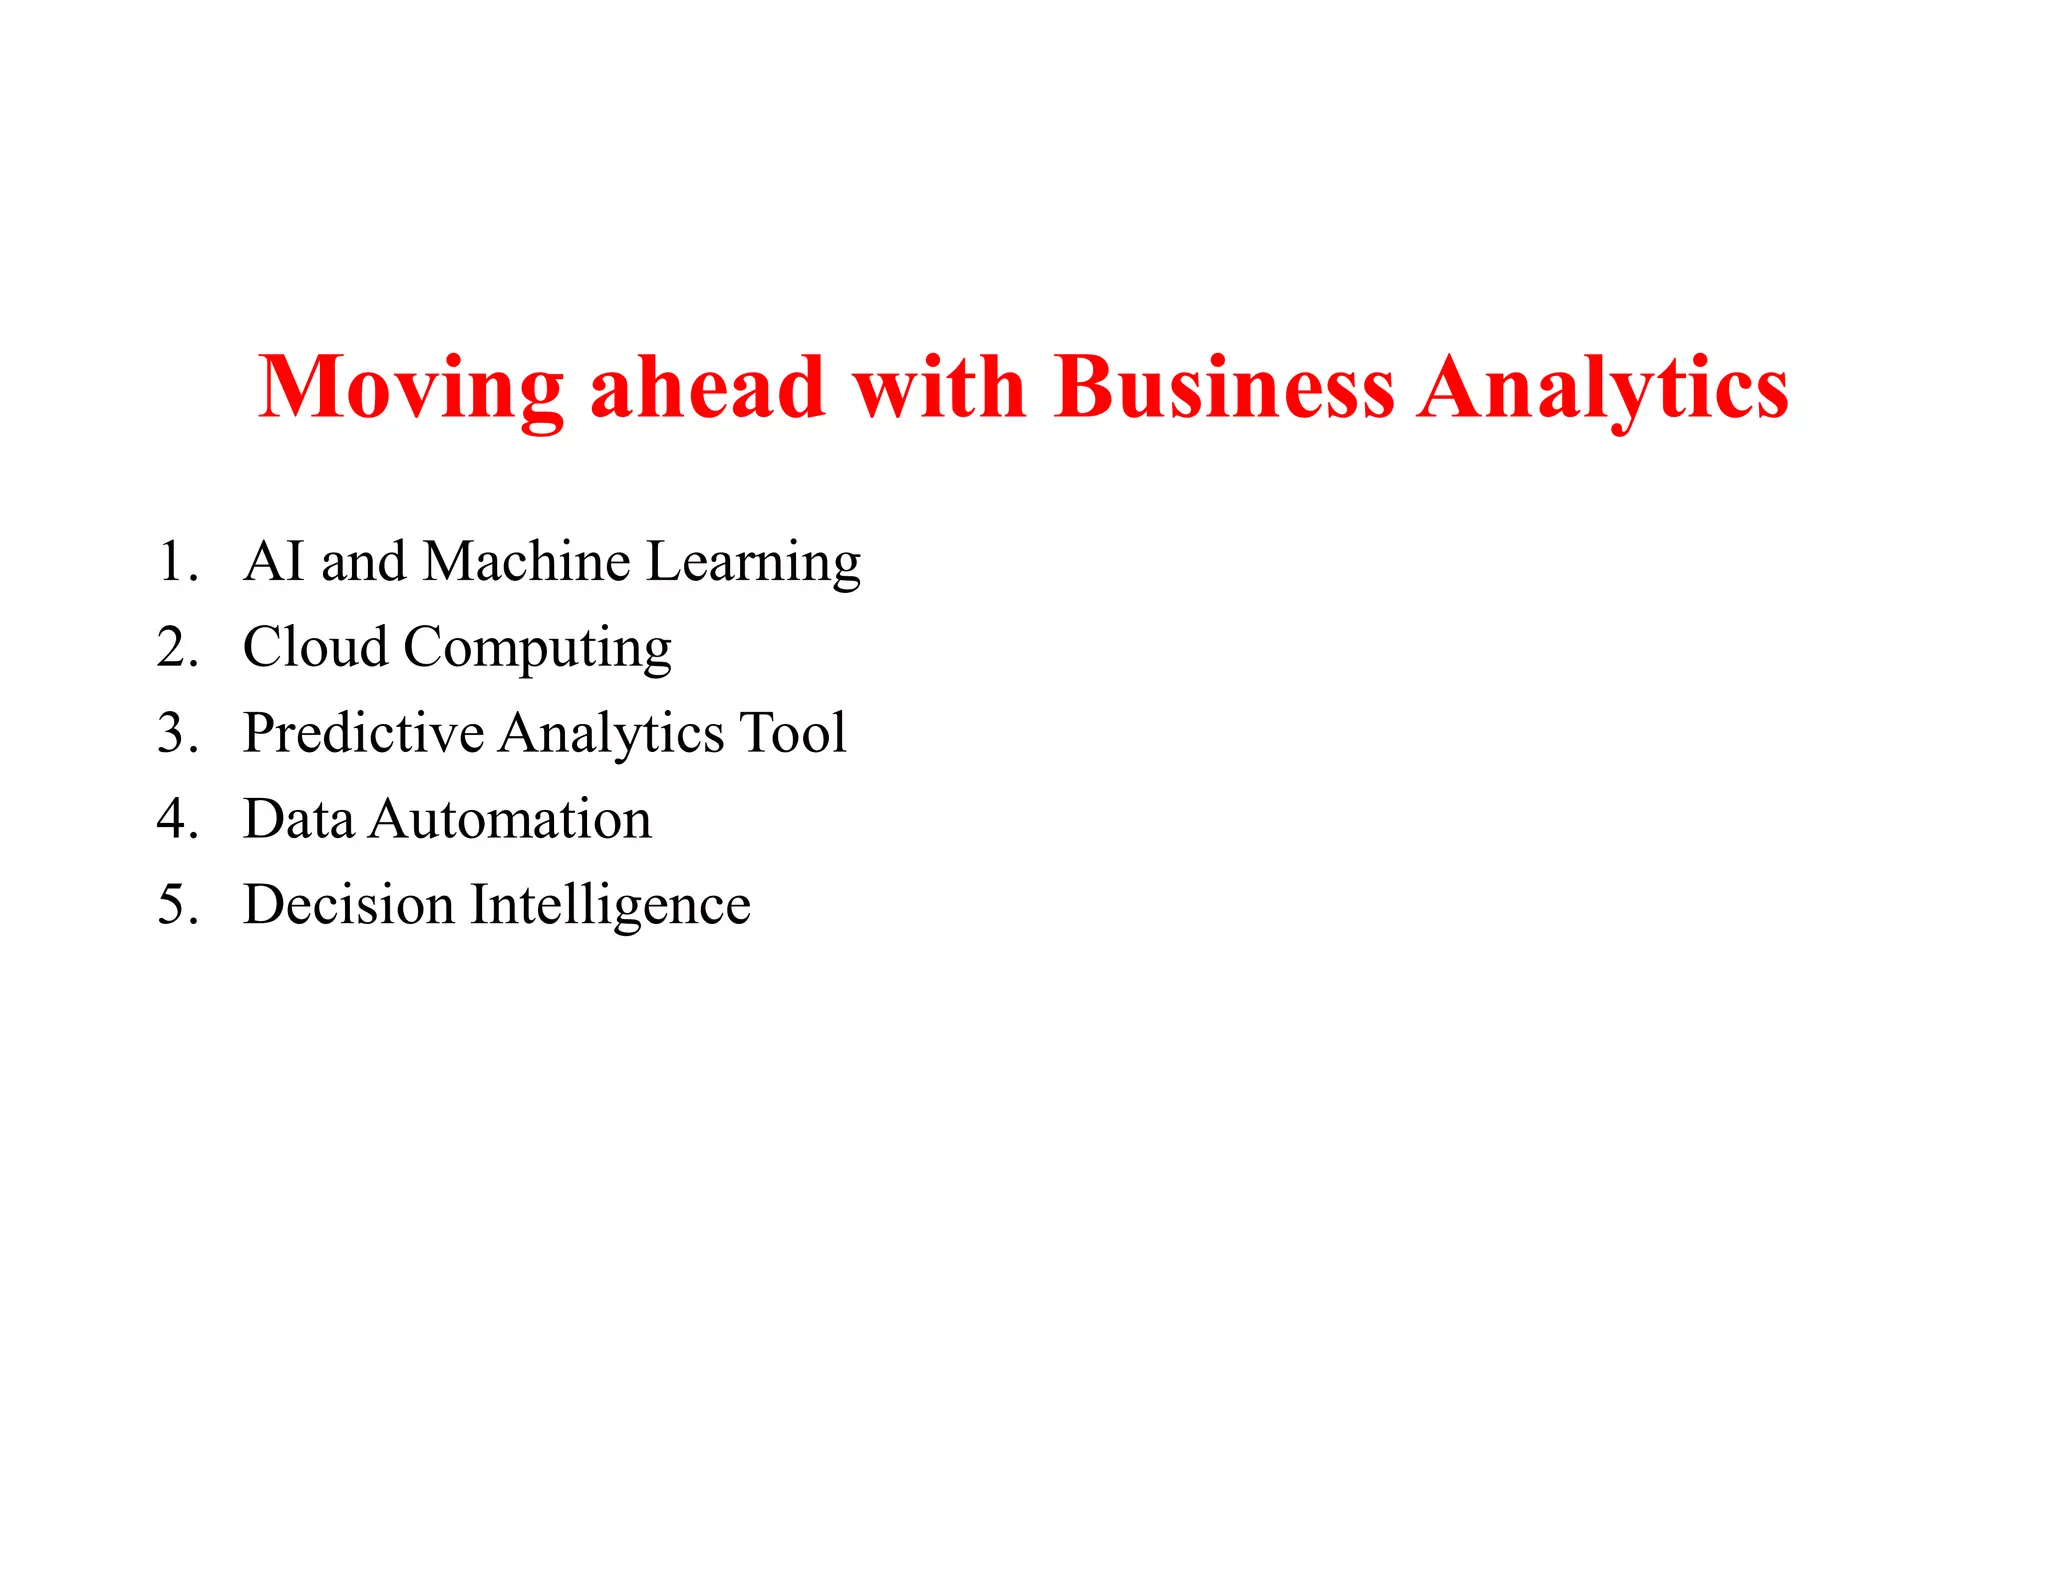
Moving forward with business analytics through AI, cloud computing, predictive tools, data automation.