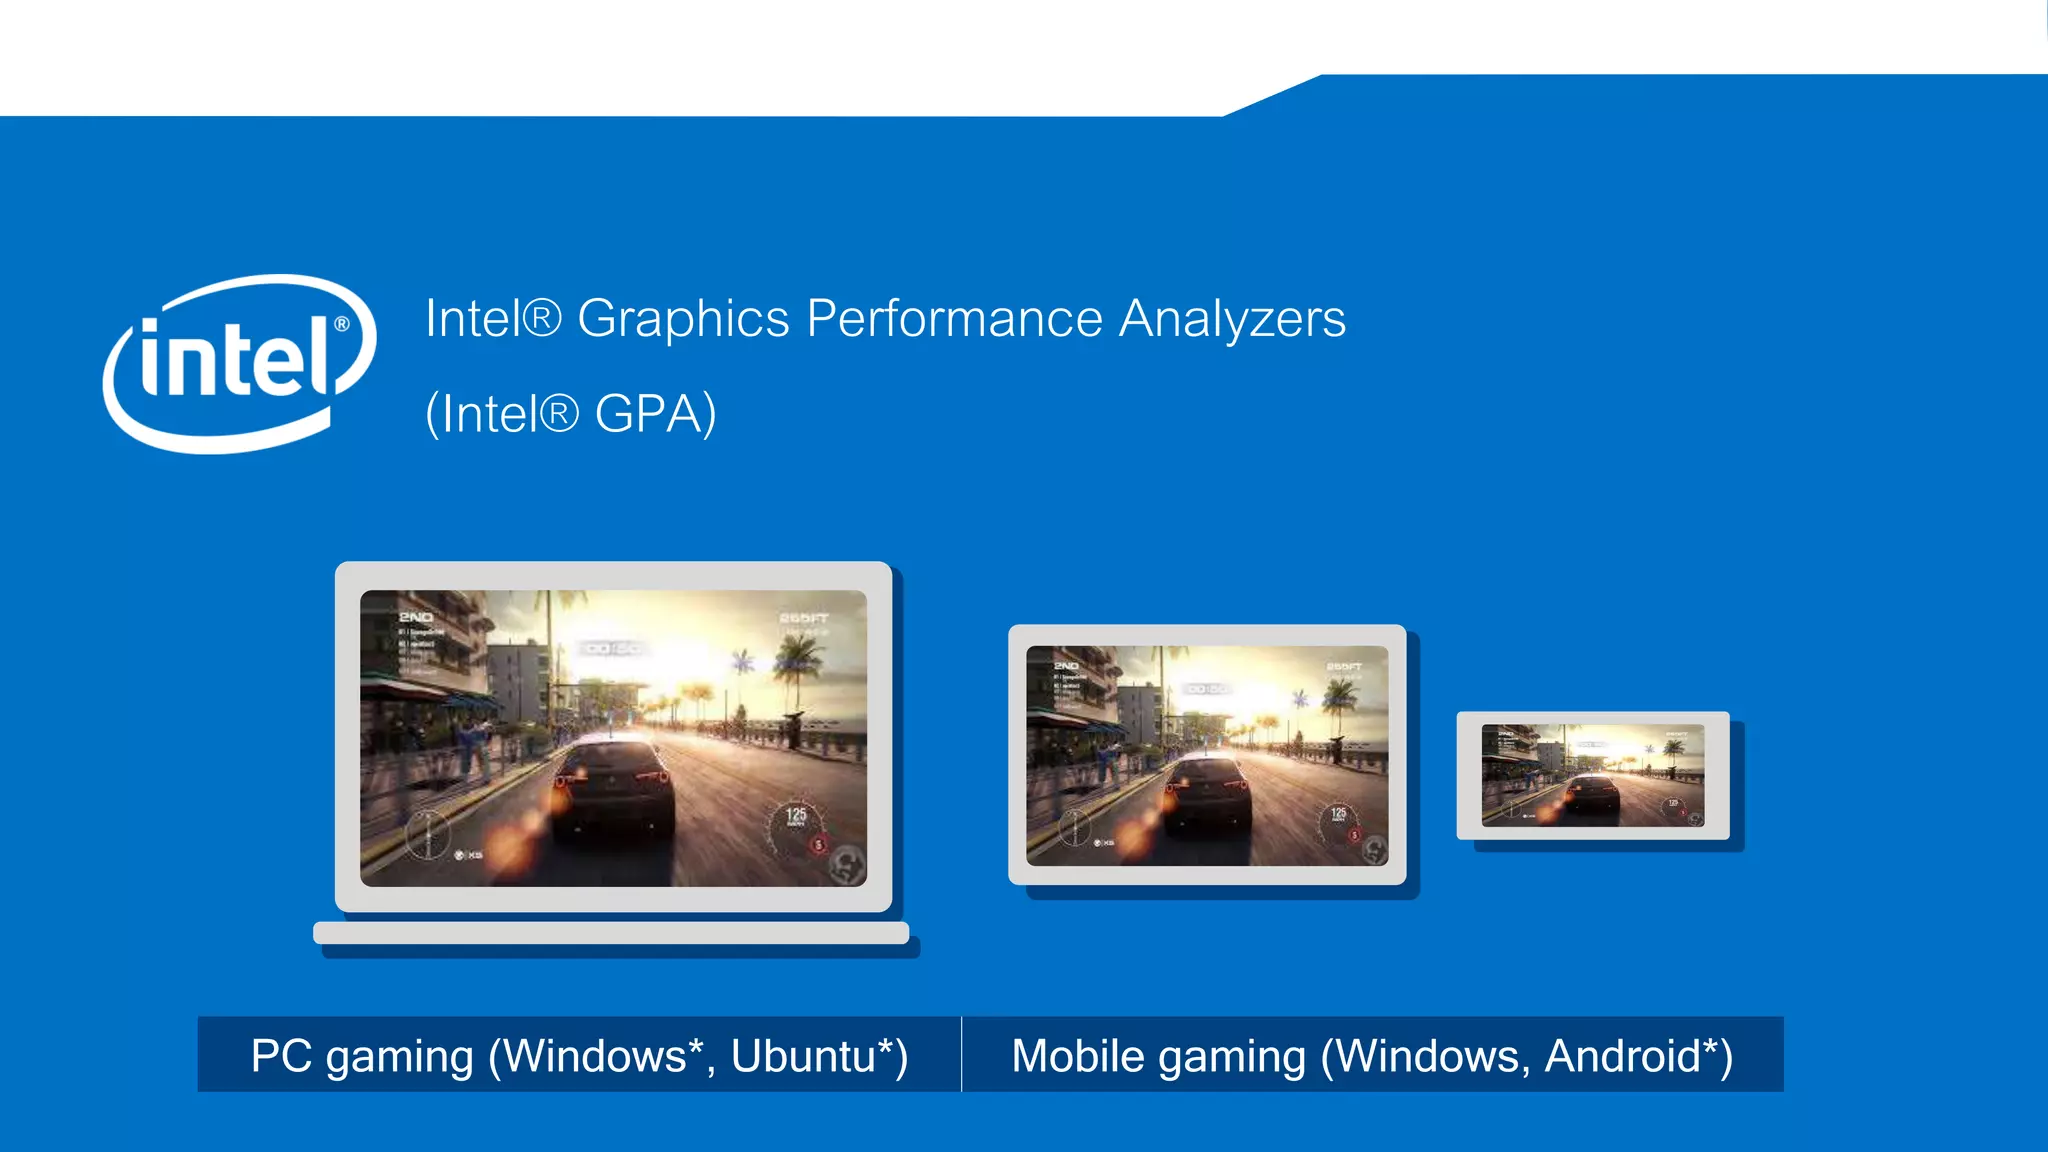
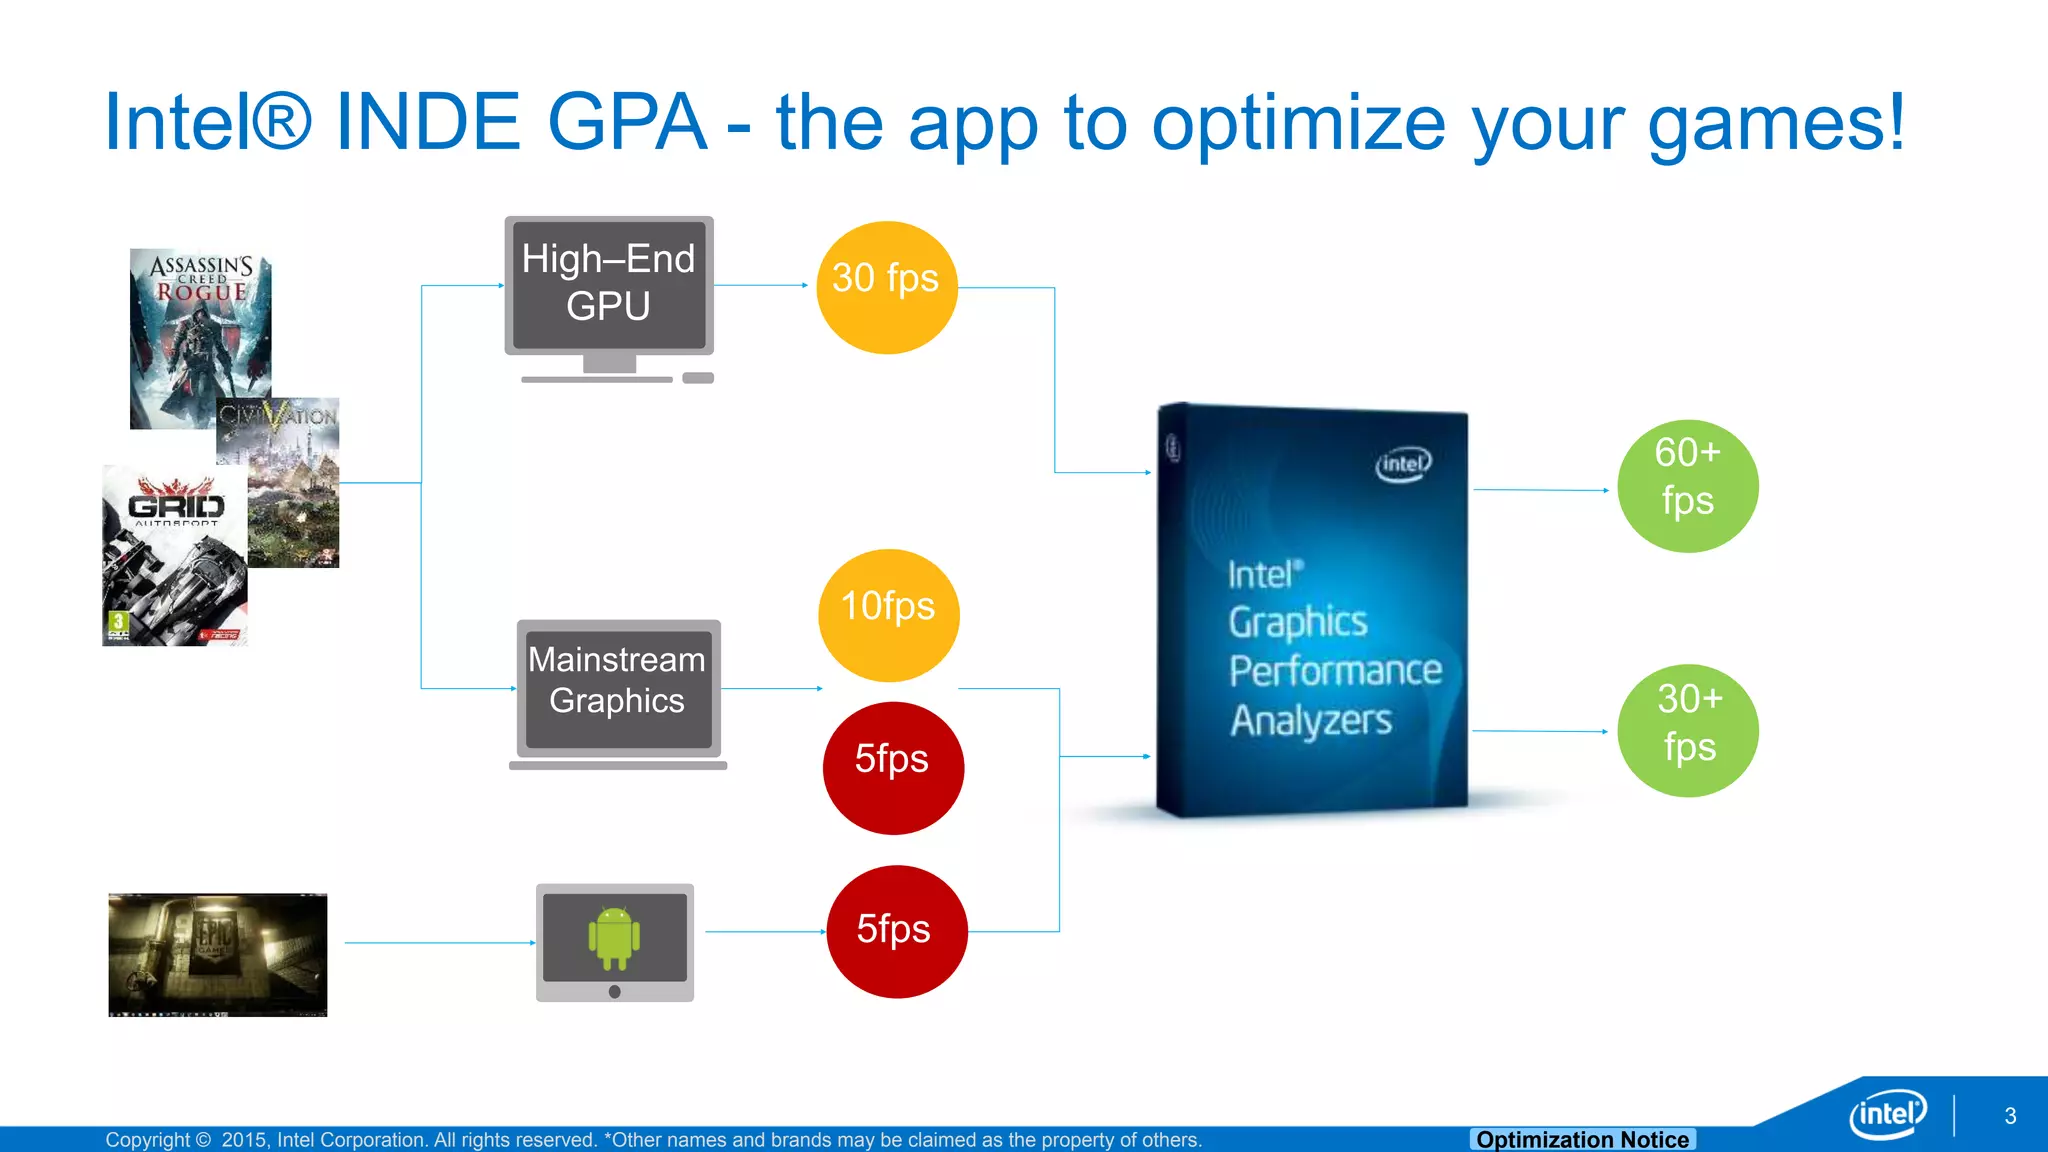
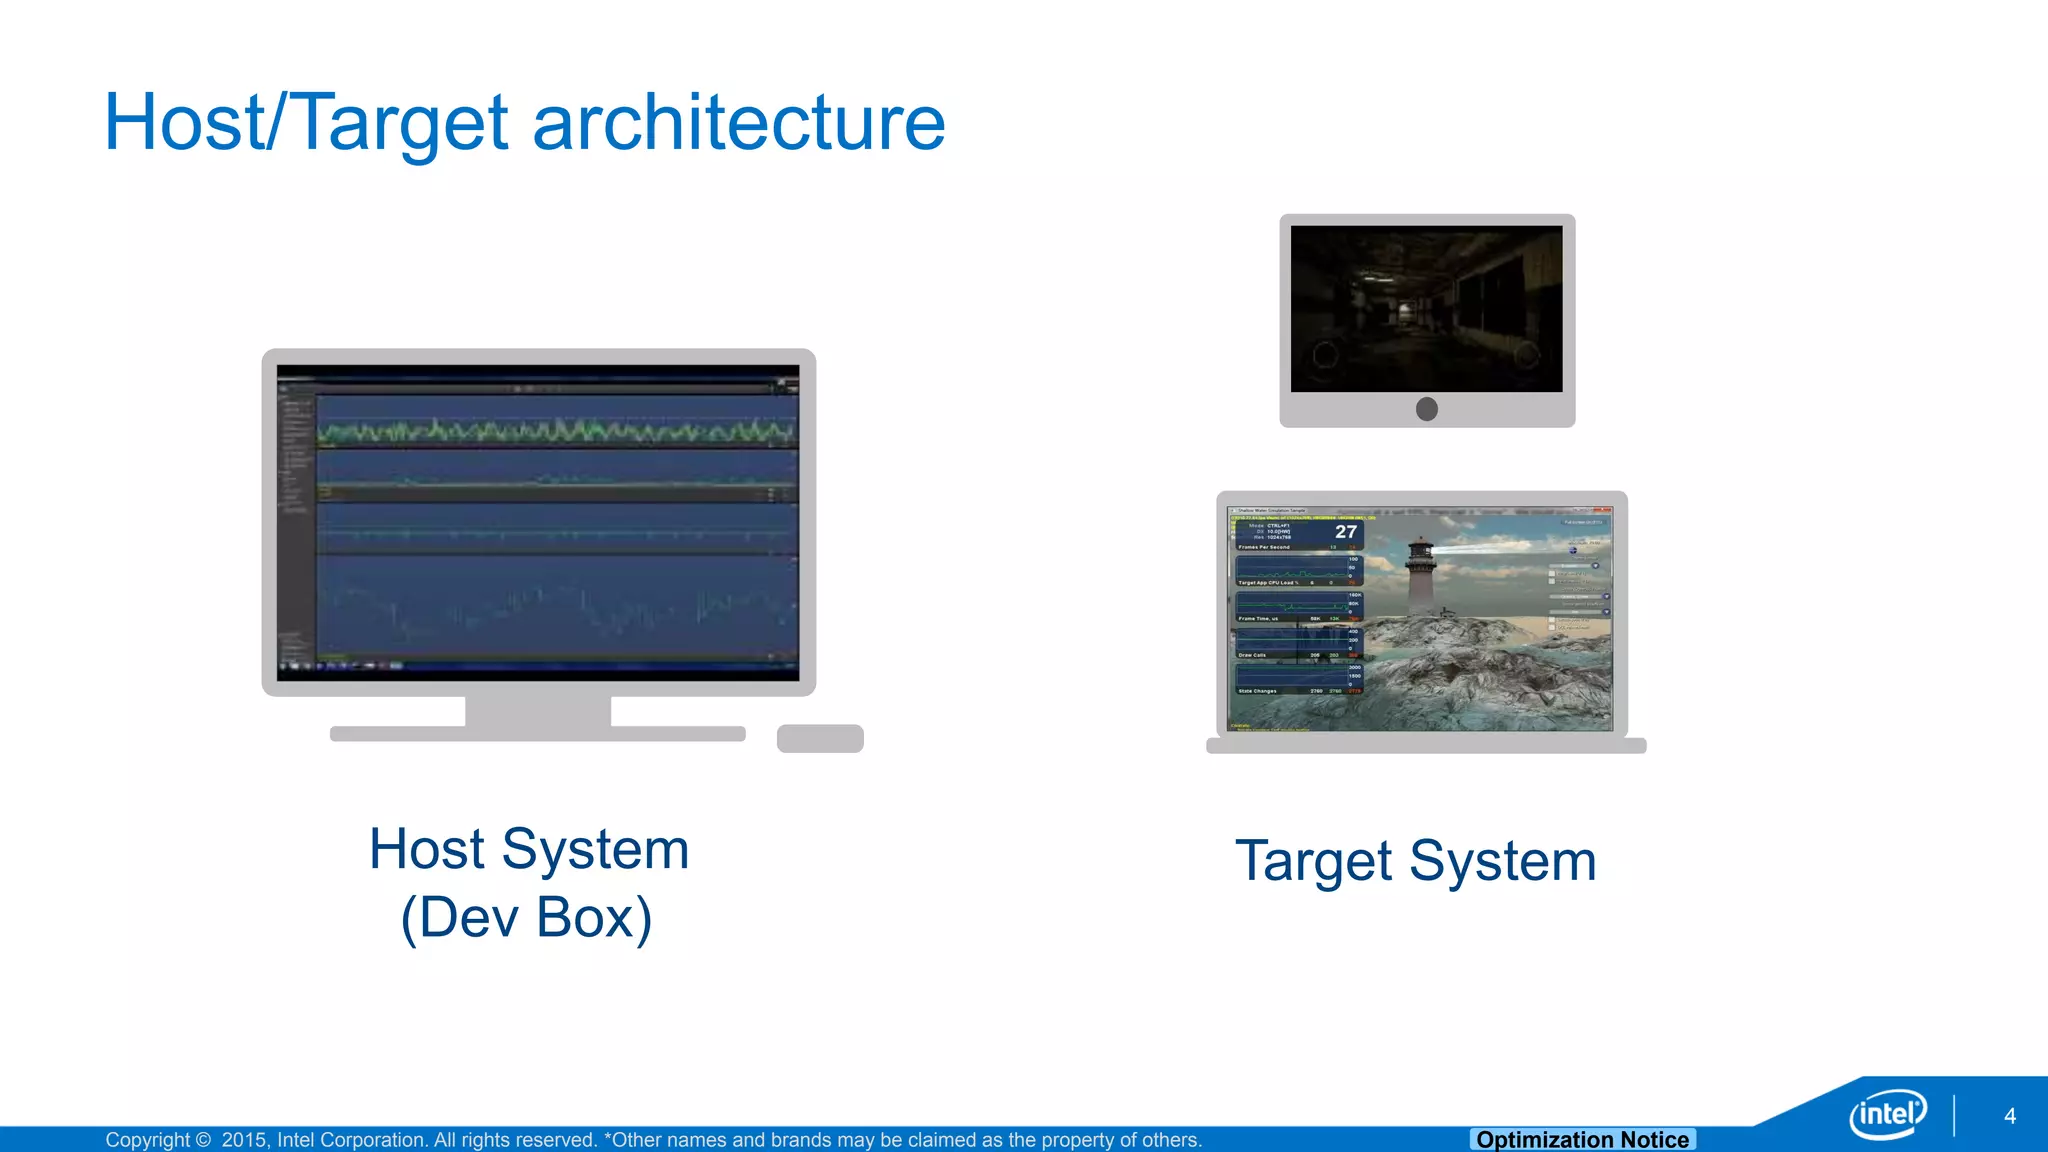
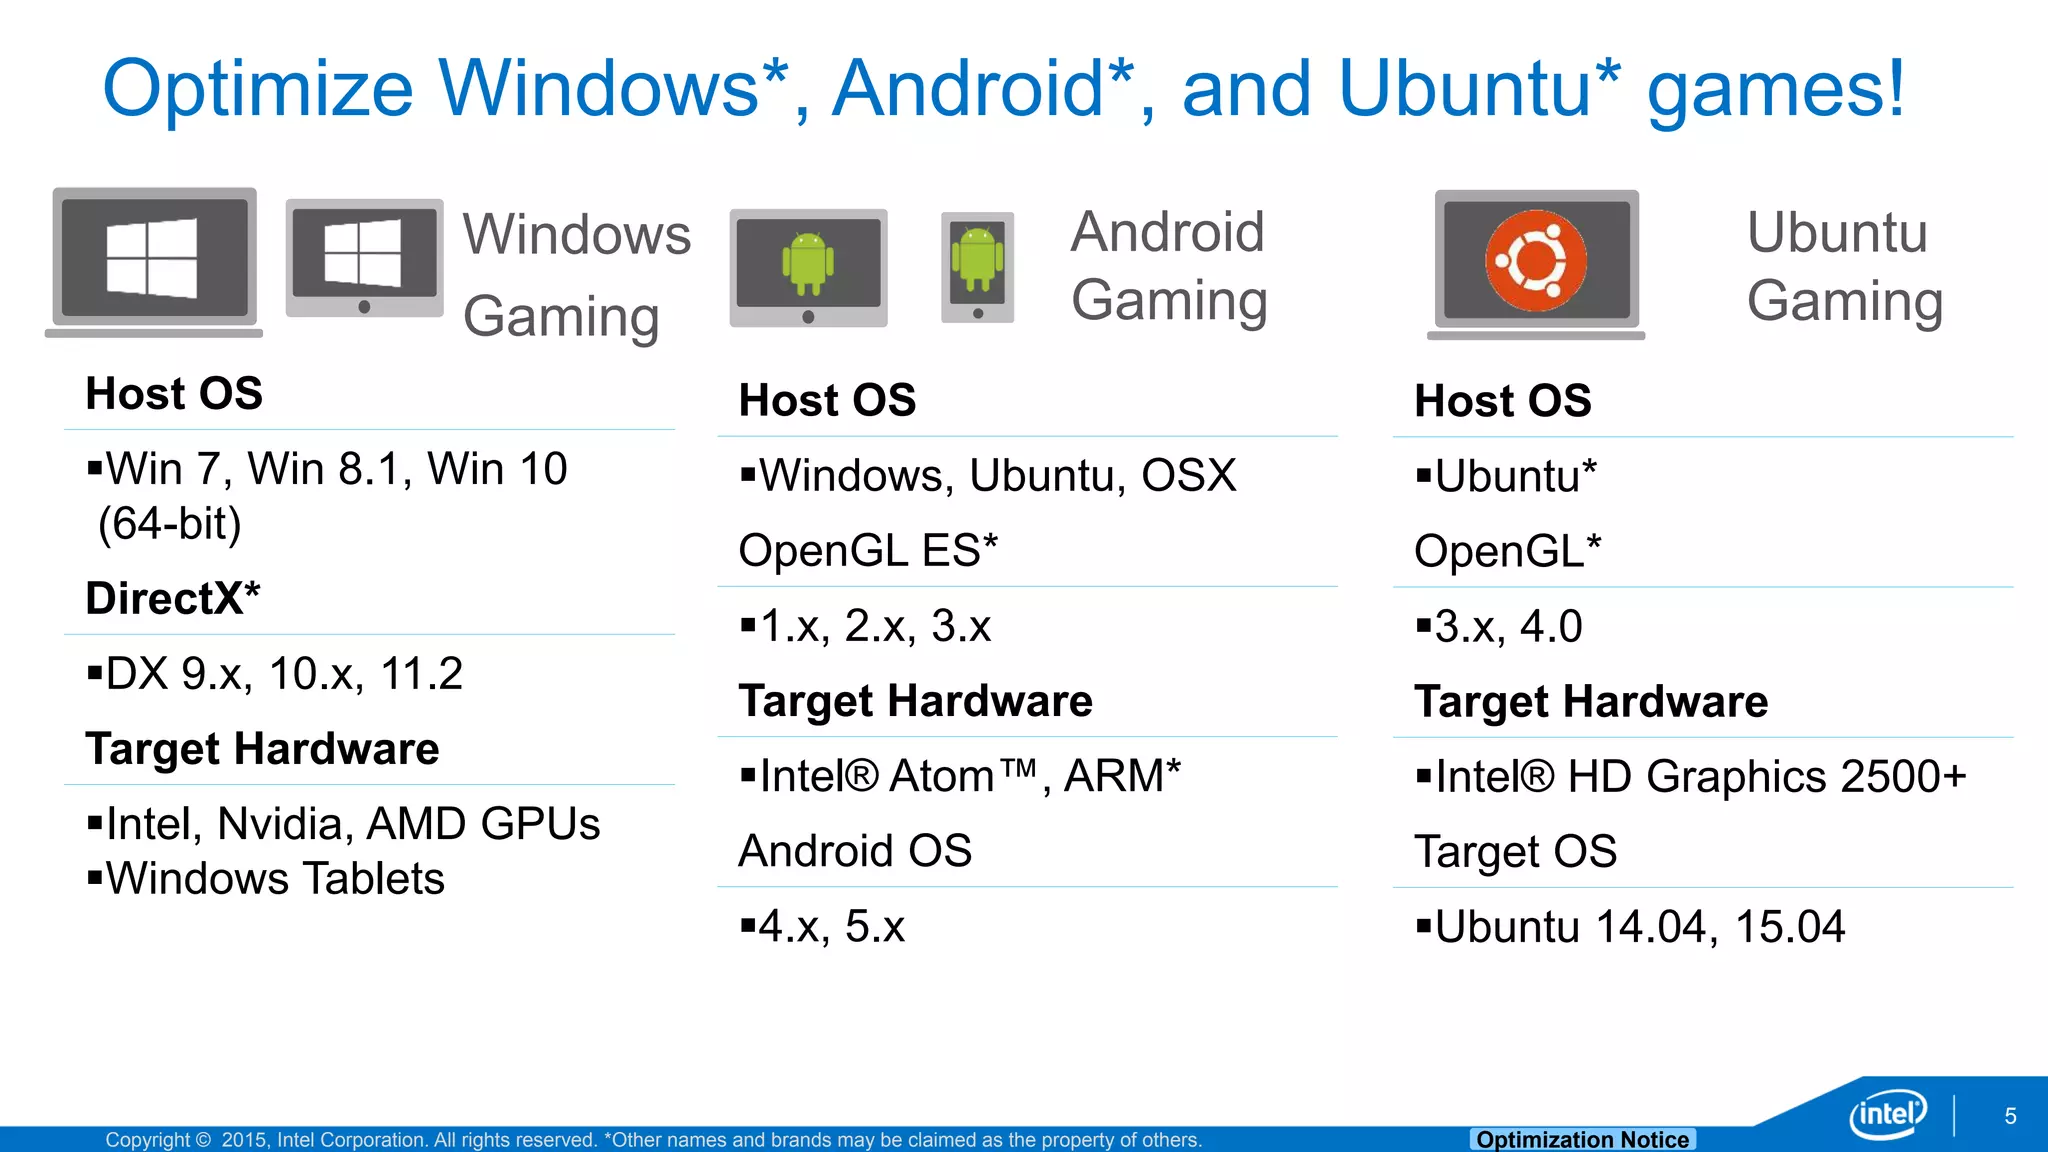
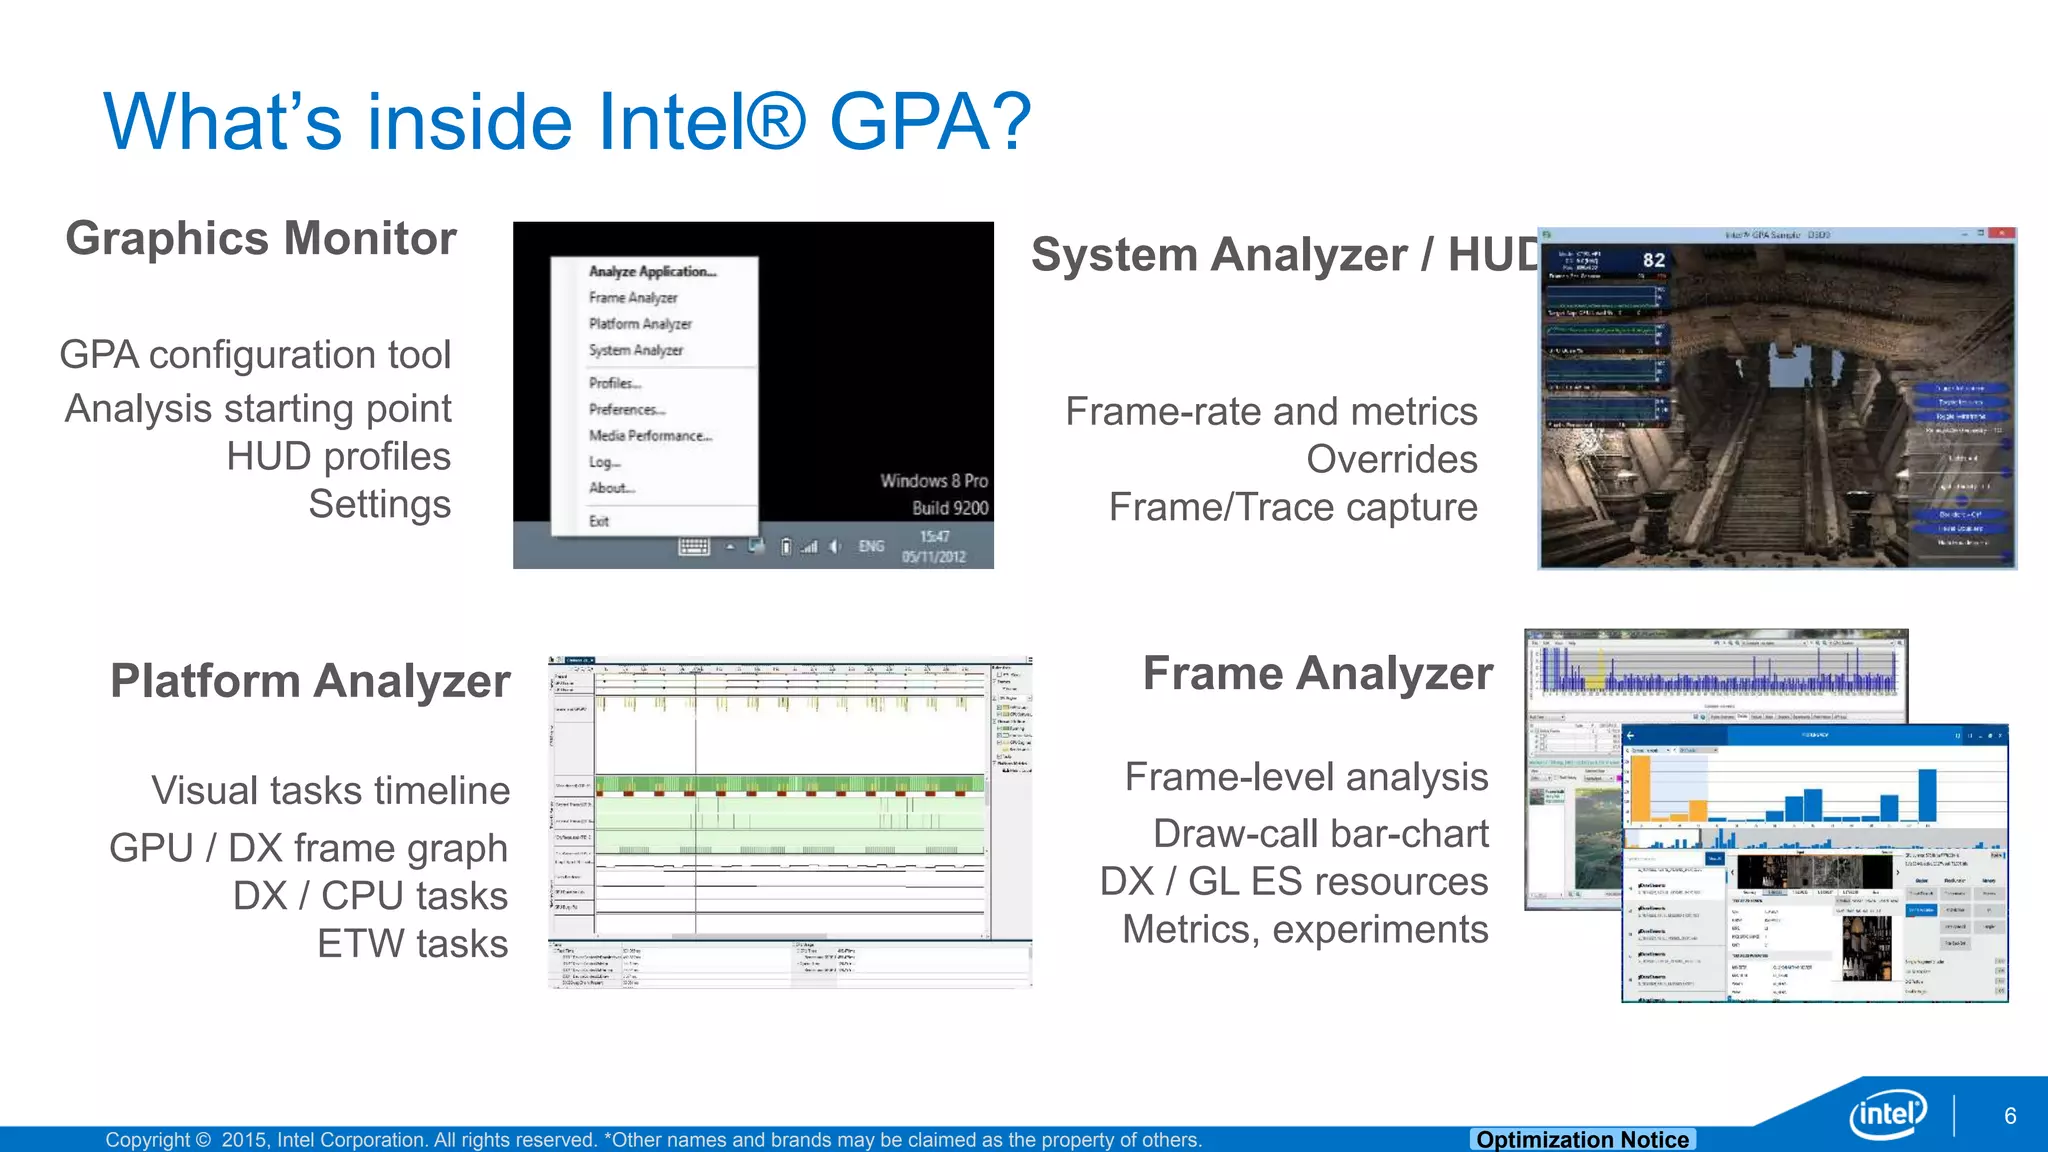
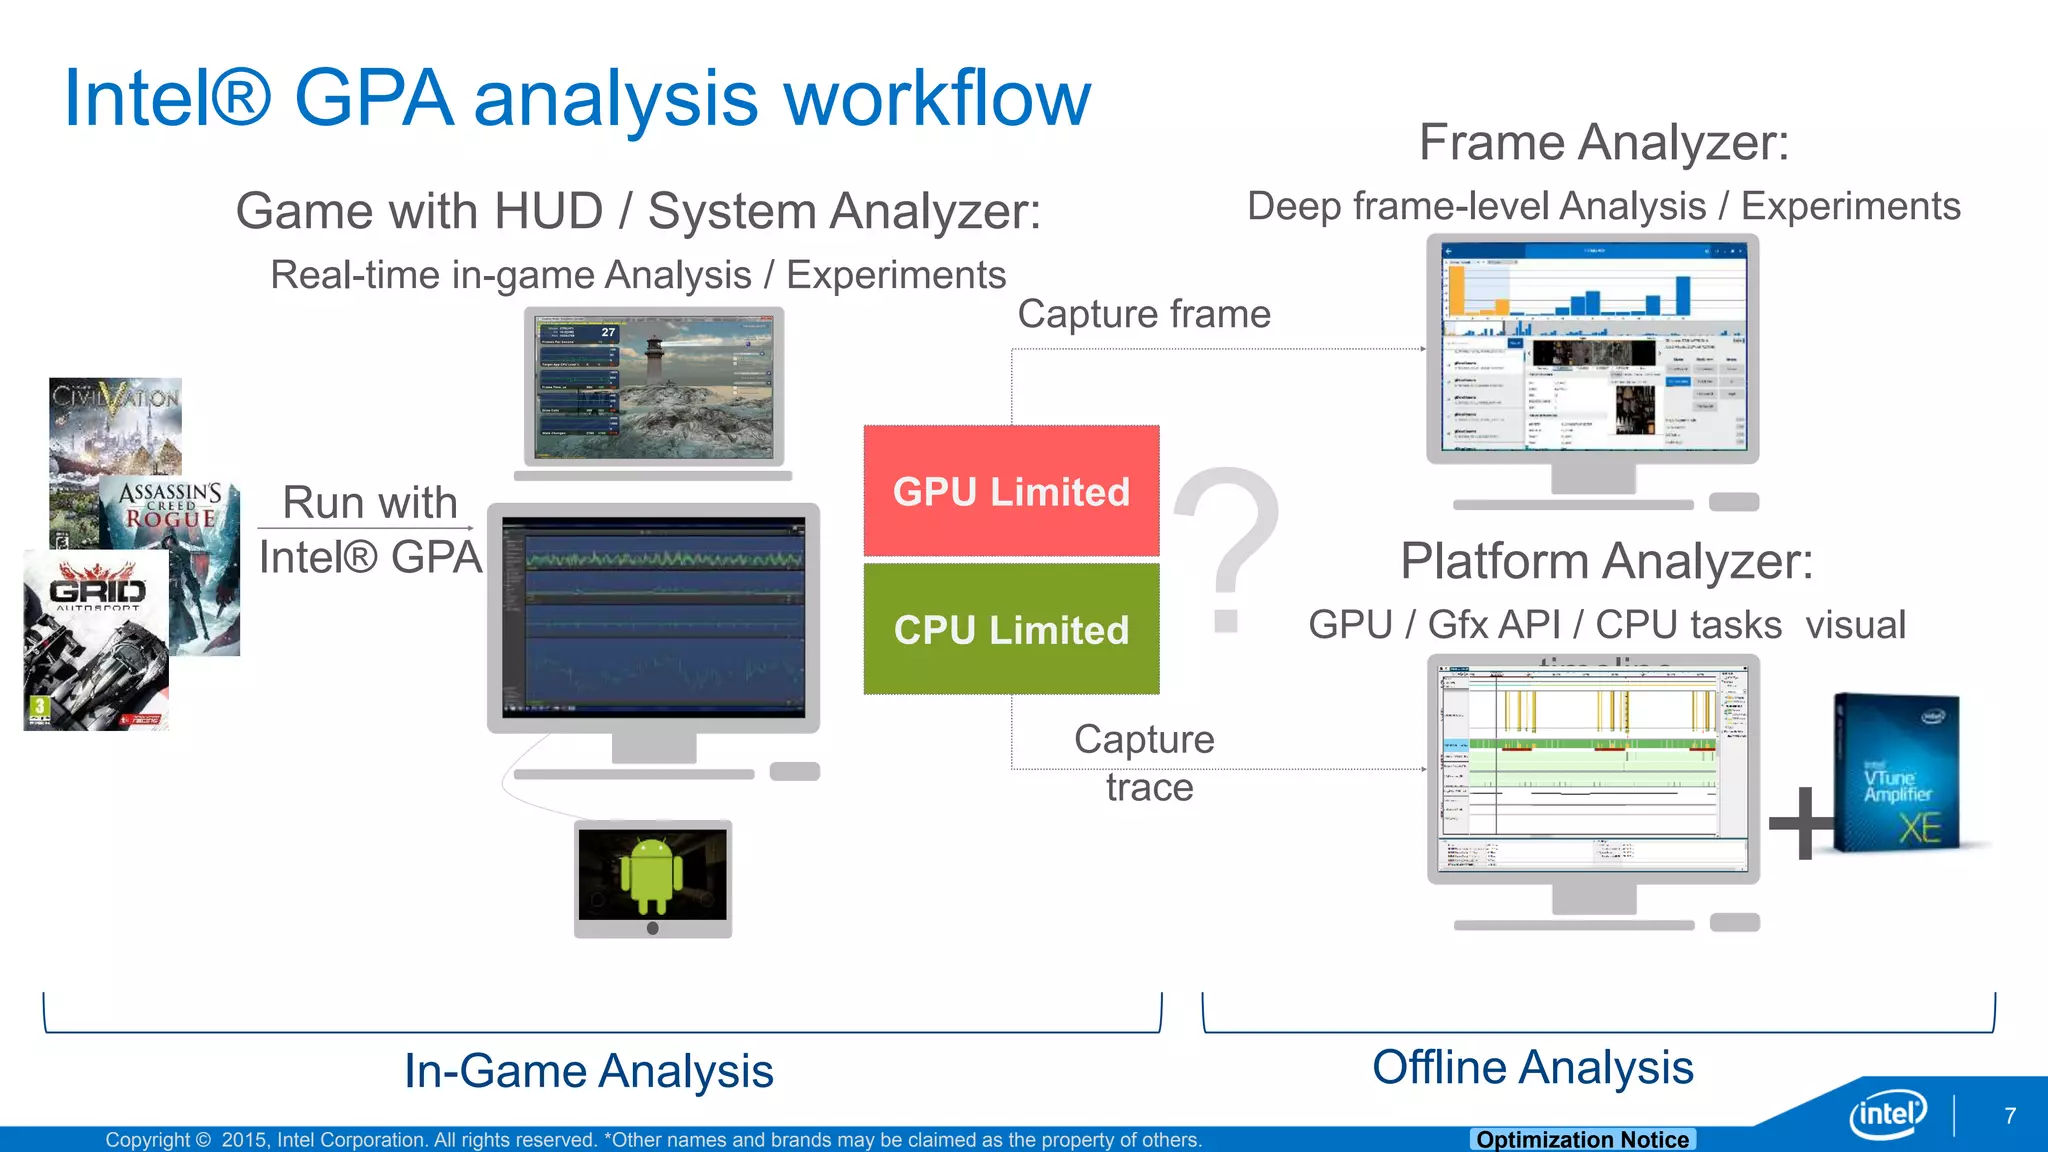
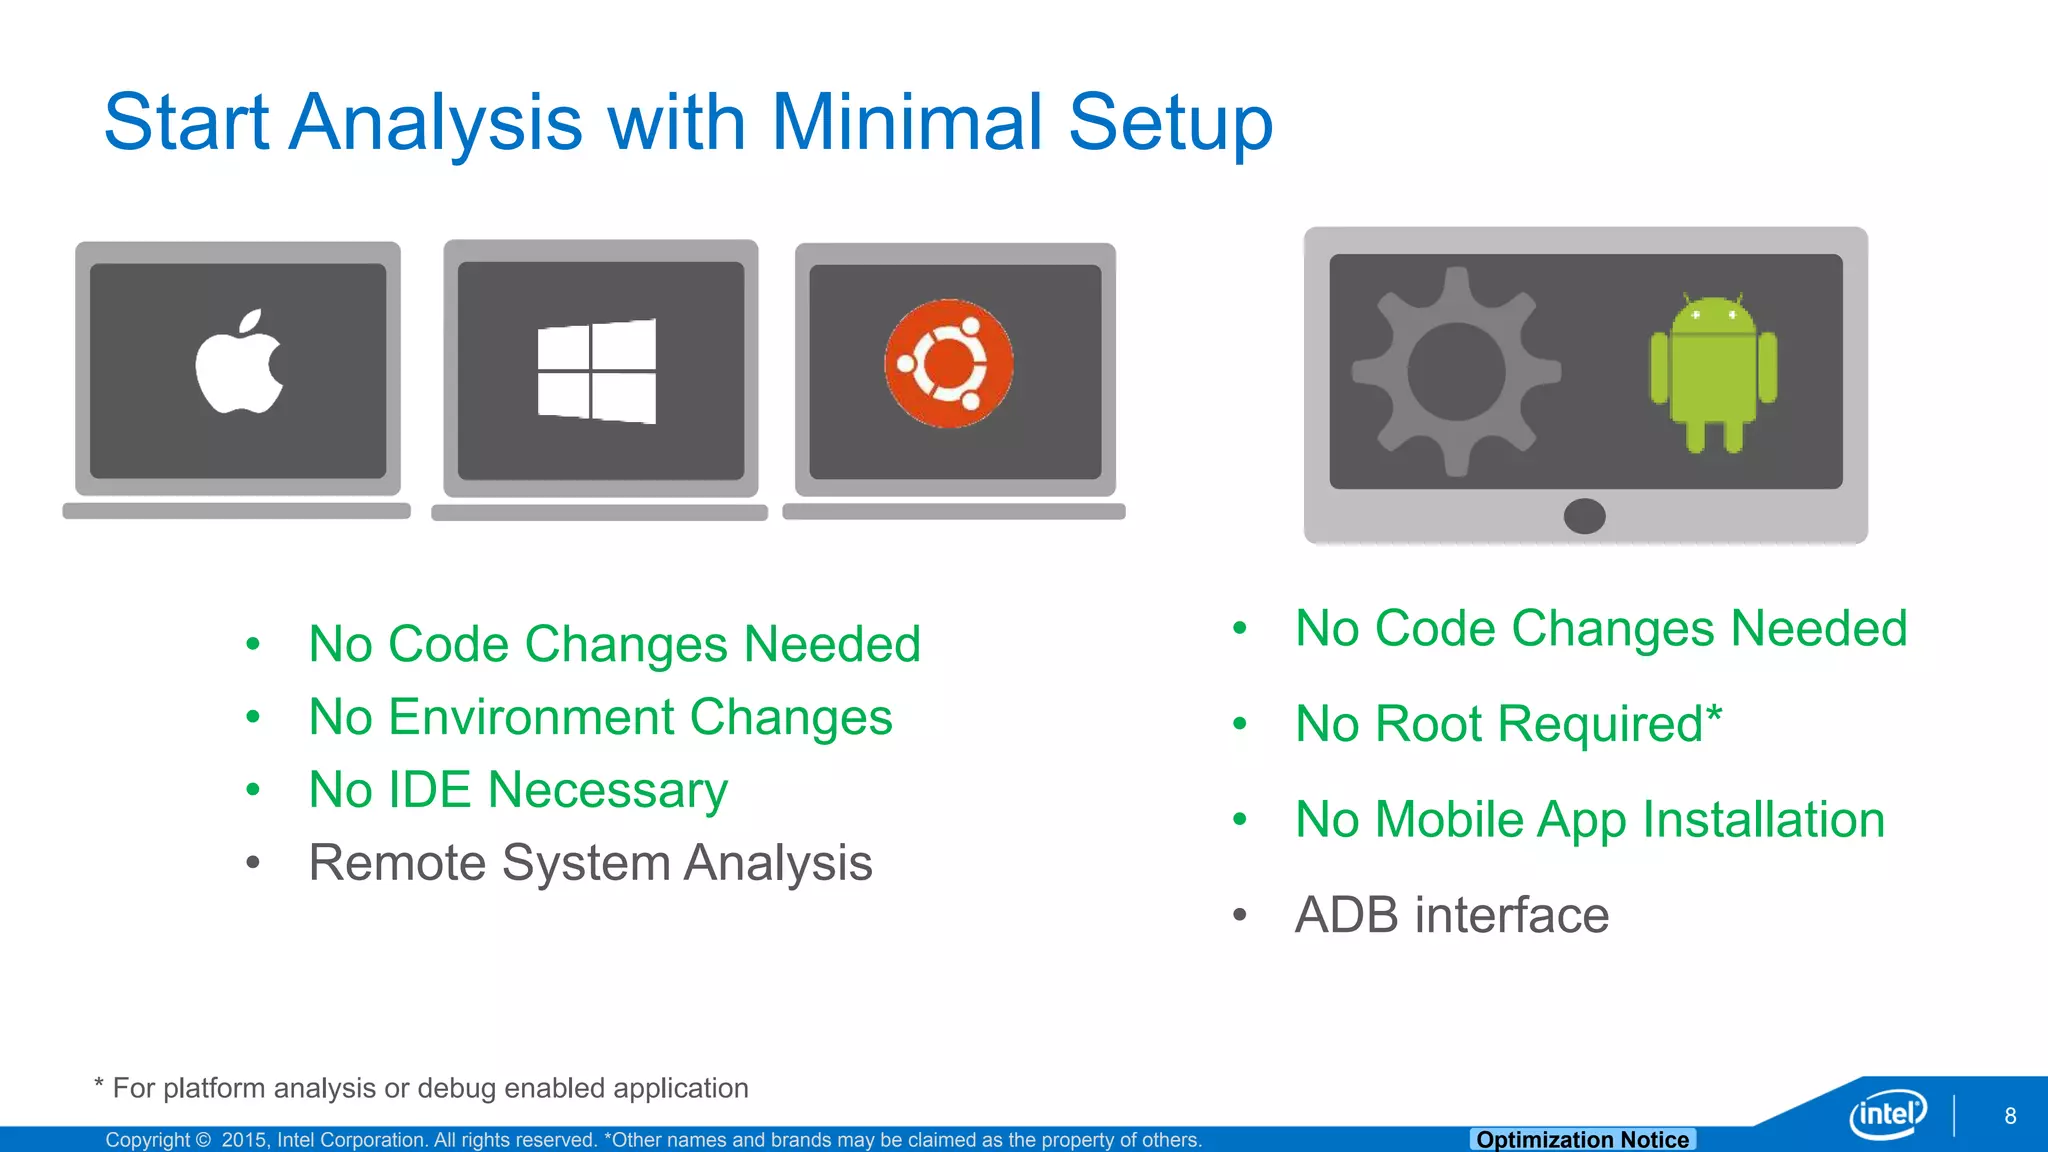
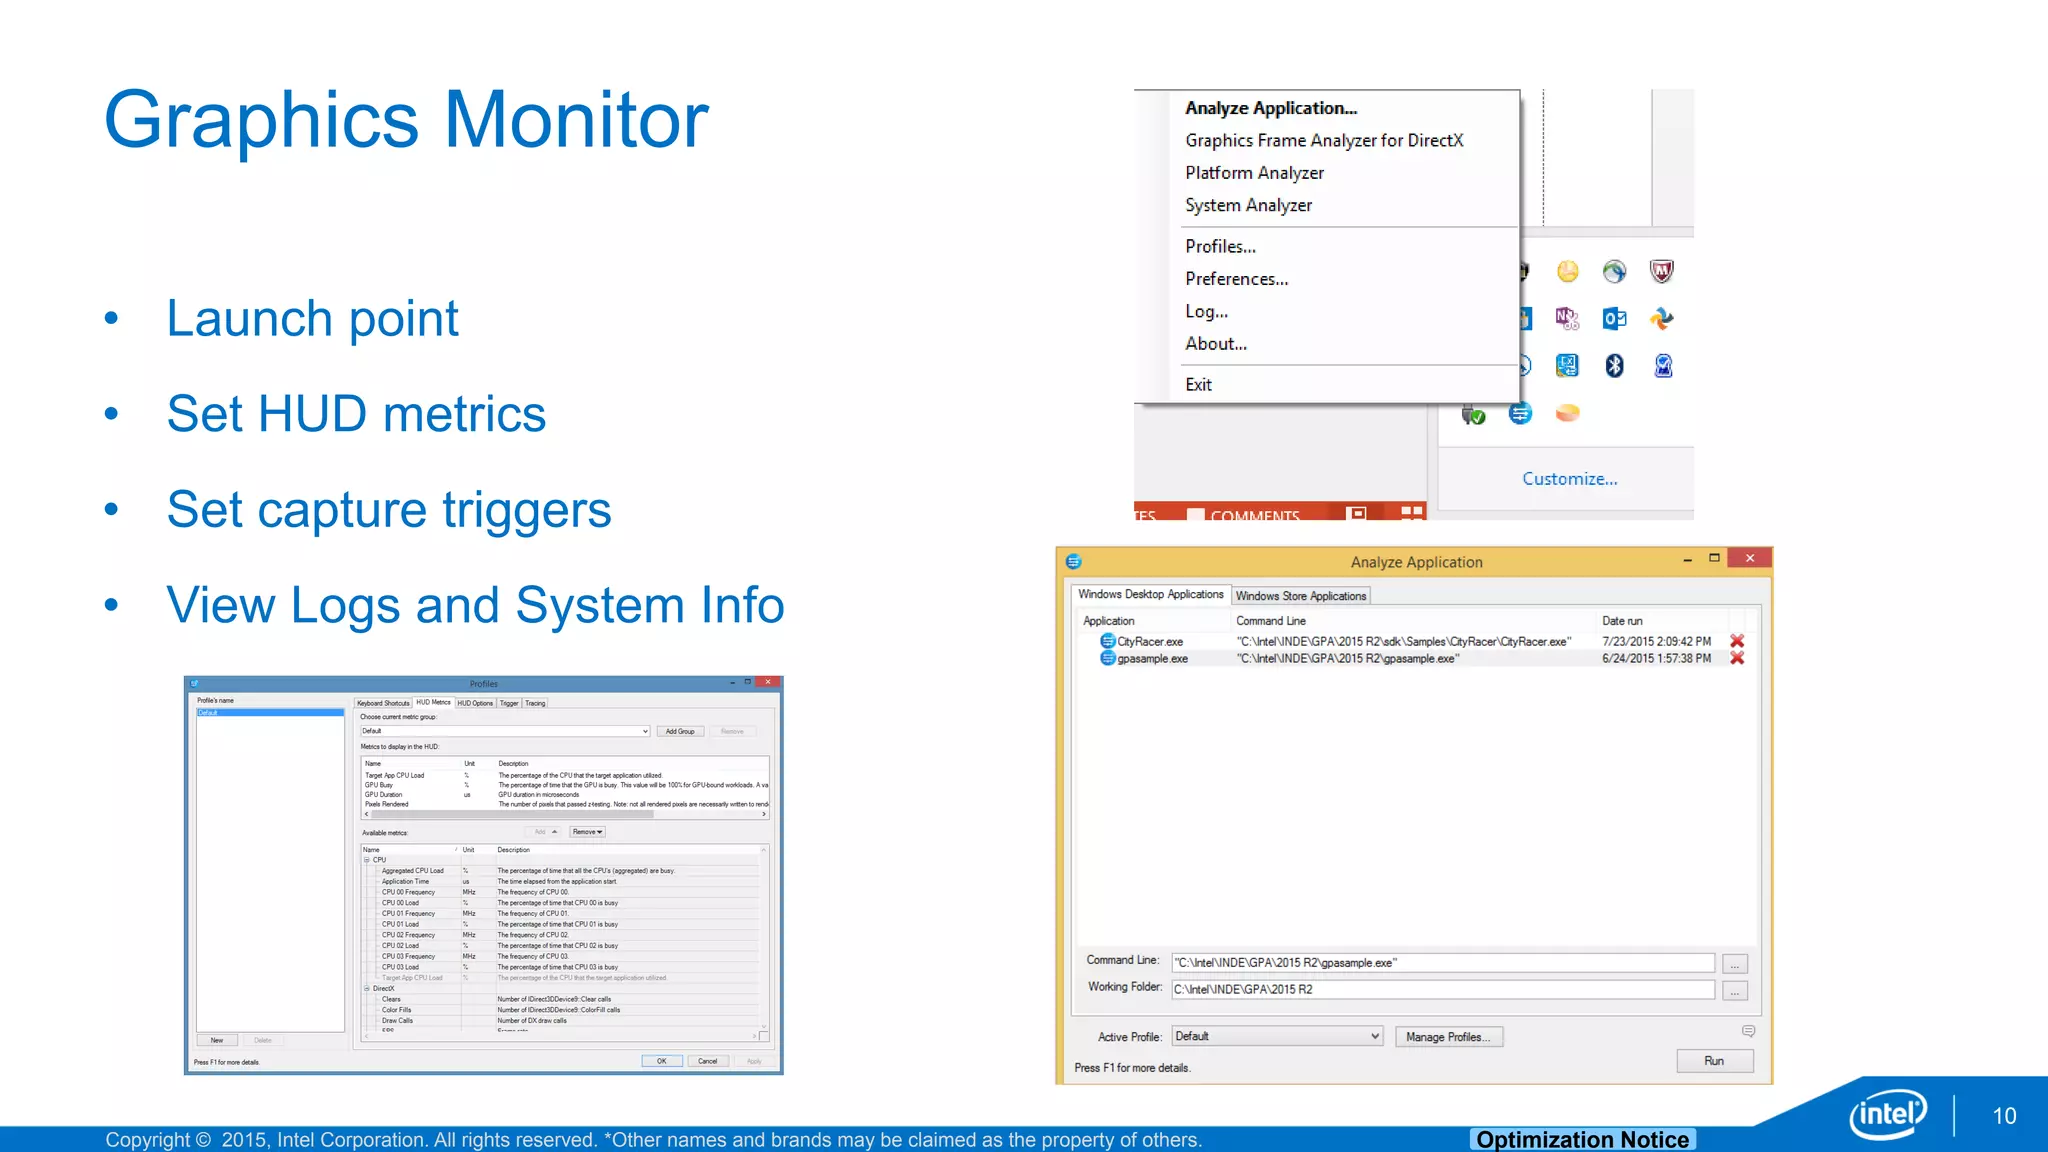
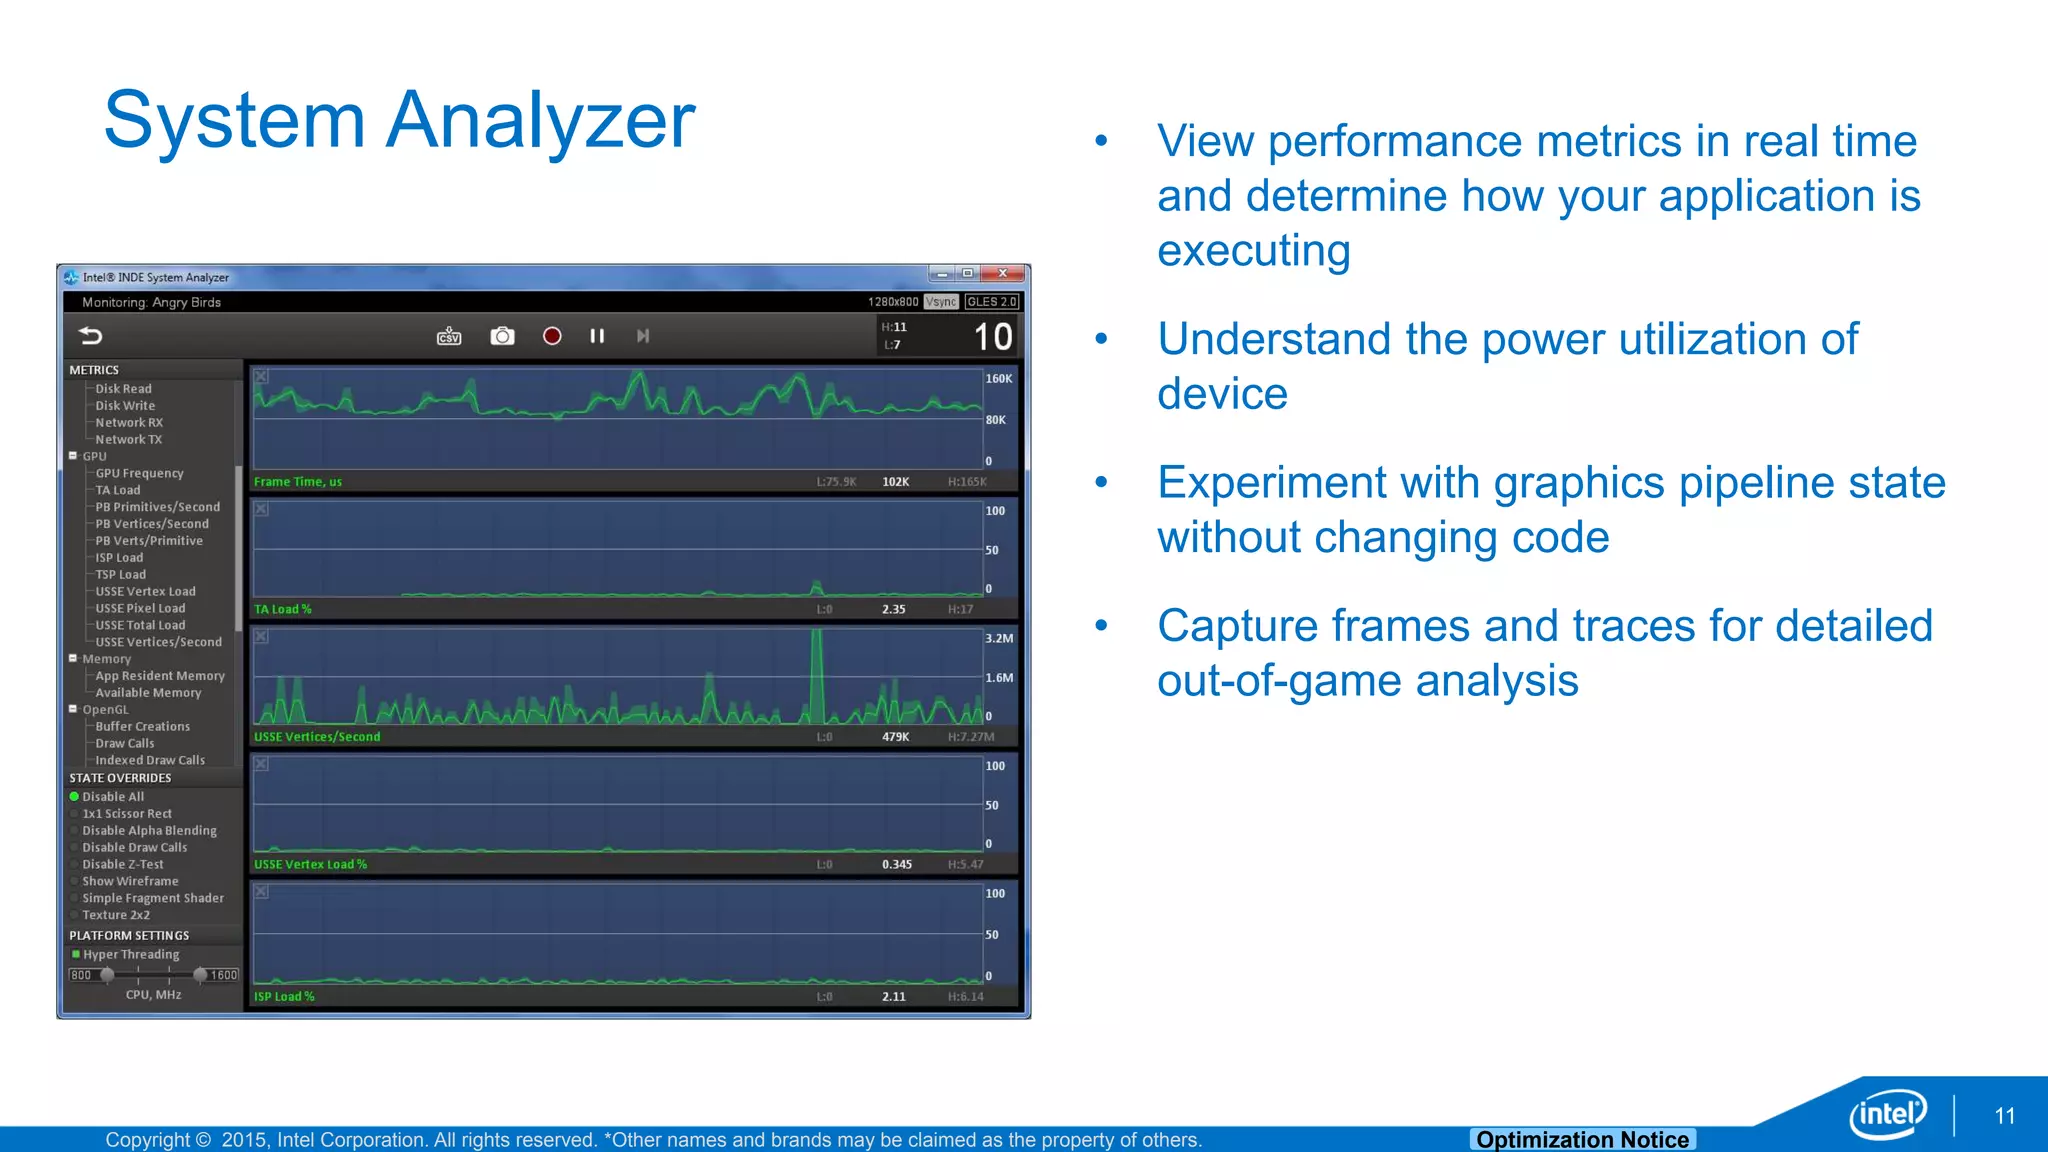
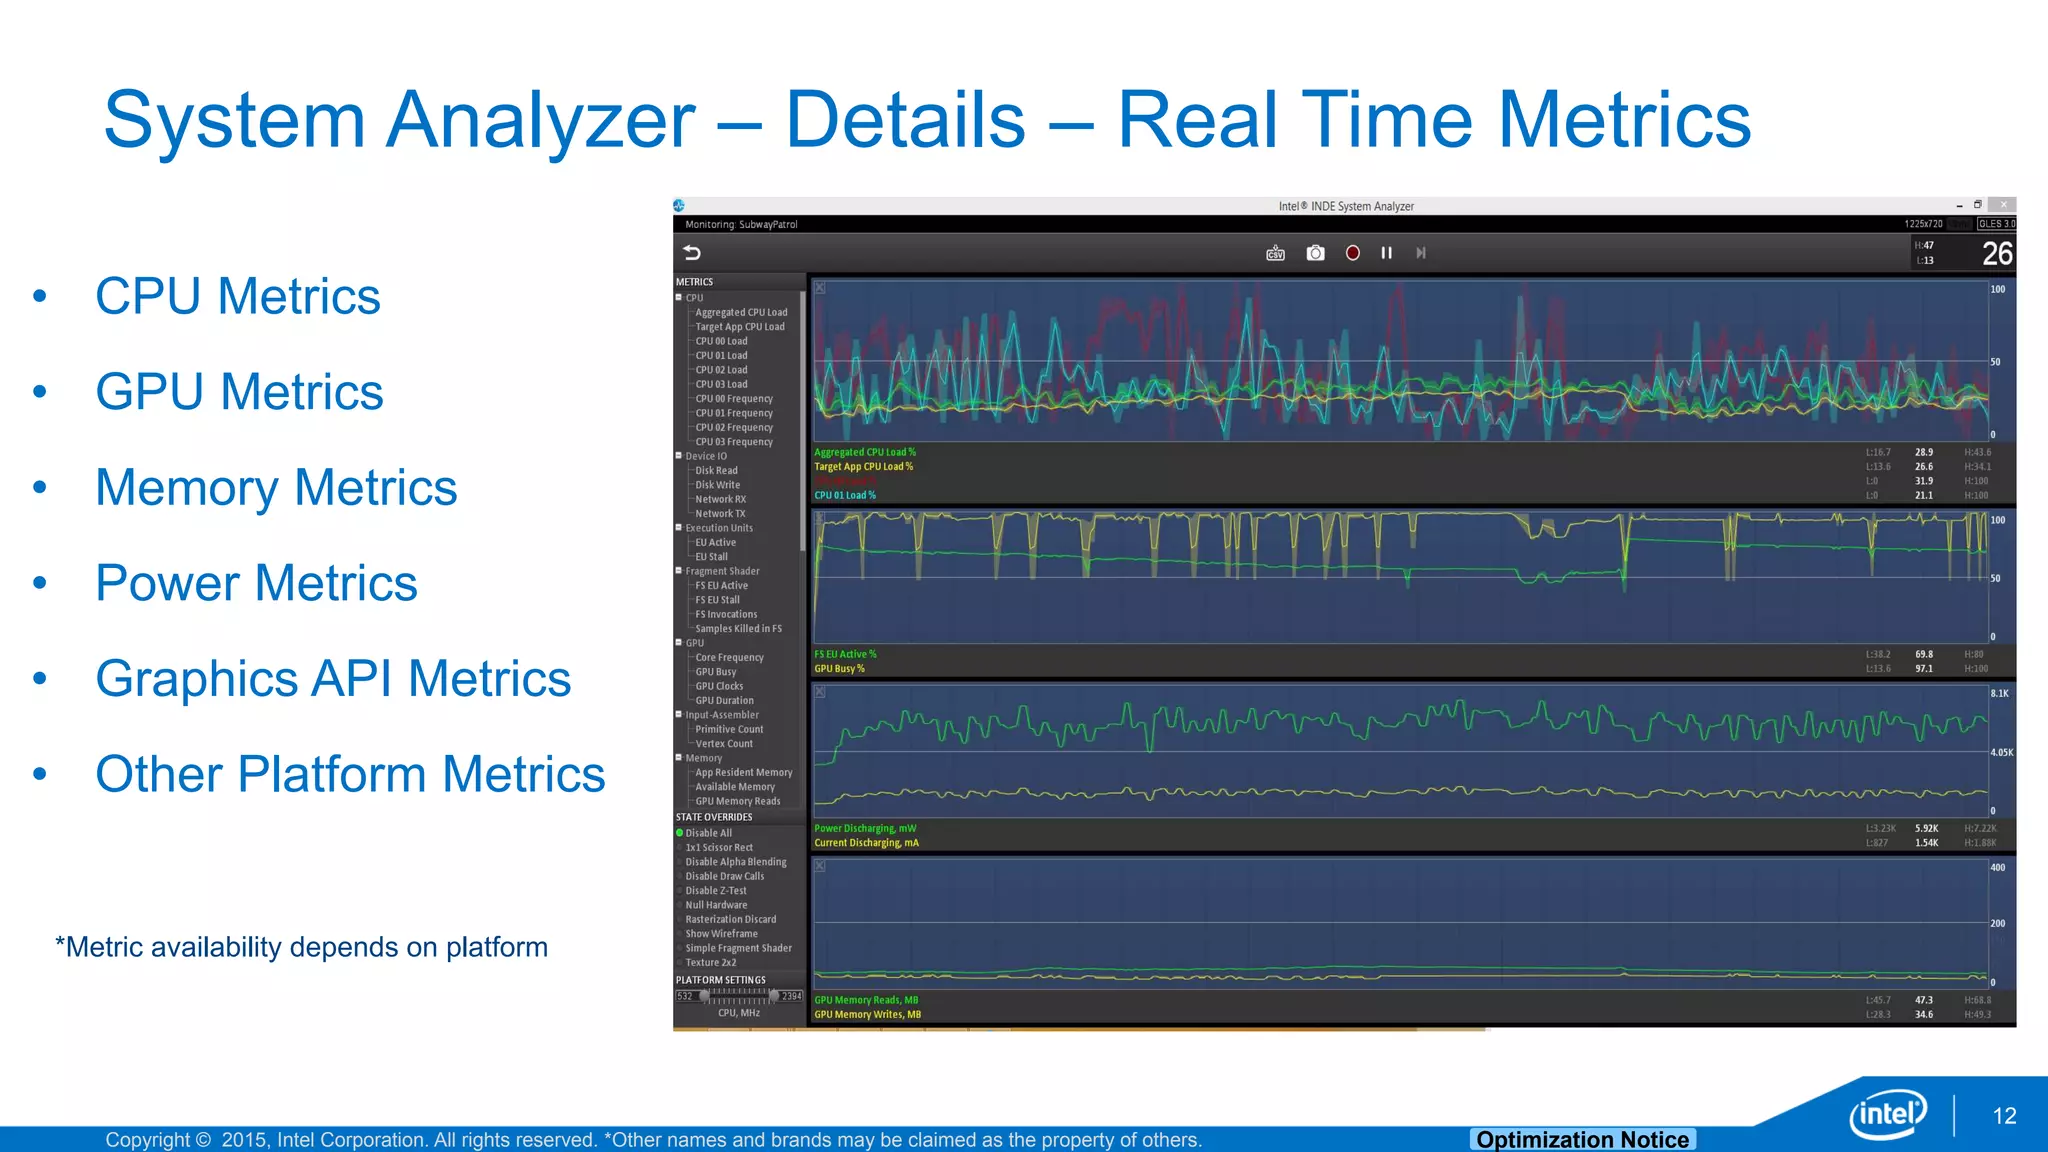
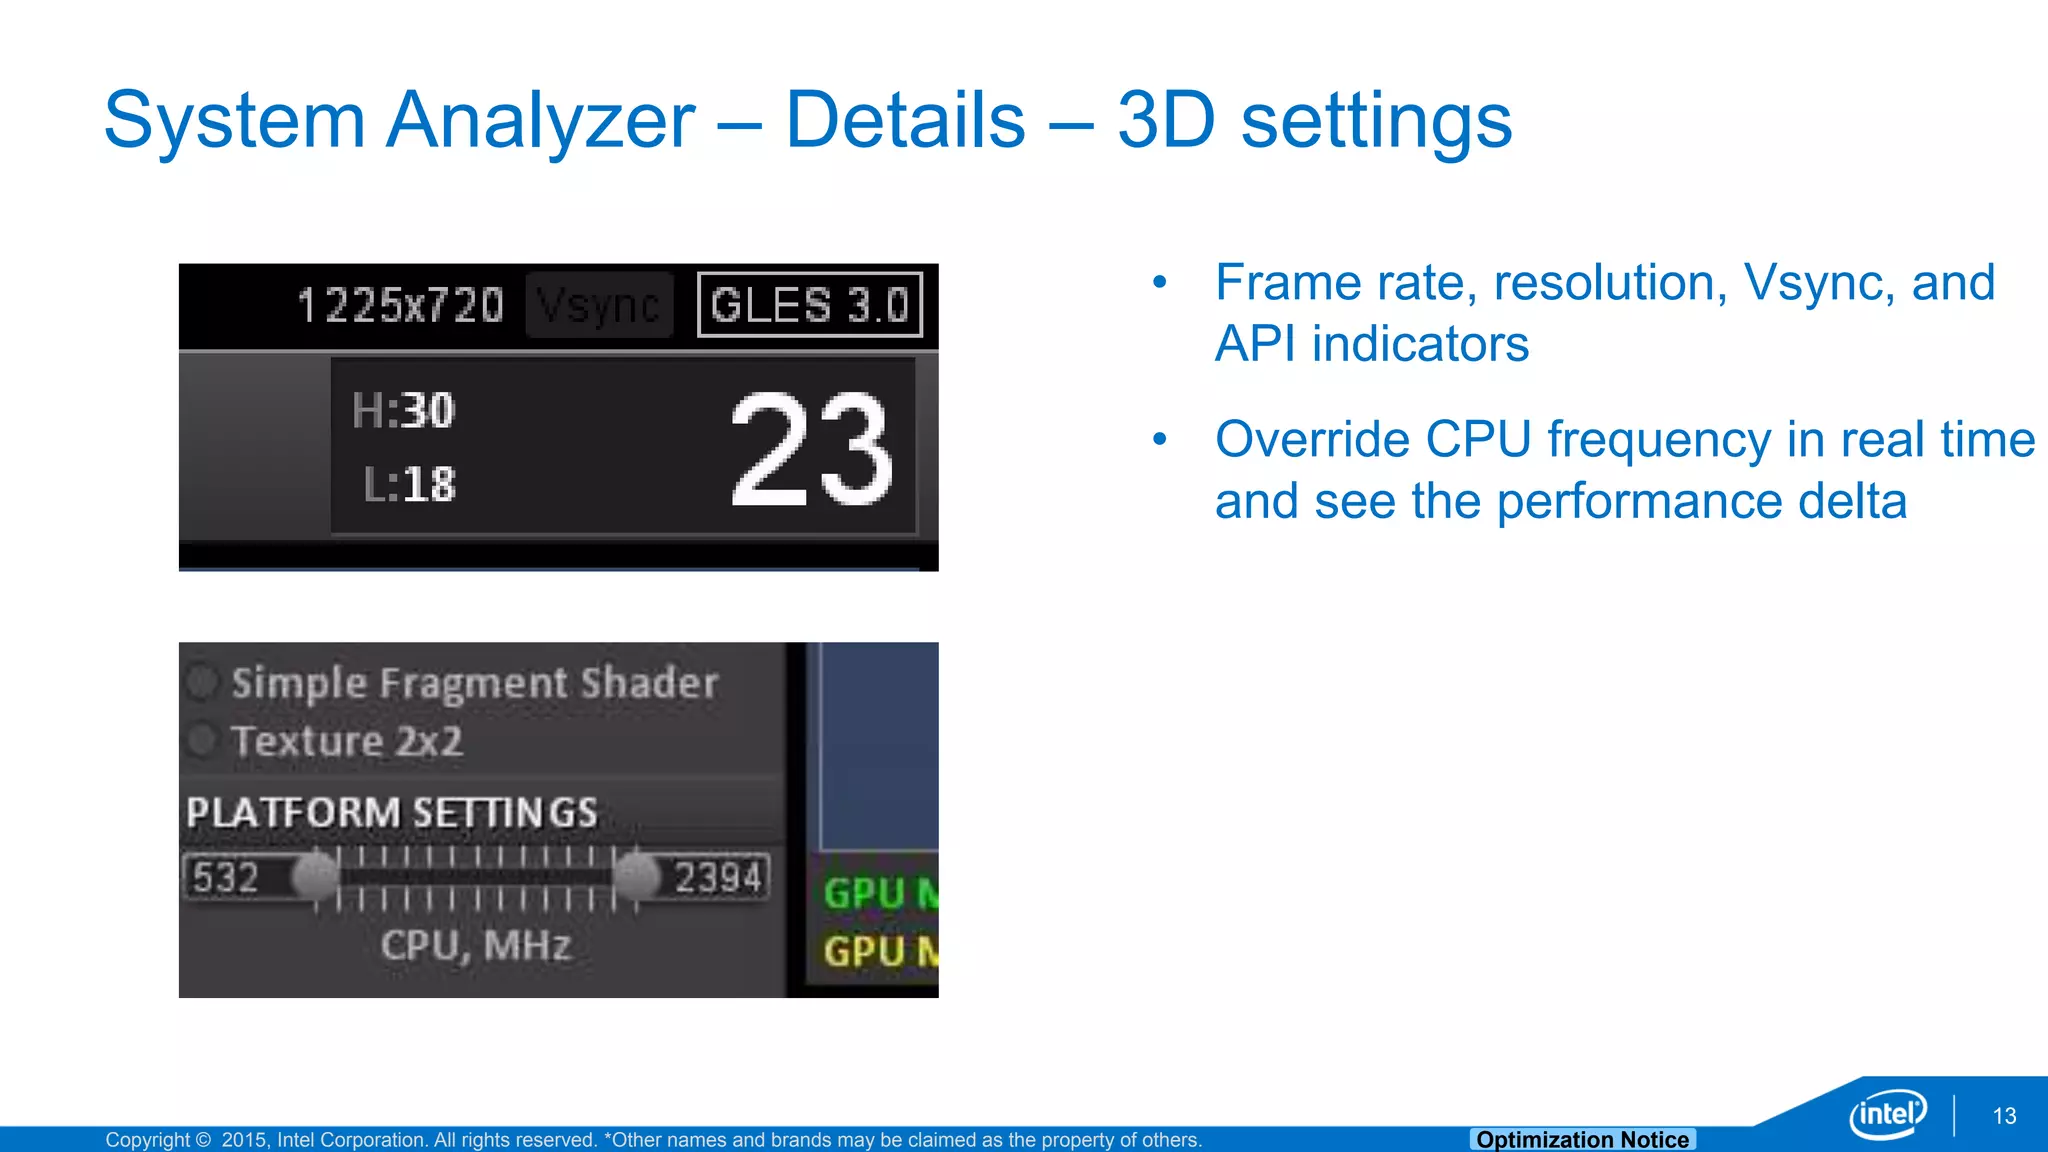
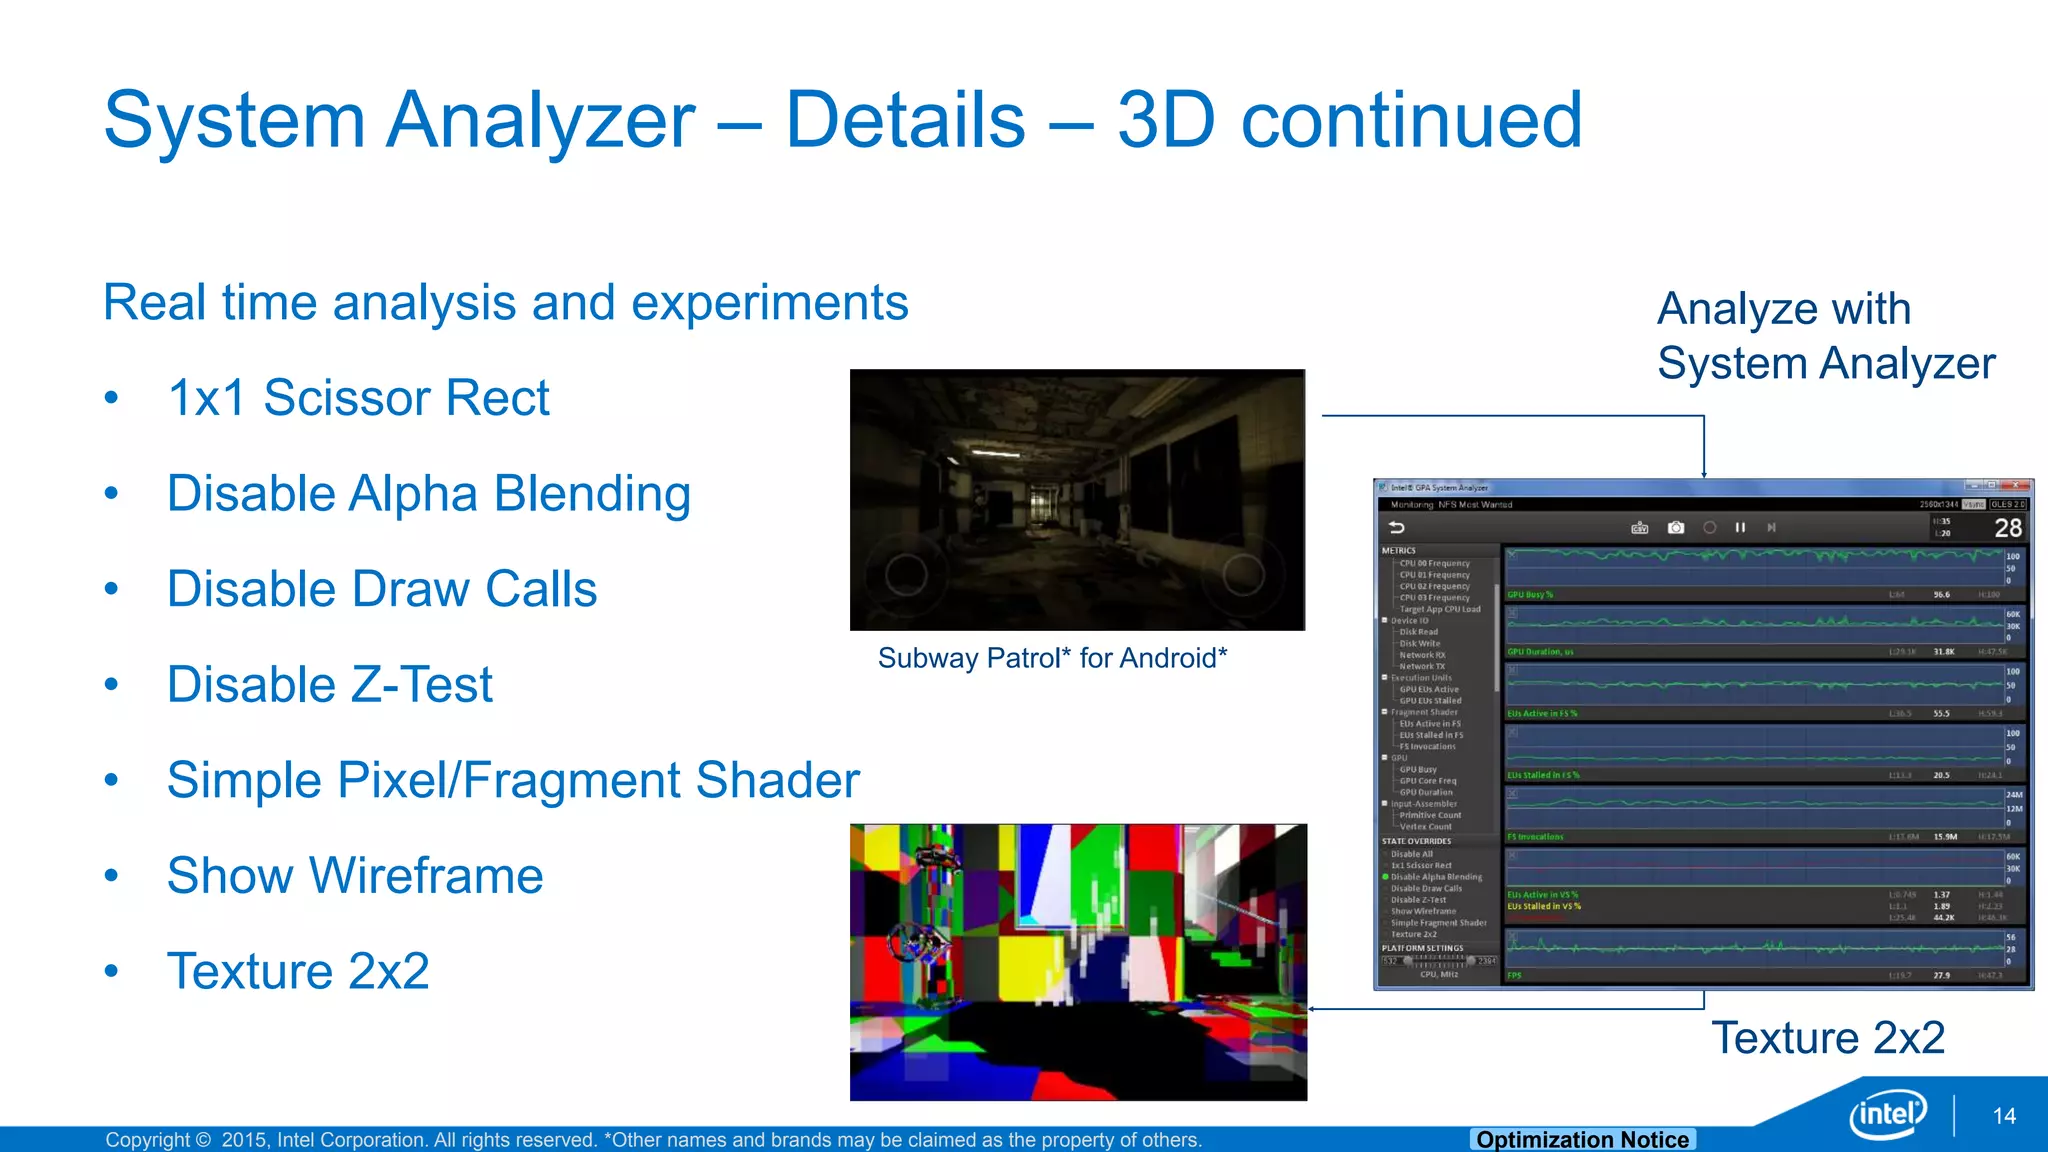
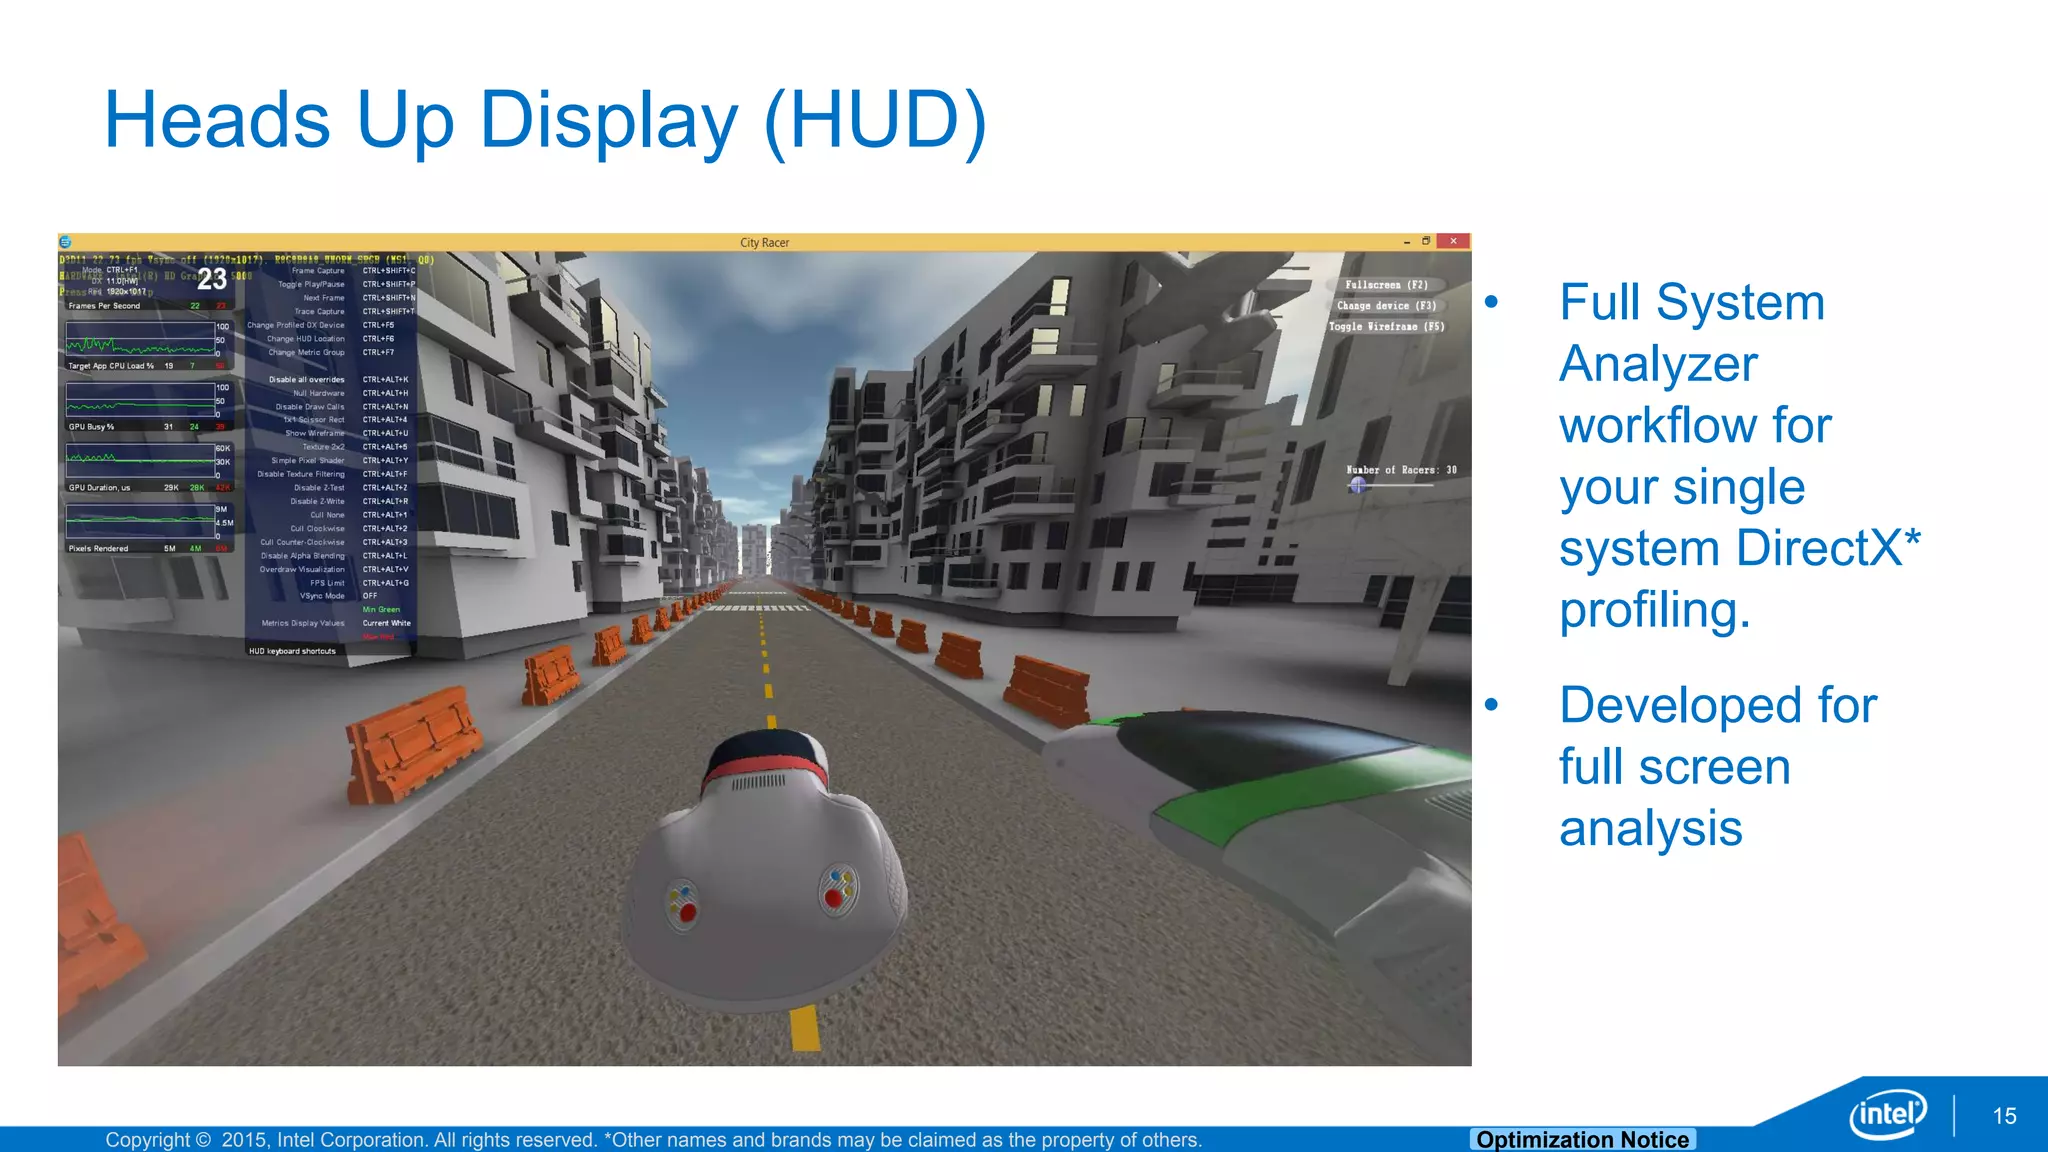
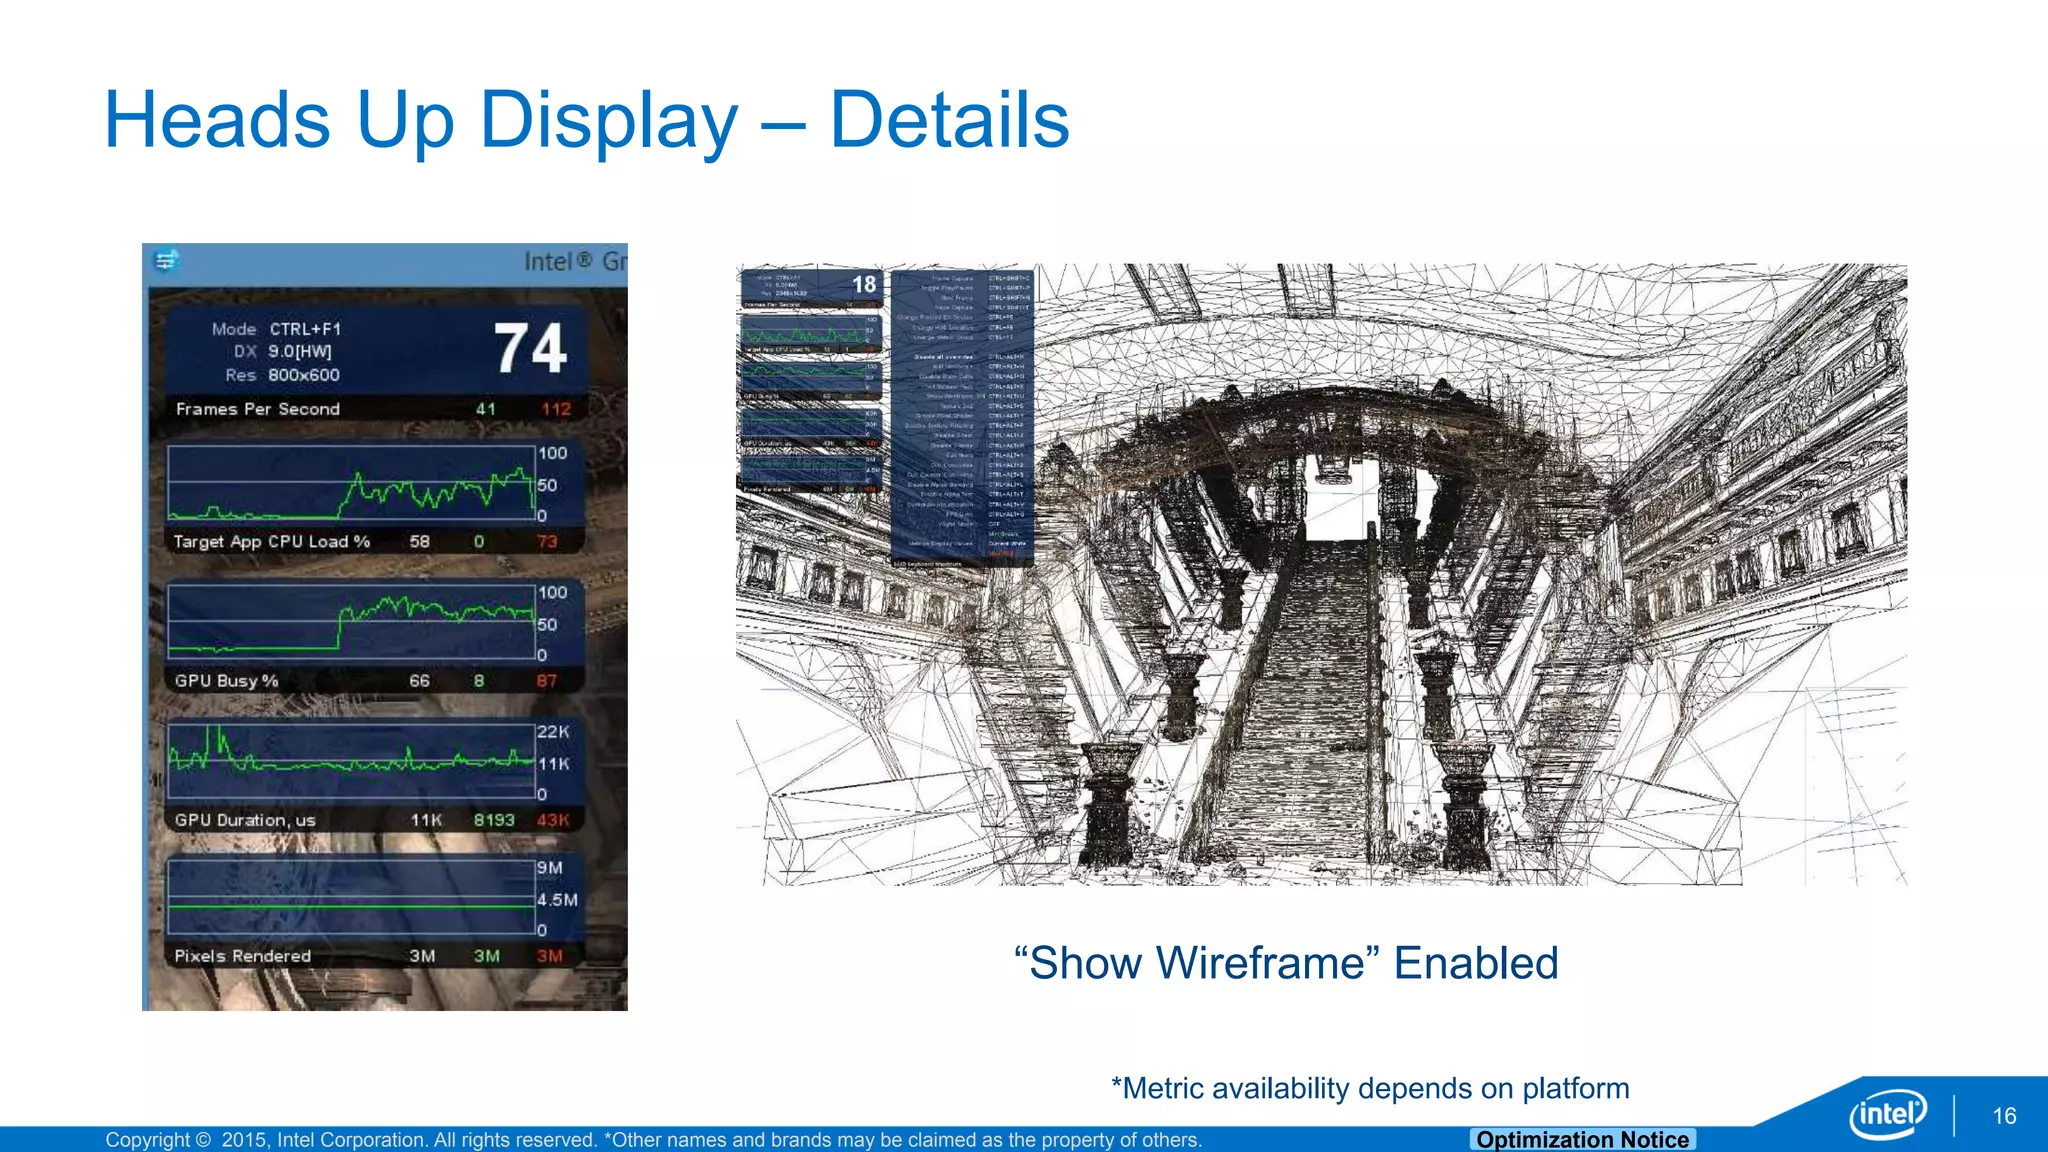
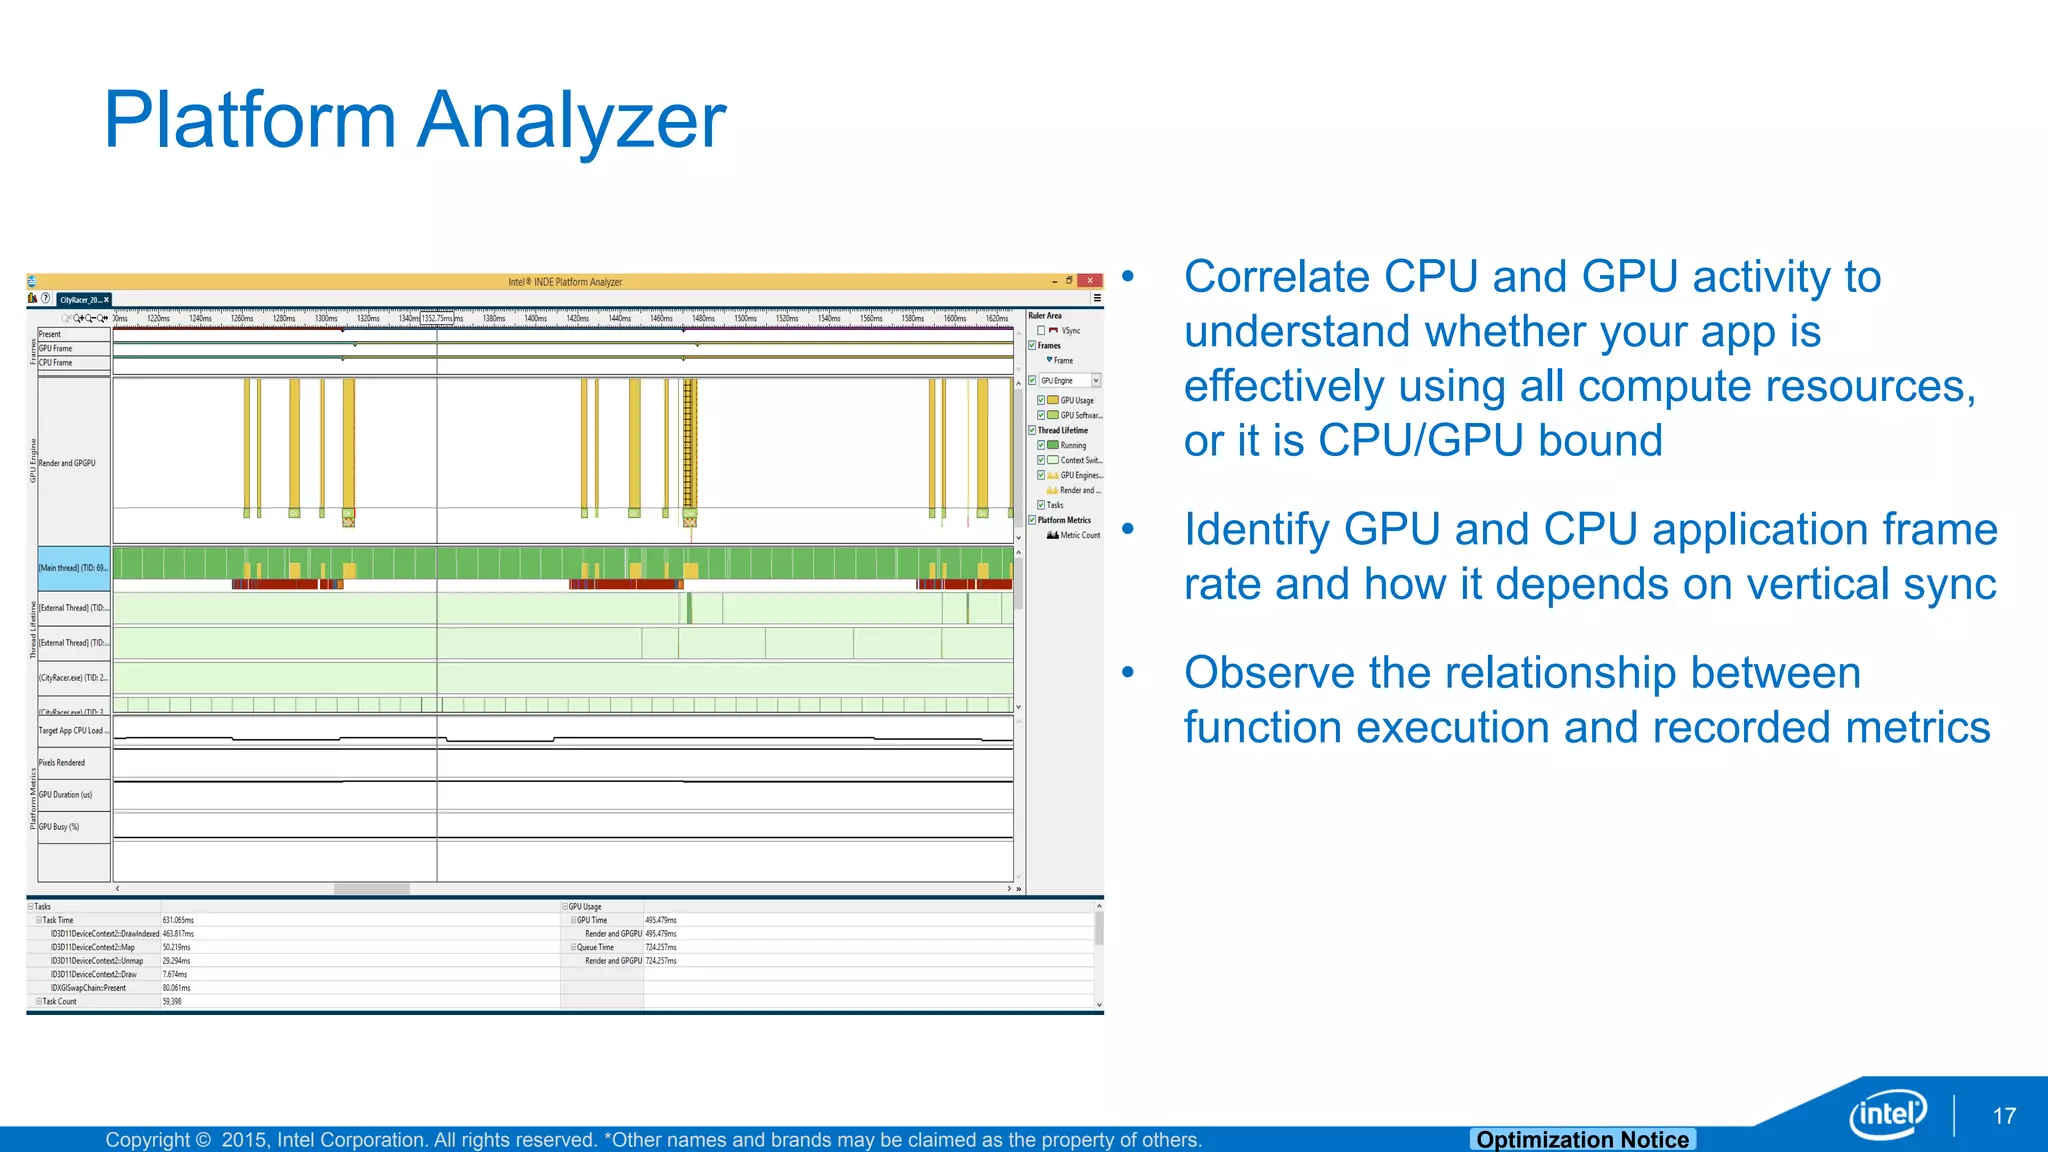
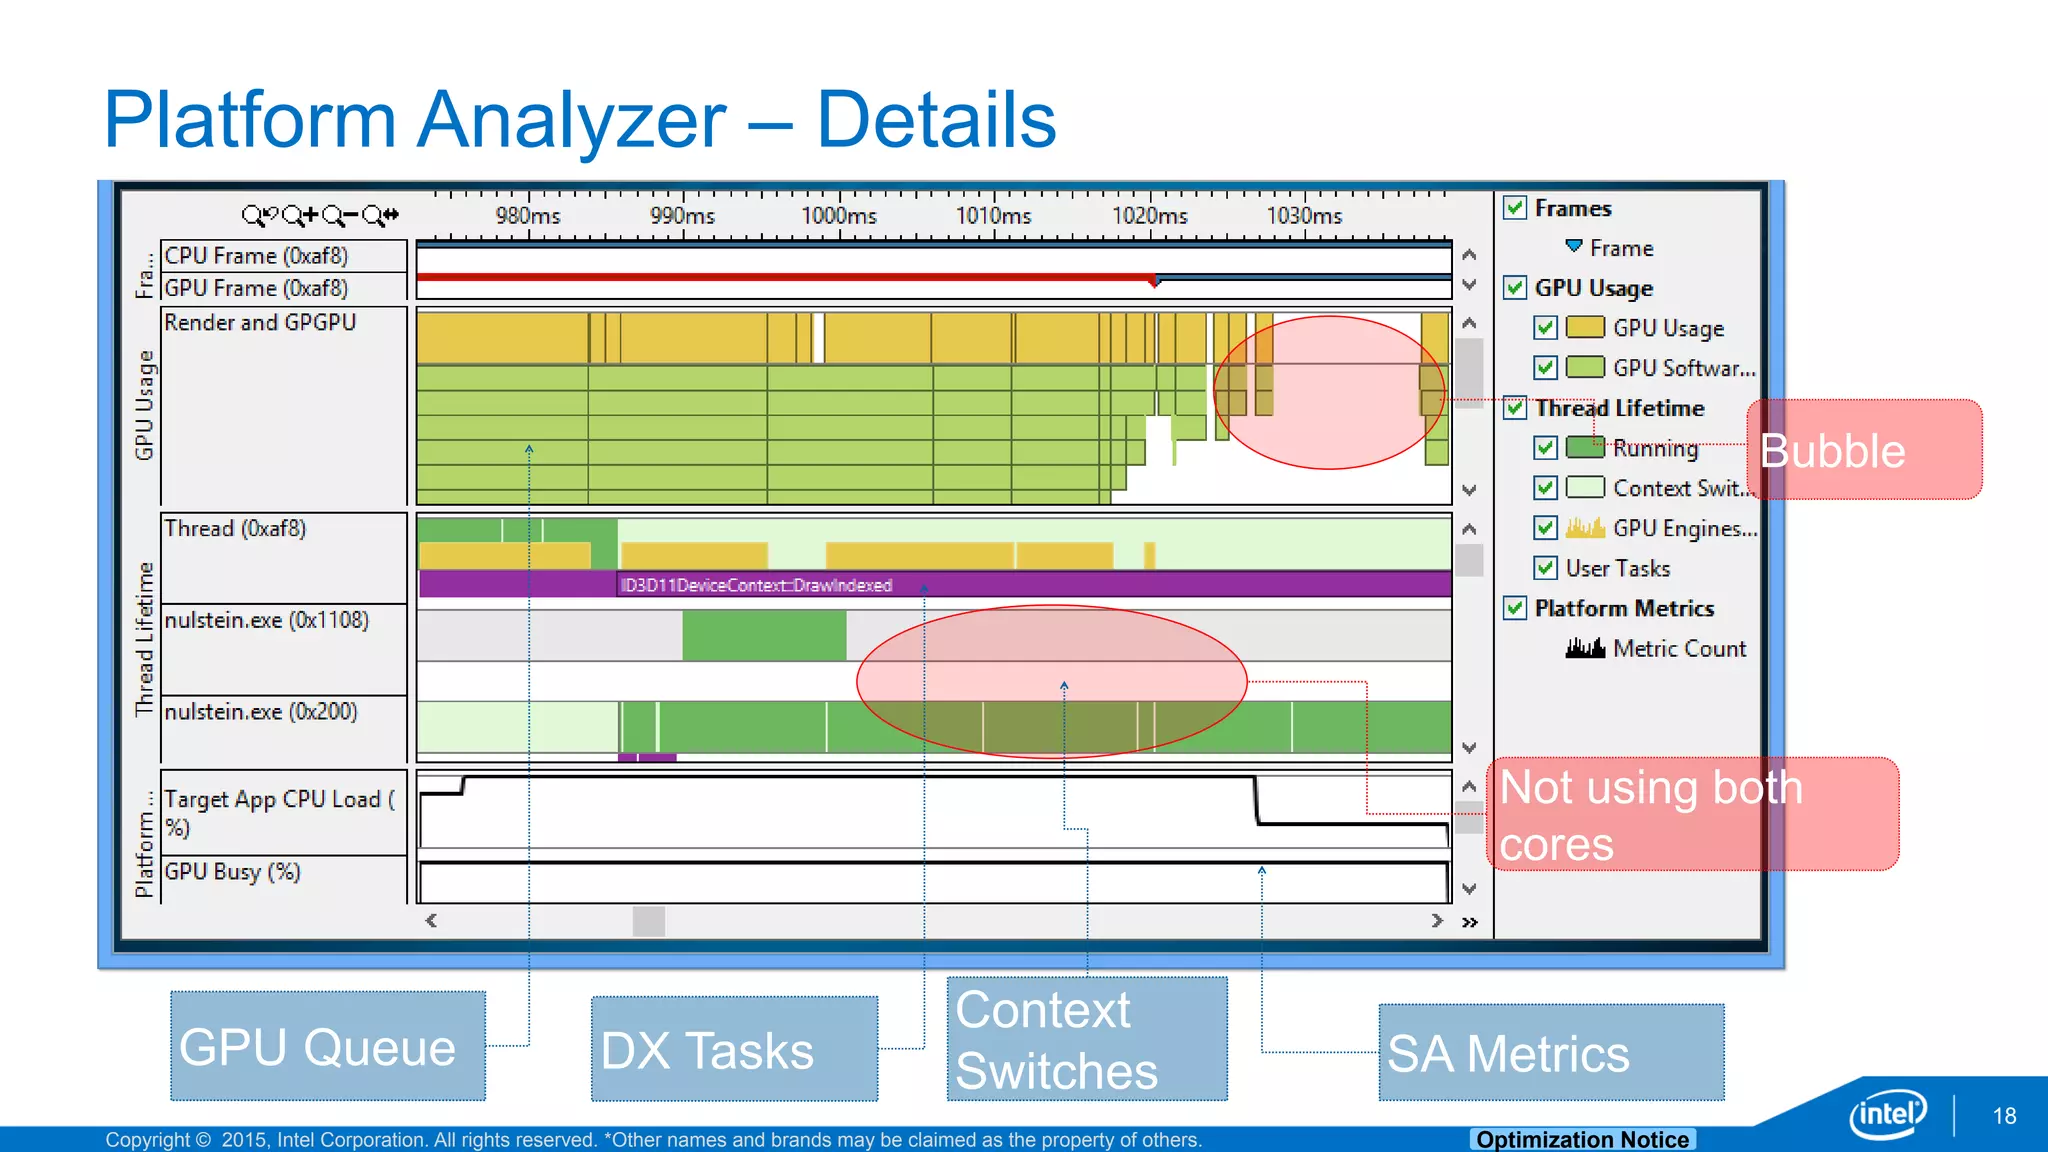
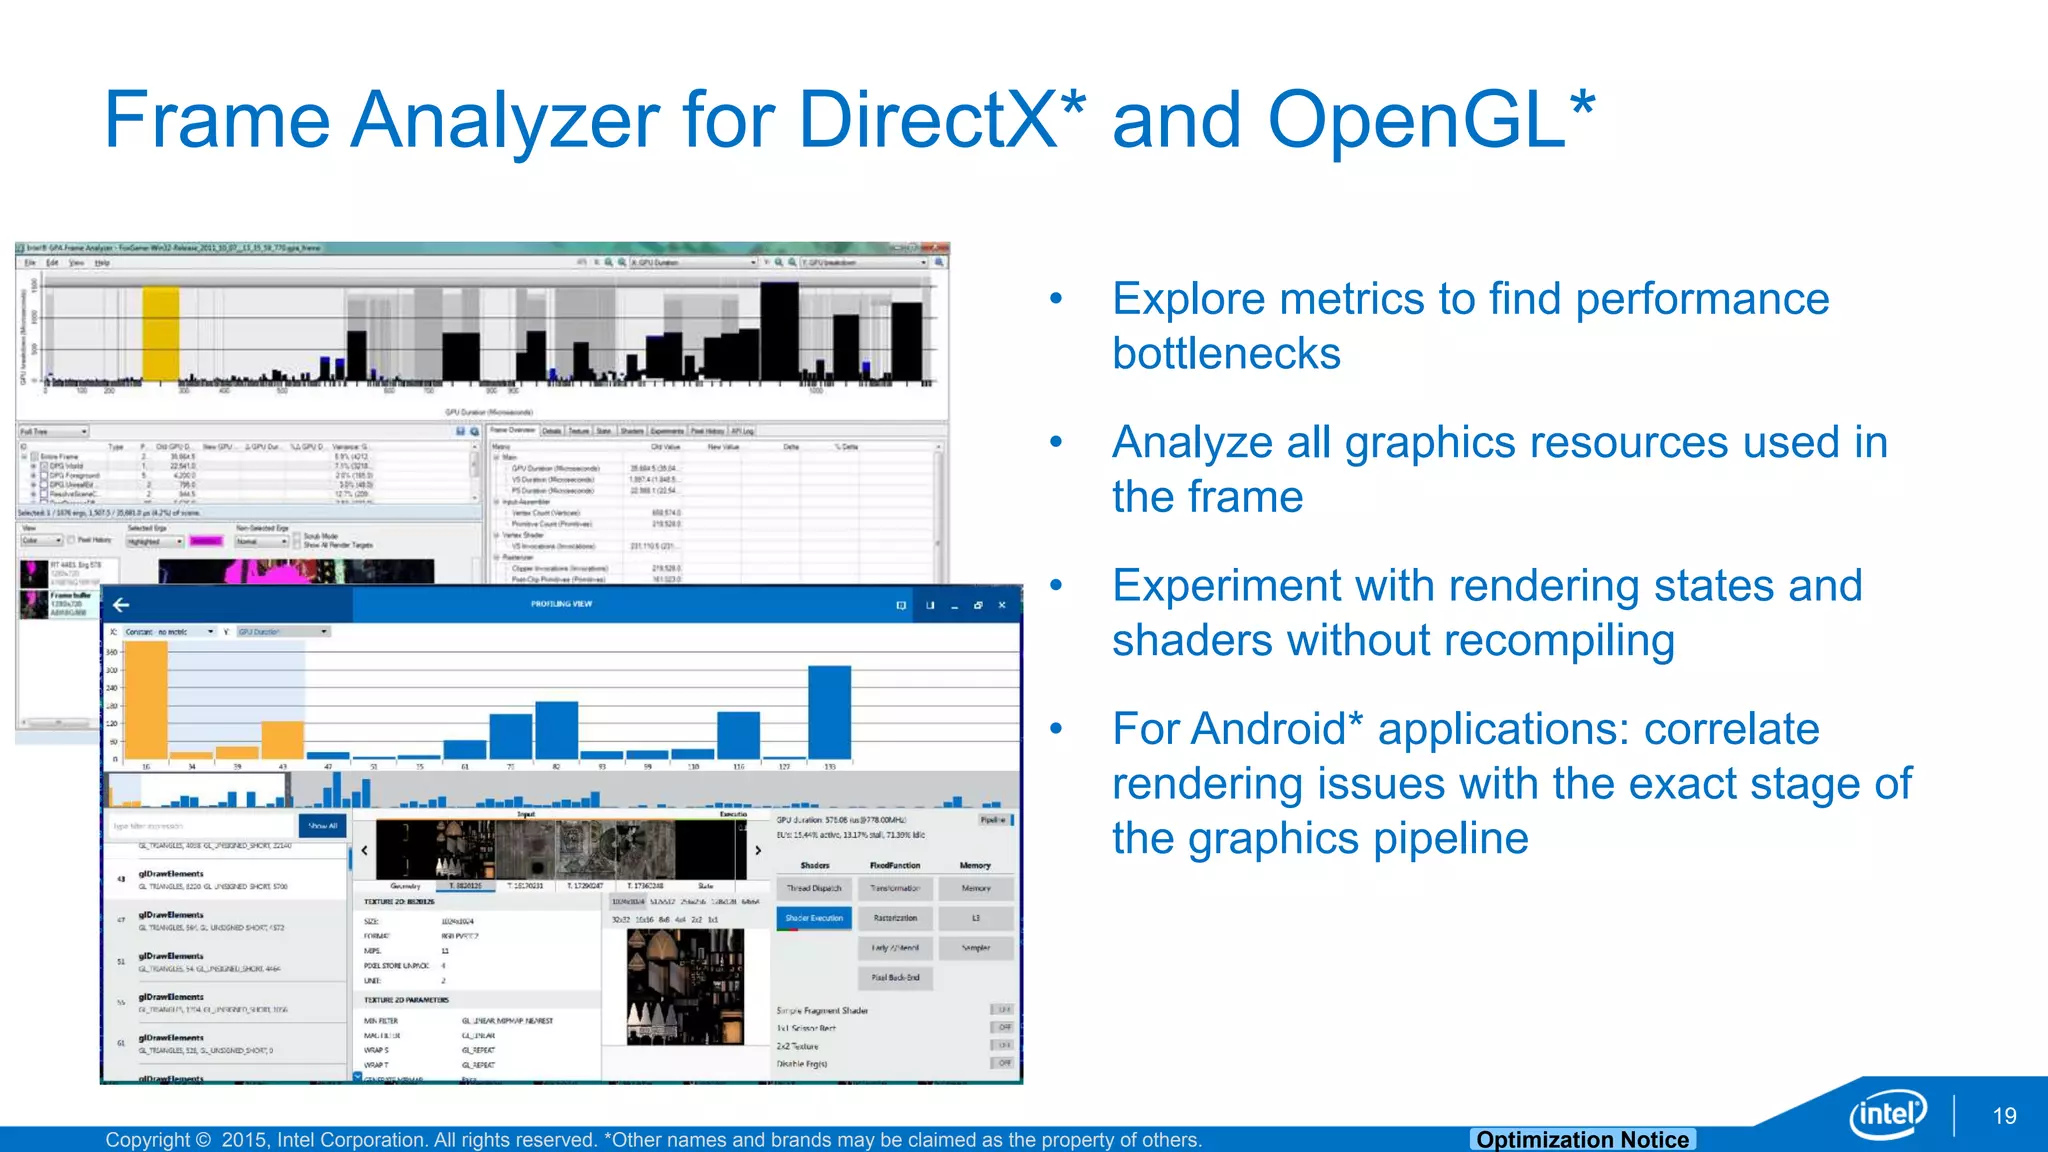
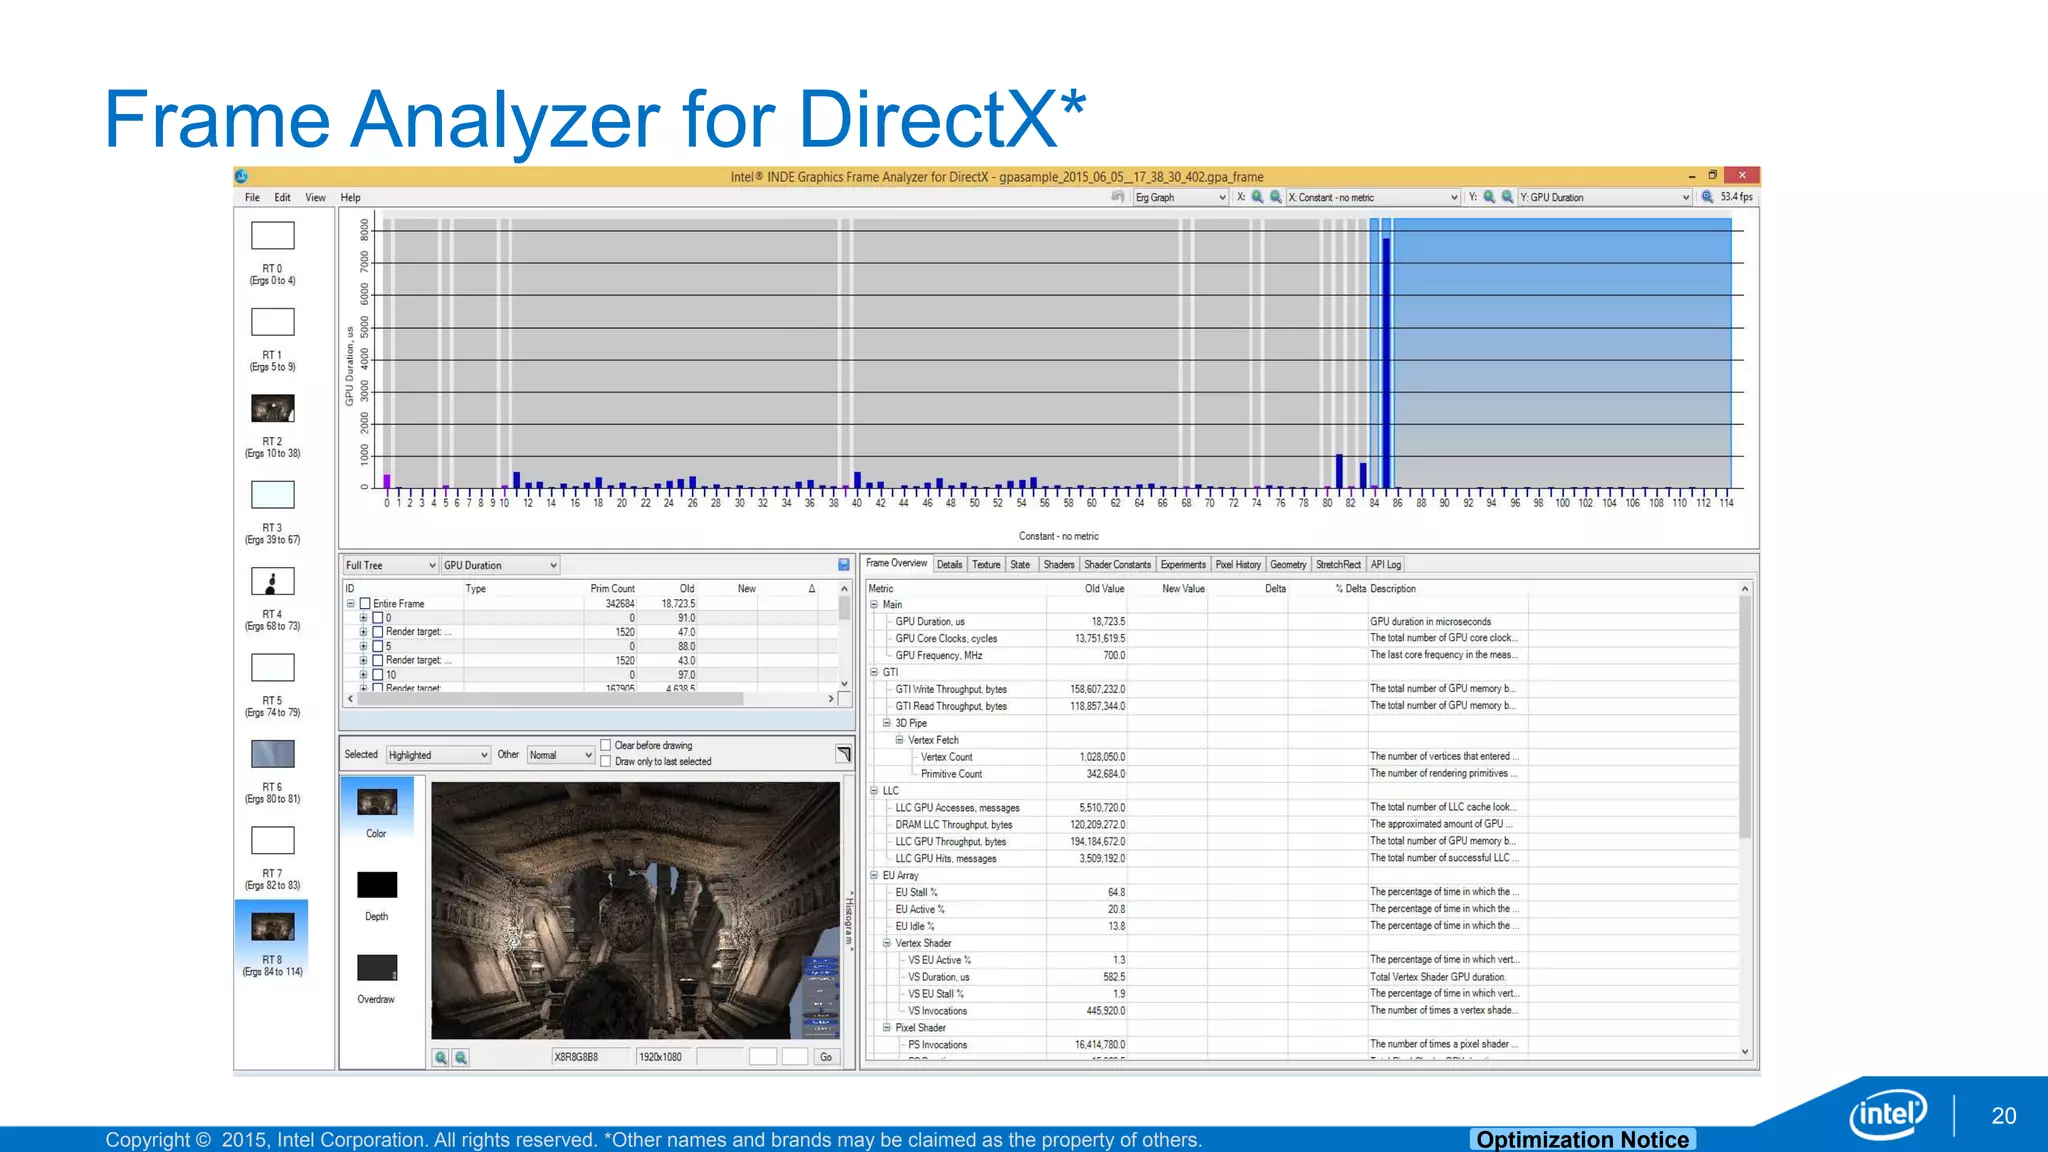
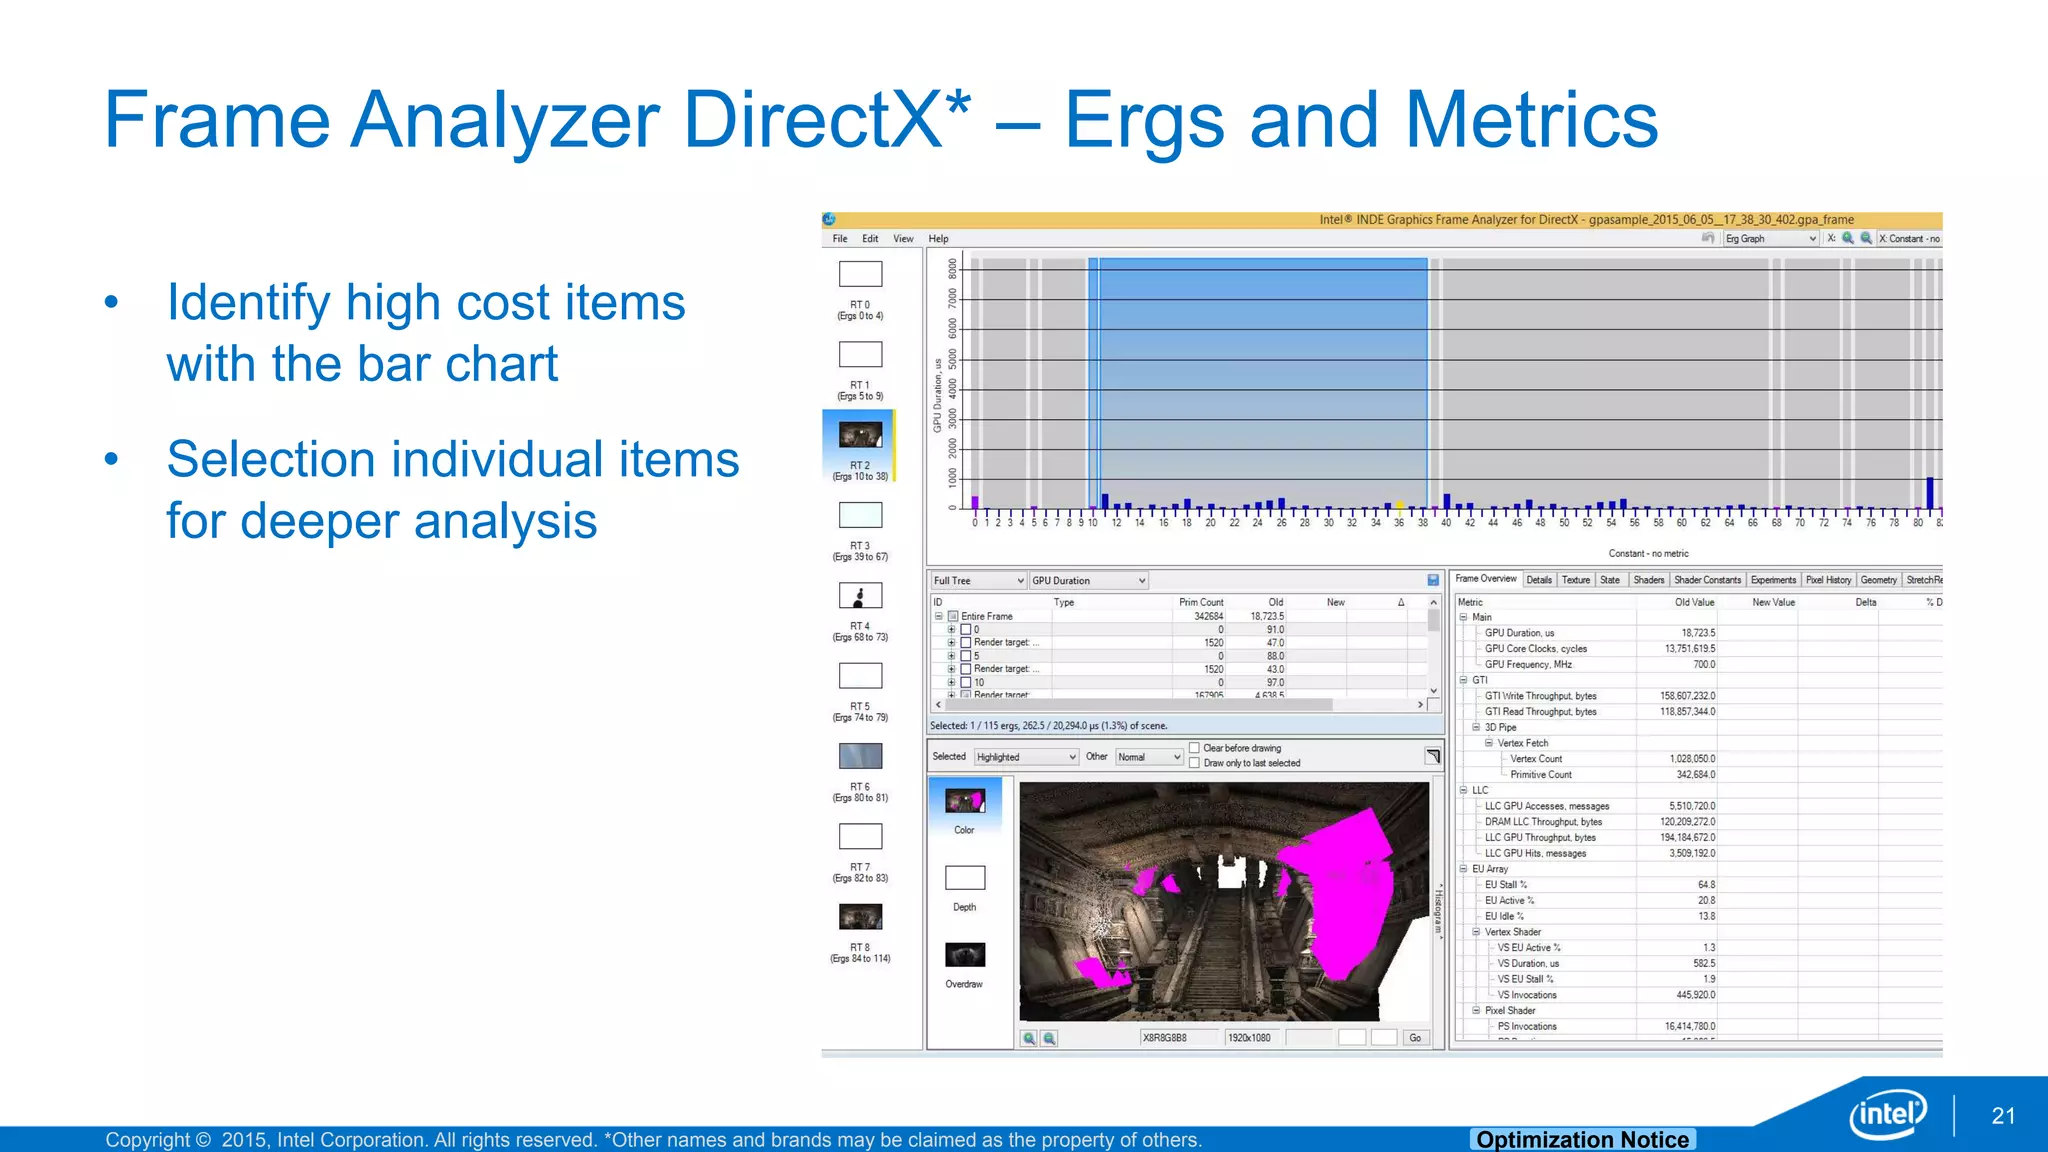
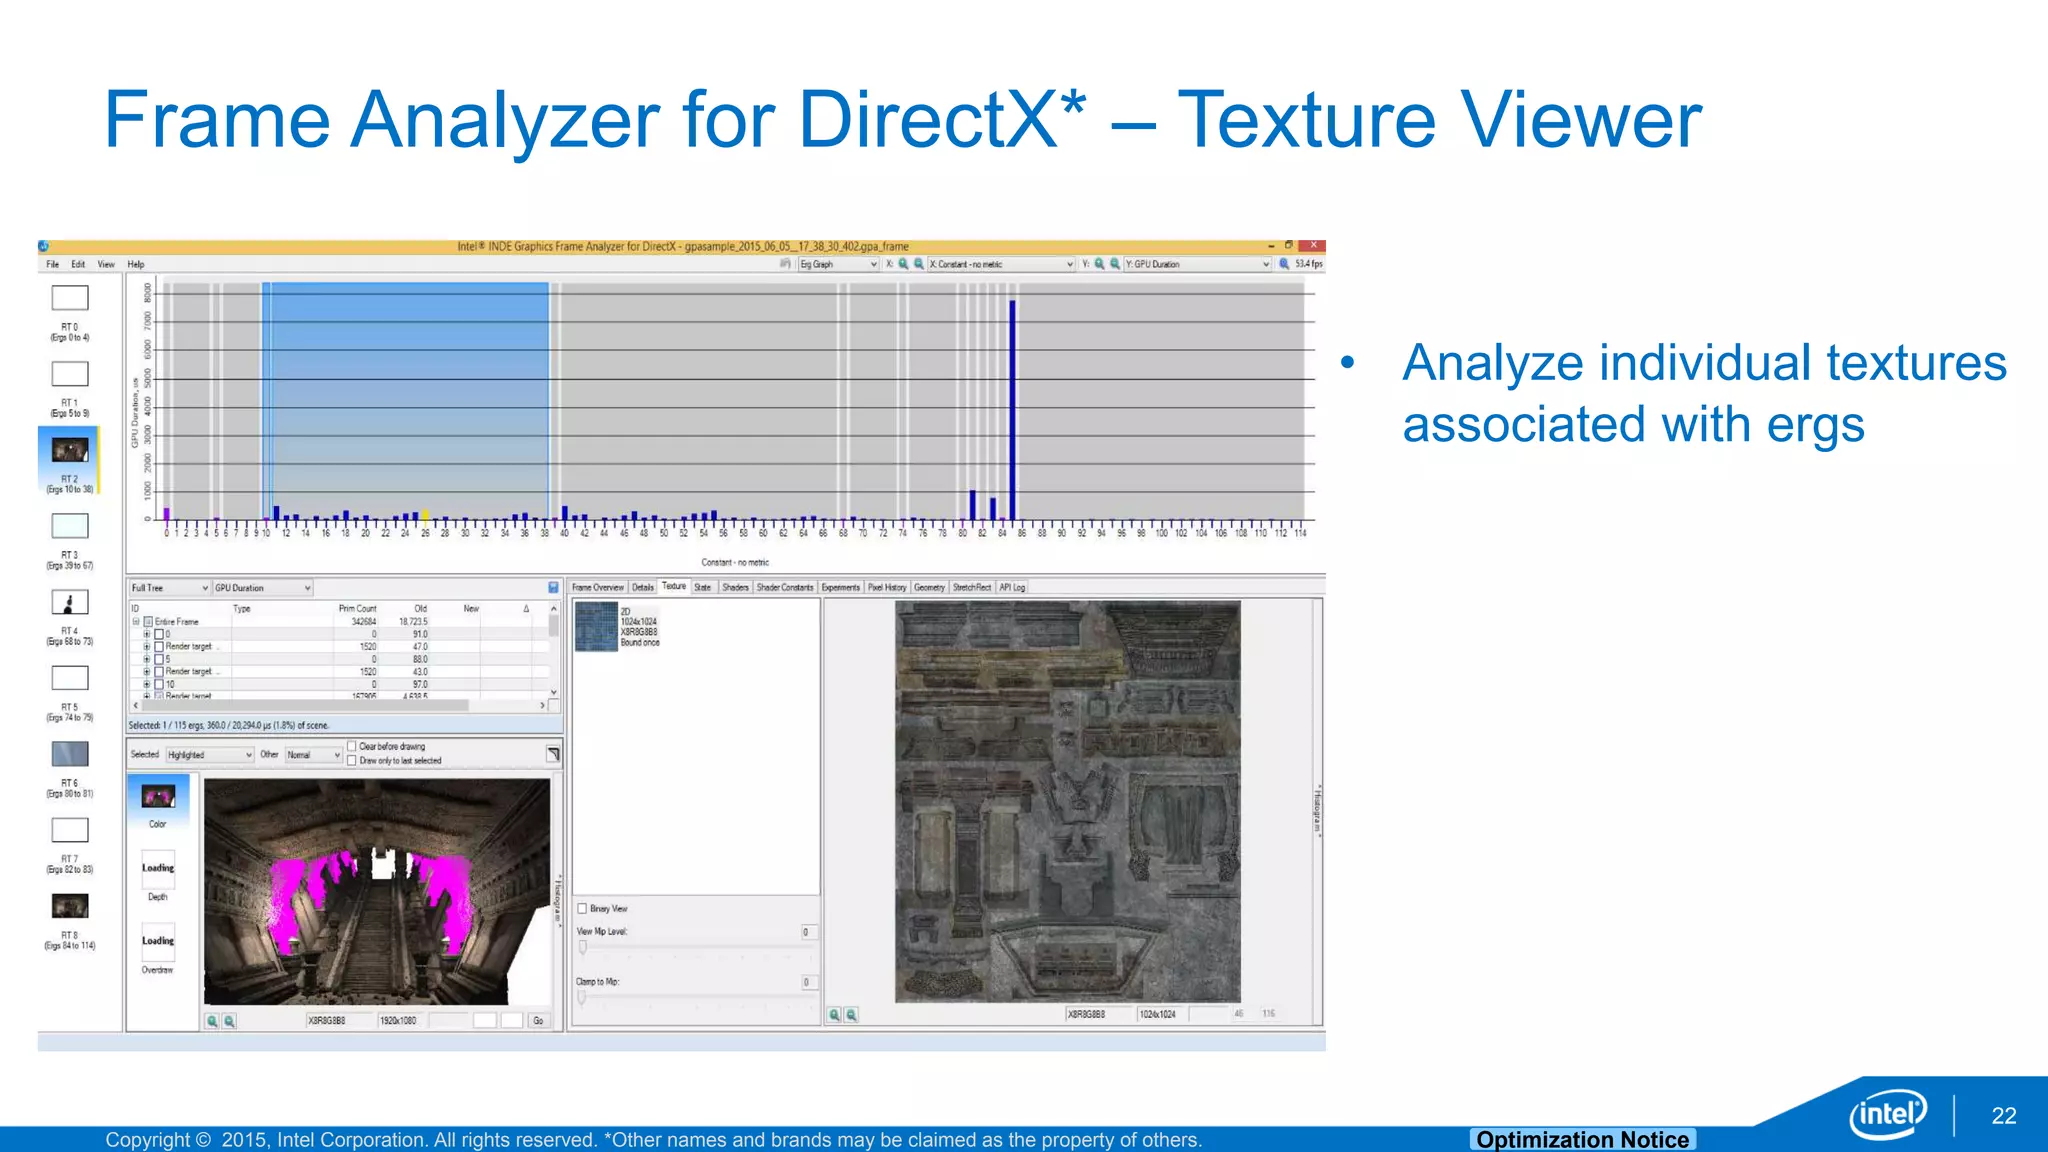
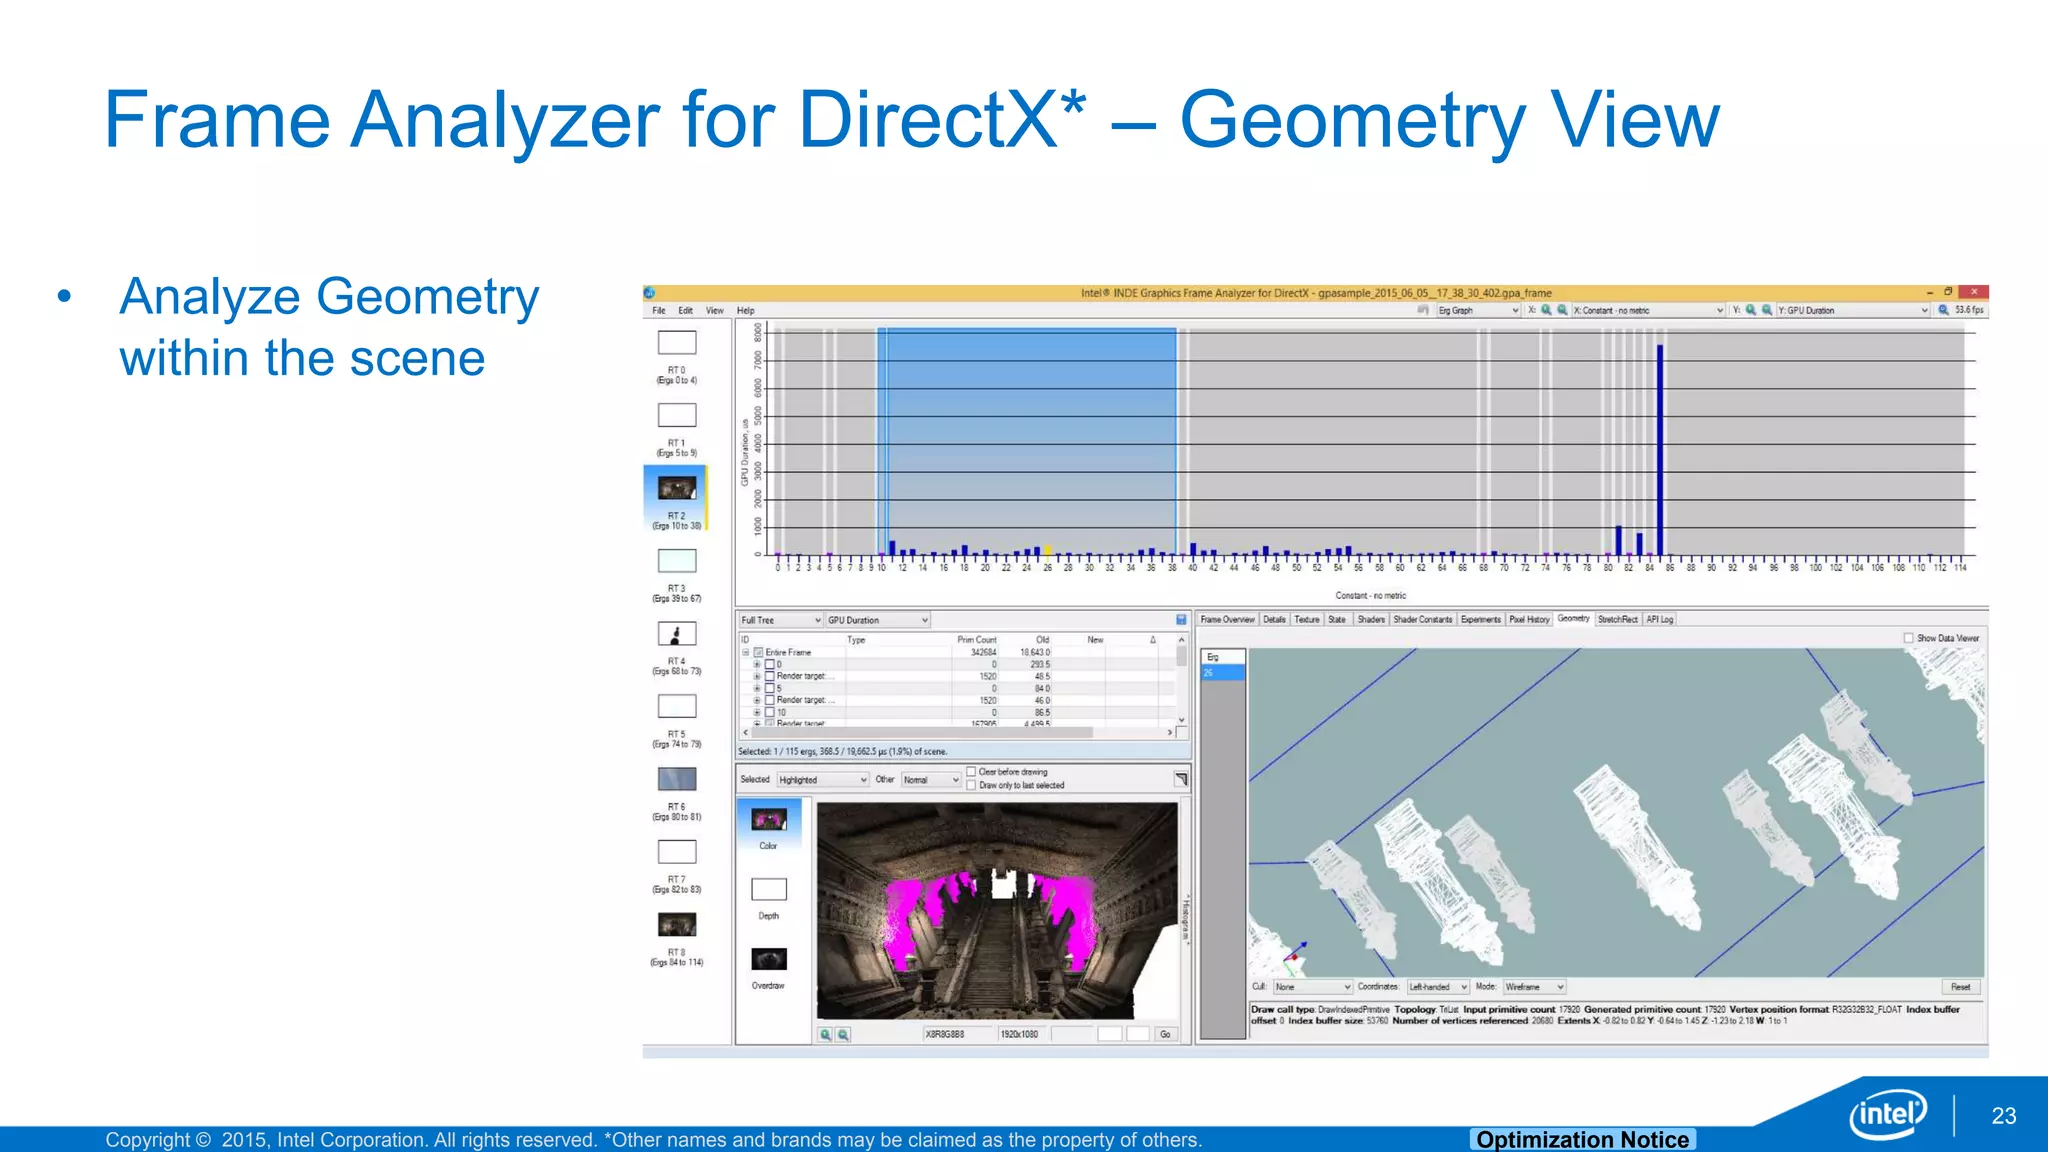
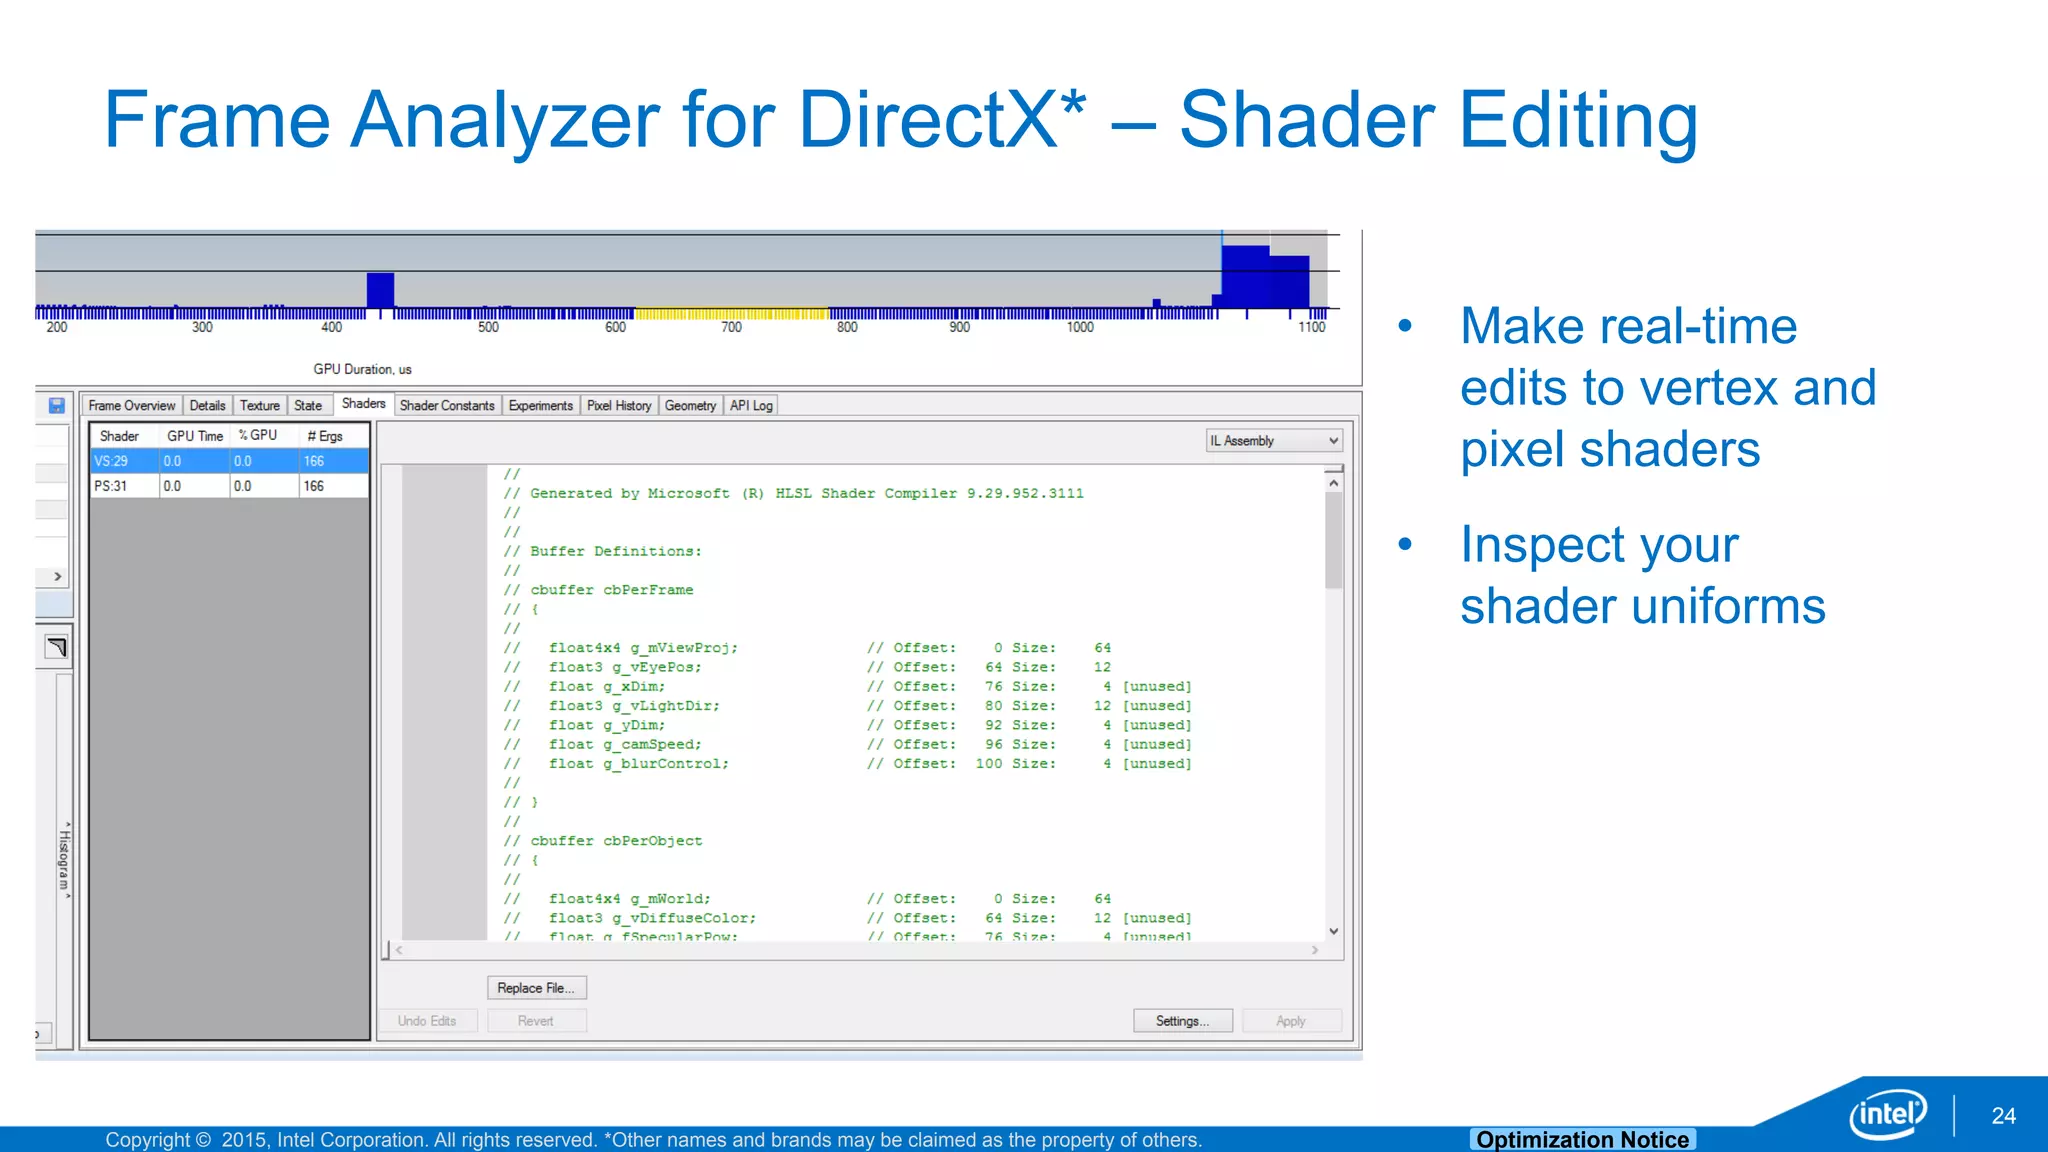
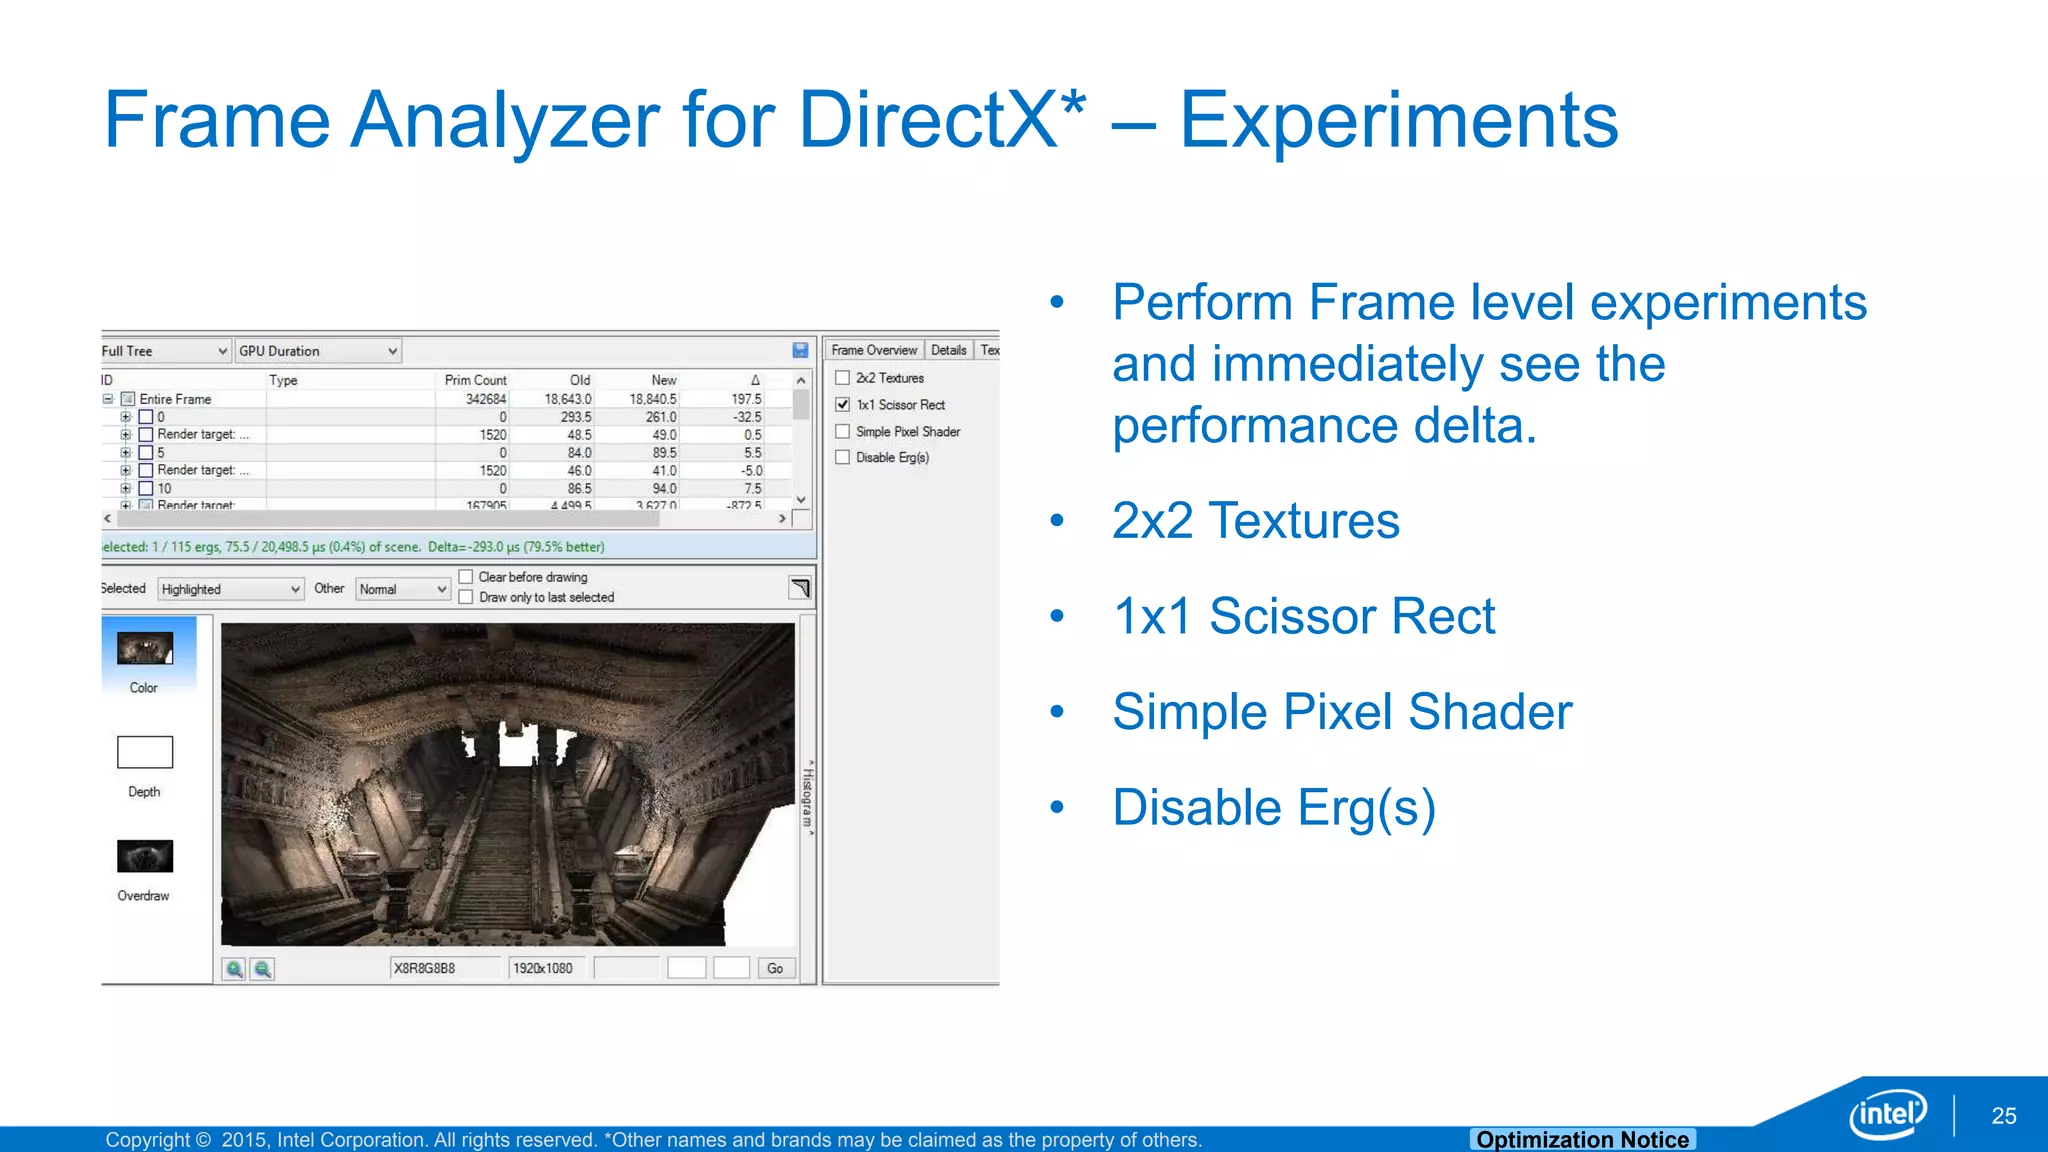
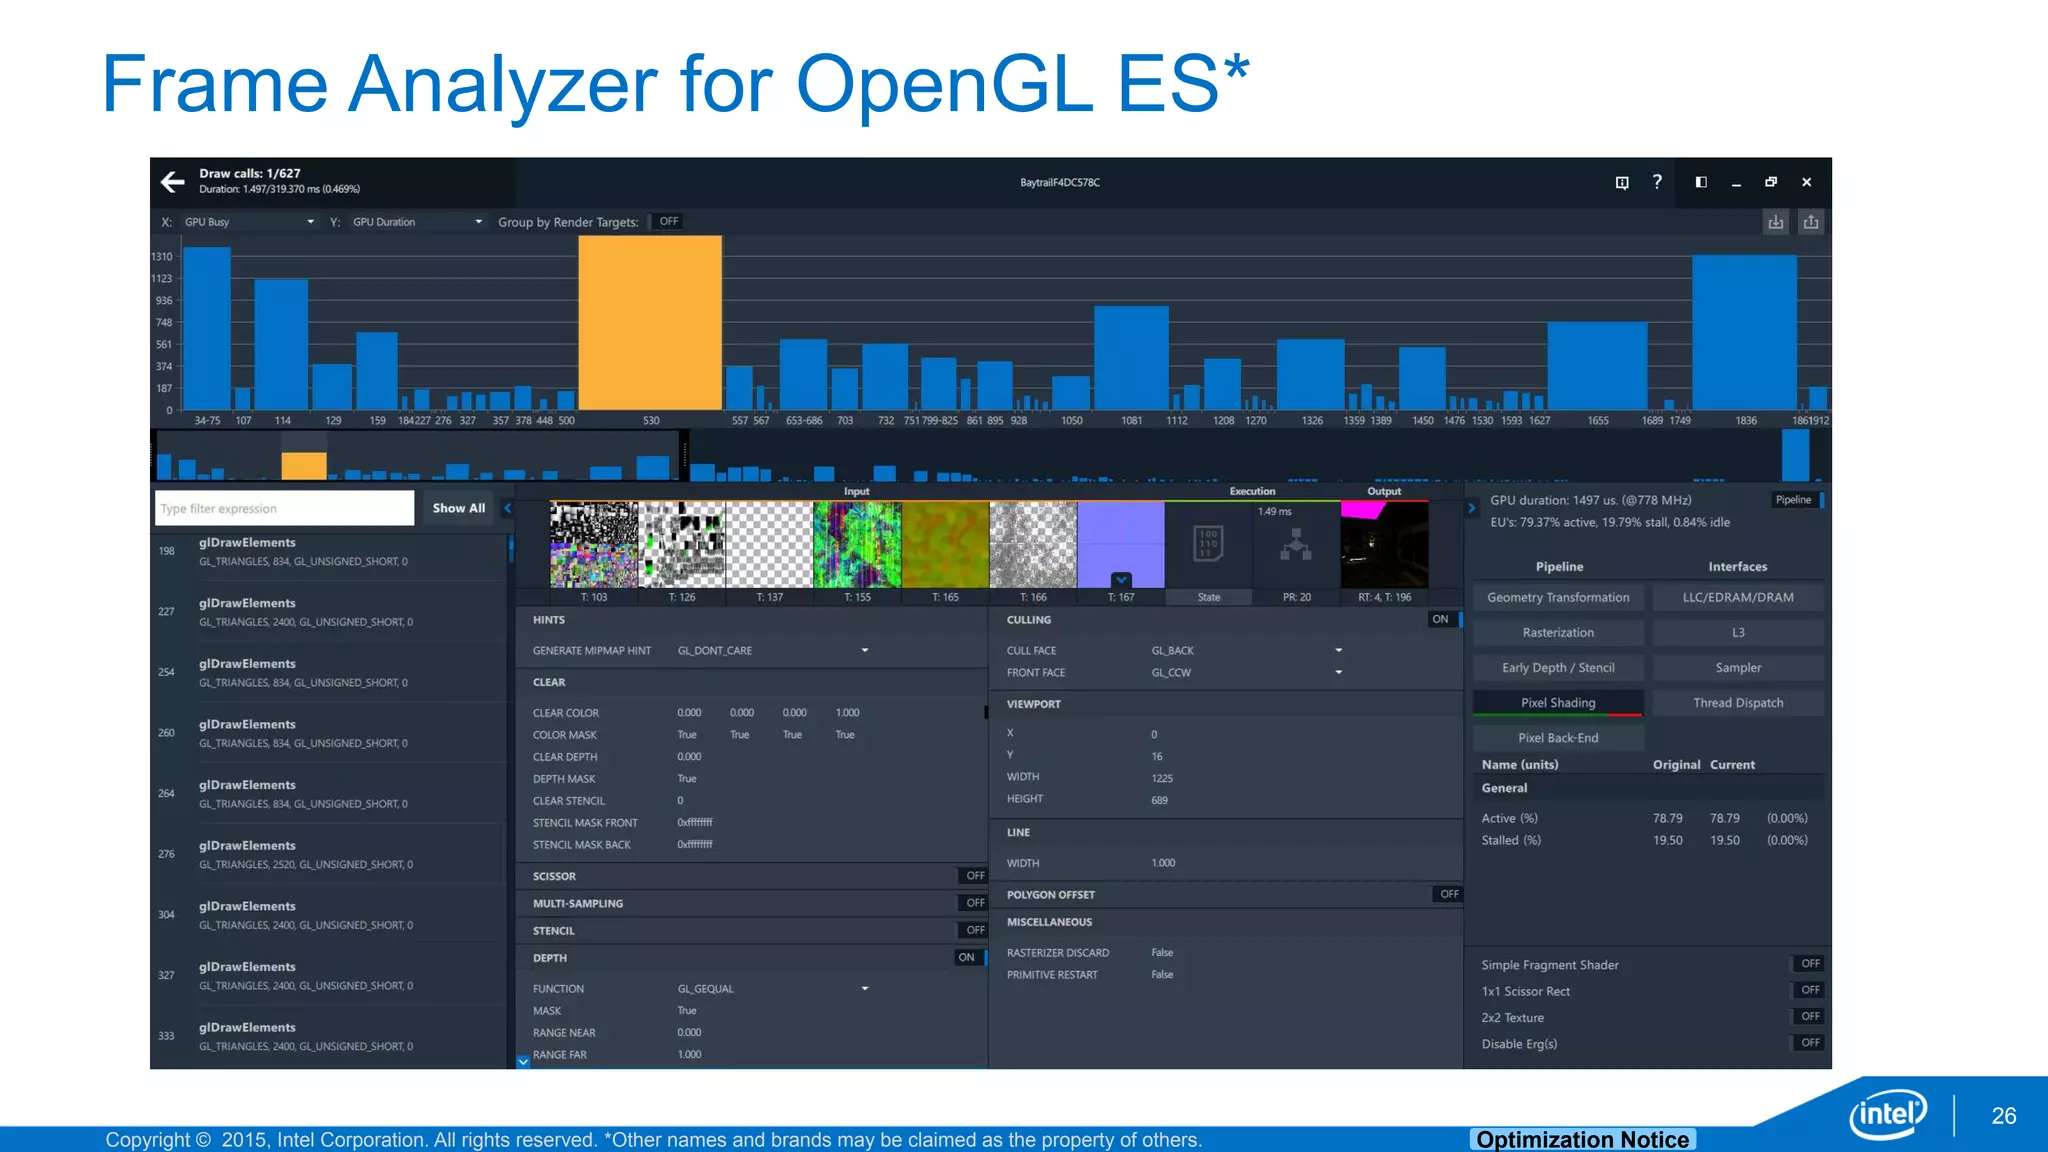
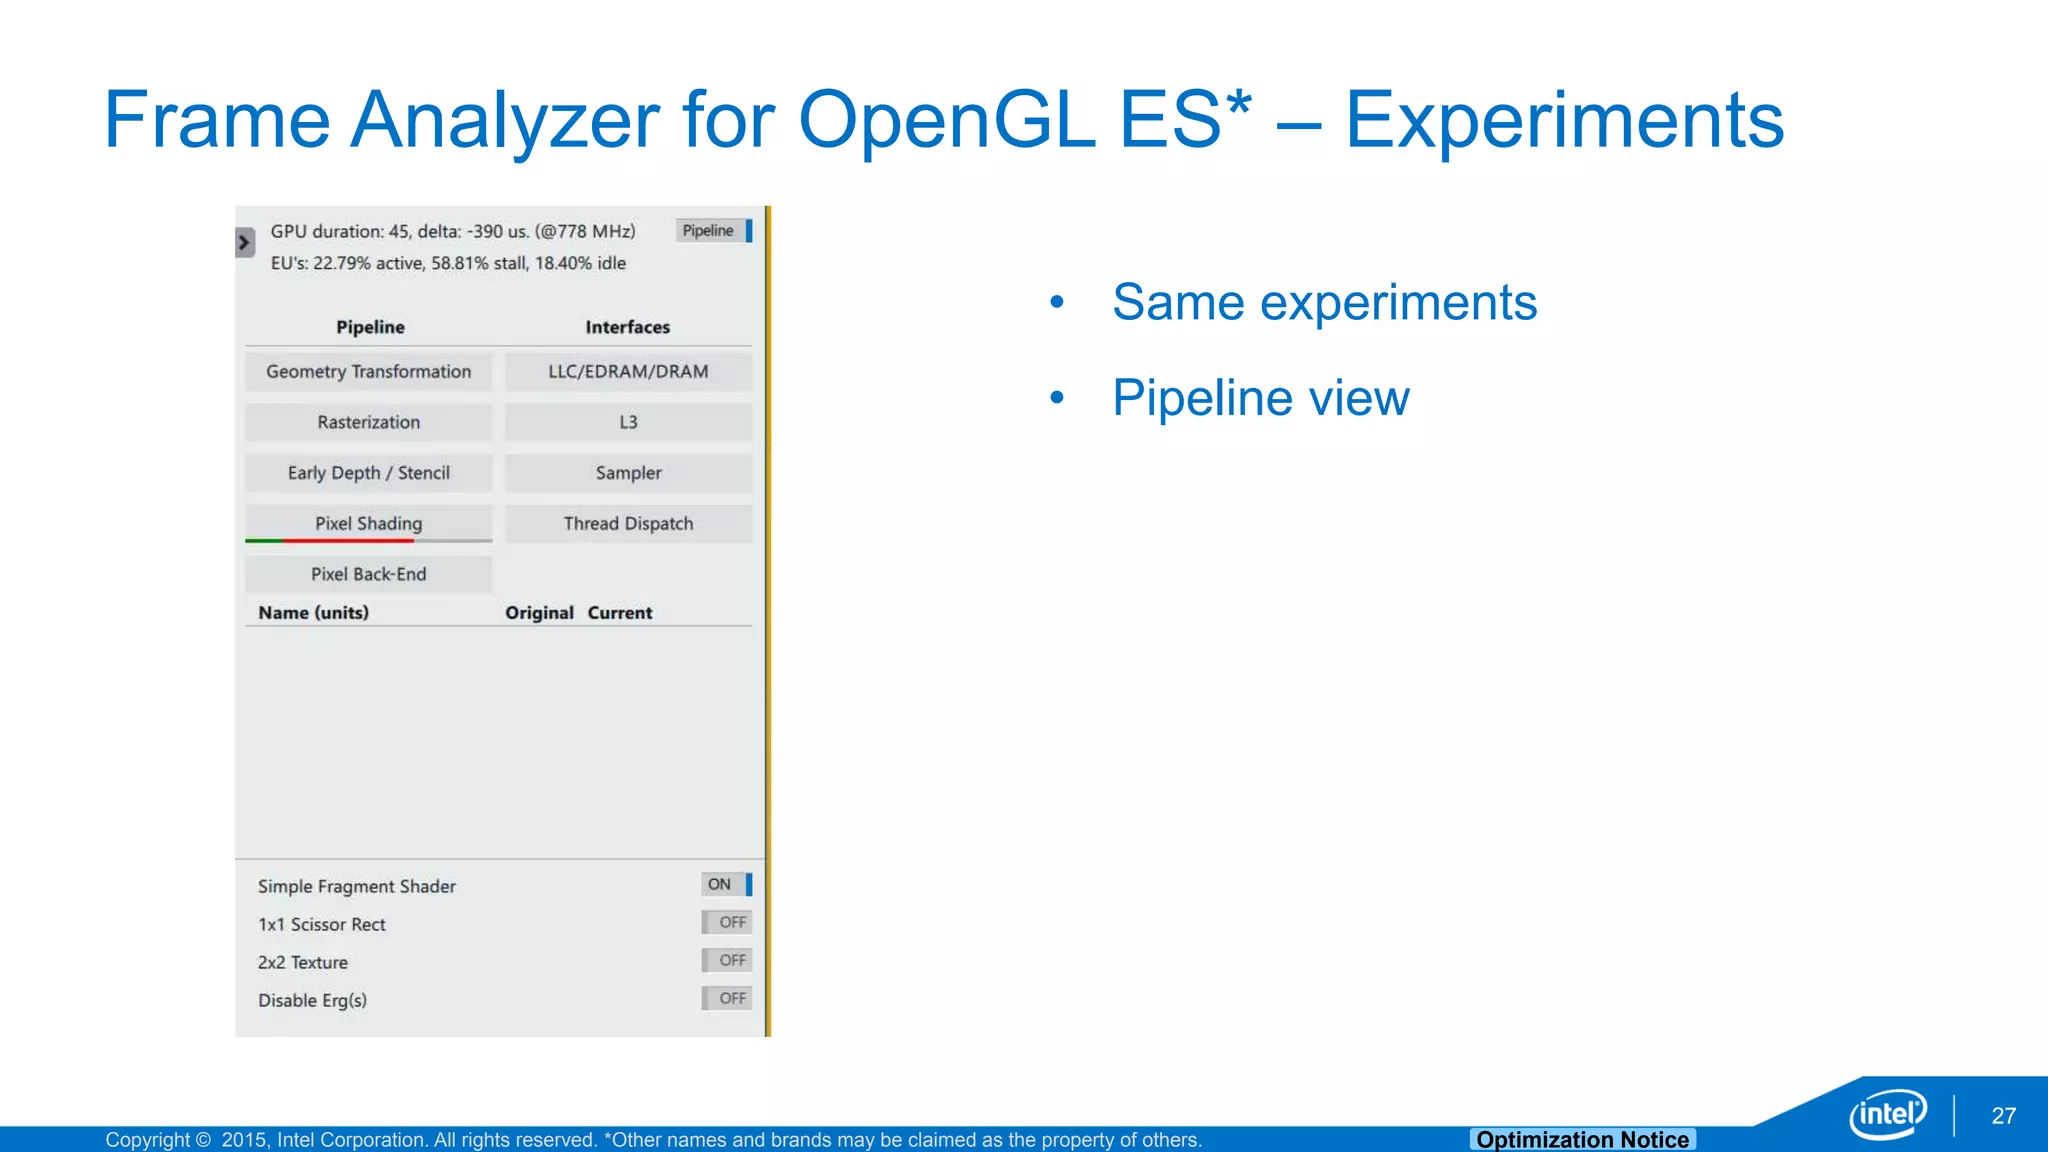
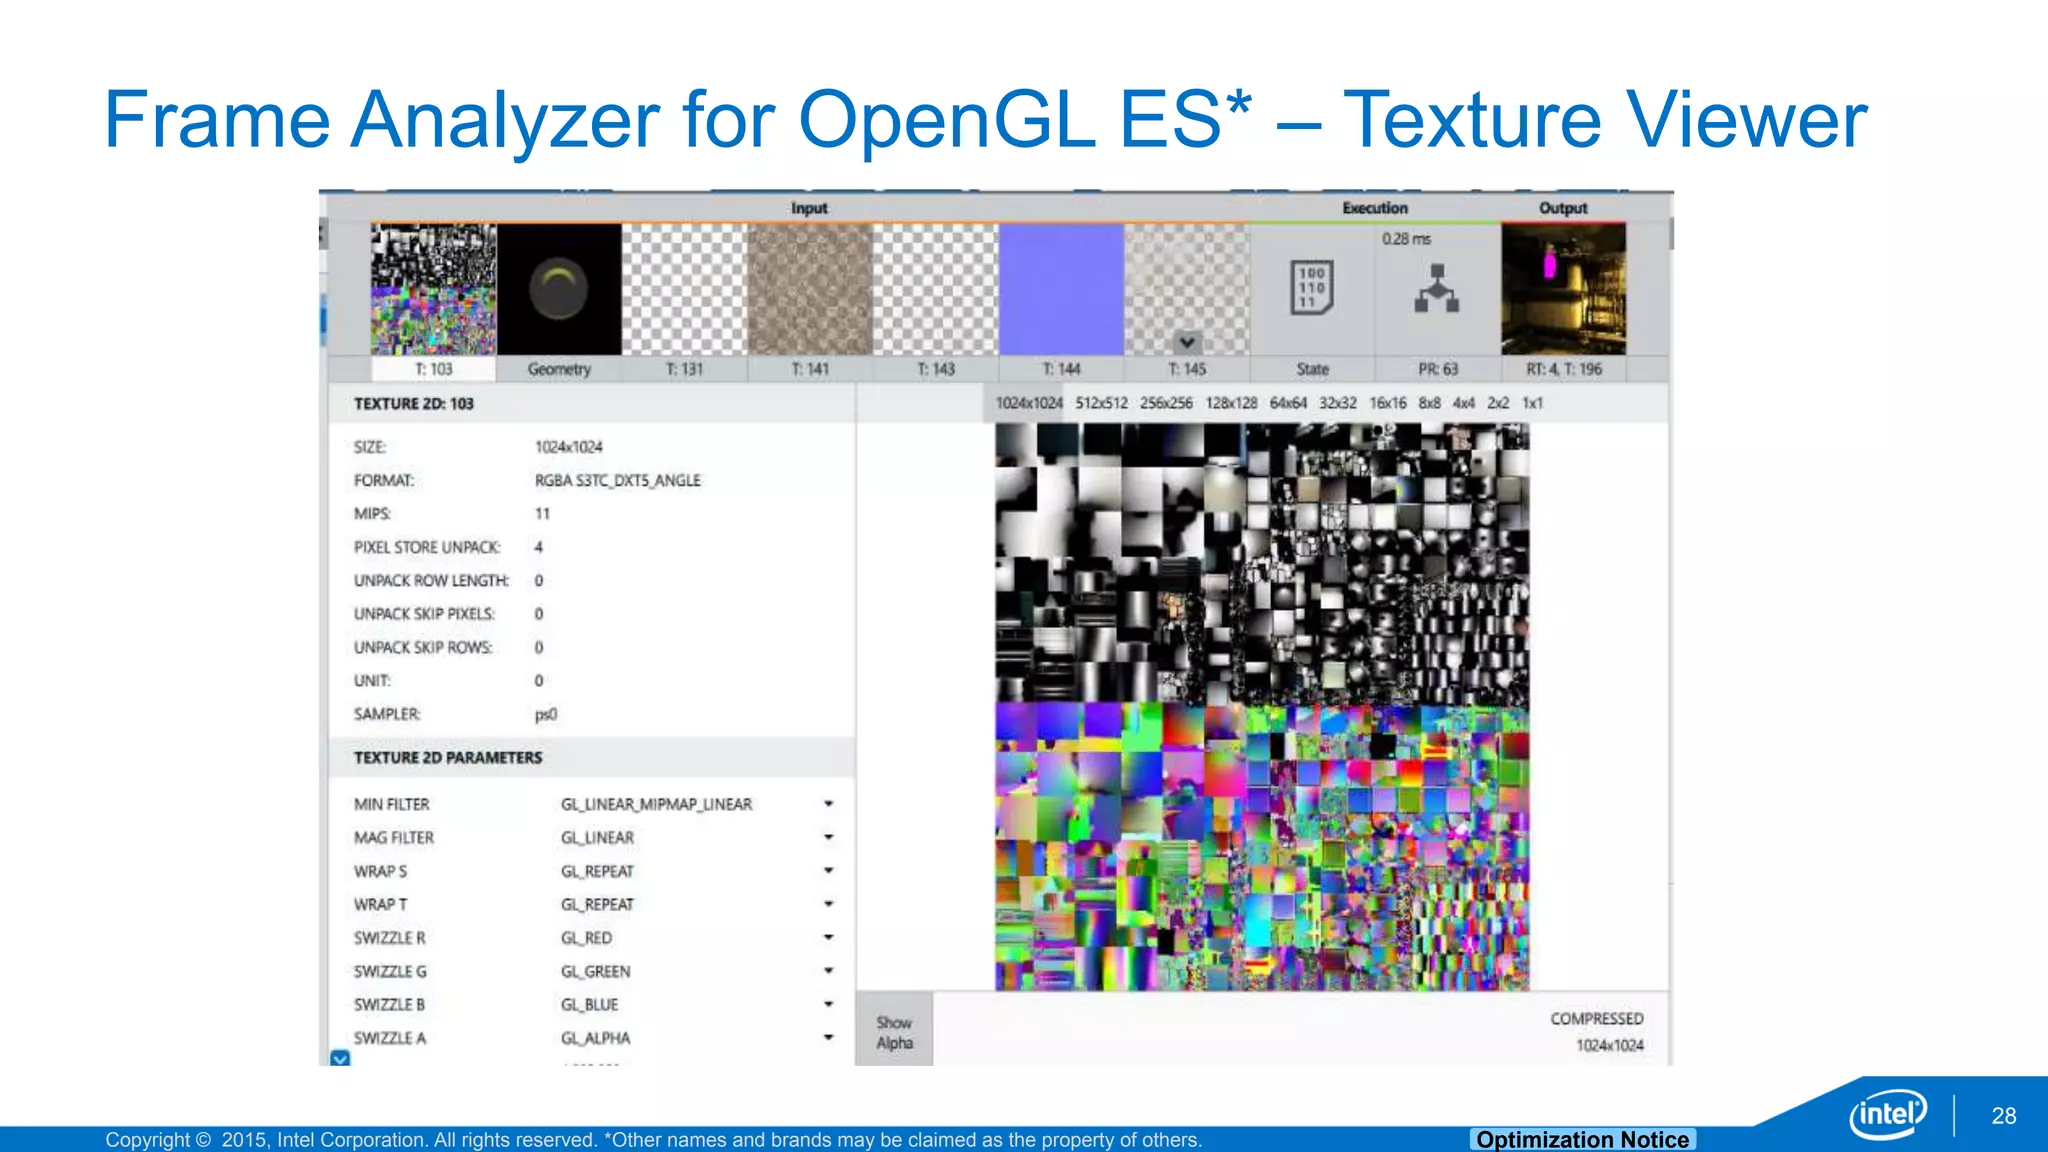
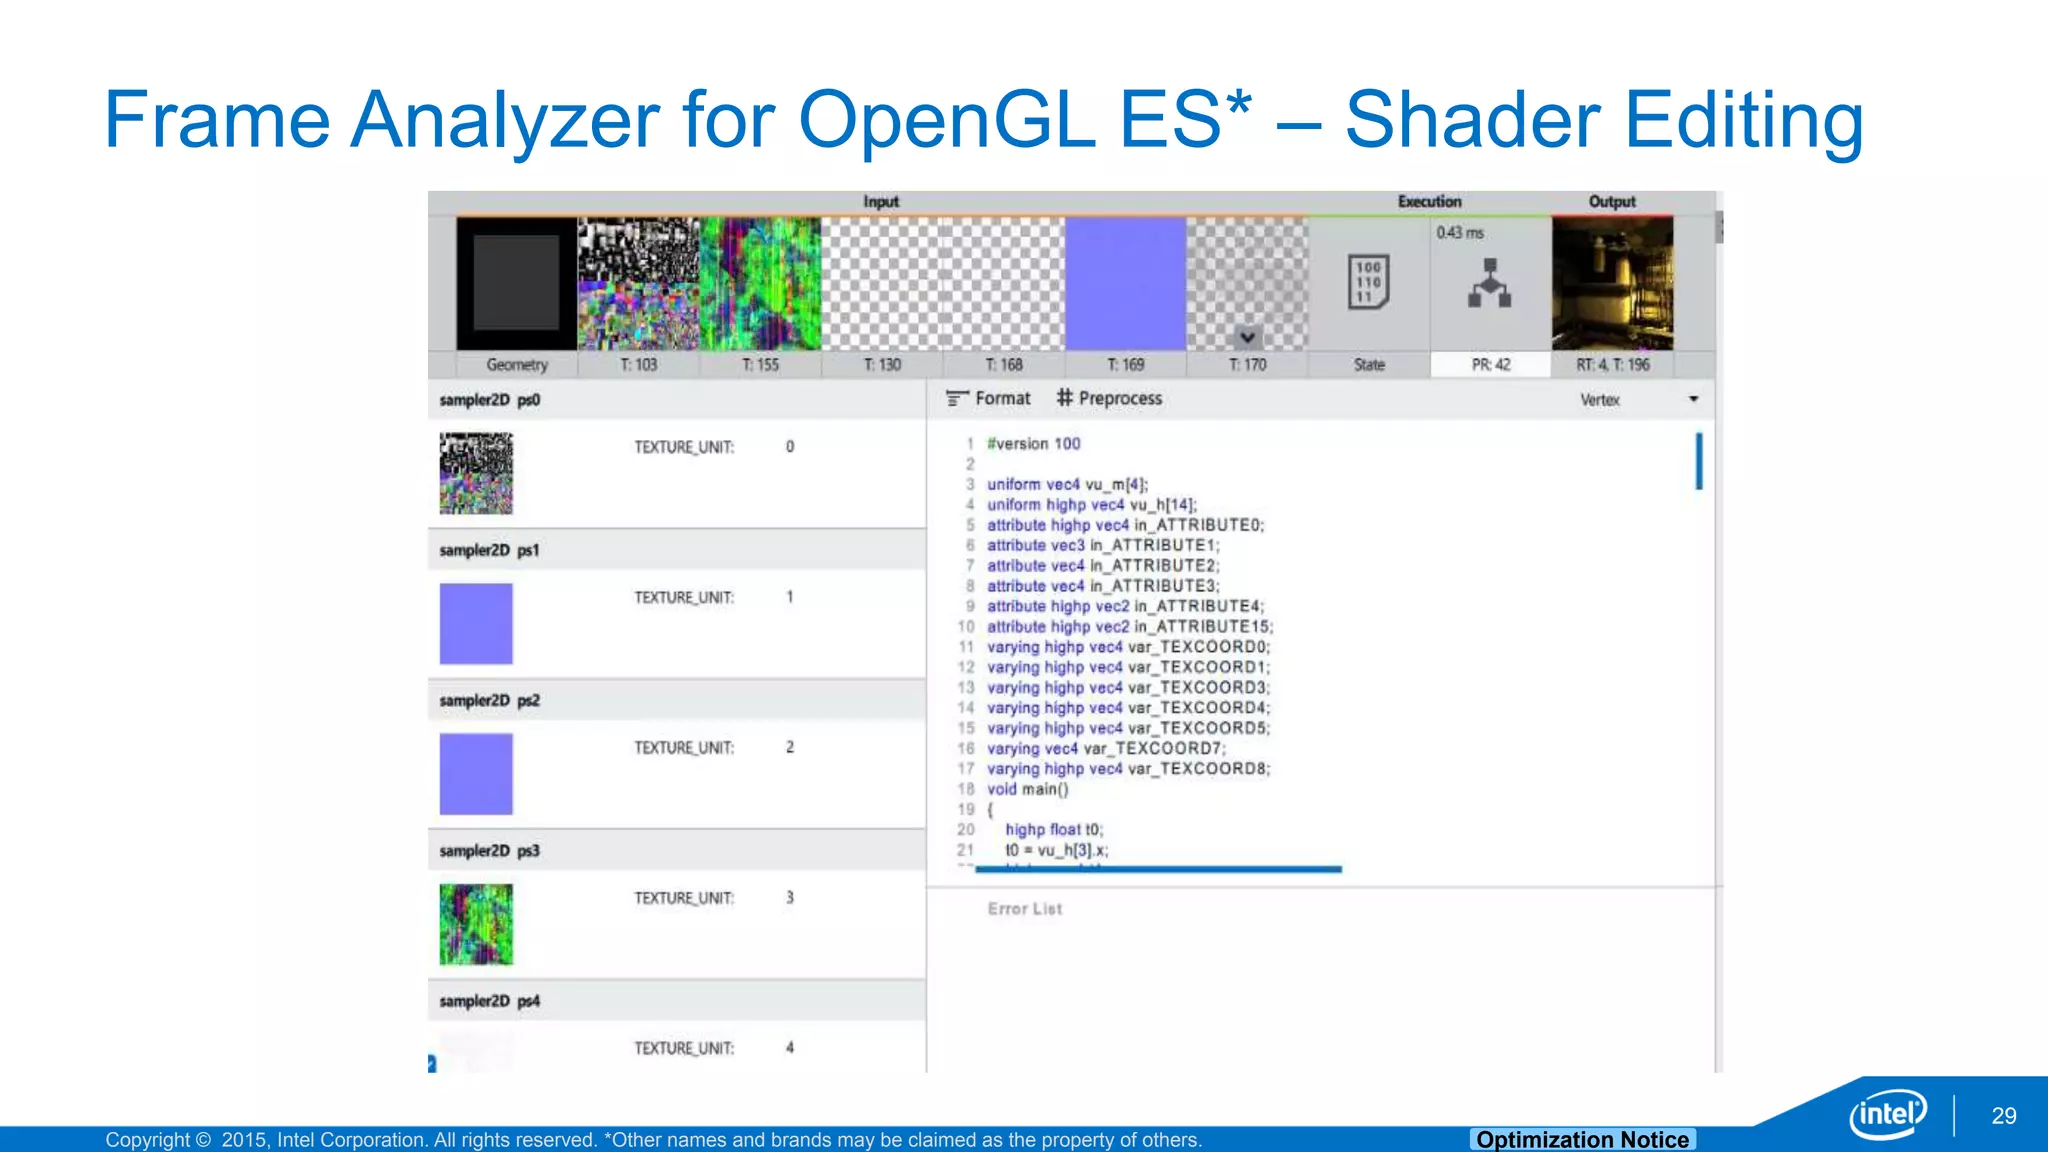
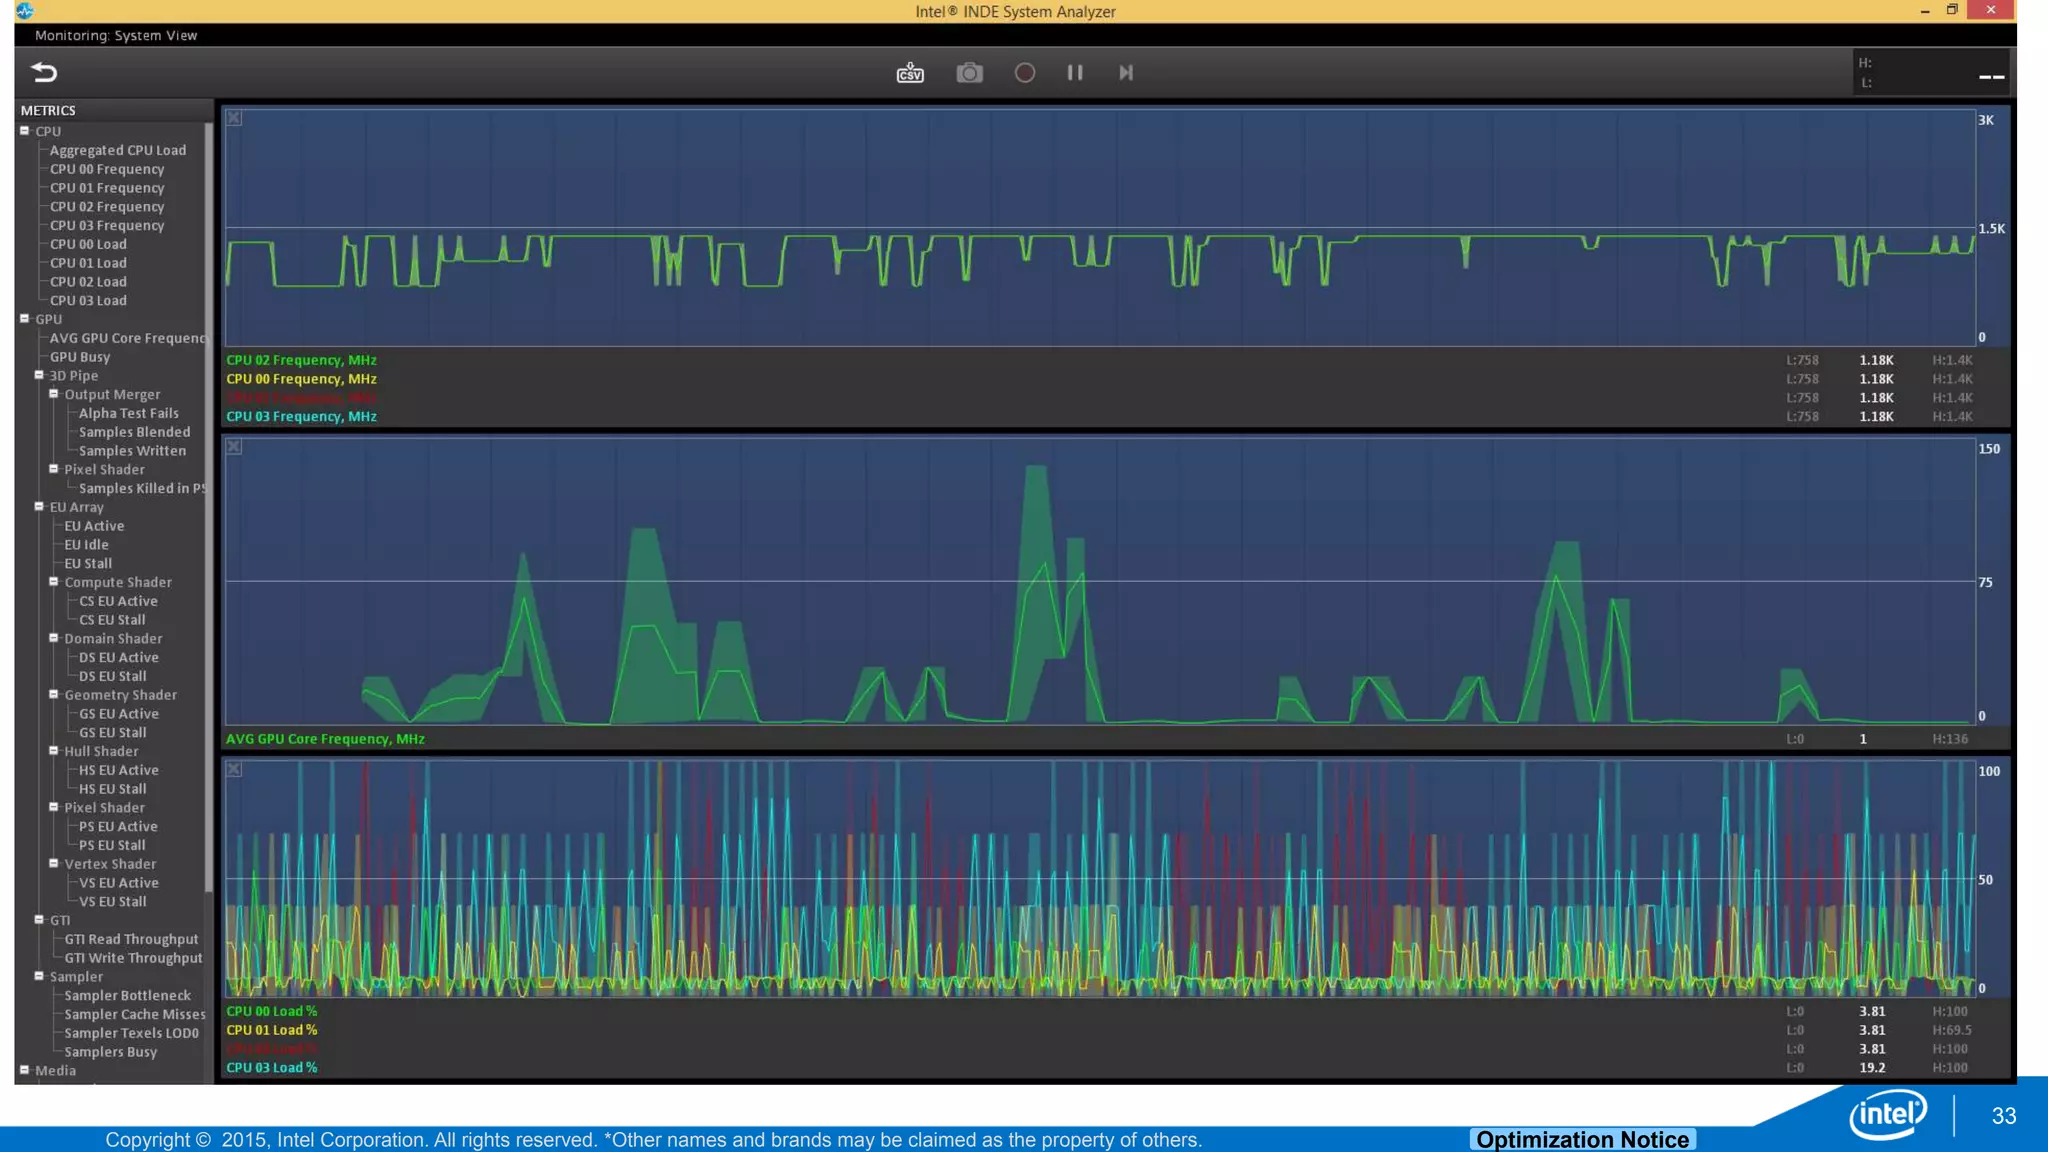
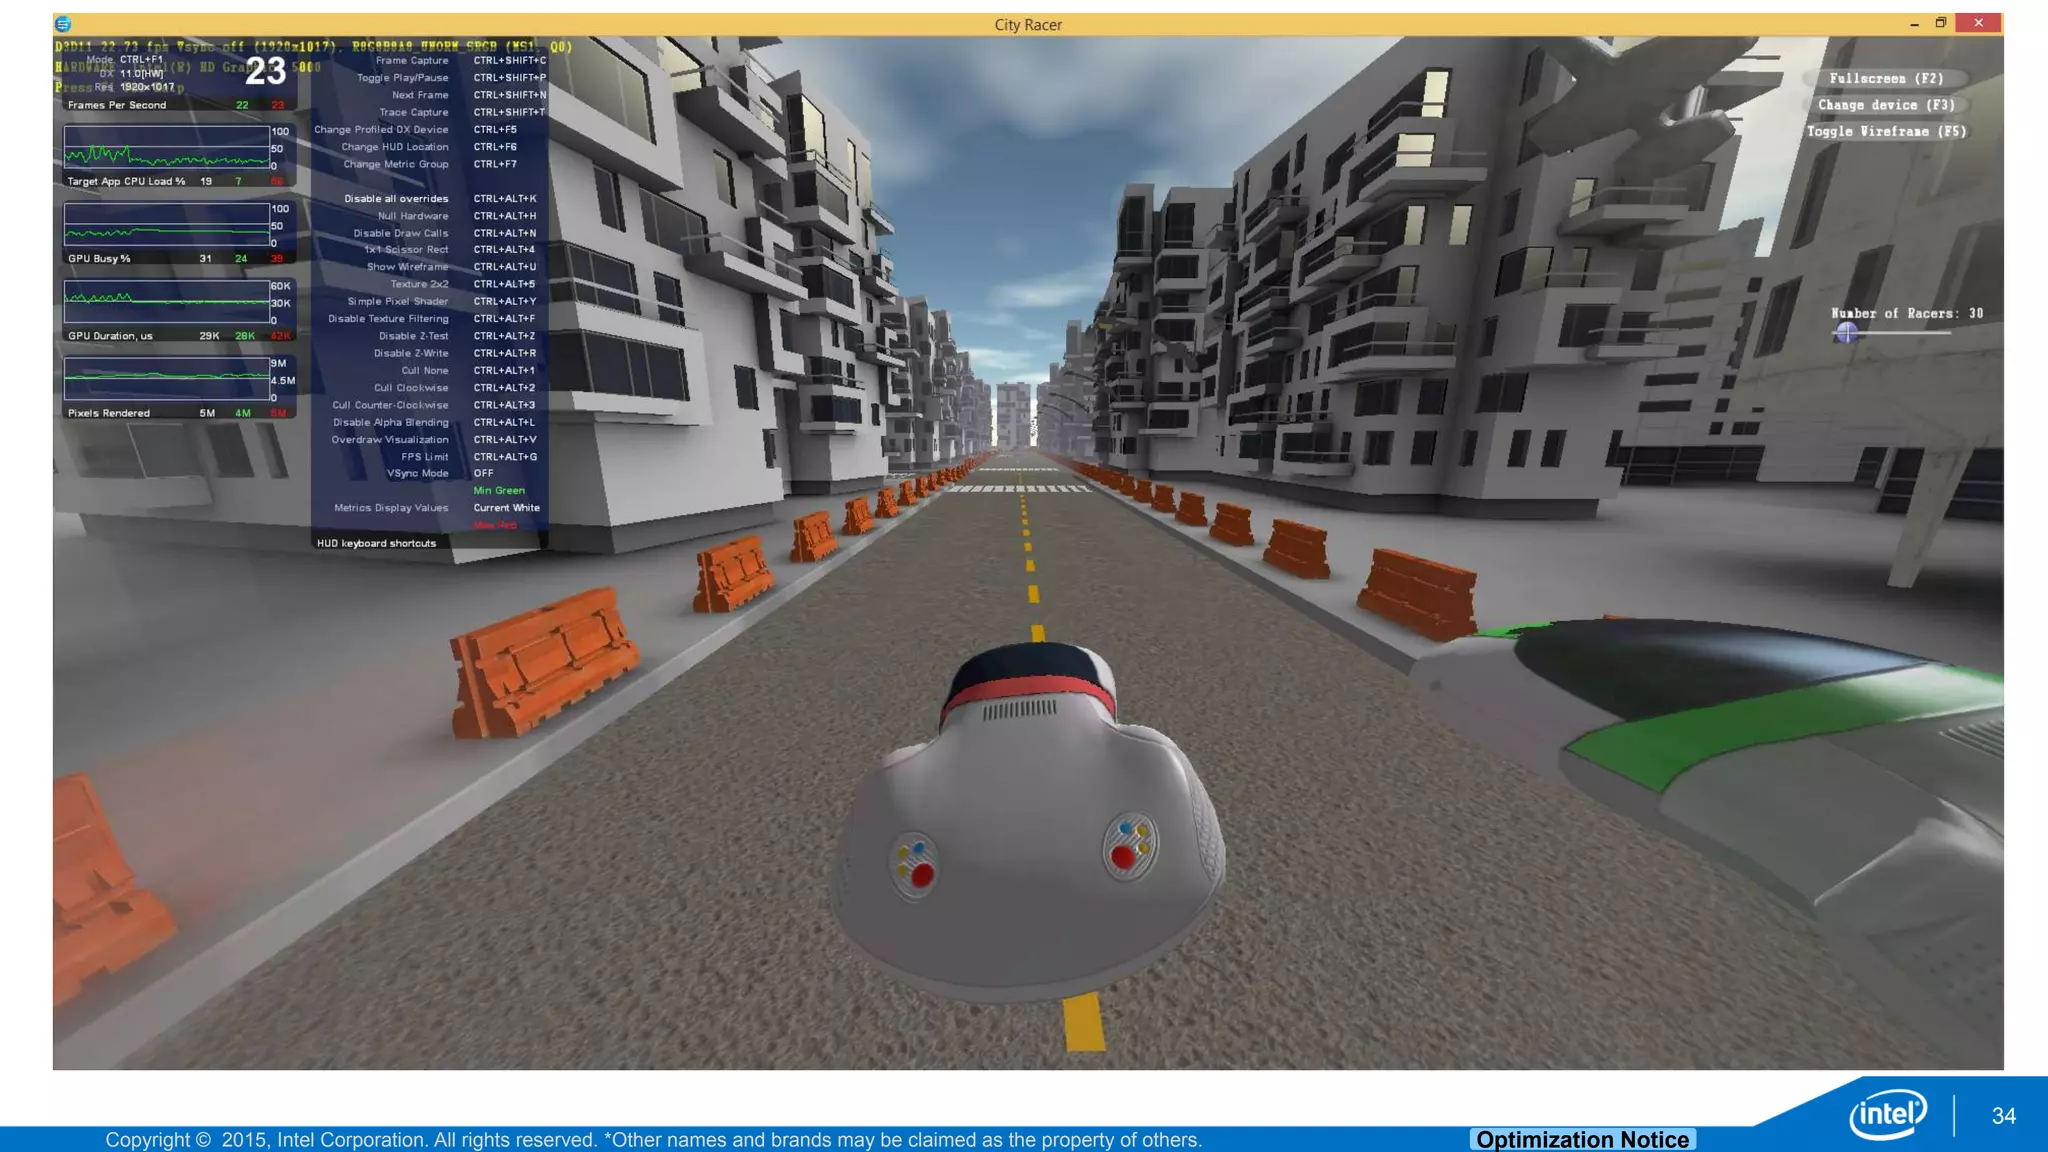
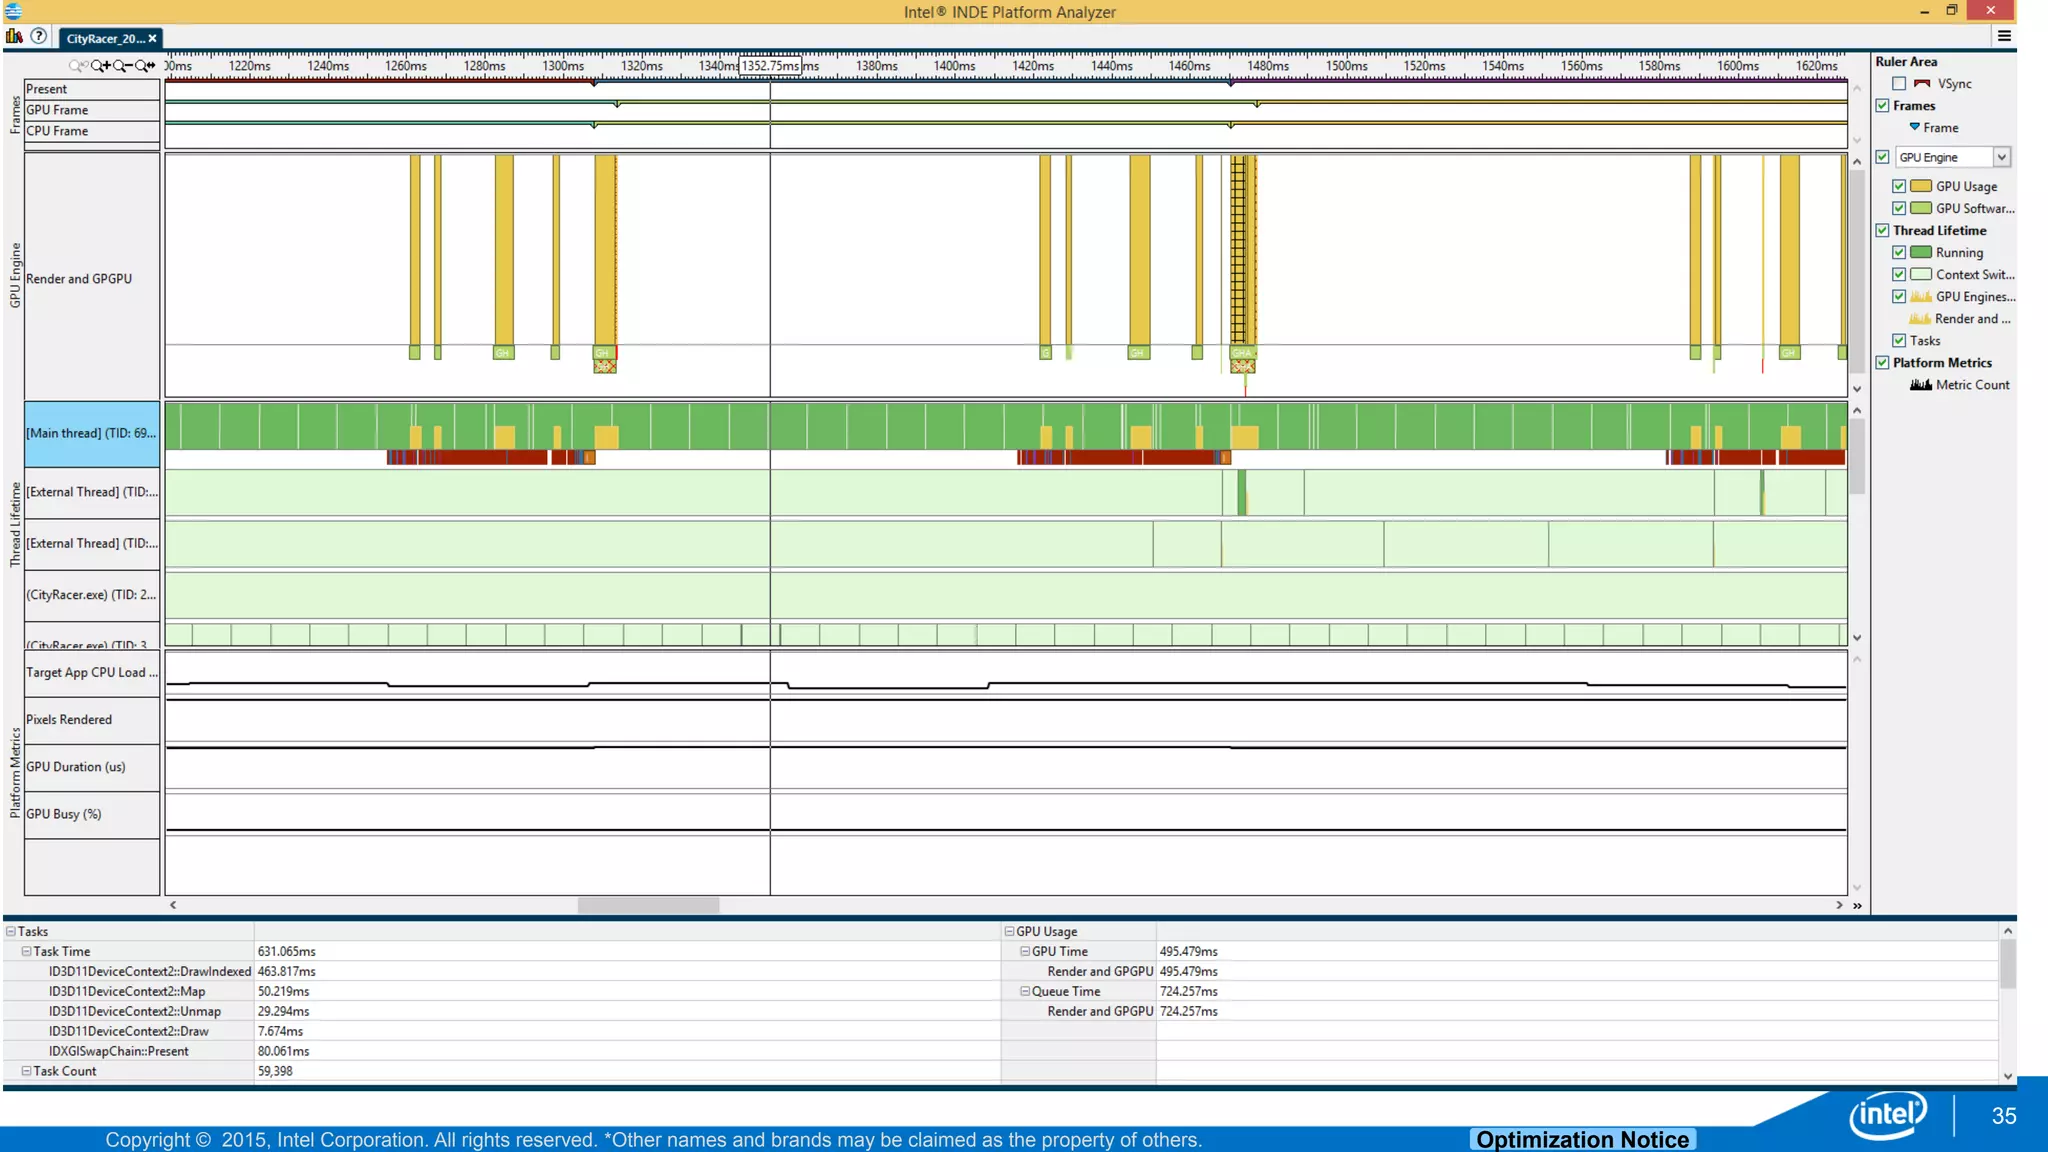
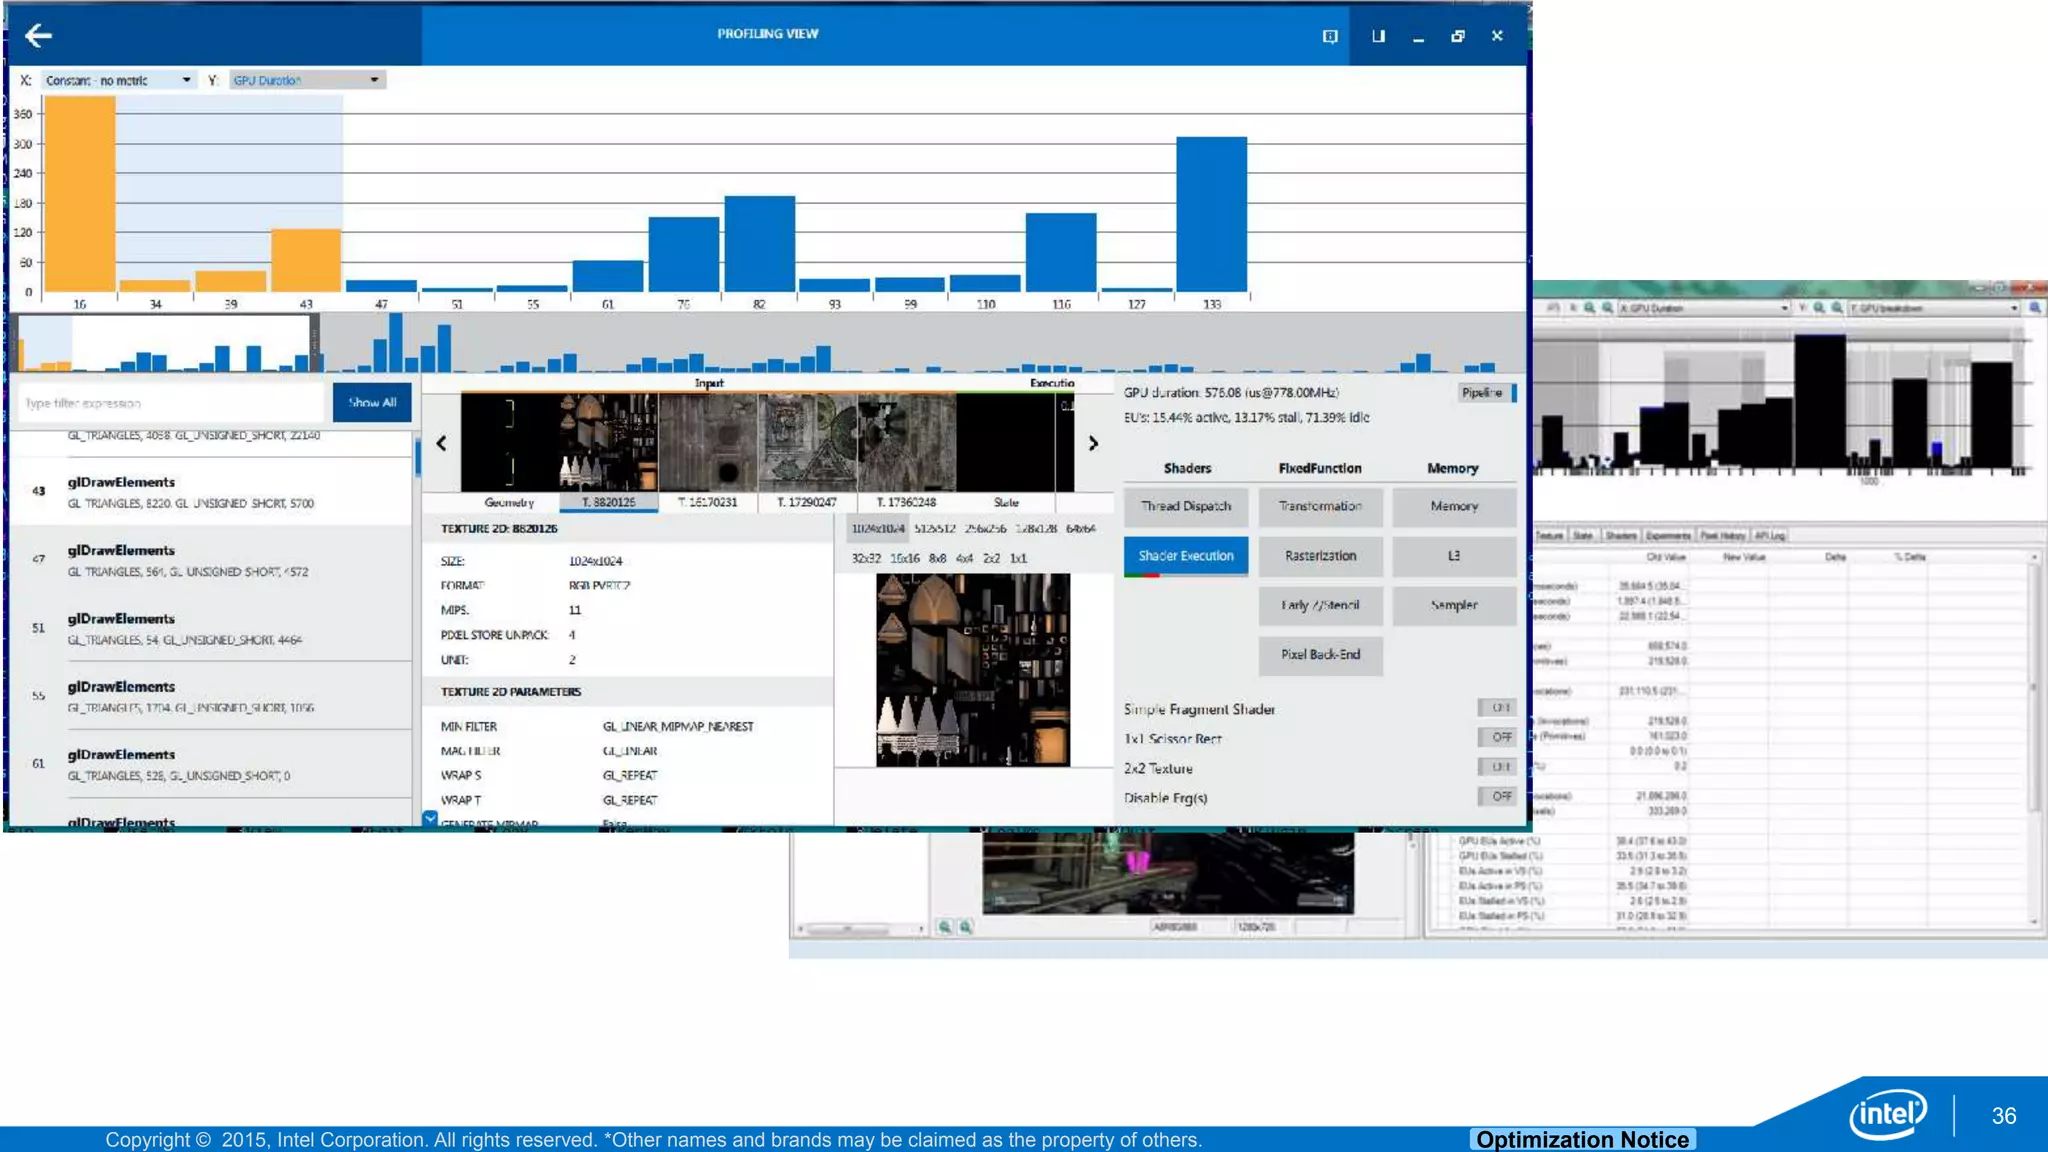
Intel® Graphics Performance Analyzers
Brandon Blair, Product Owner
October 2015
Intel® Graphics Performance Analyzers
(Intel® GPA)
PC gaming (Windows*, Ubuntu*) Mobile gaming (Windows, Android*)
Copyright © 2015, Intel Corporation. All rights reserved. *Other names and brands may be claimed as the property of others. Optimization Notice
3
Intel® INDE GPA - the app to optimize your games!
Desktop / AIO
High–End
GPU
Mainstream
Graphics
10fps
5fps
60+
fps
5fps
30 fps
30+
fps
Copyright © 2015, Intel Corporation. All rights reserved. *Other names and brands may be claimed as the property of others. Optimization Notice
4
Host/Target architecture
Host System
(Dev Box)
Target System
Copyright © 2015, Intel Corporation. All rights reserved. *Other names and brands may be claimed as the property of others. Optimization Notice
Host OS
Win 7, Win 8.1, Win 10
(64-bit)
DirectX*
DX 9.x, 10.x, 11.2
Target Hardware
Intel, Nvidia, AMD GPUs
Windows Tablets
5
Optimize Windows*, Android*, and Ubuntu* games!
Windows
Gaming
Android
Gaming
Host OS
Windows, Ubuntu, OSX
OpenGL ES*
1.x, 2.x, 3.x
Target Hardware
Intel® Atom™, ARM*
Android OS
4.x, 5.x
Ubuntu
Gaming
Host OS
Ubuntu*
OpenGL*
3.x, 4.0
Target Hardware
Intel® HD Graphics 2500+
Target OS
Ubuntu 14.04, 15.04
Copyright © 2015, Intel Corporation. All rights reserved. *Other names and brands may be claimed as the property of others. Optimization Notice
6
What’s inside Intel® GPA?
Frame AnalyzerPlatform Analyzer
Draw-call bar-chart
DX / GL ES resources
Metrics, experiments
System Analyzer / HUD
Frame-rate and metrics
Overrides
Frame/Trace capture
Frame-level analysisVisual tasks timeline
GPU / DX frame graph
DX / CPU tasks
ETW tasks
Graphics Monitor
Analysis starting point
HUD profiles
Settings
GPA configuration tool
Copyright © 2015, Intel Corporation. All rights reserved. *Other names and brands may be claimed as the property of others. Optimization Notice
7
Intel® GPA analysis workflow
Game with HUD / System Analyzer:
Real-time in-game Analysis / Experiments
Frame Analyzer:
Deep frame-level Analysis / Experiments
Platform Analyzer:
GPU / Gfx API / CPU tasks visual
timeline
+
CPU Limited
GPU Limited
Capture frame
Capture
trace
Run with
Intel® GPA
In-Game Analysis Offline Analysis
Copyright © 2015, Intel Corporation. All rights reserved. *Other names and brands may be claimed as the property of others. Optimization Notice
8
Start Analysis with Minimal Setup
• No Code Changes Needed
• No Root Required*
• No Mobile App Installation
• ADB interface
* For platform analysis or debug enabled application
• No Code Changes Needed
• No Environment Changes
• No IDE Necessary
• Remote System Analysis
Meet the Analyzers
System Analyzer, Frame Analyzer, Platform Analyzer
Copyright © 2015, Intel Corporation. All rights reserved. *Other names and brands may be claimed as the property of others. Optimization Notice
Graphics Monitor
10
• Launch point
• Set HUD metrics
• Set capture triggers
• View Logs and System Info
Copyright © 2015, Intel Corporation. All rights reserved. *Other names and brands may be claimed as the property of others. Optimization Notice
System Analyzer
11
• View performance metrics in real time
and determine how your application is
executing
• Understand the power utilization of
device
• Experiment with graphics pipeline state
without changing code
• Capture frames and traces for detailed
out-of-game analysis
Copyright © 2015, Intel Corporation. All rights reserved. *Other names and brands may be claimed as the property of others. Optimization Notice
System Analyzer – Details – Real Time Metrics
12
• CPU Metrics
• GPU Metrics
• Memory Metrics
• Power Metrics
• Graphics API Metrics
• Other Platform Metrics
*Metric availability depends on platform
Copyright © 2015, Intel Corporation. All rights reserved. *Other names and brands may be claimed as the property of others. Optimization Notice
System Analyzer – Details – 3D settings
13
• Frame rate, resolution, Vsync, and
API indicators
• Override CPU frequency in real time
and see the performance delta
Copyright © 2015, Intel Corporation. All rights reserved. *Other names and brands may be claimed as the property of others. Optimization Notice
System Analyzer – Details – 3D continued
14
Real time analysis and experiments
• 1x1 Scissor Rect
• Disable Alpha Blending
• Disable Draw Calls
• Disable Z-Test
• Simple Pixel/Fragment Shader
• Show Wireframe
• Texture 2x2
Analyze with
System Analyzer
Texture 2x2
Subway Patrol* for Android*
Copyright © 2015, Intel Corporation. All rights reserved. *Other names and brands may be claimed as the property of others. Optimization Notice
Heads Up Display (HUD)
15
• Full System
Analyzer
workflow for
your single
system DirectX*
profiling.
• Developed for
full screen
analysis
Copyright © 2015, Intel Corporation. All rights reserved. *Other names and brands may be claimed as the property of others. Optimization Notice
Heads Up Display – Details
16
*Metric availability depends on platform
“Show Wireframe” Enabled
Copyright © 2015, Intel Corporation. All rights reserved. *Other names and brands may be claimed as the property of others. Optimization Notice
Platform Analyzer
17
• Correlate CPU and GPU activity to
understand whether your app is
effectively using all compute resources,
or it is CPU/GPU bound
• Identify GPU and CPU application frame
rate and how it depends on vertical sync
• Observe the relationship between
function execution and recorded metrics
Copyright © 2015, Intel Corporation. All rights reserved. *Other names and brands may be claimed as the property of others. Optimization Notice
Platform Analyzer – Details
18
Bubble
Not using both
cores
GPU Queue DX Tasks SA Metrics
Context
Switches
Copyright © 2015, Intel Corporation. All rights reserved. *Other names and brands may be claimed as the property of others. Optimization Notice
Frame Analyzer for DirectX* and OpenGL*
19
• Explore metrics to find performance
bottlenecks
• Analyze all graphics resources used in
the frame
• Experiment with rendering states and
shaders without recompiling
• For Android* applications: correlate
rendering issues with the exact stage of
the graphics pipeline
Copyright © 2015, Intel Corporation. All rights reserved. *Other names and brands may be claimed as the property of others. Optimization Notice
Frame Analyzer for DirectX*
20
Copyright © 2015, Intel Corporation. All rights reserved. *Other names and brands may be claimed as the property of others. Optimization Notice
Frame Analyzer DirectX* – Ergs and Metrics
21
• Identify high cost items
with the bar chart
• Selection individual items
for deeper analysis
Copyright © 2015, Intel Corporation. All rights reserved. *Other names and brands may be claimed as the property of others. Optimization Notice
Frame Analyzer for DirectX* – Texture Viewer
22
• Analyze individual textures
associated with ergs
Copyright © 2015, Intel Corporation. All rights reserved. *Other names and brands may be claimed as the property of others. Optimization Notice
Frame Analyzer for DirectX* – Geometry View
23
• Analyze Geometry
within the scene
Copyright © 2015, Intel Corporation. All rights reserved. *Other names and brands may be claimed as the property of others. Optimization Notice
Frame Analyzer for DirectX* – Shader Editing
24
• Make real-time
edits to vertex and
pixel shaders
• Inspect your
shader uniforms
Copyright © 2015, Intel Corporation. All rights reserved. *Other names and brands may be claimed as the property of others. Optimization Notice
Frame Analyzer for DirectX* – Experiments
25
• Perform Frame level experiments
and immediately see the
performance delta.
• 2x2 Textures
• 1x1 Scissor Rect
• Simple Pixel Shader
• Disable Erg(s)
Copyright © 2015, Intel Corporation. All rights reserved. *Other names and brands may be claimed as the property of others. Optimization Notice
Frame Analyzer for OpenGL ES*
26
Copyright © 2015, Intel Corporation. All rights reserved. *Other names and brands may be claimed as the property of others. Optimization Notice
Frame Analyzer for OpenGL ES* – Experiments
27
• Same experiments
• Pipeline view
Copyright © 2015, Intel Corporation. All rights reserved. *Other names and brands may be claimed as the property of others. Optimization Notice
Frame Analyzer for OpenGL ES* – Texture Viewer
28
Copyright © 2015, Intel Corporation. All rights reserved. *Other names and brands may be claimed as the property of others. Optimization Notice
Frame Analyzer for OpenGL ES* – Shader Editing
29
Copyright © 2015, Intel Corporation. All rights reserved. *Other names and brands may be claimed as the property of others. Optimization Notice
DEMO
30
Copyright © 2015, Intel Corporation. All rights reserved. *Other names and brands may be claimed as the property of others. Optimization Notice
https://software.intel.com/gpa
31
Intel® Graphics Performance Analyzers*
*(It’s FREE)
Copyright © 2015, Intel Corporation. All rights reserved. *Other names and brands may be claimed as the property of others. Optimization Notice
Backup
32
Copyright © 2015, Intel Corporation. All rights reserved. *Other names and brands may be claimed as the property of others. Optimization Notice
33
Copyright © 2015, Intel Corporation. All rights reserved. *Other names and brands may be claimed as the property of others. Optimization Notice
34
Copyright © 2015, Intel Corporation. All rights reserved. *Other names and brands may be claimed as the property of others. Optimization Notice
35
Copyright © 2015, Intel Corporation. All rights reserved. *Other names and brands may be claimed as the property of others. Optimization Notice
36
Copyright © 2015, Intel Corporation. All rights reserved. *Other names and brands may be claimed as the property of others. Optimization Notice
Intel Confidential
37
Intel® GPA Release Notes
https://software.intel.com/en-us/articles/intel-gpa-release-notes
Copyright © 2015, Intel Corporation. All rights reserved. *Other names and brands may be claimed as the property of others. Optimization Notice
Legal Disclaimer & Optimization Notice
INFORMATION IN THIS DOCUMENT IS PROVIDED “AS IS”. NO LICENSE, EXPRESS OR IMPLIED, BY ESTOPPEL OR
OTHERWISE, TO ANY INTELLECTUAL PROPERTY RIGHTS IS GRANTED BY THIS DOCUMENT. INTEL ASSUMES NO
LIABILITY WHATSOEVER AND INTEL DISCLAIMS ANY EXPRESS OR IMPLIED WARRANTY, RELATING TO THIS
INFORMATION INCLUDING LIABILITY OR WARRANTIES RELATING TO FITNESS FOR A PARTICULAR PURPOSE,
MERCHANTABILITY, OR INFRINGEMENT OF ANY PATENT, COPYRIGHT OR OTHER INTELLECTUAL PROPERTY RIGHT.
Software and workloads used in performance tests may have been optimized for performance only on Intel microprocessors.
Performance tests, such as SYSmark and MobileMark, are measured using specific computer systems, components, software,
operations and functions. Any change to any of those factors may cause the results to vary. You should consult other information
and performance tests to assist you in fully evaluating your contemplated purchases, including the performance of that product
when combined with other products.
Copyright © 2014, Intel Corporation. All rights reserved. Intel, Pentium, Xeon, Xeon Phi, Core, VTune, Cilk, and the Intel logo are
trademarks of Intel Corporation in the U.S. and other countries.
Optimization Notice
Intel’s compilers may or may not optimize to the same degree for non-Intel microprocessors for optimizations that are not unique to Intel
microprocessors. These optimizations include SSE2, SSE3, and SSSE3 instruction sets and other optimizations. Intel does not guarantee the
availability, functionality, or effectiveness of any optimization on microprocessors not manufactured by Intel. Microprocessor-dependent
optimizations in this product are intended for use with Intel microprocessors. Certain optimizations not specific to Intel microarchitecture are
reserved for Intel microprocessors. Please refer to the applicable product User and Reference Guides for more information regarding the
specific instruction sets covered by this notice.
Notice revision #20110804
38
Intel Confidential
Intel® Graphics Performance Analyzers

Intel® Graphics Performance Analyzers

  • 1.
    Intel® Graphics PerformanceAnalyzers Brandon Blair, Product Owner October 2015
  • 2.
    Intel® Graphics PerformanceAnalyzers (Intel® GPA) PC gaming (Windows*, Ubuntu*) Mobile gaming (Windows, Android*)
  • 3.
    Copyright © 2015,Intel Corporation. All rights reserved. *Other names and brands may be claimed as the property of others. Optimization Notice 3 Intel® INDE GPA - the app to optimize your games! Desktop / AIO High–End GPU Mainstream Graphics 10fps 5fps 60+ fps 5fps 30 fps 30+ fps
  • 4.
    Copyright © 2015,Intel Corporation. All rights reserved. *Other names and brands may be claimed as the property of others. Optimization Notice 4 Host/Target architecture Host System (Dev Box) Target System
  • 5.
    Copyright © 2015,Intel Corporation. All rights reserved. *Other names and brands may be claimed as the property of others. Optimization Notice Host OS Win 7, Win 8.1, Win 10 (64-bit) DirectX* DX 9.x, 10.x, 11.2 Target Hardware Intel, Nvidia, AMD GPUs Windows Tablets 5 Optimize Windows*, Android*, and Ubuntu* games! Windows Gaming Android Gaming Host OS Windows, Ubuntu, OSX OpenGL ES* 1.x, 2.x, 3.x Target Hardware Intel® Atom™, ARM* Android OS 4.x, 5.x Ubuntu Gaming Host OS Ubuntu* OpenGL* 3.x, 4.0 Target Hardware Intel® HD Graphics 2500+ Target OS Ubuntu 14.04, 15.04
  • 6.
    Copyright © 2015,Intel Corporation. All rights reserved. *Other names and brands may be claimed as the property of others. Optimization Notice 6 What’s inside Intel® GPA? Frame AnalyzerPlatform Analyzer Draw-call bar-chart DX / GL ES resources Metrics, experiments System Analyzer / HUD Frame-rate and metrics Overrides Frame/Trace capture Frame-level analysisVisual tasks timeline GPU / DX frame graph DX / CPU tasks ETW tasks Graphics Monitor Analysis starting point HUD profiles Settings GPA configuration tool
  • 7.
    Copyright © 2015,Intel Corporation. All rights reserved. *Other names and brands may be claimed as the property of others. Optimization Notice 7 Intel® GPA analysis workflow Game with HUD / System Analyzer: Real-time in-game Analysis / Experiments Frame Analyzer: Deep frame-level Analysis / Experiments Platform Analyzer: GPU / Gfx API / CPU tasks visual timeline + CPU Limited GPU Limited Capture frame Capture trace Run with Intel® GPA In-Game Analysis Offline Analysis
  • 8.
    Copyright © 2015,Intel Corporation. All rights reserved. *Other names and brands may be claimed as the property of others. Optimization Notice 8 Start Analysis with Minimal Setup • No Code Changes Needed • No Root Required* • No Mobile App Installation • ADB interface * For platform analysis or debug enabled application • No Code Changes Needed • No Environment Changes • No IDE Necessary • Remote System Analysis
  • 9.
    Meet the Analyzers SystemAnalyzer, Frame Analyzer, Platform Analyzer
  • 10.
    Copyright © 2015,Intel Corporation. All rights reserved. *Other names and brands may be claimed as the property of others. Optimization Notice Graphics Monitor 10 • Launch point • Set HUD metrics • Set capture triggers • View Logs and System Info
  • 11.
    Copyright © 2015,Intel Corporation. All rights reserved. *Other names and brands may be claimed as the property of others. Optimization Notice System Analyzer 11 • View performance metrics in real time and determine how your application is executing • Understand the power utilization of device • Experiment with graphics pipeline state without changing code • Capture frames and traces for detailed out-of-game analysis
  • 12.
    Copyright © 2015,Intel Corporation. All rights reserved. *Other names and brands may be claimed as the property of others. Optimization Notice System Analyzer – Details – Real Time Metrics 12 • CPU Metrics • GPU Metrics • Memory Metrics • Power Metrics • Graphics API Metrics • Other Platform Metrics *Metric availability depends on platform
  • 13.
    Copyright © 2015,Intel Corporation. All rights reserved. *Other names and brands may be claimed as the property of others. Optimization Notice System Analyzer – Details – 3D settings 13 • Frame rate, resolution, Vsync, and API indicators • Override CPU frequency in real time and see the performance delta
  • 14.
    Copyright © 2015,Intel Corporation. All rights reserved. *Other names and brands may be claimed as the property of others. Optimization Notice System Analyzer – Details – 3D continued 14 Real time analysis and experiments • 1x1 Scissor Rect • Disable Alpha Blending • Disable Draw Calls • Disable Z-Test • Simple Pixel/Fragment Shader • Show Wireframe • Texture 2x2 Analyze with System Analyzer Texture 2x2 Subway Patrol* for Android*
  • 15.
    Copyright © 2015,Intel Corporation. All rights reserved. *Other names and brands may be claimed as the property of others. Optimization Notice Heads Up Display (HUD) 15 • Full System Analyzer workflow for your single system DirectX* profiling. • Developed for full screen analysis
  • 16.
    Copyright © 2015,Intel Corporation. All rights reserved. *Other names and brands may be claimed as the property of others. Optimization Notice Heads Up Display – Details 16 *Metric availability depends on platform “Show Wireframe” Enabled
  • 17.
    Copyright © 2015,Intel Corporation. All rights reserved. *Other names and brands may be claimed as the property of others. Optimization Notice Platform Analyzer 17 • Correlate CPU and GPU activity to understand whether your app is effectively using all compute resources, or it is CPU/GPU bound • Identify GPU and CPU application frame rate and how it depends on vertical sync • Observe the relationship between function execution and recorded metrics
  • 18.
    Copyright © 2015,Intel Corporation. All rights reserved. *Other names and brands may be claimed as the property of others. Optimization Notice Platform Analyzer – Details 18 Bubble Not using both cores GPU Queue DX Tasks SA Metrics Context Switches
  • 19.
    Copyright © 2015,Intel Corporation. All rights reserved. *Other names and brands may be claimed as the property of others. Optimization Notice Frame Analyzer for DirectX* and OpenGL* 19 • Explore metrics to find performance bottlenecks • Analyze all graphics resources used in the frame • Experiment with rendering states and shaders without recompiling • For Android* applications: correlate rendering issues with the exact stage of the graphics pipeline
  • 20.
    Copyright © 2015,Intel Corporation. All rights reserved. *Other names and brands may be claimed as the property of others. Optimization Notice Frame Analyzer for DirectX* 20
  • 21.
    Copyright © 2015,Intel Corporation. All rights reserved. *Other names and brands may be claimed as the property of others. Optimization Notice Frame Analyzer DirectX* – Ergs and Metrics 21 • Identify high cost items with the bar chart • Selection individual items for deeper analysis
  • 22.
    Copyright © 2015,Intel Corporation. All rights reserved. *Other names and brands may be claimed as the property of others. Optimization Notice Frame Analyzer for DirectX* – Texture Viewer 22 • Analyze individual textures associated with ergs
  • 23.
    Copyright © 2015,Intel Corporation. All rights reserved. *Other names and brands may be claimed as the property of others. Optimization Notice Frame Analyzer for DirectX* – Geometry View 23 • Analyze Geometry within the scene
  • 24.
    Copyright © 2015,Intel Corporation. All rights reserved. *Other names and brands may be claimed as the property of others. Optimization Notice Frame Analyzer for DirectX* – Shader Editing 24 • Make real-time edits to vertex and pixel shaders • Inspect your shader uniforms
  • 25.
    Copyright © 2015,Intel Corporation. All rights reserved. *Other names and brands may be claimed as the property of others. Optimization Notice Frame Analyzer for DirectX* – Experiments 25 • Perform Frame level experiments and immediately see the performance delta. • 2x2 Textures • 1x1 Scissor Rect • Simple Pixel Shader • Disable Erg(s)
  • 26.
    Copyright © 2015,Intel Corporation. All rights reserved. *Other names and brands may be claimed as the property of others. Optimization Notice Frame Analyzer for OpenGL ES* 26
  • 27.
    Copyright © 2015,Intel Corporation. All rights reserved. *Other names and brands may be claimed as the property of others. Optimization Notice Frame Analyzer for OpenGL ES* – Experiments 27 • Same experiments • Pipeline view
  • 28.
    Copyright © 2015,Intel Corporation. All rights reserved. *Other names and brands may be claimed as the property of others. Optimization Notice Frame Analyzer for OpenGL ES* – Texture Viewer 28
  • 29.
    Copyright © 2015,Intel Corporation. All rights reserved. *Other names and brands may be claimed as the property of others. Optimization Notice Frame Analyzer for OpenGL ES* – Shader Editing 29
  • 30.
    Copyright © 2015,Intel Corporation. All rights reserved. *Other names and brands may be claimed as the property of others. Optimization Notice DEMO 30
  • 31.
    Copyright © 2015,Intel Corporation. All rights reserved. *Other names and brands may be claimed as the property of others. Optimization Notice https://software.intel.com/gpa 31 Intel® Graphics Performance Analyzers* *(It’s FREE)
  • 32.
    Copyright © 2015,Intel Corporation. All rights reserved. *Other names and brands may be claimed as the property of others. Optimization Notice Backup 32
  • 33.
    Copyright © 2015,Intel Corporation. All rights reserved. *Other names and brands may be claimed as the property of others. Optimization Notice 33
  • 34.
    Copyright © 2015,Intel Corporation. All rights reserved. *Other names and brands may be claimed as the property of others. Optimization Notice 34
  • 35.
    Copyright © 2015,Intel Corporation. All rights reserved. *Other names and brands may be claimed as the property of others. Optimization Notice 35
  • 36.
    Copyright © 2015,Intel Corporation. All rights reserved. *Other names and brands may be claimed as the property of others. Optimization Notice 36
  • 37.
    Copyright © 2015,Intel Corporation. All rights reserved. *Other names and brands may be claimed as the property of others. Optimization Notice Intel Confidential 37 Intel® GPA Release Notes https://software.intel.com/en-us/articles/intel-gpa-release-notes
  • 38.
    Copyright © 2015,Intel Corporation. All rights reserved. *Other names and brands may be claimed as the property of others. Optimization Notice Legal Disclaimer & Optimization Notice INFORMATION IN THIS DOCUMENT IS PROVIDED “AS IS”. NO LICENSE, EXPRESS OR IMPLIED, BY ESTOPPEL OR OTHERWISE, TO ANY INTELLECTUAL PROPERTY RIGHTS IS GRANTED BY THIS DOCUMENT. INTEL ASSUMES NO LIABILITY WHATSOEVER AND INTEL DISCLAIMS ANY EXPRESS OR IMPLIED WARRANTY, RELATING TO THIS INFORMATION INCLUDING LIABILITY OR WARRANTIES RELATING TO FITNESS FOR A PARTICULAR PURPOSE, MERCHANTABILITY, OR INFRINGEMENT OF ANY PATENT, COPYRIGHT OR OTHER INTELLECTUAL PROPERTY RIGHT. Software and workloads used in performance tests may have been optimized for performance only on Intel microprocessors. Performance tests, such as SYSmark and MobileMark, are measured using specific computer systems, components, software, operations and functions. Any change to any of those factors may cause the results to vary. You should consult other information and performance tests to assist you in fully evaluating your contemplated purchases, including the performance of that product when combined with other products. Copyright © 2014, Intel Corporation. All rights reserved. Intel, Pentium, Xeon, Xeon Phi, Core, VTune, Cilk, and the Intel logo are trademarks of Intel Corporation in the U.S. and other countries. Optimization Notice Intel’s compilers may or may not optimize to the same degree for non-Intel microprocessors for optimizations that are not unique to Intel microprocessors. These optimizations include SSE2, SSE3, and SSSE3 instruction sets and other optimizations. Intel does not guarantee the availability, functionality, or effectiveness of any optimization on microprocessors not manufactured by Intel. Microprocessor-dependent optimizations in this product are intended for use with Intel microprocessors. Certain optimizations not specific to Intel microarchitecture are reserved for Intel microprocessors. Please refer to the applicable product User and Reference Guides for more information regarding the specific instruction sets covered by this notice. Notice revision #20110804 38 Intel Confidential

Editor's Notes

  • #2 …inside the Integrated Native Development Experience package… or INDE
  • #3 For those of you that have not used GPA, GPA stands for Graphics Performance Analyzers. GPA is a suite of individual tools that you can run on your favorite development environments: Windows, OS X, and Ubuntu. These tools allow you to analyze your Windows, Ubuntu, and Android applications and isolate and fix any performance issues.
  • #4 As developers, we’ve all had the experience that once you have your primary functionality complete and start testing it on a number platforms, you might discover performance issues. We all have performance goals, but these goals are even more difficult to hit on the wide variety of hardware out there today. Low fps, lag, and stuttering are all serious issues. And we as developers want to provide the best experience when people play our apps and games – no matter what platform they use. GPA can help you identify your hot spots and reach your performance goals, no matter which devices you are targeting.
  • #5 So, how do our tools work? Because we run on such a wide variety of platforms, our tools have a host/target architecture. The reason for this is twofold. First, everyone has their favorite development environment. The second is because small handheld devices do not lend themselves to interactive debugging tools. when developing with low-power/low-compute devices, the monitoring tools themselves can get in the way of accurate measurements and affect the performance. So in order to get the best results, we run a small collector on the target system but have our powerful analysis and investigation tools on your favorite development environment. Even if you are a purely desktop developer, this mechanism give you the ability to remotely monitor/collect data from other desktop systems as well.
  • #6 Here is a more exhaustive list of platforms we run on. As you can see, it is quite a few! We support a wide variety of host operating systems for our powerful analysis and evaluation tools and also support a wide variety of target hardware as well. As you can see, you can collect all your favorite DirectX versions on Windows, collect OpenGL on Ubuntu, and collect performance data from android targets from Windows, Mac, or Ubuntu hosts.
  • #7 So what’s inside GPA? Here we see the 4 major analysis applications: 1. First there is system analyzer which allows you to connect to an application and not only monitor realtime metrics, but also override state, trigger captures of individual frames, and make traces 2. Graphics monitor is our lightweight monitoring and launching tool. This component allows you to launch applications, monitor them via a simple HUD, collect frames and traces, set triggered events, and manage the configuration of apps you wish to collect data from. 3. Platform analyzer is our GPU/CPU workload visualization tool. It allows you to see GPU and CPU workloads at the same time, which lets you spot difficult CPU/GPU interaction issues or discover if you are CPU or GPU bound. 4. Finally, there is Frame Analyzer which is our powerful frame analysis tool. You can capture individual frames from your game, inspect all aspects of them, and find performance issues at the individual draw call level.
  • #8 Ok, don’t let this slide daunt you too much. There is a wide variety of ways to find your performance bottlenecks, but this is one of the most methodical ways to isolate what you are looking for if you really don’t know where to start. At a high level – our first objective is to find out if we CPU or GPU limited. After we discover that, we can start making the right kinds of performance optimizations. After all, you don’t want to spend valuable time optimizing your GPU code if the performance issue is on the CPU or vice versa.. First, we do online or realtime analysis. Lets say you have a performance issue in your game. For desktop applications, you can start your analysis either on the system you are using or remotely. For android, you use your development system to connect to your android application. You then run your game under analysis using either System Analyzer or monitor to capture frames and activity traces. So, lets talk a little about frame and trace captures. A Frame capture collects all the graphics API calls for an individual frame. A Trace capture collect both CPU and GPU activity and give you an overall picture of what the system is doing. We can capture any number of these at any part of our application or game. If one particular level is causing you issues, you can go to that level and only capture frames and traces for that part of your game. After we have captured our frames and traces, we then use our analysis tools to figure out where our problem lies. We first analyze our traces with Platform Analyzer. This quickly tells us if we are spending the majority of our time on the cpu or gpu. If you find you’re a CPU bound, you can discover which actions are causing your CPU bottlenecks in Platform Analyzer or dig in even further by using Intel’s Vtune analyzer. For cases when you are GPU bound, you can use Frame Analyzer to discover what is taking up your GPU time. You can inspect your frame 1 api call at a time and run experiments to figure out which graphics calls are causing performance issues.
  • #9 This all sounds great, but how easy is GPA to use? It turns out - Very easy! Analyzing your desktop, laptop, or android applications requires NO code changes to your application at all. No recompiles/no filling your code with instrumentation macros, - nothing. For analyzing Android applications, you don’t even have to root your Android device. You also don’t even have to have your Andoird device drirectly connected – you can do it over the network with ADB!
  • #10 So now that we’ve seen the overall workflow, lets look at each tool individually and how it can help you find performance bottlenecks.
  • #11 As we mentioned before, you can use the Monitor application to launch your app. Simply point Monitor at your application, launch it, and examine the performance. Monitor has it’s own set of custom configuration features that allow you to handle even complex app starting mechanisms such as launchers like Steam. Just launch your app and collect frame captures or traces, turn on/off overrides and watch the performance in the graphs. Another powerful feature of monitor is the ability to set trigger captures. Lets say you are getting random stutters in your game. On games that are running 30, 60 or more fps, it is almost impossible to trigger the capture of a problematic frame by hand. Instead, you can tell monitor that if the FPS drops below a certain threshold, to capture the frame automatically. You can set a wide variety of system triggers based on CPU and GPU data. This can be an invaluable tool for capturing hard to reproduce issues.
  • #12 As we mentioned earlier, System Analyzer is one of the first applications you’ll likely use. It allows you to connect to your application and gather real-time information. You can view highly detailed CPU and GPU activity, power metrics, and a host of other platform data – all in realtime. The realtime graphs help you quickly see not only if you are CPU or GPU bound, but if there are any activity spikes. If you have stuttering or lag issues with certain actions in your application, these graphs can help you find if it was CPU, GPU, or some other issue. The Realtime power analysis is particularly important for mobile platforms. Our biggest power hogging activities are sometimes not what we expect. Using these tools with developers, we found that one of the biggest power hog offenders for mobile devices were the menu screens. Many games run with no FPS limit. Because the title screen and menu screens are very easy to render, they often ran at hundreds of frames per second. Unfortunately, all this flipping is very power intensive. Because the menu screens only appear at certain times that aren’t usually investigated, a general analysis never caught these spikes. But they were key battery chewing parts of the application since main menu and pause screens were often displayed when a game was left idle.
  • #13 Here’s an example of some of the realtime metrics you can look at, but there are many more. Our CPU and GPU metrics are very high precision and based on internal hardware counters. Analyzing your application on an Intel CPU or GPU gives you access to these high quality metrics. Power metrics are great for android development – but are also very important for laptops and ultrabooks. As our applications and games are increasingly run on a wide range of mobile devices, power is an important concern for almost any developer.
  • #14 Not only can you monitor what your application or game is doing in realtime, but there are also some really powerful tools in System Analyzer. You not only get realtime system-wide information – but on Intel platforms – the tool also allows you to limit and override your CPU frequency. This lets you to test your application on a range of processors without having to buy a whole test bed of different speed machines.
  • #15 Another powerful feature is the ability to run realtime experiments. While you are running your game or app, you can automatically turn on or off any of these state overrides and quickly see what affect they have on frame rate, power, or cpu/gpu load. This allows you to very quickly see if you are draw call bound, texture sampling bound, or many other common problems. Last but not least, you can actually pause and single-frame step through your game in realtime. This can be invaluable for catching visual artifacts and isolating individual frame issues.
  • #16 SA is great, but what if we want to analyze a full-screen app. You can certainly monitor your application remotely, but you also get a subset of SA controls in your own game. The Monitor app allows you to launch your full-screen game and it automatically places an overlay in your game to perform many of the same operations as SA. You can see the hud overlay in blue in the upper left of this app. This is great if you need to test full-screen modes as it gives you access to almost all the same controls and overrides as System Analyzer without having a separate app or remotely monitor from a separate machine. It should be noted that because of the tiny form factor, we don’t support HUD overlays in Android Targets
  • #17 Here are some of the same kinds of realtime metrics that our HUD overlay can show you. It’s not quite as many as in System Analyzer, but still provides you a very good idea of your overall performance characteristics of your app without having to run a separate analysis tool.
  • #18 Platform analyzer is our next tool in the suite. It is used for monitoring both CPU and GPU activity at the same time. This tool helps you figure out how efficiently you’re using all your computing resources. It is often the case early in development we have unbalanced workloads. Sometimes our CPU is completely busy, but our GPU is sitting idle – or vice versa. This tool quickly shows you that information. Even more importantly, you can easily correlate CPU and GPU activity to see if there are any badly performing interactions. Again, sometimes we issue CPU or GPU commands that can stall our computing resources. This tool helps you figure out if those stalls are causing performance issues.
  • #19 Platform Analyzer gives you an amazing amount of information, too much to go over now - but here’s a little overview of what you will see in an average trace capture. Here we see our GPU and thread usages over the entire timeline of the capture. You’ll note that the GPU and CPU times are aligned so you can see how they are interacting. These flows show you exactly what was happening on both your CPU and GPU at the time you captured your trace. In the case of this frame, we see there is a GPU bubble that shows an area of poor GPU utilization. Based on the color of CPU and GPU frames we can easily see that the CPU calculations for the frame are not complete prior to the start of the GPU computations and this is likely starving the GPU pipeline. Using the threading execution view, we notice that only 1 core of the CPU is being used mot of the time. Time to see if we can add some multi-threading.
  • #20 And now on to the finale – and my favorite tool in the suite. Frame Analyzer. FA runs on both DirectX frames and OpenGL|ES frames. If you discover you are GPU bound this is where you can do a deep dive into any frame you capture. Not only can this tool tell you where your performance bottlenecks are, but it is also an amazing diagnostic and debugging tool. You can inspect any texture, render target, geometry, shader, buffer or graphics API call in your frame and run experiments to see if changing any of them helps or hurts your performance.
  • #21 This is what FA looks like in DX. DX and OpenGL have a slightly different workflow, but the elements will be very similar and the functionality almost identical. As you can see, there is a lot in the tool. Lets break this up and do a little deeper dive into the various things you can do with FA.
  • #22 At the top you’ll see one of the most important features – the bar chart that shows each erg and it’s performance. We use this word ‘erg’ to describe anything the app issues to the graphics API that causes the GPU to do work. As developers, we know that some DirectX or OpenGL calls don’t actually result in GPU work. For example, just setting a blend state often does not trigger actual GPU work, but a draw or present call does. The bar graph shows you all the calls that actually result in GPU work, and how long they took. If you select an individual erg, or a range of ergs, you see the selected draw calls light up in magenta in your render target view below. This all happens in realtime. If you select new ergs, then the render target immediately highlights the new calls. You can inspect each erg and discover exactly which command is being issued. Not only that, but if you look at the right, you’ll see the Frame Overview and Details tabs that has a list of metrics collected for the selected draw calls. You’ll get all kinds of information on how the CPU and GPU were performing when issuing those commands. Some of the metrics are GPU duration, the number of milliseconds each individual pixel or vertex shader took, how many pixels or vertices the shader processed, shader idle and stall times, and a whole host of other system metrics. With these two elements, you can track down a great number of your performance issues.
  • #23 Textures are some of the largest resources we use in graphics applications and games. Sometimes our performance bottlenecks are because we are using very large textures, accidently leave the wrong textures bound, or use texture formats that are poorly optimized for your target hardware. You can select your ergs and inspect all the textures that were bound for those draw calls.
  • #24 Another very useful feature is the ability to analyze the geometry of your rendered objects. Again, sometimes we have performance issues because our models are not optimized or we are rendering objects we shouldn’t be. You can also check all the mesh parameters such as topology, formats, and visualize them in realtime to see if there are issues.
  • #25 A tremendously powerful feature of the tool is the ability to inspect, edit, and even replace your shaders. Obviously you can’t change the bindings for shader inputs, but you can edit your shader and immediately see the results. If shader source is available, you can edit in HLSL. If your shader source is not available, you can even modify the shader assembly. You can also edit the shader and replace it with another shader file. You can also inspect the constants and uniforms you are sending to your shader. You get to see the results visually and in the metrics in realtime - all without needing to recompile or re-run your application.
  • #26 If you discover issues, it would be nice to test them right away. FA, just like SA, allows you to run experiments and test for common problems. (point at them) You can turn on/off individual ergs, replace textures with very simple ones to test sampling bottlenecks, and others. Not only that – but the frame is re-run and re-sampled to give you the difference in performance immediately.
  • #27 The version of FA we have been showing you is for DirectX. But we also have FA for OpenGL ES. The layout is slightly different, but you’ll see that almost all the same features are available. Just like the new visual studio, you can toggle between light and dark color schemes.
  • #28 Again, we have the ability to perform experiments on our OpenGL ES Android frames just like on the desktop. This allows you to test out a variety of common problems without having to recompile and re-run your app on your target device. A great time saving technique. There is no need to rebuild your game, transport it to your android device and re-collect data from it. Just push the experiment button and FA for OpenGL|ES will do all the work of re-running with the new settings automatically.
  • #29 You can also examine all your textures – just like on the desktop. Validating your texture formats and sizes can be especially important on mobile OpenGL|ES devices since they can be a common bottleneck. It is often the case that certain texture formats do not perform well on some mobile hardware platforms. If you notice that all your slow draw calls are using the same texture format, you might see if changing that format and see if it helps your performance issue. Again, you can inspect all the parameters of your texture for performance or logic errors.
  • #30 Here we are again, one of the most powerful and time saving features is shader editing. The OpenGL version of FA supports this as well. It allows you to view and make realtime edits to your vertex and pixel shaders. After each edit, the frame is re-run and the new metrics and render target output updated. This allows you to make changes in your shaders and see the results updated without having to recompile and re-run your application on your device.
  • #32 So that is a quick overview of GPA toolkit and its tools. Obviously there is a lot more great features, so we’ll both be available between sessions for questions. You can also go to our website and download the tools today.