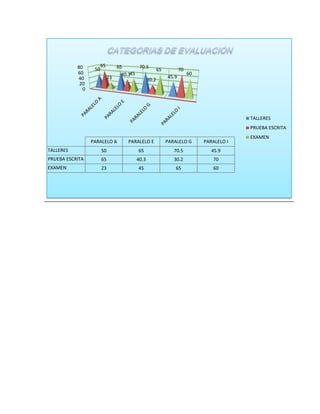
The document contains a bar graph comparing the scores of four parallel classes - A, E, G, and I - across three subjects: workshops, written tests, and exams. Class G scored the highest overall with its highest scores in workshops and written tests, while Class I scored the lowest overall despite having the highest score in exams.