Informe academico por areas
•Download as XLSX, PDF•
0 likes•500 views
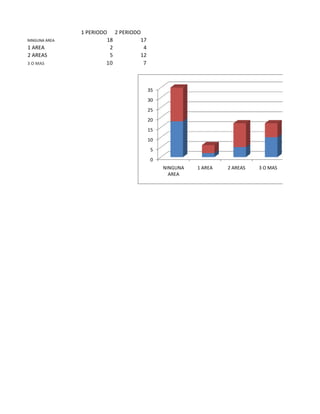
The document shows data on the number of areas students lacked in two different periods. In the first period, 18 students lacked in no areas, while in the second period the number was 17. The number of students lacking in 1 area increased from 2 in the first period to 4 in the second. Those lacking in 2 areas increased from 5 to 12 between the periods. Students lacking in 3 or more areas decreased from 10 to 7. A bar graph compares the numbers of students in each category for both periods.
Report
Share
Report
Share

Recommended
Burgos cristina unidad2
El documento analiza dos portales educativos, Educ.ar y ABC.gov.ar, y cómo abordan la lectura de cuentos con ogros y la efeméride del 25 de mayo. Explica que Educ.ar ofrece actividades para docentes sobre diferentes áreas y niveles, mientras que ABC.gov.ar provee planes anuales, actividades y criterios de evaluación. Para la lectura de cuentos, ABC.gov.ar sigue los pasos de disponibilidad, acceso, participación y apropiación propuestos por Daniel Cassany. En el 25 de mayo
Derecho Informatico
1) La Cámara de Diputados aprobó un proyecto de ley que dará validez jurídica a la firma digital, mensajes de datos y expedientes electrónicos.
2) El sitio web de ABC fue rediseñado para ofrecer un espacio de lectura más confortable y separar contenidos impresos de los digitales.
3) Se lanzará el primer portal de noticias de Paraguay optimizado para teléfonos móviles llamado iABC.
Analisis estadistico de octavo grado
The document contains two tables. The first table shows the number of students with no areas, 1 area, 2 areas, or 3 or more areas of difficulty in the first and second periods. The second table shows the number of students struggling in each subject (Spanish, Math, Computer Science, English, Social Studies, Natural Sciences, PE, Religion, and Art) in the first and second periods. Overall, the number of students with no areas of difficulty decreased from the first to the second period, while the number of students with 1 or 2 areas of difficulty increased.
Analisis estadistico de octavo grado
The document contains two tables comparing data between two periods. The first table shows the number of students with no areas, 1 area, 2 areas, or 3 or more areas of difficulty. The second table shows the number of students struggling in each subject - Spanish, Math, Computer Science, English, Social Studies, Natural Sciences, PE, Religion, and Art - between the two periods.
Analisis estadistico de octavo grado
The document contains two tables. The first table shows the number of students with no areas, 1 area, 2 areas, or 3 or more areas of difficulty in the first and second periods. The second table shows the number of students struggling in each subject (Spanish, Math, Computer Science, English, Social Studies, Natural Sciences, PE, Religion, and Art) in the first and second periods. Overall, the number of students with no areas of difficulty decreased from the first to the second period, while the number of students with 1 or 2 areas of difficulty increased.
Analisis estadistico de octavo grado
The document contains two tables. The first table shows the number of students with no areas, 1 area, 2 areas, or 3 or more areas of difficulty in the first and second periods. The second table shows the number of students struggling in each subject (Spanish, Math, Computer Science, English, Social Studies, Natural Sciences, PE, Religion, and Art) in the first and second periods. Overall, the number of students with no areas of difficulty decreased from the first to the second period, while the number of students with 1 or 2 areas of difficulty increased.
Impacto de las tic en la educación
Las nuevas tecnologías se han integrado profundamente en la vida cotidiana y la educación. Programas como Enlaces en Chile han facilitado nuevas formas de enseñanza y aprendizaje en las escuelas a través de la comunicación e interacción. Los dispositivos tecnológicos como los tableros electrónicos y los PocketPC han despertado el interés de los estudiantes en asignaturas como las matemáticas al hacerlas más relevantes, y permiten que los estudiantes colaboren en proyectos. La tecnología reduce las
En tipografía
El documento describe tres estilos tipográficos: la negrita, que hace que el texto se vea más grueso; la cursiva, que inclina las letras para una escritura más rápida; y el subrayado, que se usa para destacar ideas clave durante la lectura de estudio poniendo rayas o signos de atención debajo del texto.
Informe academico por areas
The document shows data on the number of areas students lacked in two different periods. In the first period, 18 students lacked in no areas, while in the second period the number was 17. The number of students lacking in 1 area increased from 2 in the first period to 4 in the second. Those lacking in 2 areas increased from 5 to 12 between the periods. Students lacking in 3 or more areas decreased from 10 to 7. A bar graph compares the numbers of students in each category for both periods.
Analisis educativo octavo grado
This document contains data on the number of areas affected by a phenomenon across two periods. In the first period, most areas reported no effect, while in the second period most reported an effect in 2 areas. The number affected in 1 area doubled from the first to second period, while those affected in 3 or more areas decreased.
Excel marlin mercado gustavo villalba
Este documento describe las funciones básicas de Excel y cómo la página Aulaclic proporciona una guía eficaz para aprender a utilizar esta herramienta de hoja de cálculo desde los conceptos más básicos hasta los más complejos. Explica que Excel permite realizar cálculos y operaciones rápidas en una cuadrícula y que Aulaclic muestra cómo funciona cada icono de la herramienta para mejorar su uso.
Excel Marlin Mercado Gustavo Villalba
Este documento describe las funciones básicas de Excel y cómo la página Aulaclic proporciona instrucciones para usarla. Explica que Excel permite realizar cálculos y operaciones con datos en una hoja de cálculo con cuadrículas. Aulaclic ofrece una guía para entender cada icono de Excel y mejorar el manejo de la herramienta. También brinda una visión clara de cómo introducir y manejar datos estratégicamente para optimizar el uso de Excel.
Excel marlin mercado gustavo villalba
Este documento describe las funciones básicas de Excel y cómo la página Aulaclic proporciona instrucciones para usarla. Explica que Excel permite realizar cálculos y operaciones con datos en una hoja de cálculo y que Aulaclic muestra cómo funciona cada icono de la herramienta para mejorar su uso. También indica que Aulaclic ofrece una guía efectiva para aprender sobre Excel, desde conceptos básicos hasta avanzados, y destaca la importancia de Excel para facilitar el trabajo de muchas personas.
Excel marlin mercado gustavo villalba
Este documento describe las funciones básicas de Excel y cómo la página Aulaclic proporciona una guía eficaz para aprender a utilizar esta herramienta de hoja de cálculo desde los conceptos más básicos hasta los más complejos. Explica que Excel permite realizar cálculos y operaciones rápidas en una cuadrícula y que Aulaclic muestra cómo funciona cada icono de la herramienta para mejorar su uso.
Grupo7 gustavo villalba 1 c
El documento presenta los resultados del segundo corte de la asignatura de Tecnología e Informática para el grado 7-B. Incluye el nombre del profesor Gustavo Villalba, y una tabla con el nombre de los estudiantes, su asistencia y calificaciones en los tres niveles evaluados y déficit.
Grupo7 gustavo villalba.
El documento presenta los resultados del segundo corte de la asignatura de Tecnología e Informática para el grado 7-B. Incluye la lista de estudiantes con su asistencia y calificaciones en los tres niveles evaluados (N1, N2, N3) así como el déficit acumulado. El profesor responsable es Gustavo Villalba y la escuela es la Escuela Normal Superior del Distrito de Barranquilla.
Grupo7 gustavo villalba.
El documento presenta los resultados del segundo corte de la asignatura de Tecnología e Informática para el grado 7-B. Incluye el nombre del profesor Gustavo Villalba, y una tabla con el nombre de los estudiantes, su asistencia y calificaciones en los tres niveles evaluados y déficit.
Grupo7 gustavo villalba.
El documento presenta los resultados del segundo corte de la asignatura de Tecnología e Informática para el grado 7-B. Contiene el nombre del profesor Gustavo Villalba, la escuela, el grado y la asignatura; además de una tabla con el nombre de los estudiantes, su asistencia y las calificaciones de los tres niveles evaluados y la definitiva.
Metacognicion
Según el documento, David Ausubel describe el aprendizaje como una reestructuración activa de las ideas y conceptos que una persona ya posee. Explica que la estructura cognitiva son construcciones hipotéticas que describen las similitudes y diferencias en el comportamiento. La metacognición implica que los aprendices sean conscientes de sus propios procesos mentales y estrategias de aprendizaje, de manera similar a como un entrenador hace que los jugadores sean conscientes de sus movimientos. Para que el aprendizaje sea efectivo
More Related Content
More from gustavo
Impacto de las tic en la educación
Las nuevas tecnologías se han integrado profundamente en la vida cotidiana y la educación. Programas como Enlaces en Chile han facilitado nuevas formas de enseñanza y aprendizaje en las escuelas a través de la comunicación e interacción. Los dispositivos tecnológicos como los tableros electrónicos y los PocketPC han despertado el interés de los estudiantes en asignaturas como las matemáticas al hacerlas más relevantes, y permiten que los estudiantes colaboren en proyectos. La tecnología reduce las
En tipografía
El documento describe tres estilos tipográficos: la negrita, que hace que el texto se vea más grueso; la cursiva, que inclina las letras para una escritura más rápida; y el subrayado, que se usa para destacar ideas clave durante la lectura de estudio poniendo rayas o signos de atención debajo del texto.
Informe academico por areas
The document shows data on the number of areas students lacked in two different periods. In the first period, 18 students lacked in no areas, while in the second period the number was 17. The number of students lacking in 1 area increased from 2 in the first period to 4 in the second. Those lacking in 2 areas increased from 5 to 12 between the periods. Students lacking in 3 or more areas decreased from 10 to 7. A bar graph compares the numbers of students in each category for both periods.
Analisis educativo octavo grado
This document contains data on the number of areas affected by a phenomenon across two periods. In the first period, most areas reported no effect, while in the second period most reported an effect in 2 areas. The number affected in 1 area doubled from the first to second period, while those affected in 3 or more areas decreased.
Excel marlin mercado gustavo villalba
Este documento describe las funciones básicas de Excel y cómo la página Aulaclic proporciona una guía eficaz para aprender a utilizar esta herramienta de hoja de cálculo desde los conceptos más básicos hasta los más complejos. Explica que Excel permite realizar cálculos y operaciones rápidas en una cuadrícula y que Aulaclic muestra cómo funciona cada icono de la herramienta para mejorar su uso.
Excel Marlin Mercado Gustavo Villalba
Este documento describe las funciones básicas de Excel y cómo la página Aulaclic proporciona instrucciones para usarla. Explica que Excel permite realizar cálculos y operaciones con datos en una hoja de cálculo con cuadrículas. Aulaclic ofrece una guía para entender cada icono de Excel y mejorar el manejo de la herramienta. También brinda una visión clara de cómo introducir y manejar datos estratégicamente para optimizar el uso de Excel.
Excel marlin mercado gustavo villalba
Este documento describe las funciones básicas de Excel y cómo la página Aulaclic proporciona instrucciones para usarla. Explica que Excel permite realizar cálculos y operaciones con datos en una hoja de cálculo y que Aulaclic muestra cómo funciona cada icono de la herramienta para mejorar su uso. También indica que Aulaclic ofrece una guía efectiva para aprender sobre Excel, desde conceptos básicos hasta avanzados, y destaca la importancia de Excel para facilitar el trabajo de muchas personas.
Excel marlin mercado gustavo villalba
Este documento describe las funciones básicas de Excel y cómo la página Aulaclic proporciona una guía eficaz para aprender a utilizar esta herramienta de hoja de cálculo desde los conceptos más básicos hasta los más complejos. Explica que Excel permite realizar cálculos y operaciones rápidas en una cuadrícula y que Aulaclic muestra cómo funciona cada icono de la herramienta para mejorar su uso.
Grupo7 gustavo villalba 1 c
El documento presenta los resultados del segundo corte de la asignatura de Tecnología e Informática para el grado 7-B. Incluye el nombre del profesor Gustavo Villalba, y una tabla con el nombre de los estudiantes, su asistencia y calificaciones en los tres niveles evaluados y déficit.
Grupo7 gustavo villalba.
El documento presenta los resultados del segundo corte de la asignatura de Tecnología e Informática para el grado 7-B. Incluye el nombre del profesor Gustavo Villalba, y una tabla con el nombre de los estudiantes, su asistencia y calificaciones en los tres niveles evaluados y déficit.
Grupo7 gustavo villalba.
El documento presenta los resultados del segundo corte de la asignatura de Tecnología e Informática para el grado 7-B. Incluye el nombre del profesor Gustavo Villalba, y una tabla con el nombre de los estudiantes, su asistencia y calificaciones en los tres niveles evaluados y déficit.
Grupo7 gustavo villalba.
El documento presenta los resultados del segundo corte de la asignatura de Tecnología e Informática para el grado 7-B. Incluye la lista de estudiantes con su asistencia y calificaciones en los tres niveles evaluados (N1, N2, N3) así como el déficit acumulado. El profesor responsable es Gustavo Villalba y la escuela es la Escuela Normal Superior del Distrito de Barranquilla.
Grupo7 gustavo villalba.
El documento presenta los resultados del segundo corte de la asignatura de Tecnología e Informática para el grado 7-B. Incluye el nombre del profesor Gustavo Villalba, y una tabla con el nombre de los estudiantes, su asistencia y calificaciones en los tres niveles evaluados y déficit.
Grupo7 gustavo villalba.
El documento presenta los resultados del segundo corte de la asignatura de Tecnología e Informática para el grado 7-B. Contiene el nombre del profesor Gustavo Villalba, la escuela, el grado y la asignatura; además de una tabla con el nombre de los estudiantes, su asistencia y las calificaciones de los tres niveles evaluados y la definitiva.
Metacognicion
Según el documento, David Ausubel describe el aprendizaje como una reestructuración activa de las ideas y conceptos que una persona ya posee. Explica que la estructura cognitiva son construcciones hipotéticas que describen las similitudes y diferencias en el comportamiento. La metacognición implica que los aprendices sean conscientes de sus propios procesos mentales y estrategias de aprendizaje, de manera similar a como un entrenador hace que los jugadores sean conscientes de sus movimientos. Para que el aprendizaje sea efectivo
More from gustavo (16)
Informe academico por areas
- 1. 1 PERIODO 2 PERIODO NINGUNA AREA 18 17 1 AREA 2 4 2 AREAS 5 12 3 O MAS 10 7 35 30 25 20 15 10 5 0 NINGUNA 1 AREA 2 AREAS 3 O MAS AREA
- 2. 2 PERIODO 1 PERIODO 2
- 3. 1 PERIODO 2 PERIODO ESPAÑOL 5 8 MATEMATICAS 2 6 INFORMATICA 1 3 INGLES 8 2 SOCIALES 3 2 NATURALES 5 1 EDUCACION FISICA 3 5 9 RELIGION 6 7 8 ARTISTICA 2 1 7 6 5 4 3 2 1 0