Downloaded 5,087 times


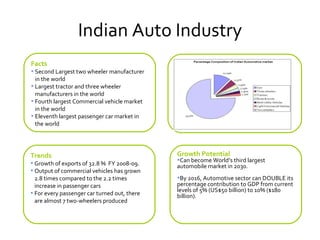
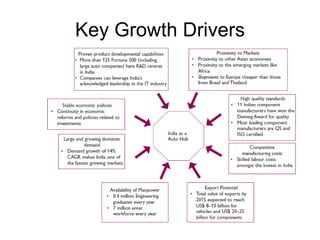
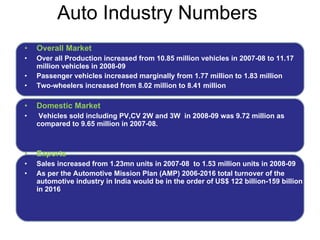
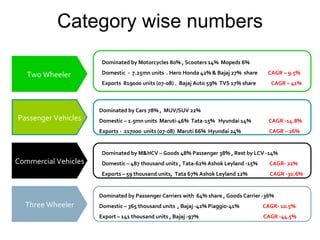
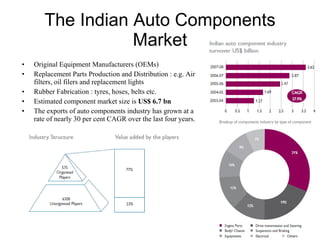


The Indian auto industry is the second largest manufacturer of two-wheelers in the world. It has the potential to become the third largest automobile market by 2030. Key drivers of growth include rising incomes, rapid urbanization, and increased spending on transportation. The industry is dominated by two-wheelers and is expected to continue growing over the next decade, led especially by the market for compact cars. However, factors like fuel prices, infrastructure issues, and changes in economic conditions could impact growth.


