Download as PDF, PPTX


![Cypher: Powerful & Expressive Query Language
MATCH (:Person { name:“Dan”} ) -[:MARRIED_TO]-> (spouse)
MARRIED_TO
Dan Ann
NODE RELATIONSHIP TYPE
LABEL PROPERTY VARIABLE](https://image.slidesharecdn.com/improvingmachinelearningpredictionswebinar-190509072141/85/Improving-Machine-Learning-using-Graph-Algorithms-64-320.jpg)
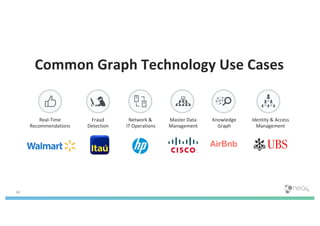
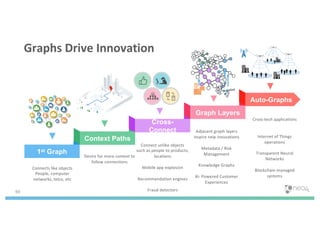
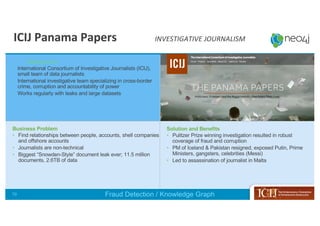
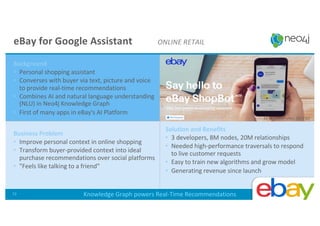
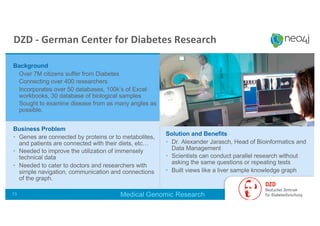

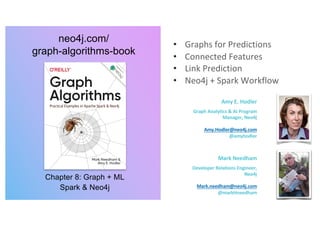
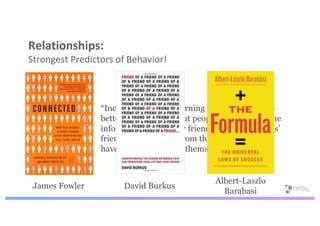
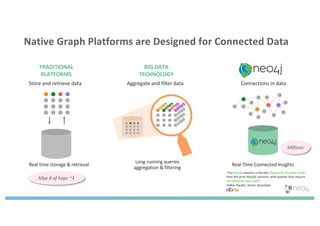
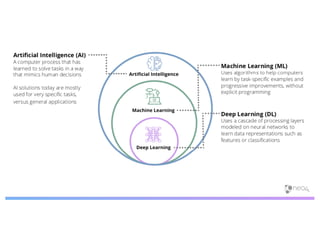
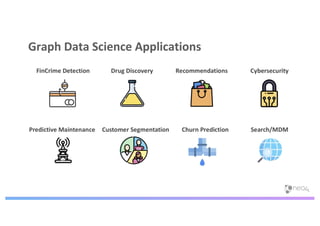
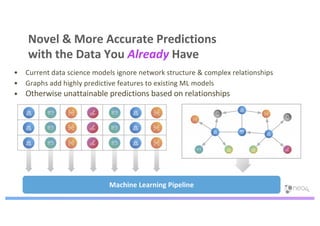
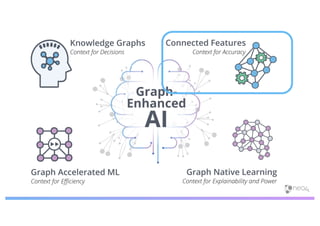
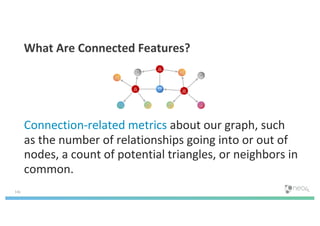
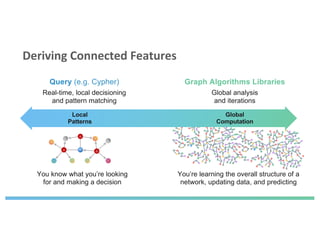
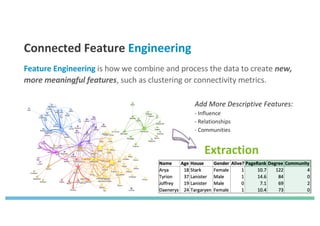
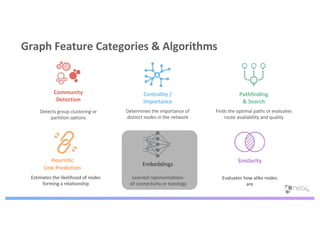
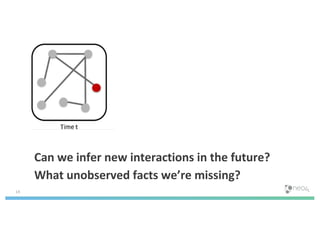
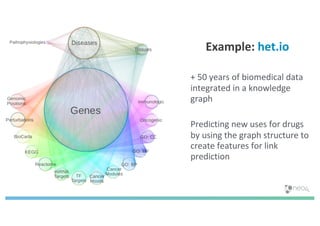
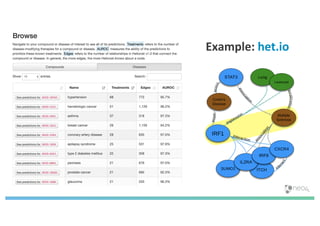
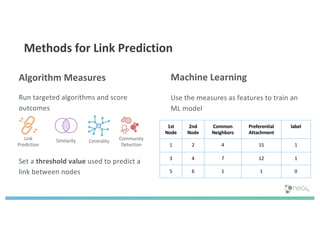
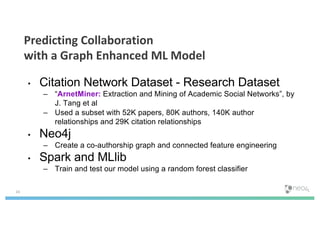
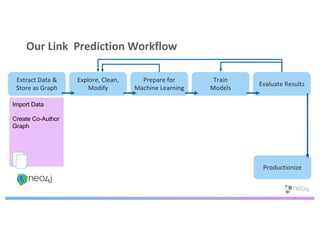
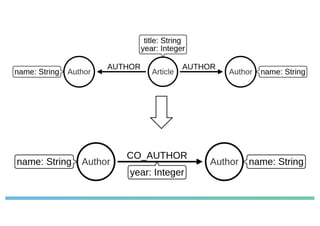
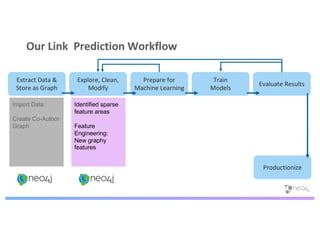
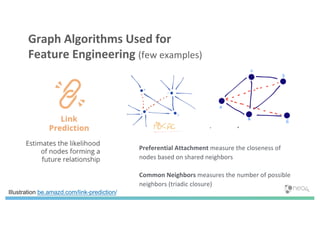
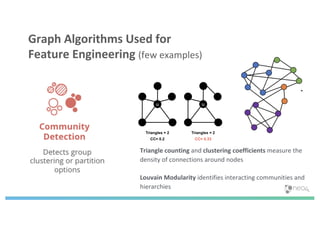
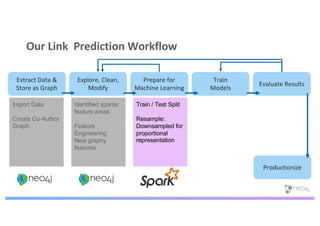
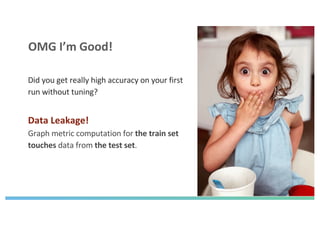
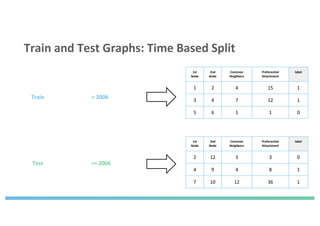
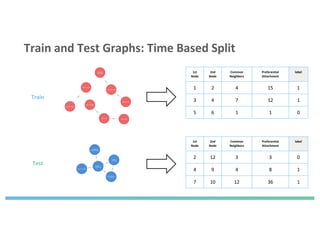
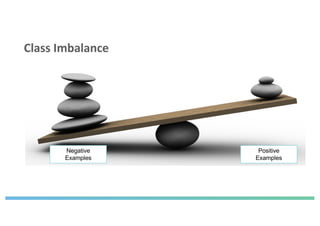
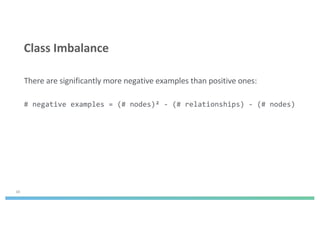
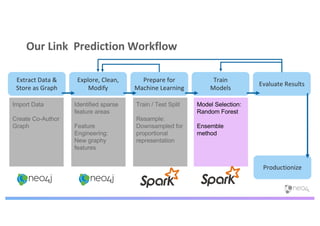
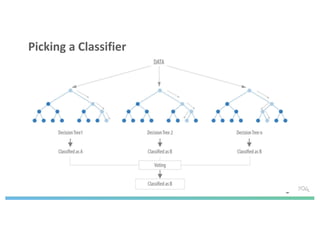
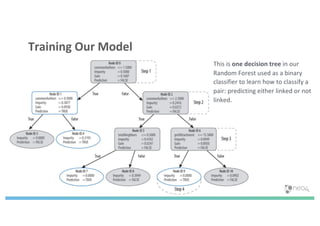
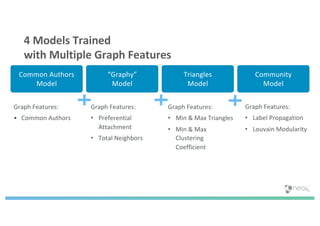
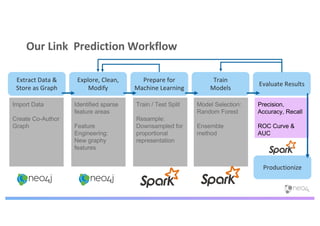
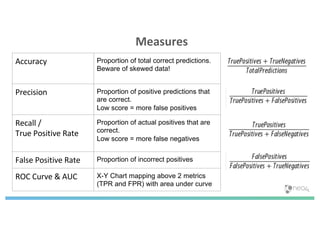
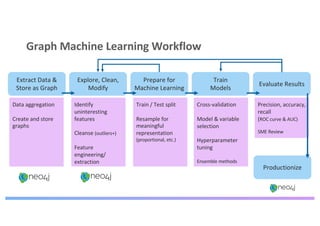
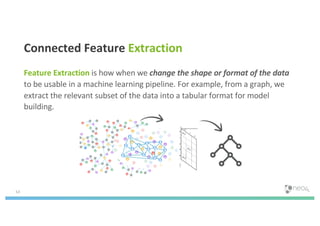
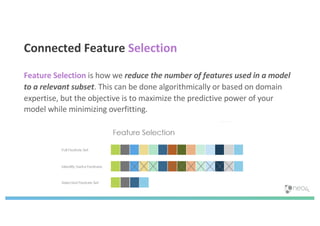
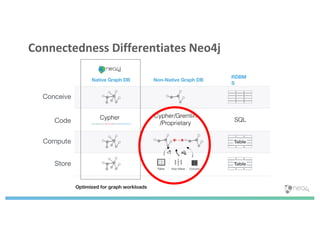
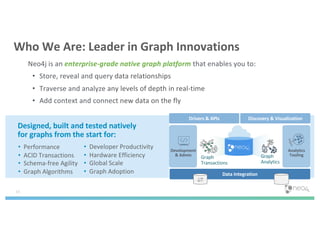
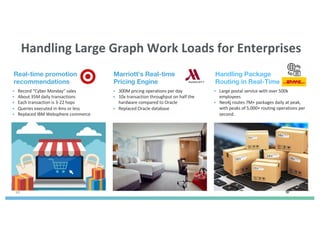
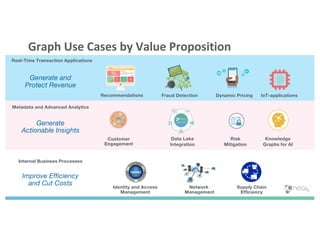
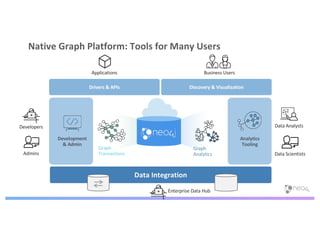
The document discusses enhancing machine learning (ML) predictions through graph algorithms, emphasizing the importance of relationships in predicting behavior. It highlights features extraction and engineering from graph databases like Neo4j, which provide novel insights and improve ML models by utilizing connected data structures. Various use cases, such as predicting collaboration in academic networks and applications in industries like healthcare and finance, illustrate the advantages of integrating graph algorithms into ML workflows.


![[DSC Europe 25] Andrzej Kowalczyk - AI - how to start small and grow in the f...](https://cdn.slidesharecdn.com/ss_thumbnails/oy1zmo94qv6vpcqjvno2-andrzej-kowalczyk-ai-how-to-start-small-and-grow-in-the-future-1-260119121559-cf093b23-thumbnail.jpg?width=640&height=640&fit=bounds)


![[DSC Europe 25] Marcos Heidemann - Beyond the Hype: Making AI Coding Assistan...](https://cdn.slidesharecdn.com/ss_thumbnails/eexkhvldrjsopspdjbur-marcos-heidemann-beyond-the-hype-getting-real-value-out-of-ai-assisted-coding-260121115910-7e9d41ec-thumbnail.jpg?width=640&height=640&fit=bounds)

![[DSC Europe 25] Borko Kozomora - Optimizing business workflows with advances ...](https://cdn.slidesharecdn.com/ss_thumbnails/hbgekyb0txw0xpo4yfml-borko-kozomora-leading-ai-transformation-260122103838-cc29ee38-thumbnail.jpg?width=640&height=640&fit=bounds)
![[DSC Europe 25] Dubravko Culibrk - Deep Learning for Mammography.pptx](https://cdn.slidesharecdn.com/ss_thumbnails/yiscimuktacgqoiu4dkp-deep-learning-for-mammography-260119121559-aad59182-thumbnail.jpg?width=640&height=640&fit=bounds)
![[DSC Europe 25] Paula Garcia Esteban -Building the Future: The Role of Data S...](https://cdn.slidesharecdn.com/ss_thumbnails/9ld1r1bsqpwve8qfvphy-paula-garcia-esteban-building-the-future-260122103838-4171f5cb-thumbnail.jpg?width=640&height=640&fit=bounds)
![[DSC Europe 25] Egor Krasheninnikov - The Control Stack: Building Guardrails ...](https://cdn.slidesharecdn.com/ss_thumbnails/3lzcz7hxqmo51mtalv4u-the-control-stack-260119101520-ea90841a-thumbnail.jpg?width=640&height=640&fit=bounds)
![[DSC Europe 25] Tali Fulman - Guild Meetings, Then What? Building Data Commun...](https://cdn.slidesharecdn.com/ss_thumbnails/fgohhi33rwmhqdowdj5k-tali-fulman-guild-meetings-then-what-building-data-communities-that-actually-ch-260120105855-528492c3-thumbnail.jpg?width=640&height=640&fit=bounds)


![[DSC Europe 25] Bojan Banjac - AI is always right when it comes to the matter...](https://cdn.slidesharecdn.com/ss_thumbnails/syoxtqierpydwxm5srcb-4-bojan-banjac-ai-is-always-right-when-it-comes-to-the-matters-of-taste-260119101519-694ee7d7-thumbnail.jpg?width=640&height=640&fit=bounds)


