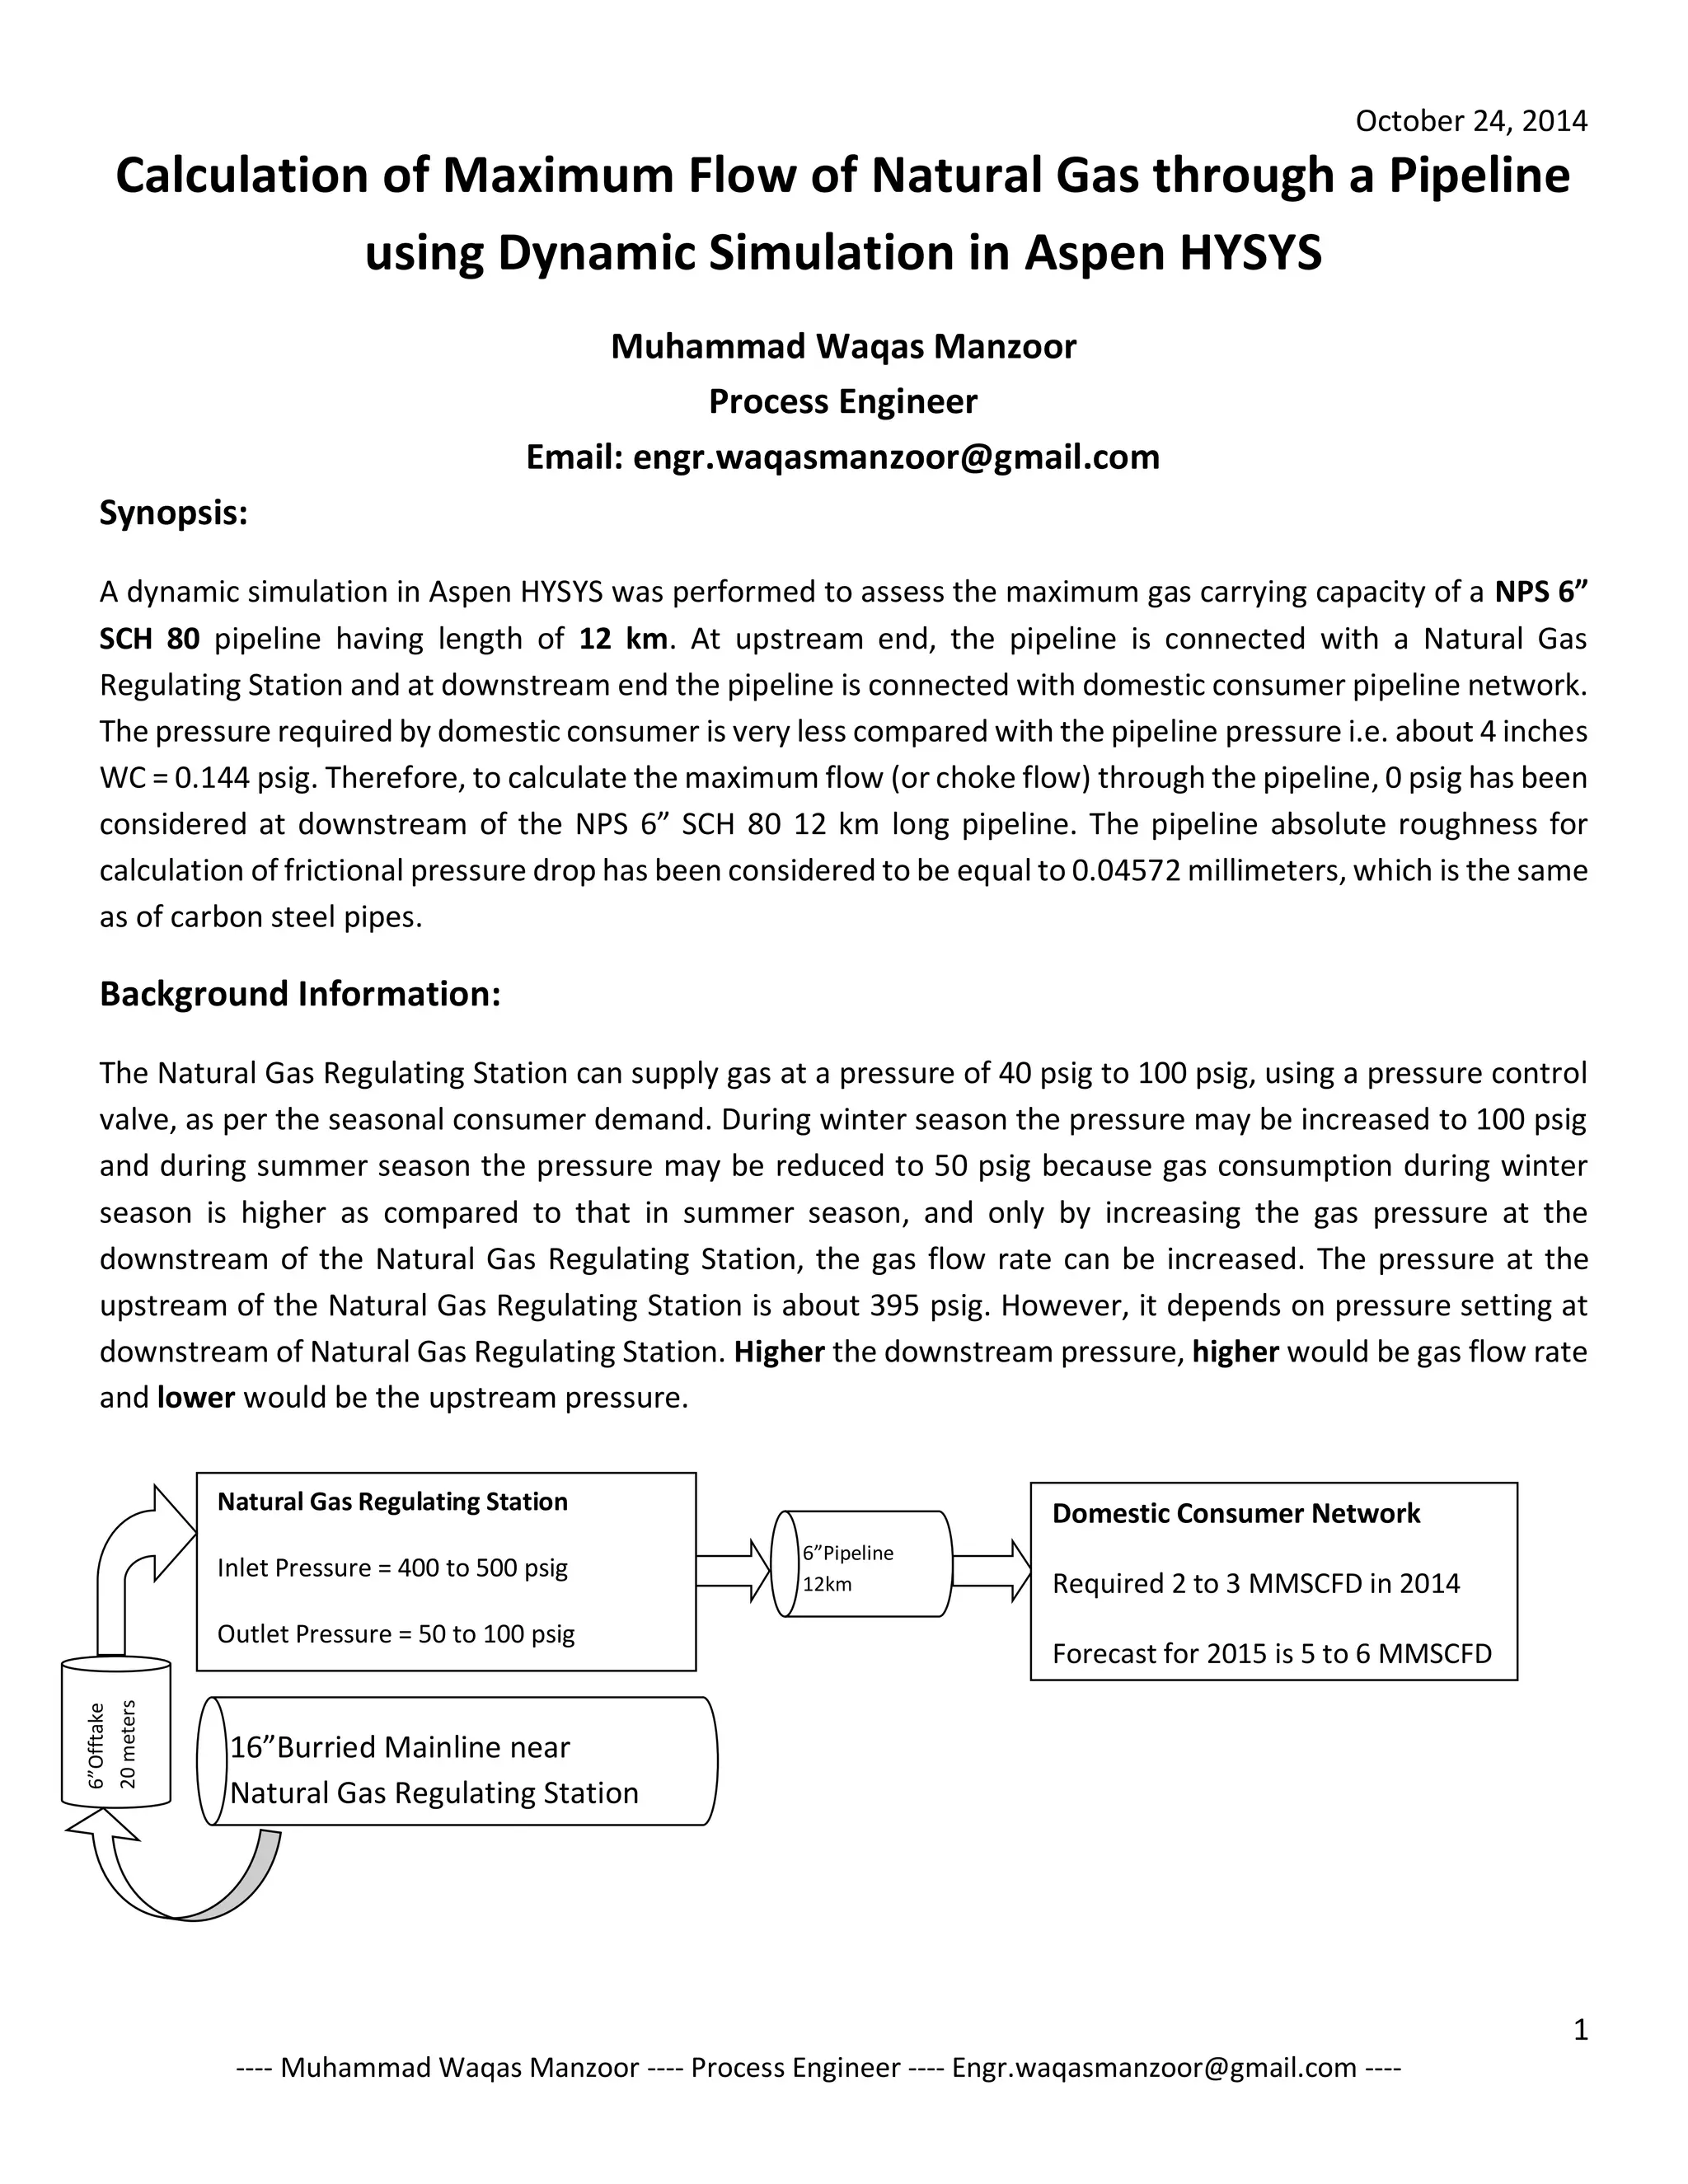
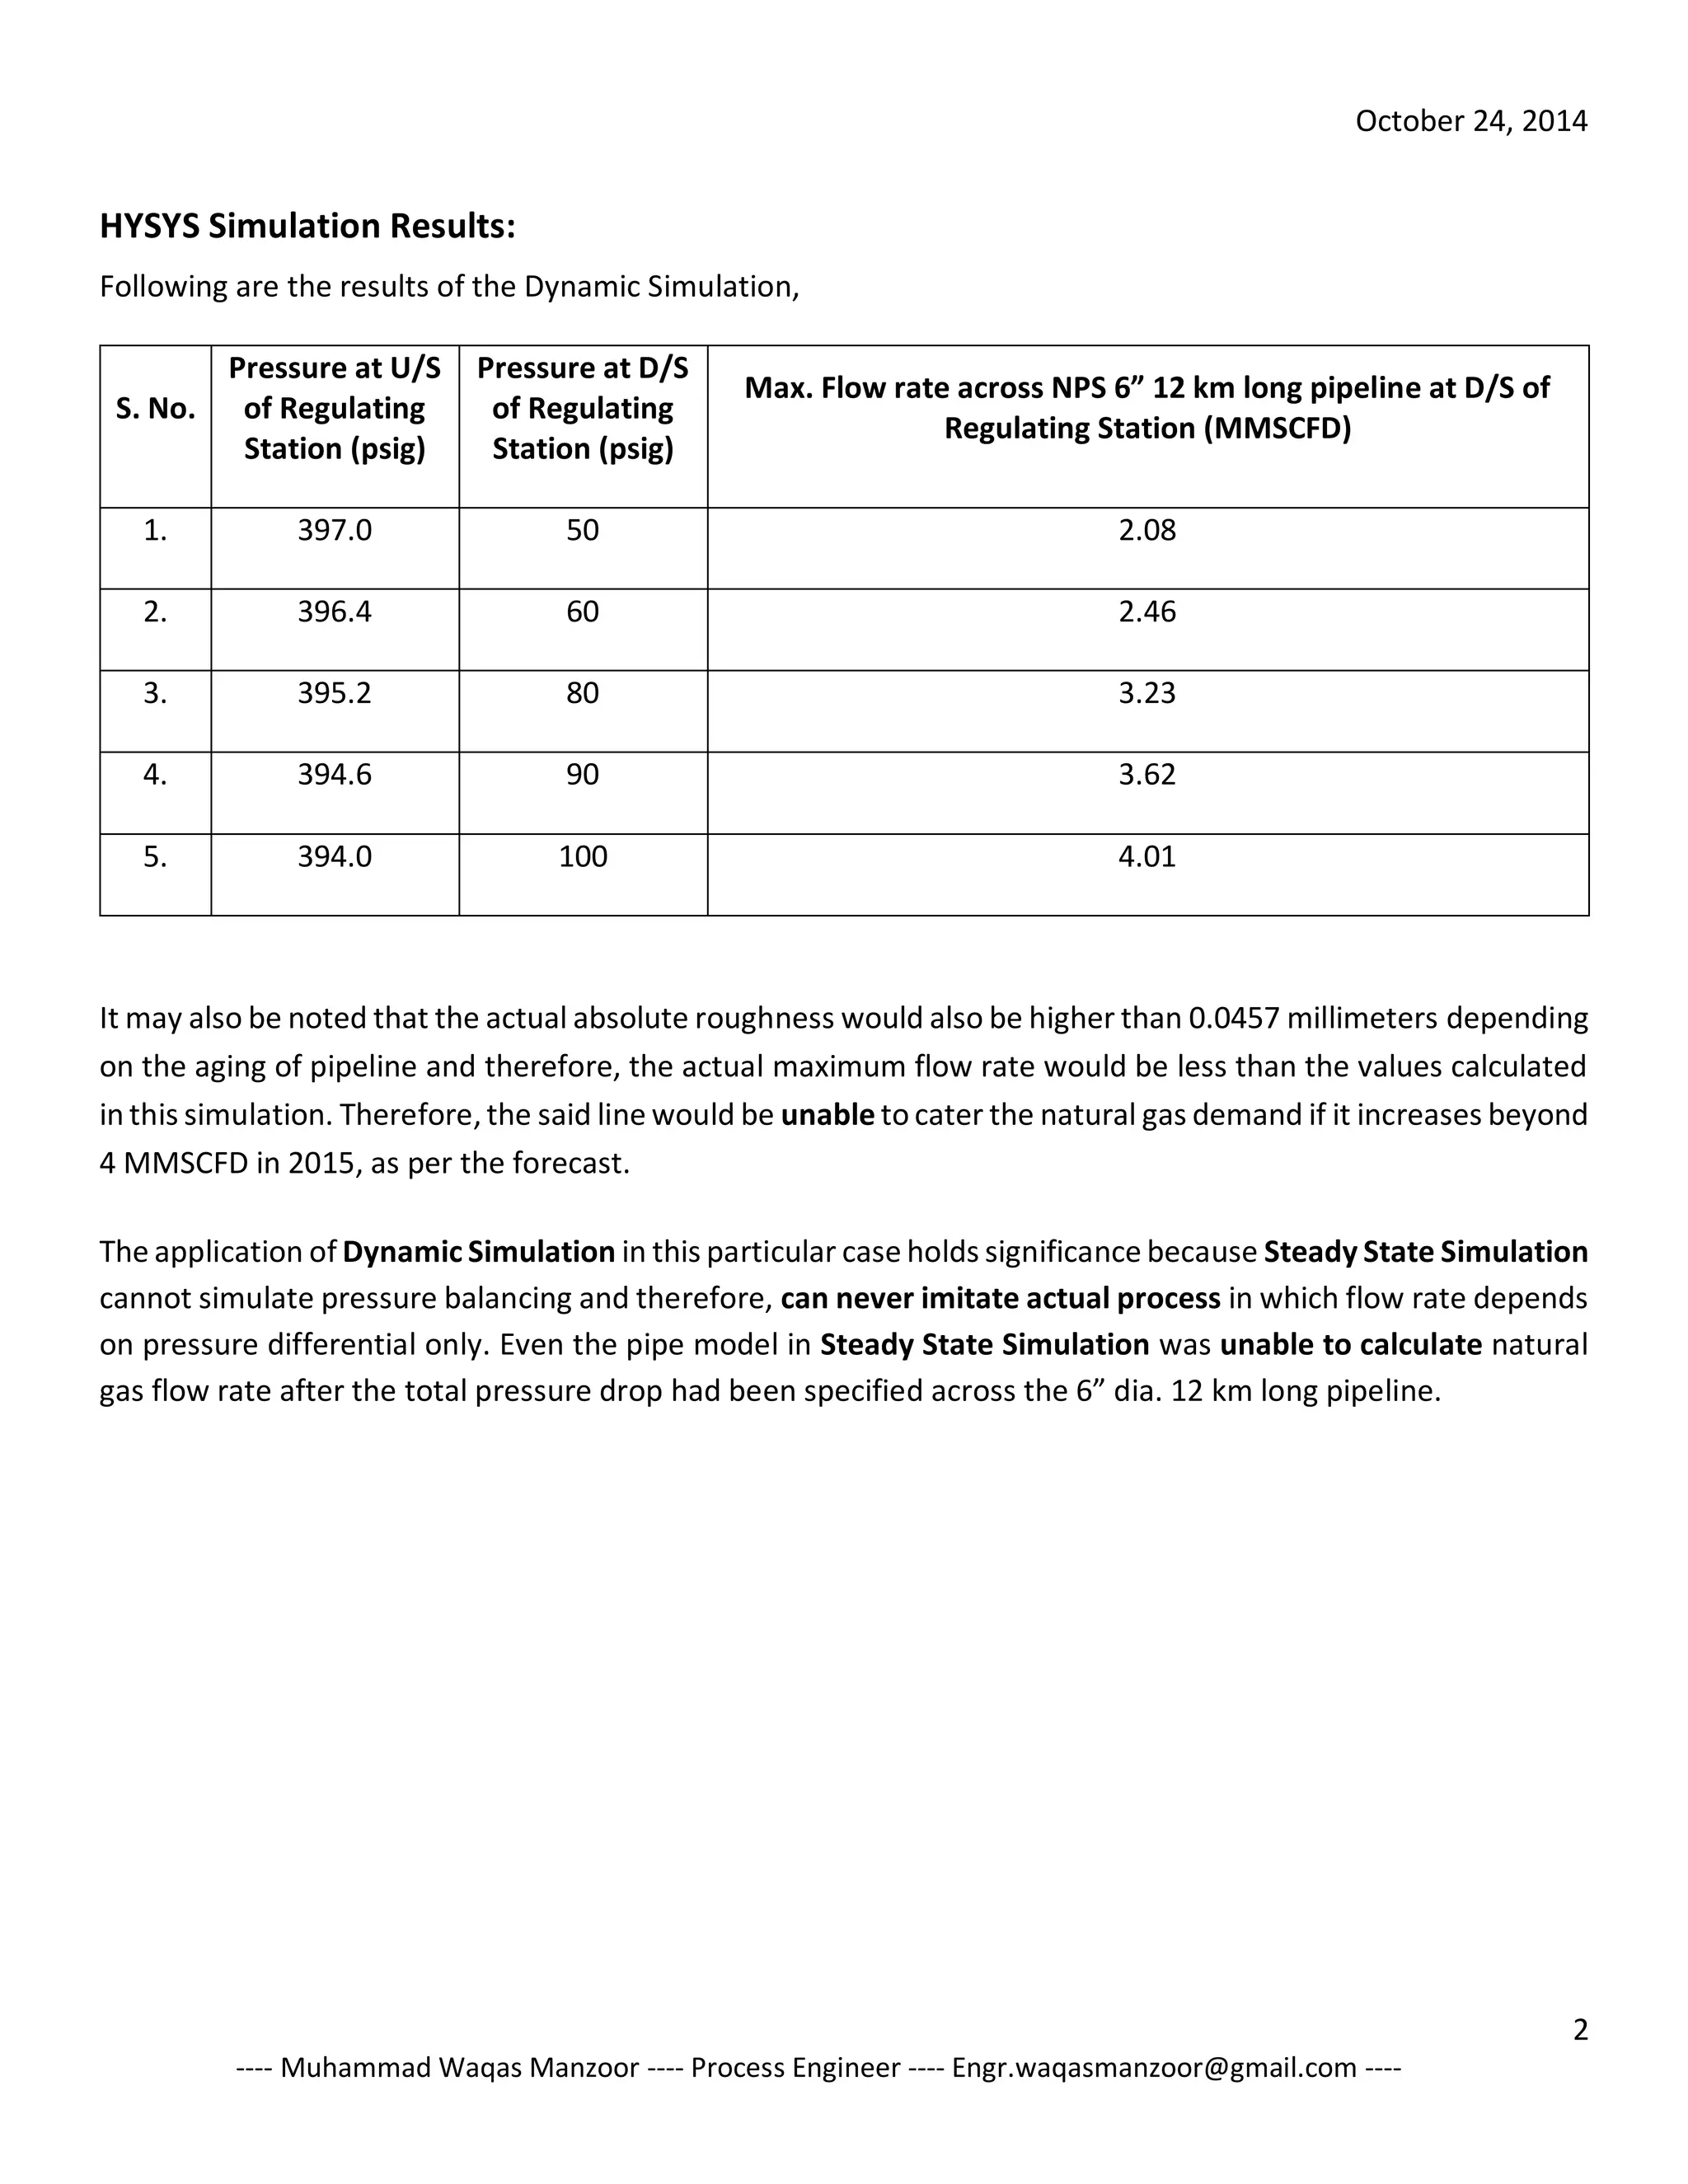
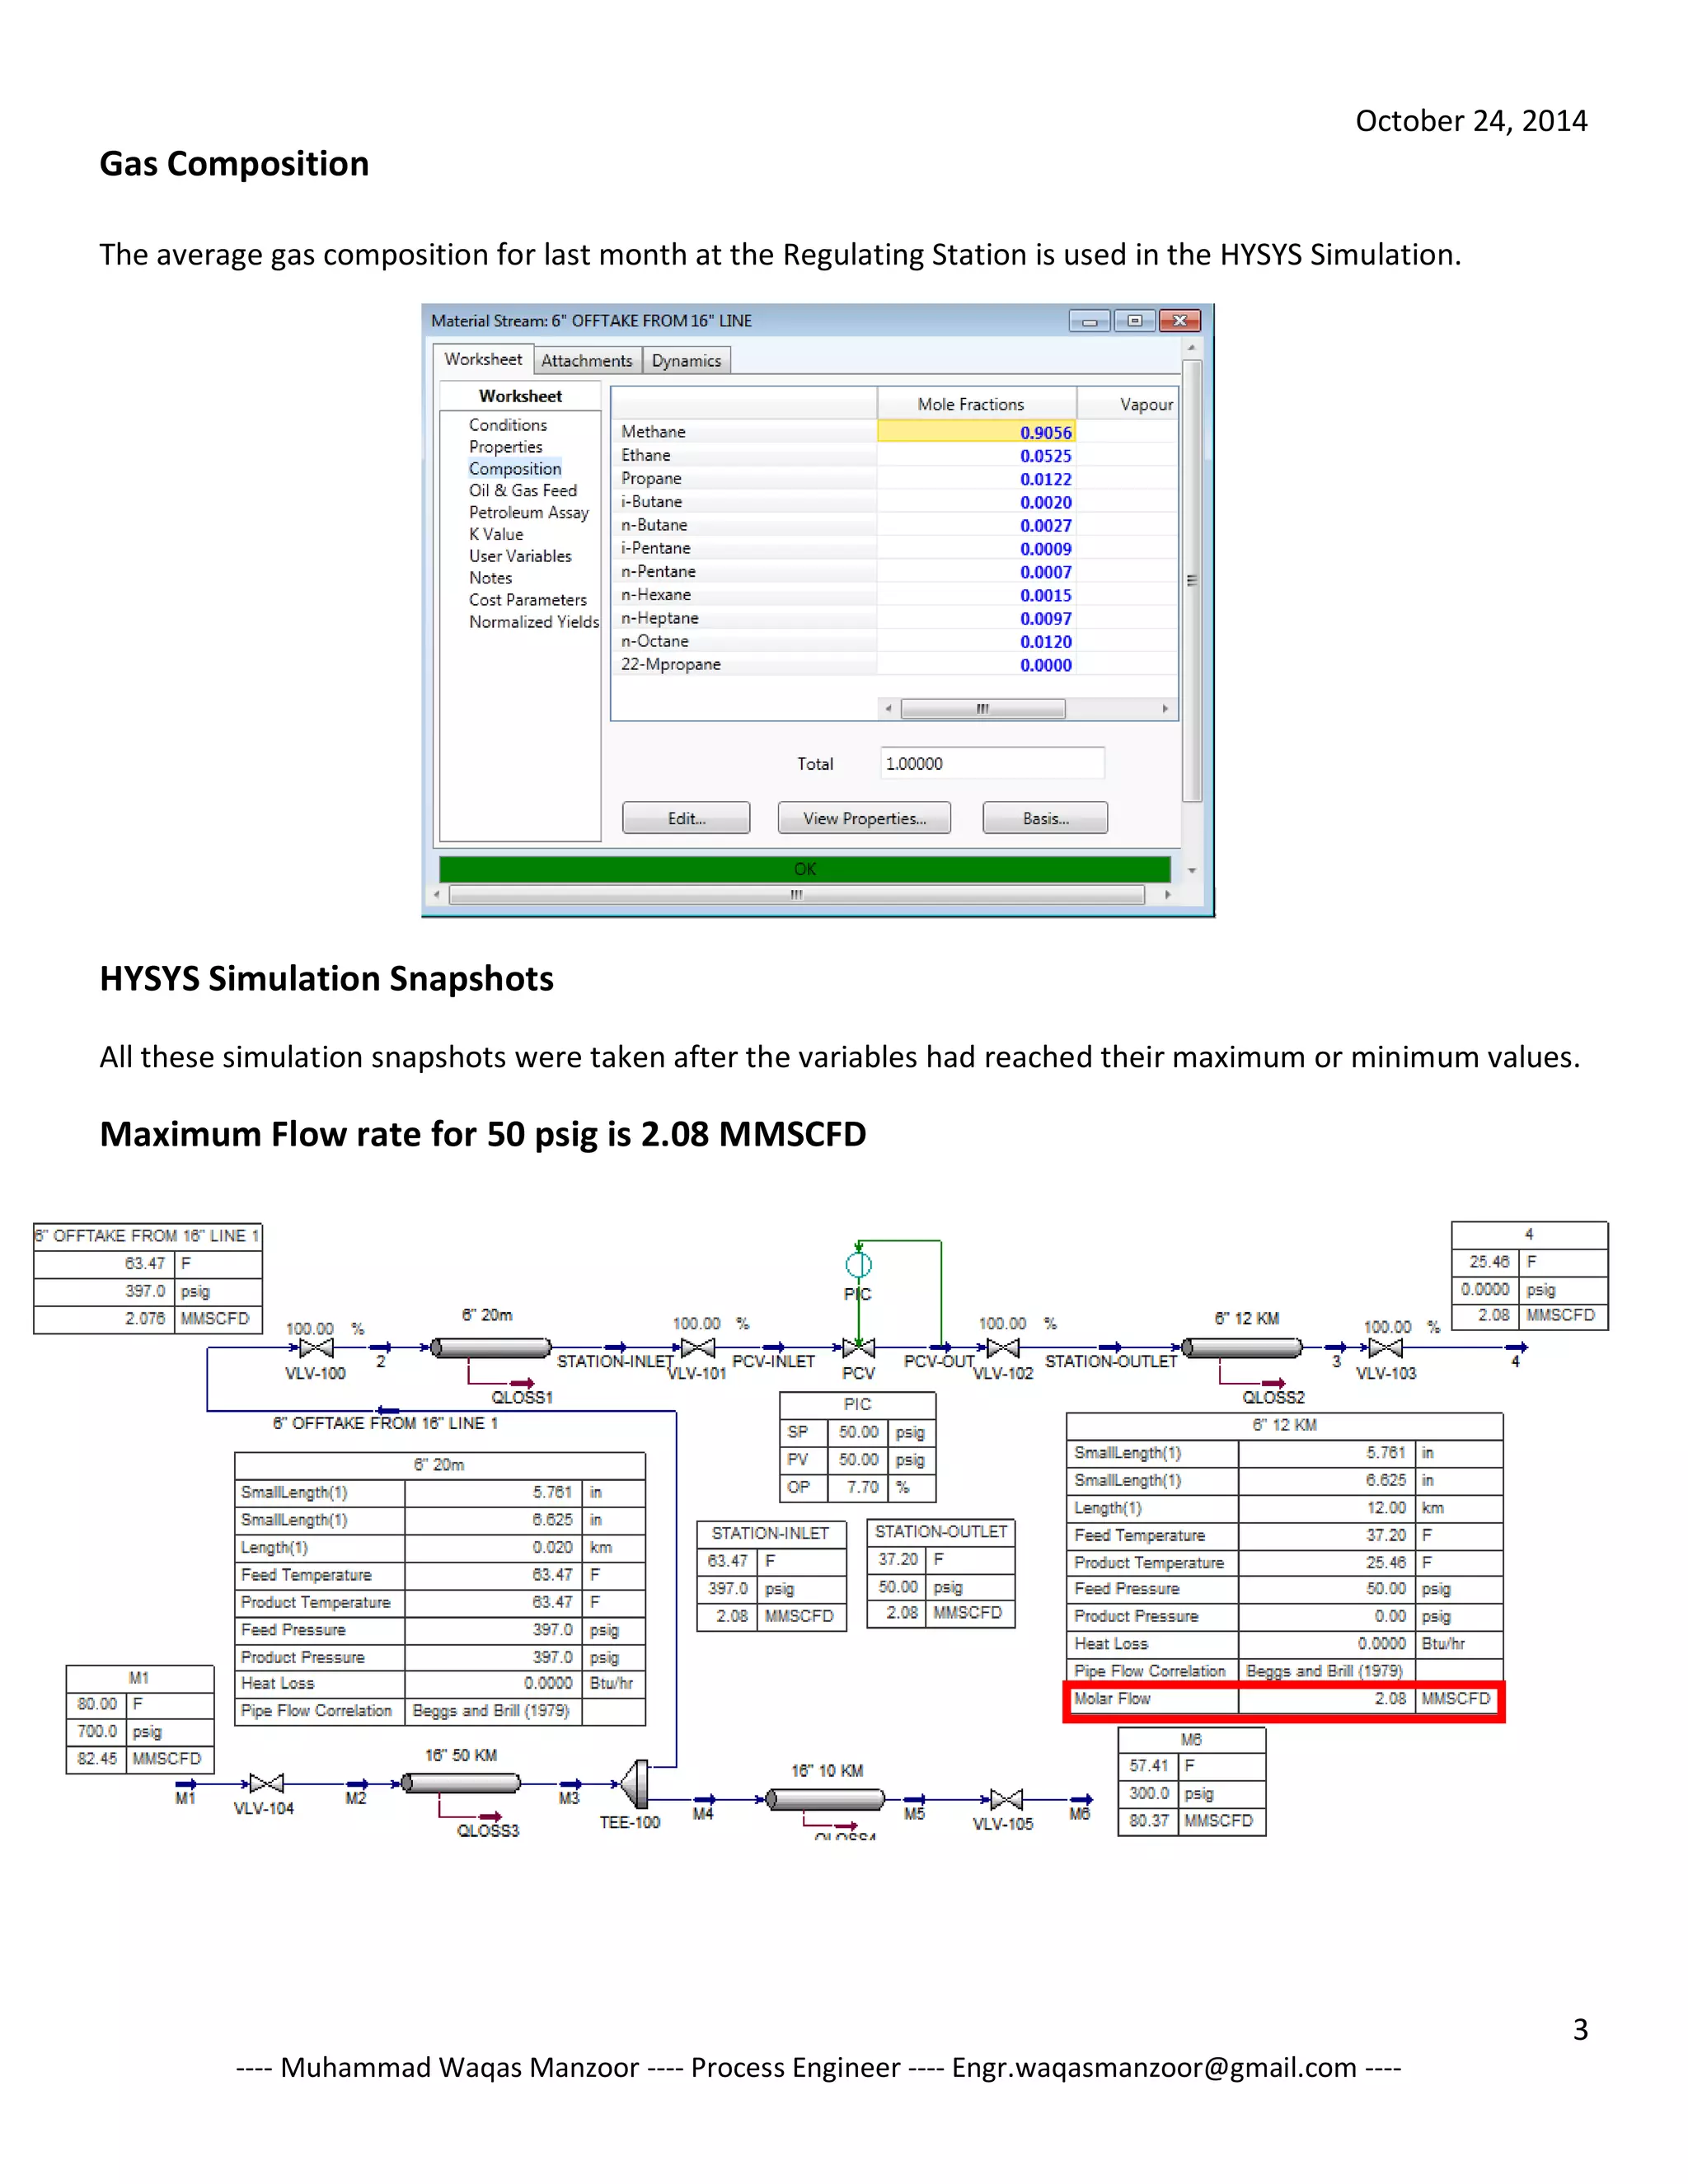
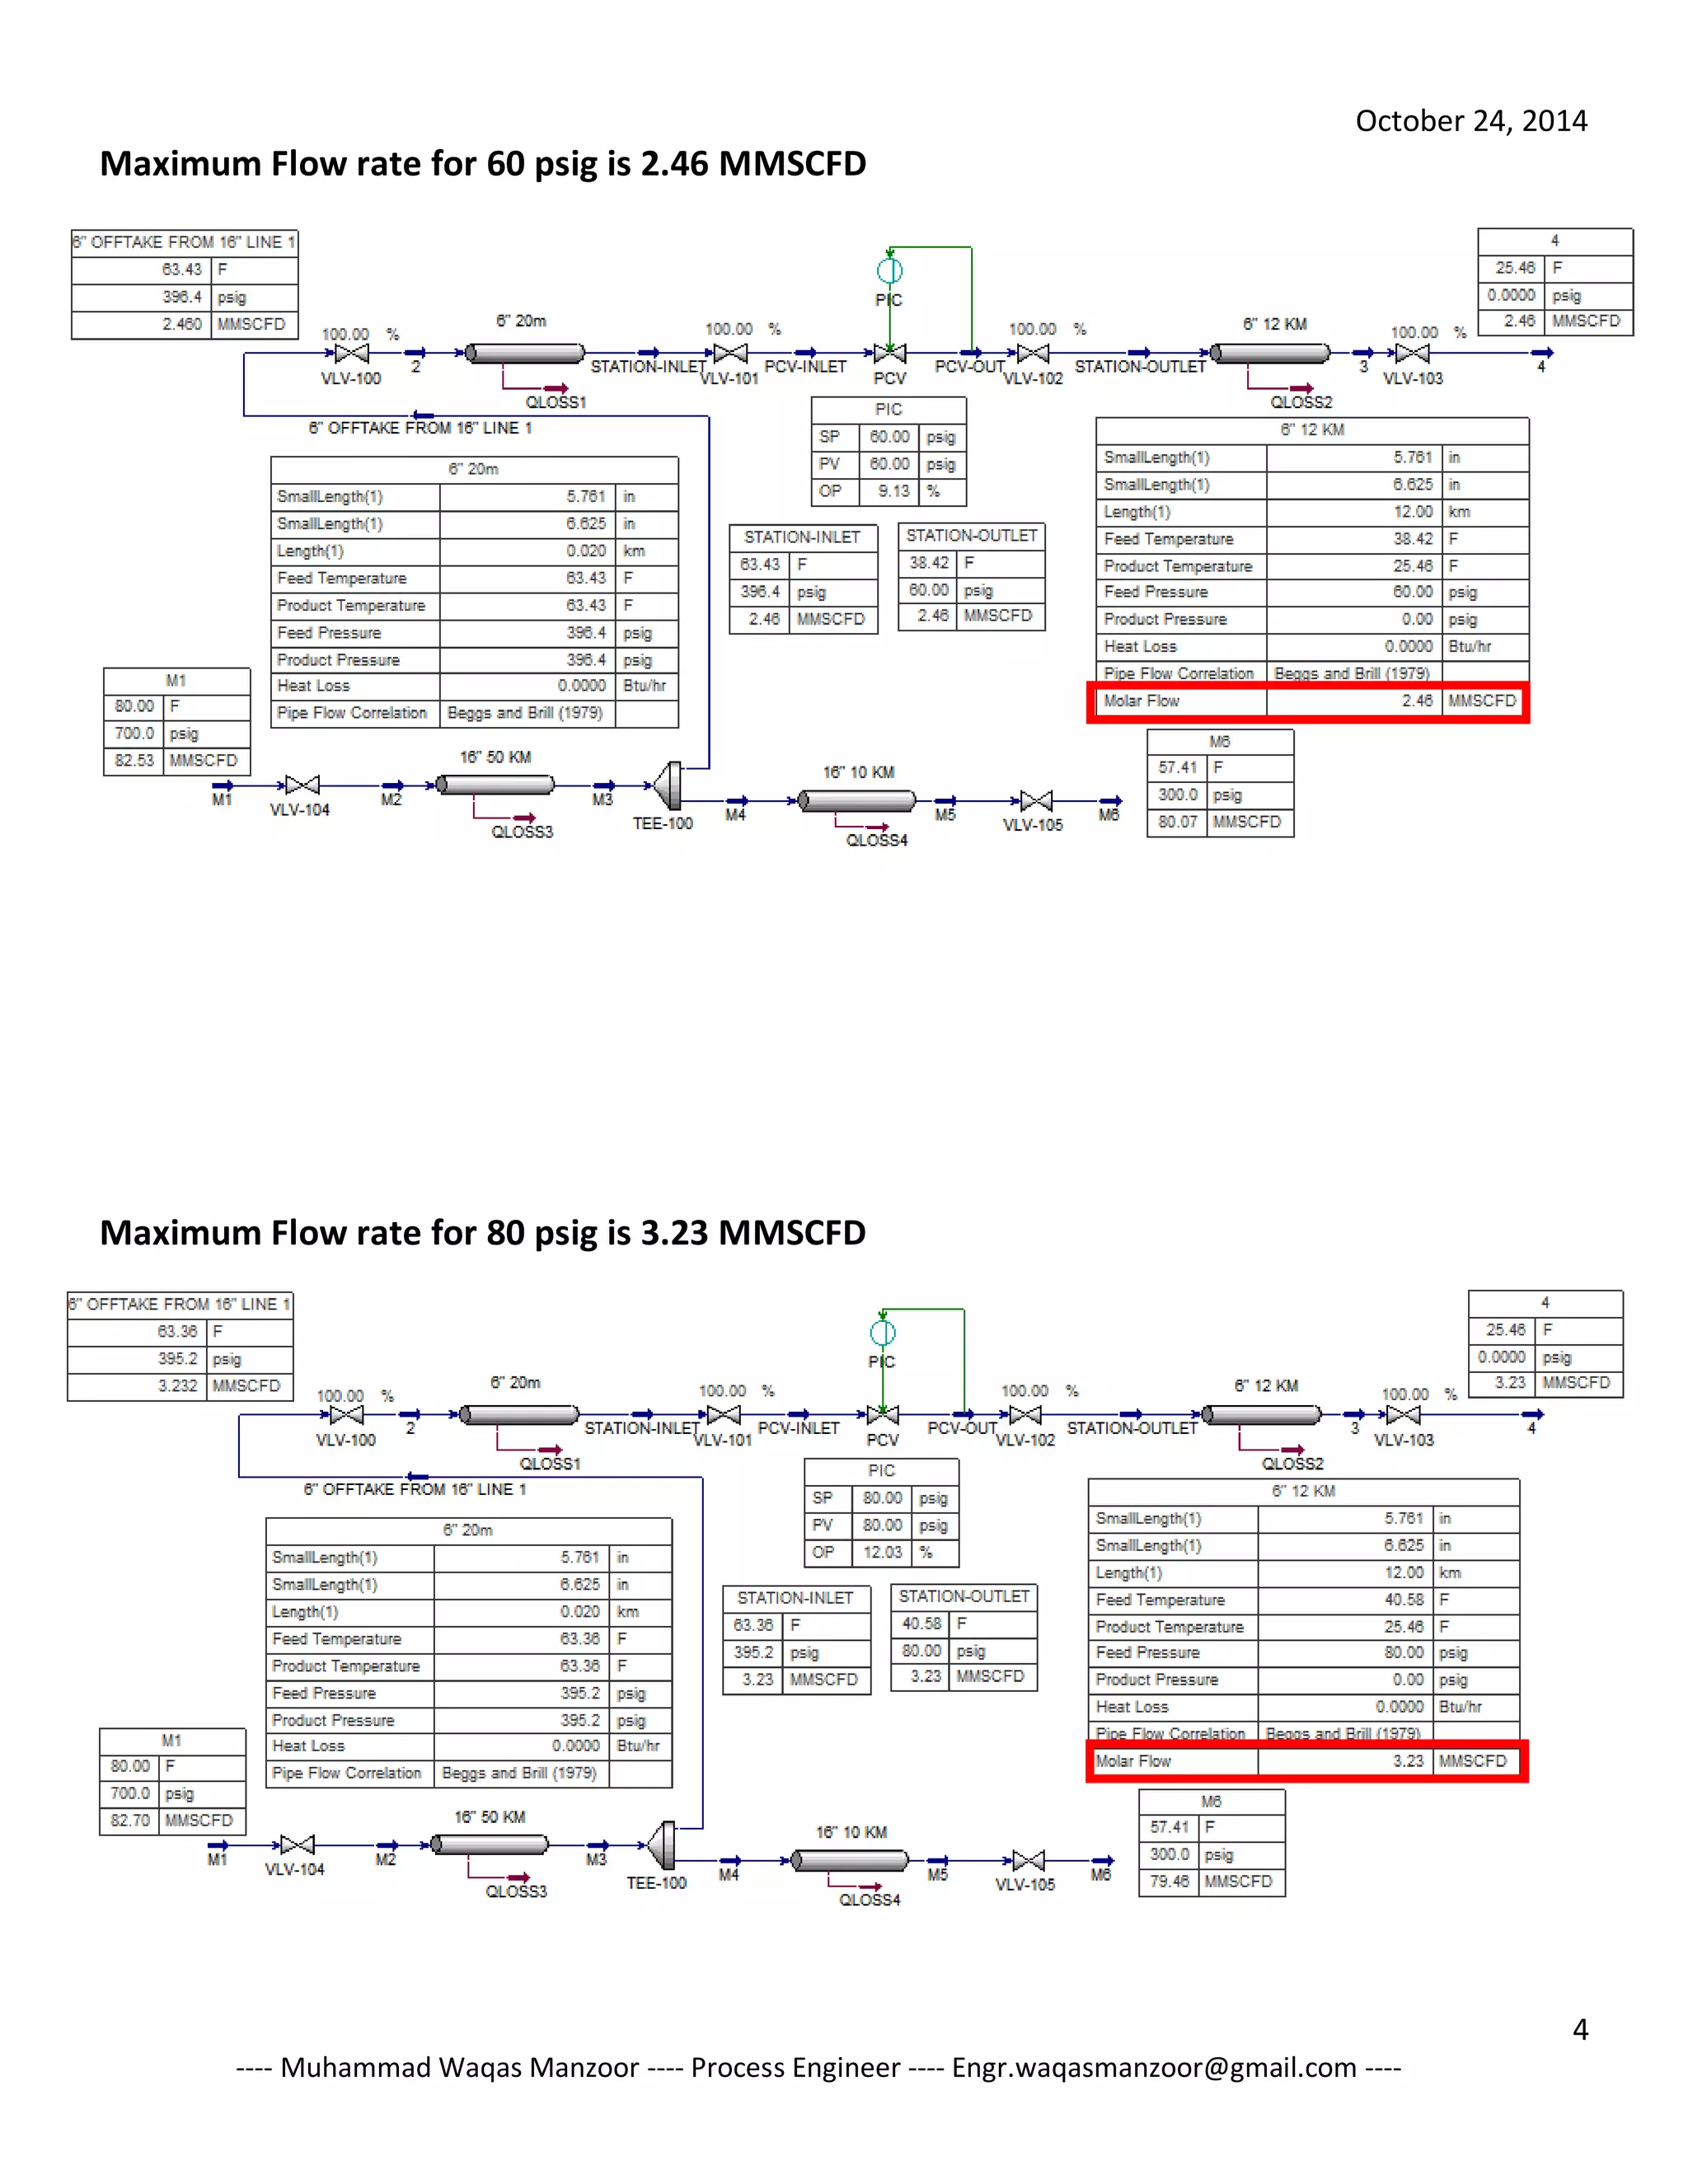
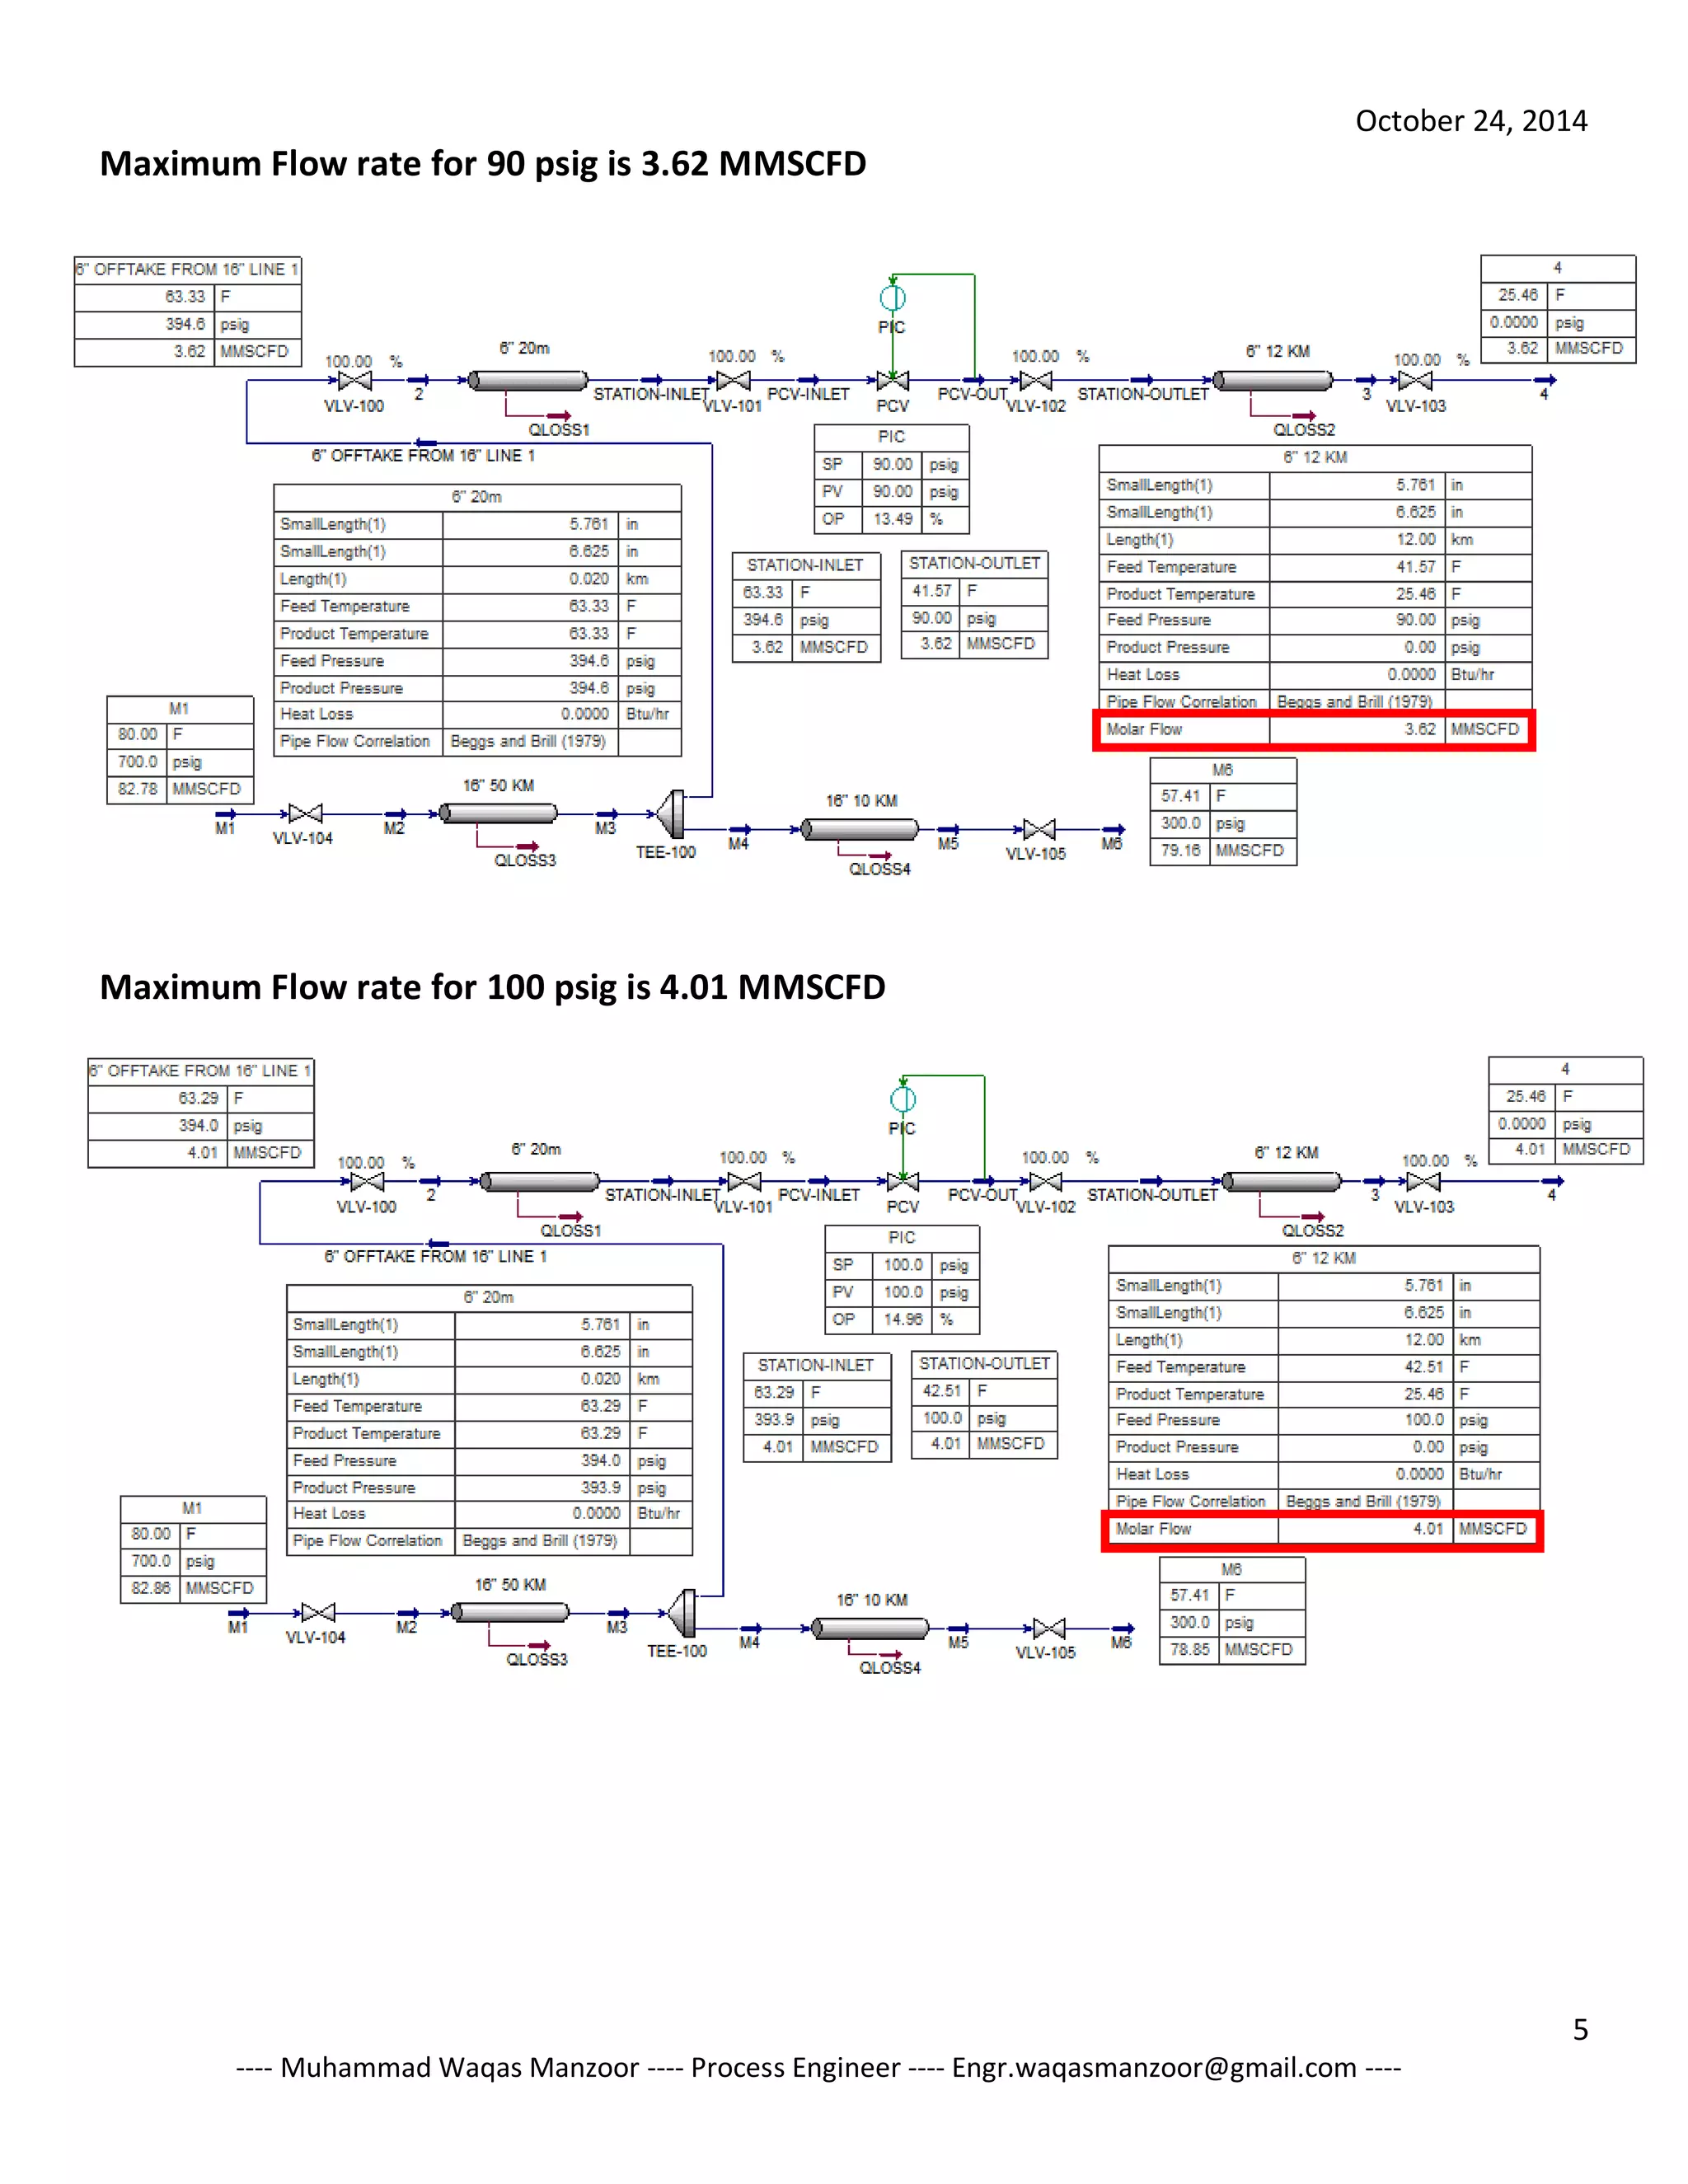
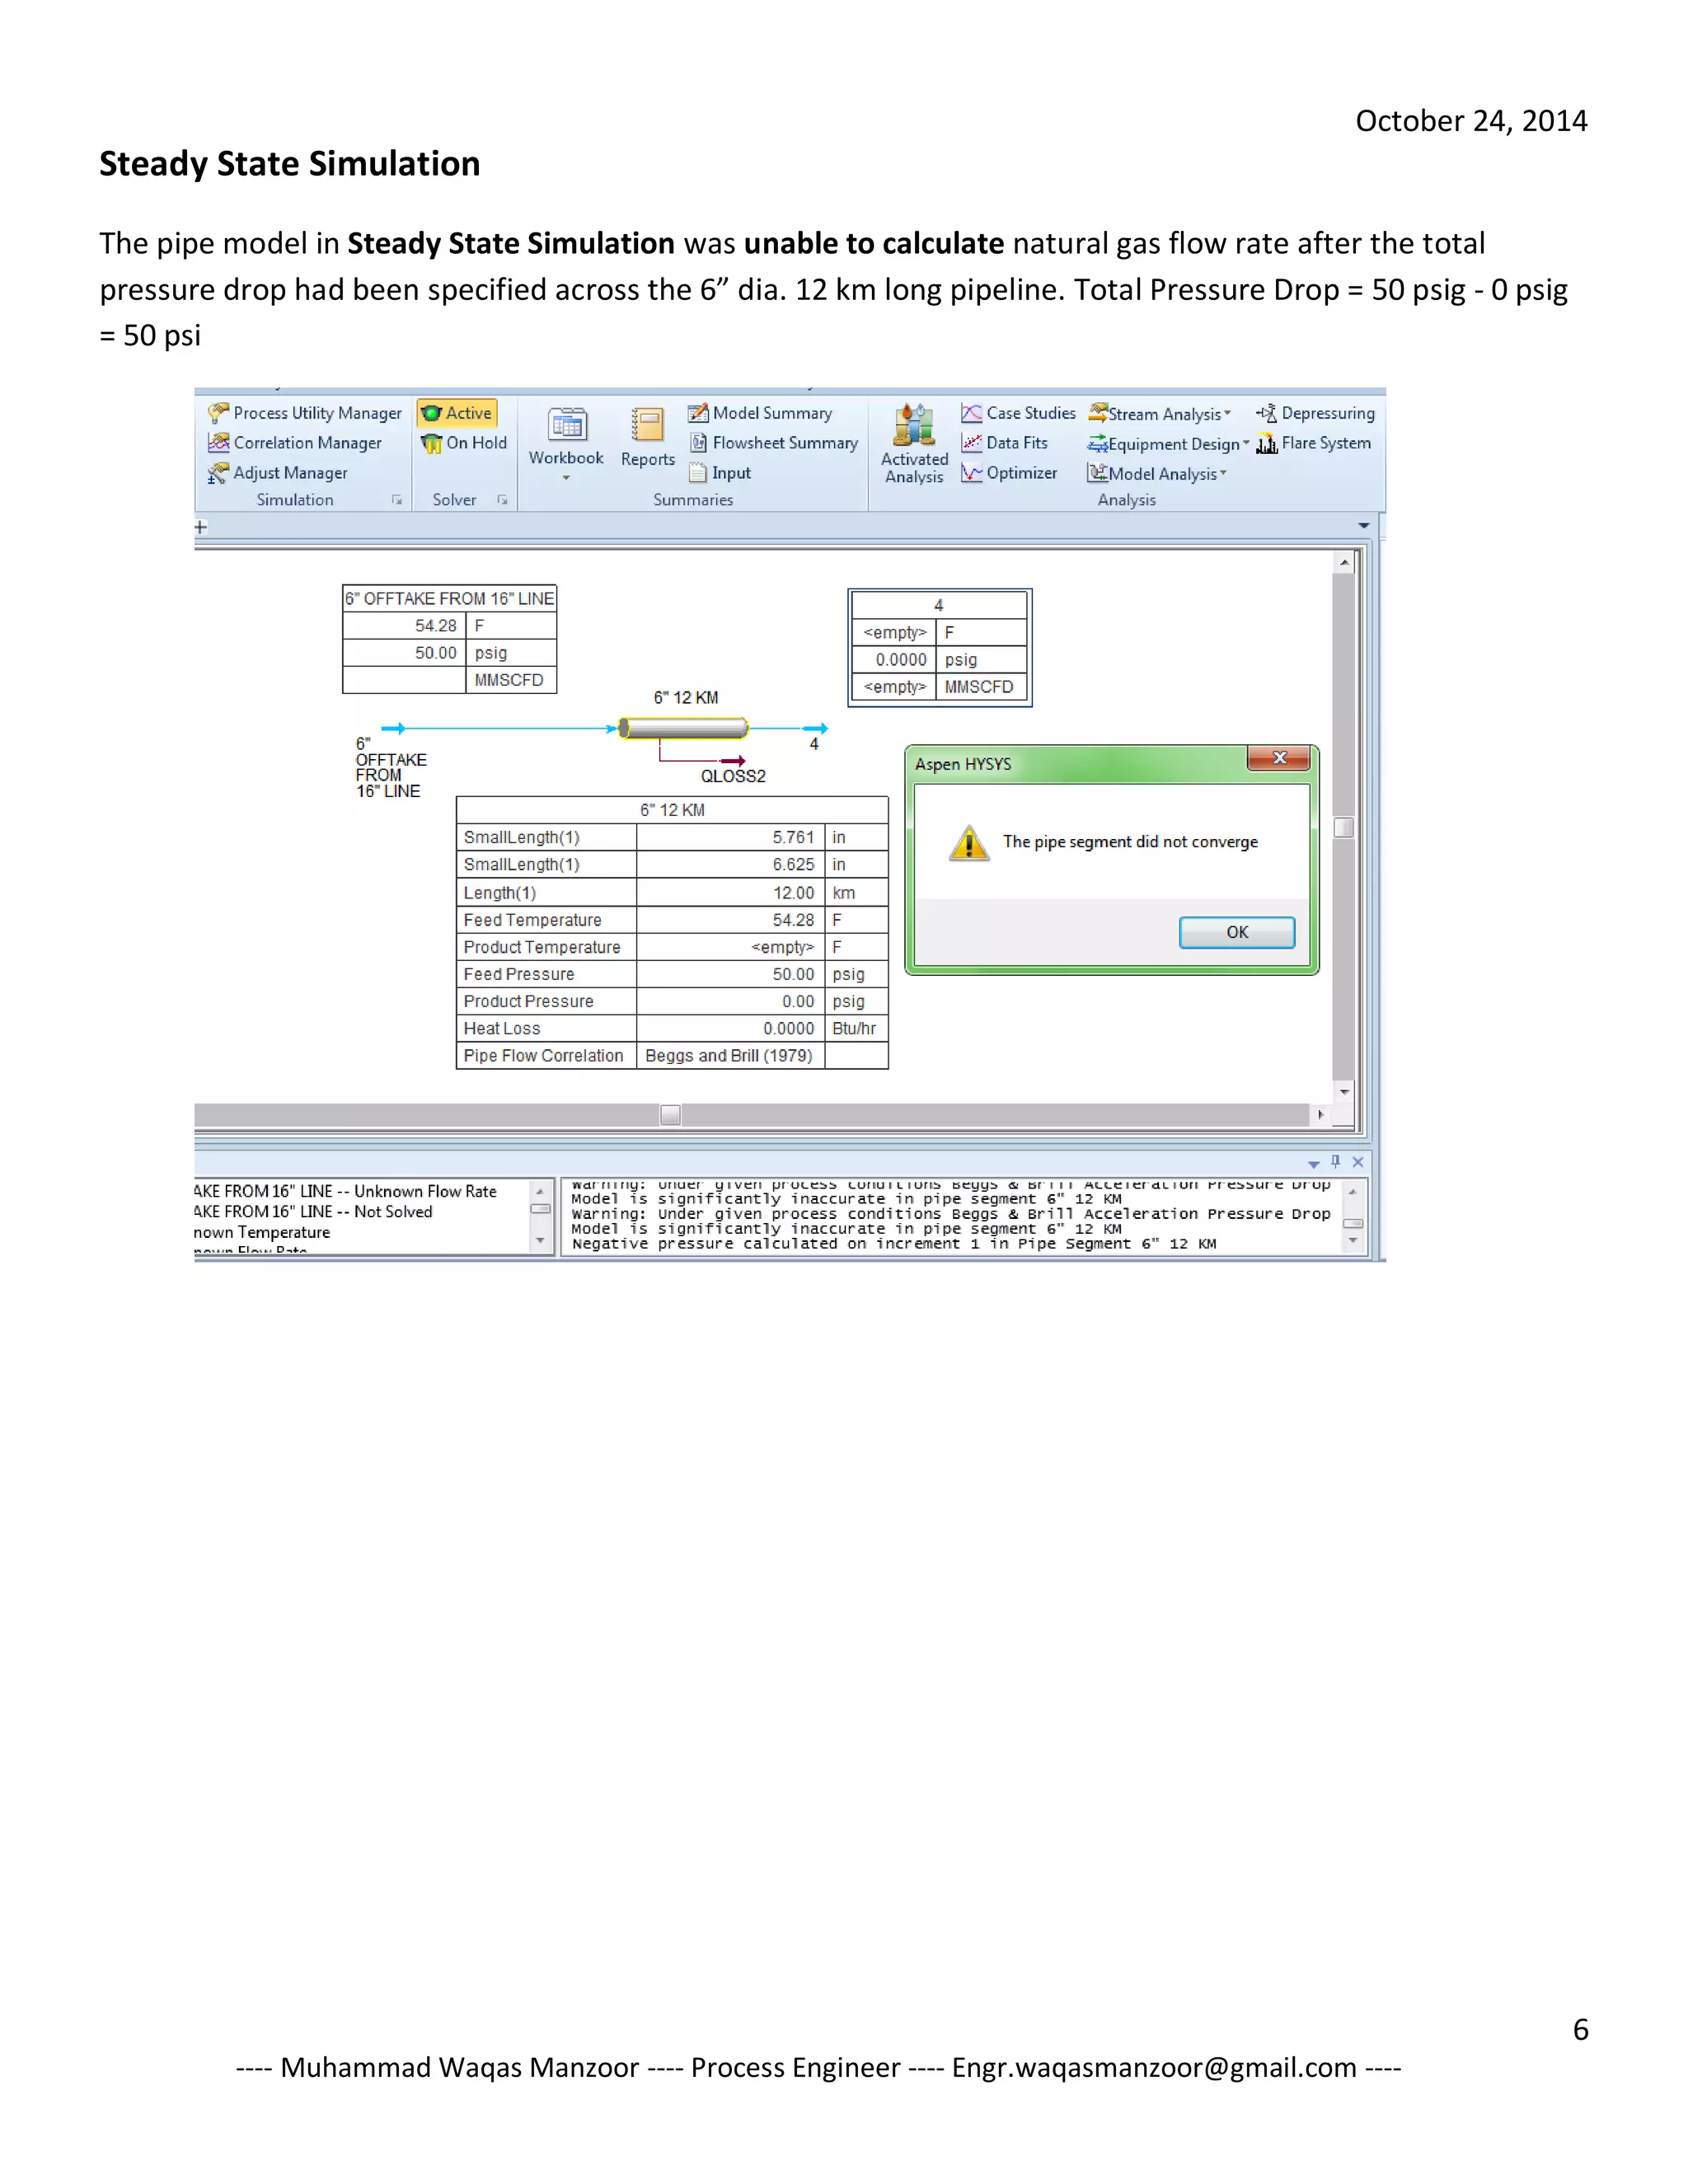
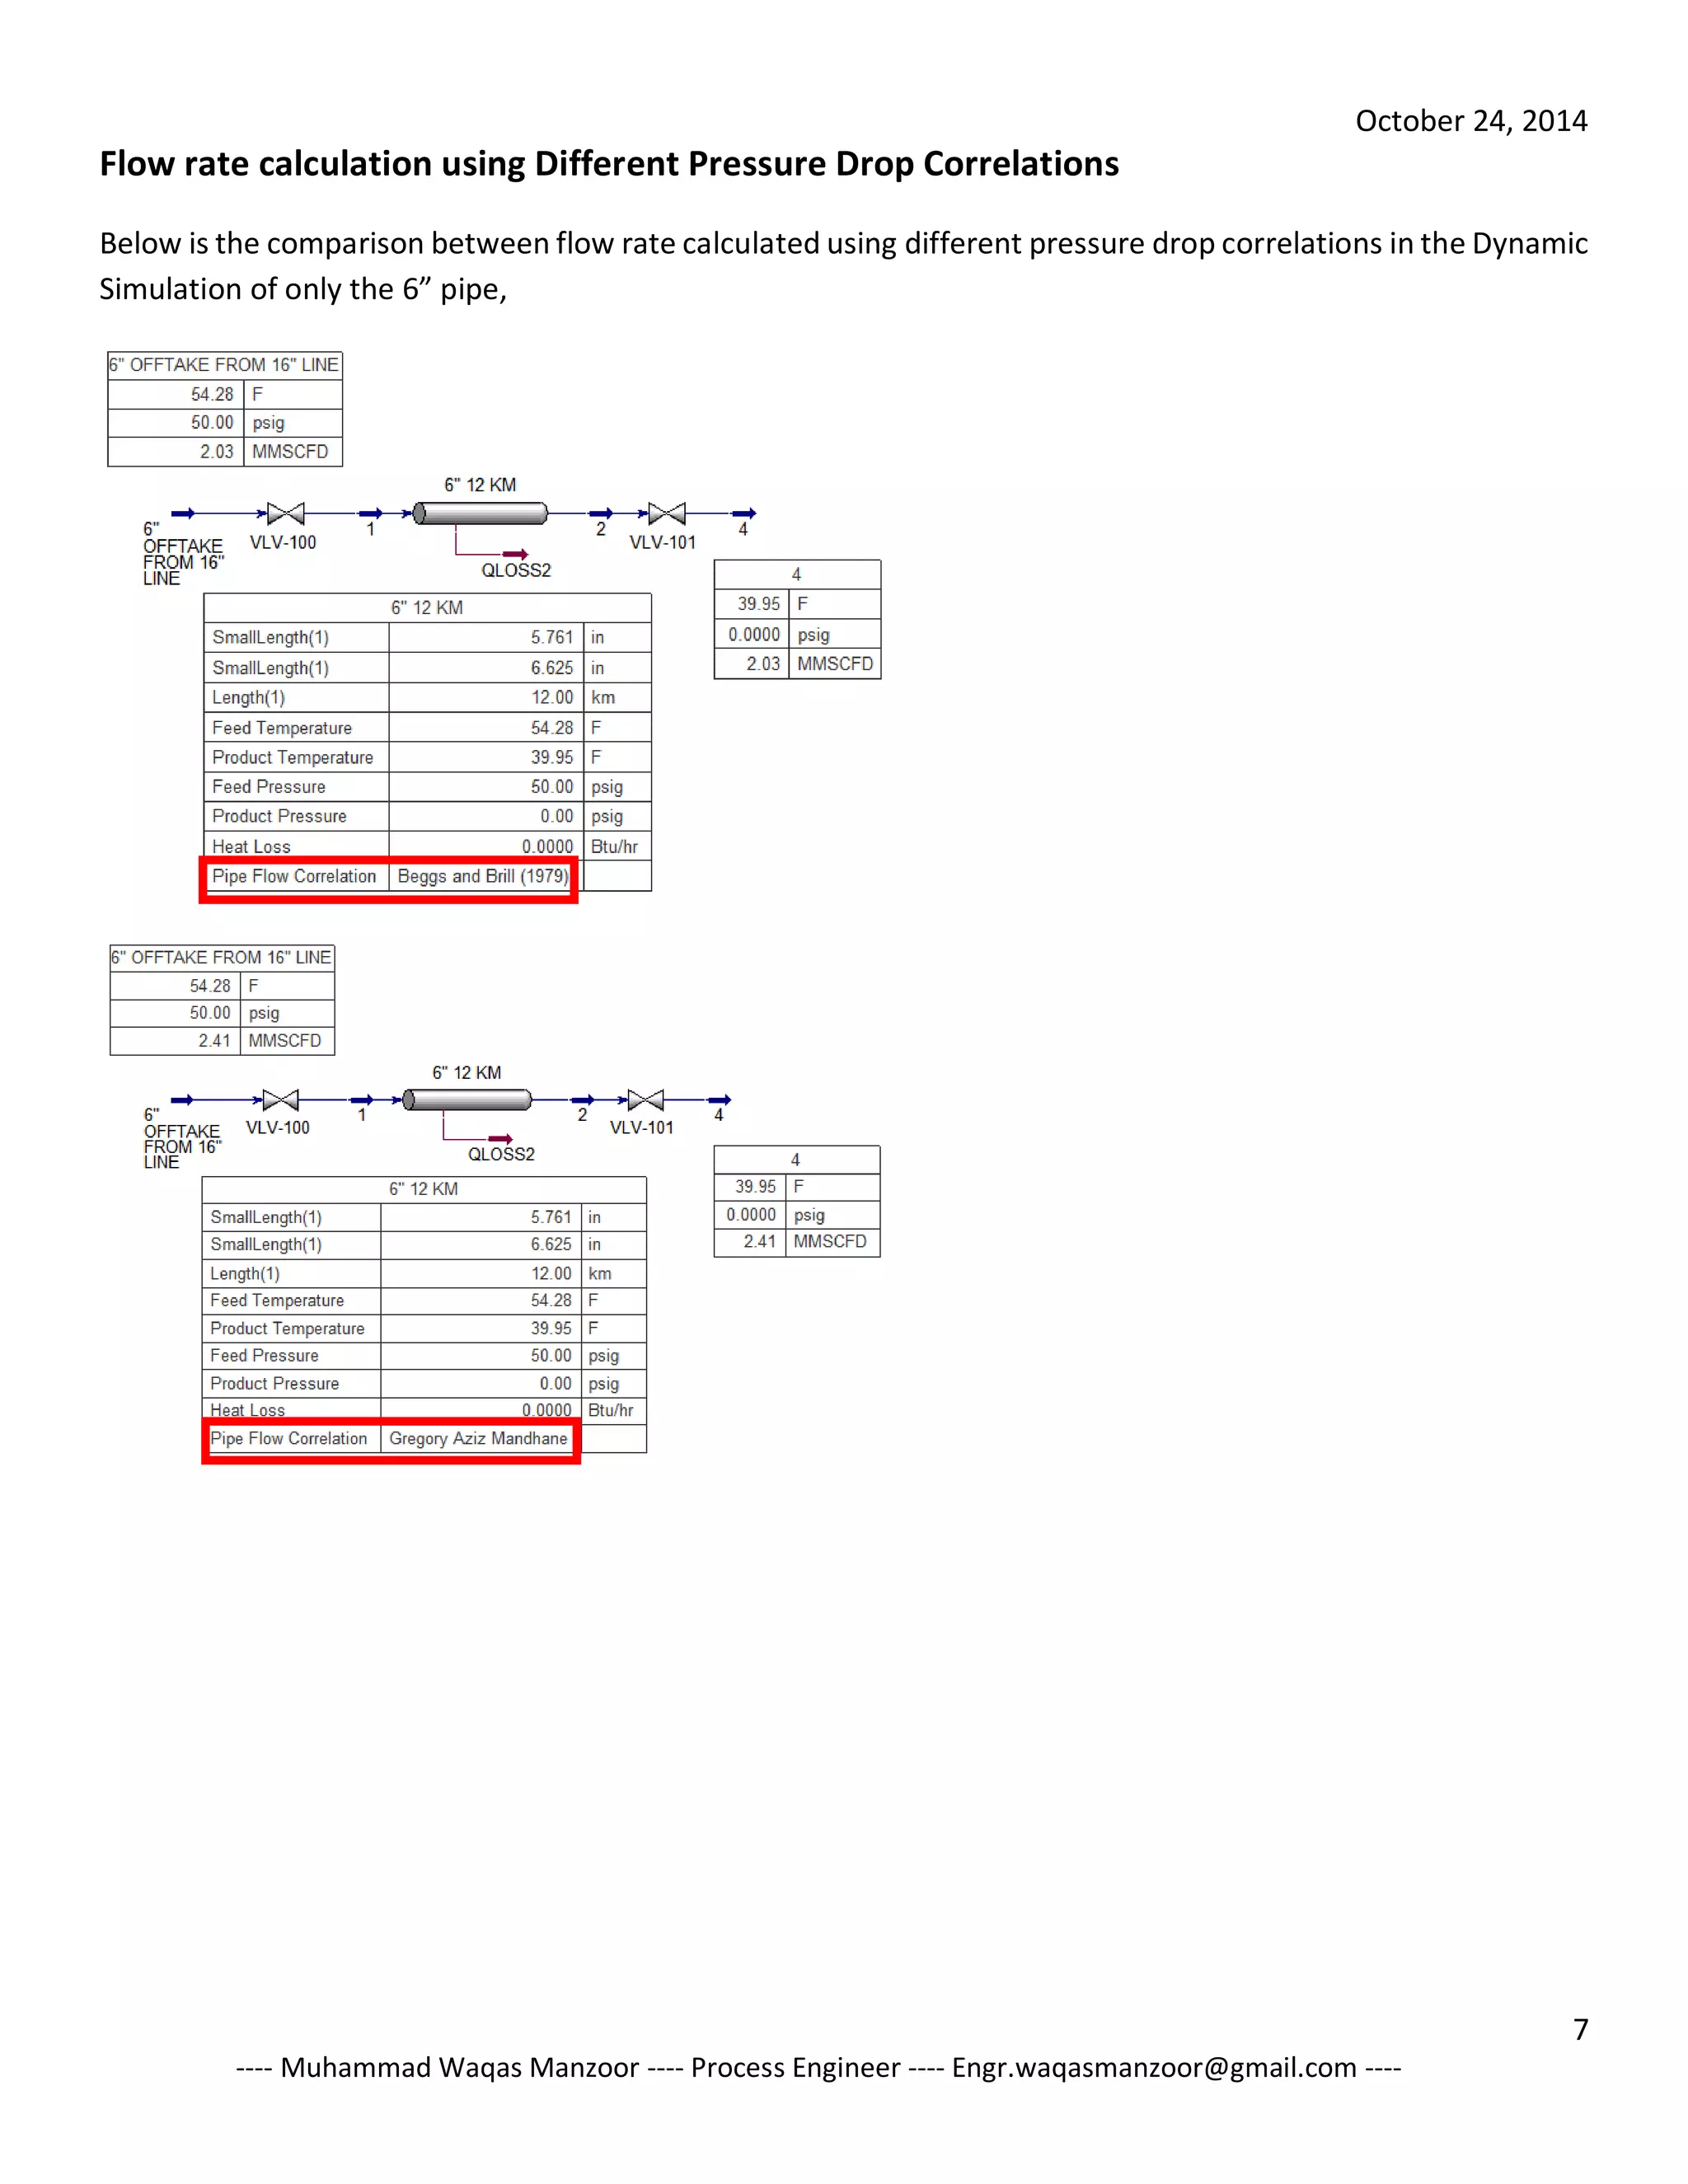
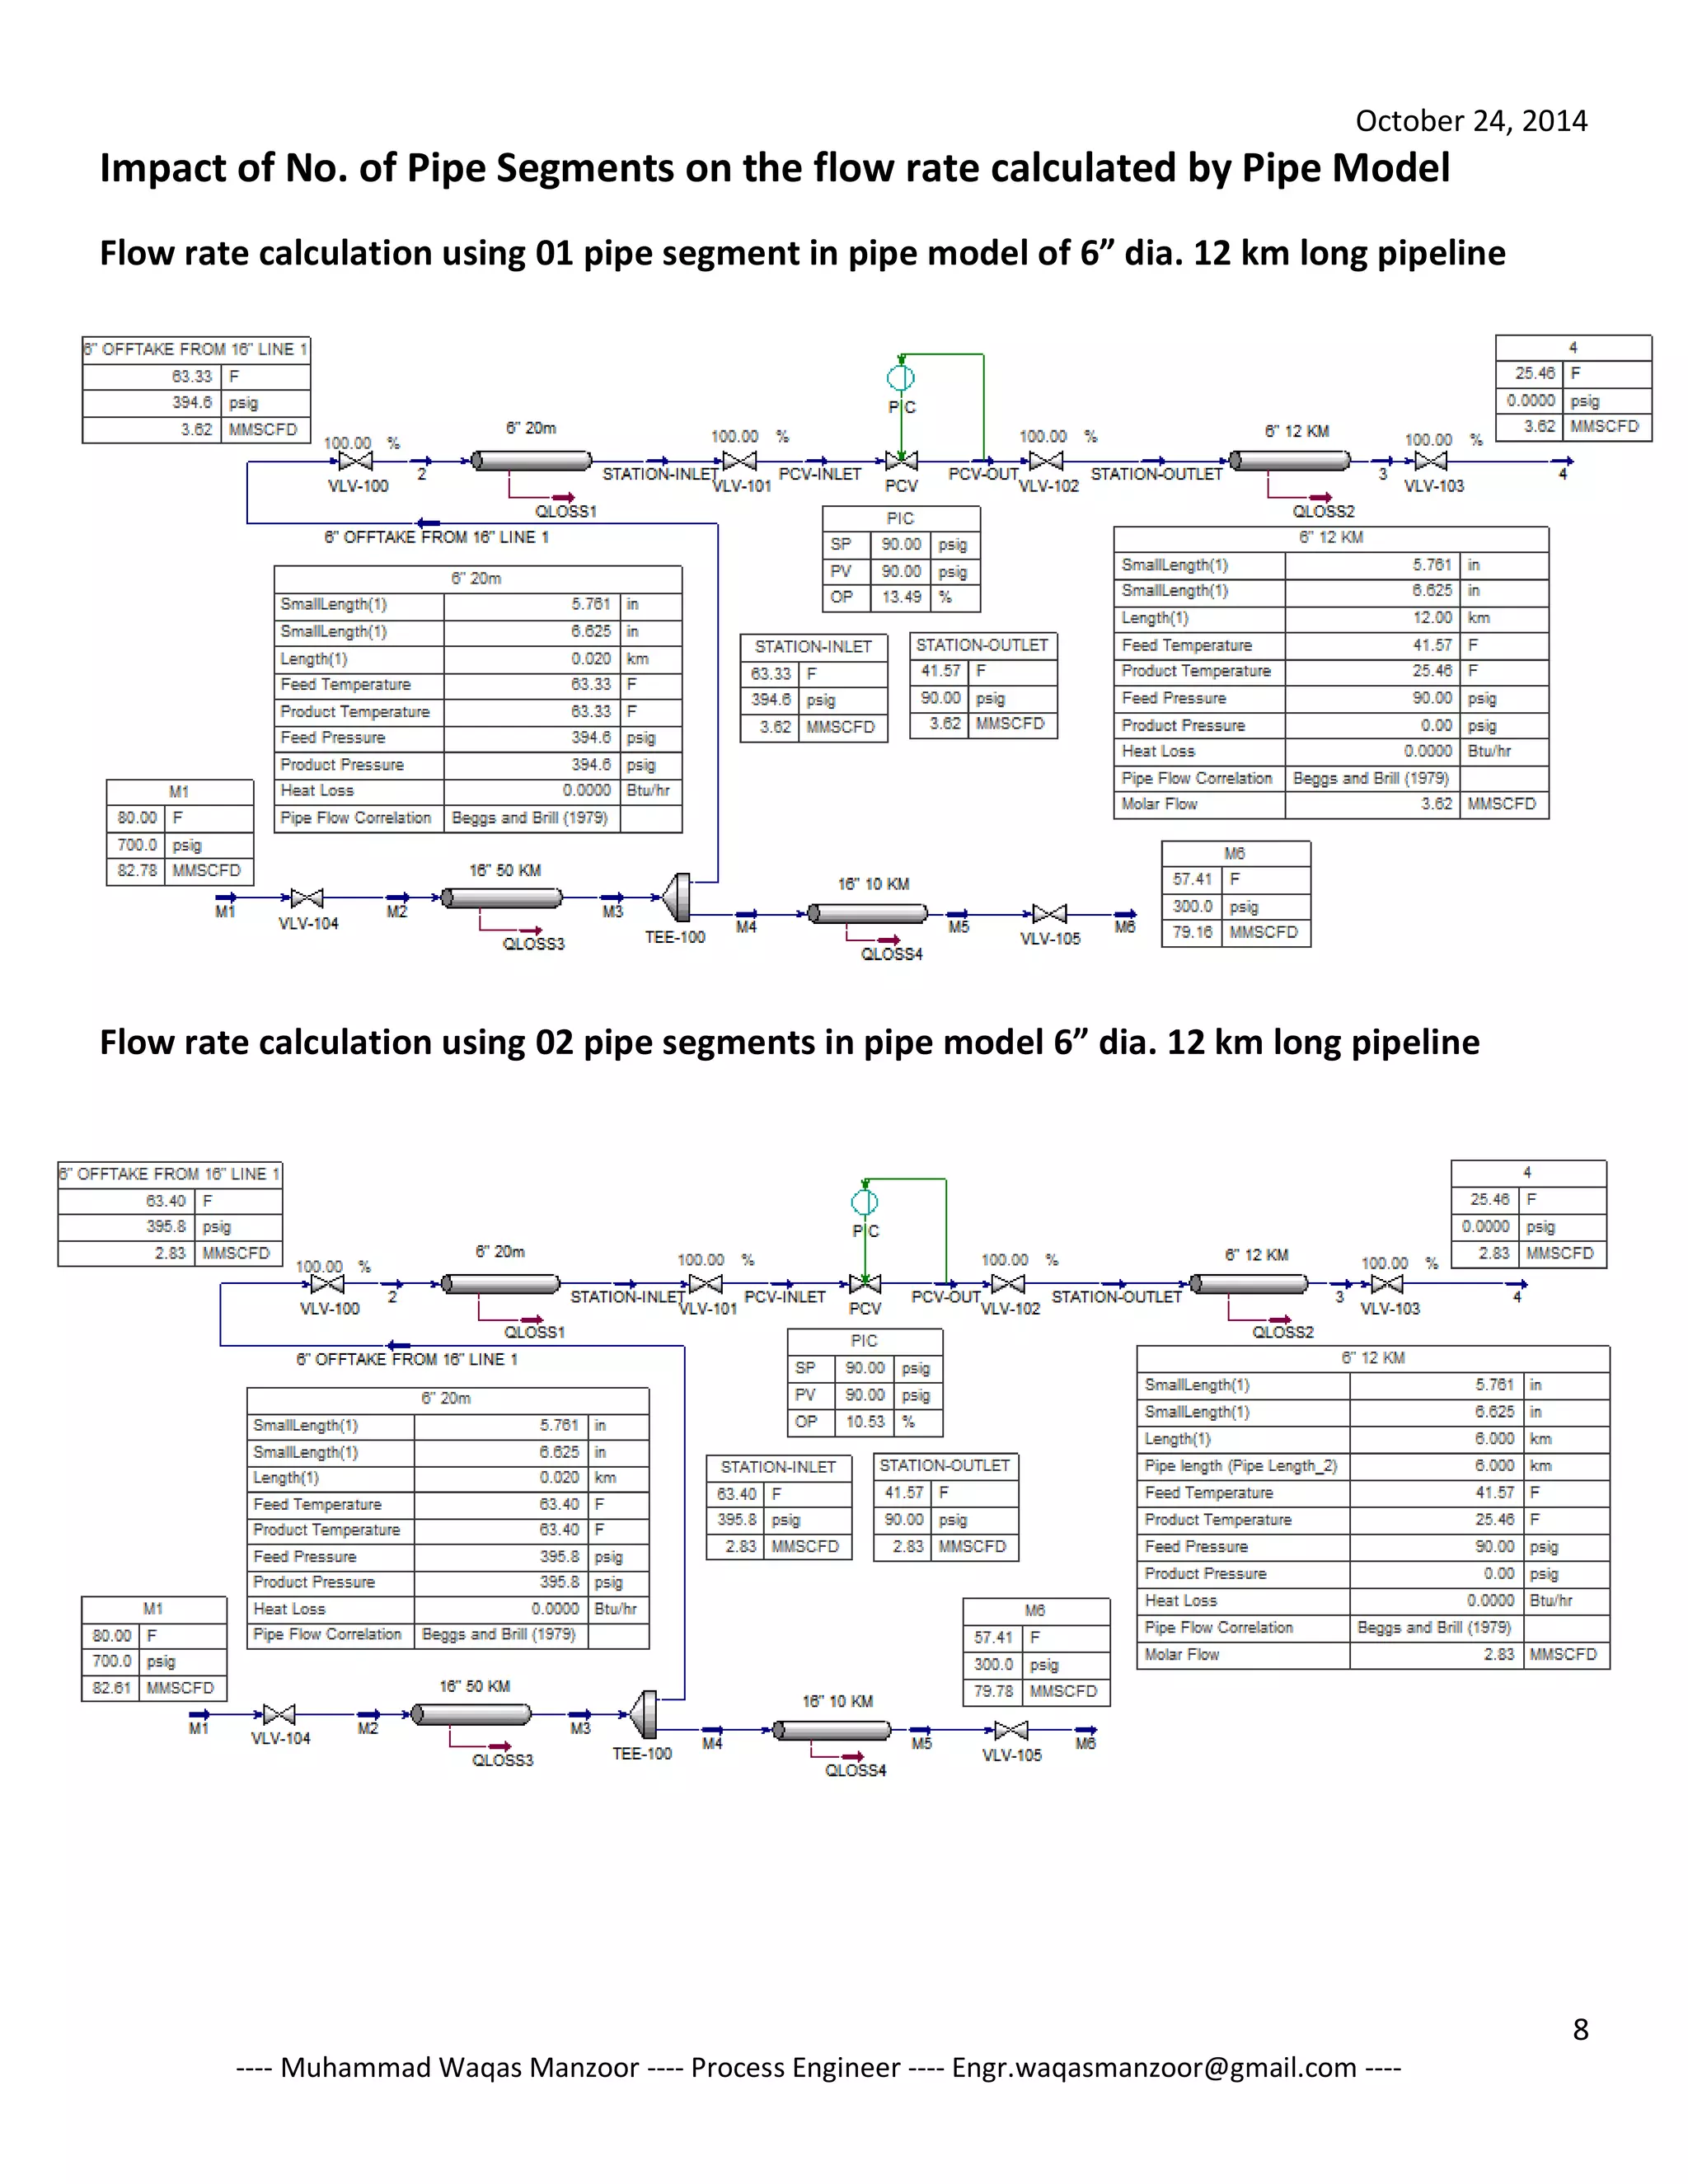
October 24, 2014 
1 
---- Muhammad Waqas Manzoor ---- Process Engineer ---- Engr.waqasmanzoor@gmail.com ---- 
Calculation of Maximum Flow of Natural Gas through a Pipeline using Dynamic Simulation in Aspen HYSYS 
Muhammad Waqas Manzoor 
Process Engineer 
Email: engr.waqasmanzoor@gmail.com 
Synopsis: 
A dynamic simulation in Aspen HYSYS was performed to assess the maximum gas carrying capacity of a NPS 6” SCH 80 pipeline having length of 12 km. At upstream end, the pipeline is connected with a Natural Gas Regulating Station and at downstream end the pipeline is connected with domestic consumer pipeline network. The pressure required by domestic consumer is very less compared with the pipeline pressure i.e. about 4 inches WC = 0.144 psig. Therefore, to calculate the maximum flow (or choke flow) through the pipeline, 0 psig has been considered at downstream of the NPS 6” SCH 80 12 km long pipeline. The pipeline absolute roughness for calculation of frictional pressure drop has been considered to be equal to 0.04572 millimeters, which is the same as of carbon steel pipes. 
Background Information: 
The Natural Gas Regulating Station can supply gas at a pressure of 40 psig to 100 psig, using a pressure control valve, as per the seasonal consumer demand. During winter season the pressure may be increased to 100 psig and during summer season the pressure may be reduced to 50 psig because gas consumption during winter season is higher as compared to that in summer season, and only by increasing the gas pressure at the downstream of the Natural Gas Regulating Station, the gas flow rate can be increased. The pressure at the upstream of the Natural Gas Regulating Station is about 395 psig. However, it depends on pressure setting at downstream of Natural Gas Regulating Station. Higher the downstream pressure, higher would be gas flow rate and lower would be the upstream pressure. 
Natural Gas Regulating Station 
Inlet Pressure = 400 to 500 psig 
Outlet Pressure = 50 to 100 psig 
6”Pipeline 12km 
Domestic Consumer Network 
Required 2 to 3 MMSCFD in 2014 
Forecast for 2015 is 5 to 6 MMSCFD 
6”Offtake 20 meters 
16”Burried Mainline near Natural Gas Regulating Station
October 24, 2014 
2 
---- Muhammad Waqas Manzoor ---- Process Engineer ---- Engr.waqasmanzoor@gmail.com ---- 
HYSYS Simulation Results: 
Following are the results of the Dynamic Simulation, 
S. No. 
Pressure at U/S of Regulating Station (psig) 
Pressure at D/S of Regulating Station (psig) 
Max. Flow rate across NPS 6” 12 km long pipeline at D/S of Regulating Station (MMSCFD) 
1. 
397.0 
50 
2.08 
2. 
396.4 
60 
2.46 
3. 
395.2 
80 
3.23 
4. 
394.6 
90 
3.62 
5. 
394.0 
100 
4.01 
It may also be noted that the actual absolute roughness would also be higher than 0.0457 millimeters depending on the aging of pipeline and therefore, the actual maximum flow rate would be less than the values calculated in this simulation. Therefore, the said line would be unable to cater the natural gas demand if it increases beyond 4 MMSCFD in 2015, as per the forecast. 
The application of Dynamic Simulation in this particular case holds significance because Steady State Simulation cannot simulate pressure balancing and therefore, can never imitate actual process in which flow rate depends on pressure differential only. Even the pipe model in Steady State Simulation was unable to calculate natural gas flow rate after the total pressure drop had been specified across the 6” dia. 12 km long pipeline.
October 24, 2014 
3 
---- Muhammad Waqas Manzoor ---- Process Engineer ---- Engr.waqasmanzoor@gmail.com ---- 
Gas Composition 
The average gas composition for last month at the Regulating Station is used in the HYSYS Simulation. 
HYSYS Simulation Snapshots 
All these simulation snapshots were taken after the variables had reached their maximum or minimum values. 
Maximum Flow rate for 50 psig is 2.08 MMSCFD
October 24, 2014 
4 
---- Muhammad Waqas Manzoor ---- Process Engineer ---- Engr.waqasmanzoor@gmail.com ---- 
Maximum Flow rate for 60 psig is 2.46 MMSCFD 
Maximum Flow rate for 80 psig is 3.23 MMSCFD
October 24, 2014 
5 
---- Muhammad Waqas Manzoor ---- Process Engineer ---- Engr.waqasmanzoor@gmail.com ---- 
Maximum Flow rate for 90 psig is 3.62 MMSCFD 
Maximum Flow rate for 100 psig is 4.01 MMSCFD
October 24, 2014 
6 
---- Muhammad Waqas Manzoor ---- Process Engineer ---- Engr.waqasmanzoor@gmail.com ---- 
Steady State Simulation 
The pipe model in Steady State Simulation was unable to calculate natural gas flow rate after the total pressure drop had been specified across the 6” dia. 12 km long pipeline. Total Pressure Drop = 50 psig - 0 psig = 50 psi
October 24, 2014 
7 
---- Muhammad Waqas Manzoor ---- Process Engineer ---- Engr.waqasmanzoor@gmail.com ---- 
Flow rate calculation using Different Pressure Drop Correlations 
Below is the comparison between flow rate calculated using different pressure drop correlations in the Dynamic Simulation of only the 6” pipe,
October 24, 2014 
8 
---- Muhammad Waqas Manzoor ---- Process Engineer ---- Engr.waqasmanzoor@gmail.com ---- 
Impact of No. of Pipe Segments on the flow rate calculated by Pipe Model 
Flow rate calculation using 01 pipe segment in pipe model of 6” dia. 12 km long pipeline 
Flow rate calculation using 02 pipe segments in pipe model 6” dia. 12 km long pipeline
October 24, 2014 
9 
---- Muhammad Waqas Manzoor ---- Process Engineer ---- Engr.waqasmanzoor@gmail.com ---- 
Flow rate calculation using 03 pipe segments in pipe model 6” dia. 12 km long pipeline 
Flow rate calculation using 04 pipe segments in pipe model 6” dia. 12 km long pipeline
October 24, 2014 
10 
---- Muhammad Waqas Manzoor ---- Process Engineer ---- Engr.waqasmanzoor@gmail.com ---- 
Flow rate calculation using 06 pipe segments in pipe model 6” dia. 12 km long pipeline 
Flow rate calculation using 10 pipe segments in pipe model 6” dia. 12 km long pipeline
October 24, 2014 
11 
---- Muhammad Waqas Manzoor ---- Process Engineer ---- Engr.waqasmanzoor@gmail.com ---- 
Flow rate calculation using 12 pipe segments in pipe model 6” dia. 12 km long pipeline
October 24, 2014 
12 
---- Muhammad Waqas Manzoor ---- Process Engineer ---- Engr.waqasmanzoor@gmail.com ----
October 24, 2014 
13 
---- Muhammad Waqas Manzoor ---- Process Engineer ---- Engr.waqasmanzoor@gmail.com ----

Impact of No. of Pipe Segments on the flow rate calculated by Pipe Model

  • 1.
    October 24, 2014 1 ---- Muhammad Waqas Manzoor ---- Process Engineer ---- Engr.waqasmanzoor@gmail.com ---- Calculation of Maximum Flow of Natural Gas through a Pipeline using Dynamic Simulation in Aspen HYSYS Muhammad Waqas Manzoor Process Engineer Email: engr.waqasmanzoor@gmail.com Synopsis: A dynamic simulation in Aspen HYSYS was performed to assess the maximum gas carrying capacity of a NPS 6” SCH 80 pipeline having length of 12 km. At upstream end, the pipeline is connected with a Natural Gas Regulating Station and at downstream end the pipeline is connected with domestic consumer pipeline network. The pressure required by domestic consumer is very less compared with the pipeline pressure i.e. about 4 inches WC = 0.144 psig. Therefore, to calculate the maximum flow (or choke flow) through the pipeline, 0 psig has been considered at downstream of the NPS 6” SCH 80 12 km long pipeline. The pipeline absolute roughness for calculation of frictional pressure drop has been considered to be equal to 0.04572 millimeters, which is the same as of carbon steel pipes. Background Information: The Natural Gas Regulating Station can supply gas at a pressure of 40 psig to 100 psig, using a pressure control valve, as per the seasonal consumer demand. During winter season the pressure may be increased to 100 psig and during summer season the pressure may be reduced to 50 psig because gas consumption during winter season is higher as compared to that in summer season, and only by increasing the gas pressure at the downstream of the Natural Gas Regulating Station, the gas flow rate can be increased. The pressure at the upstream of the Natural Gas Regulating Station is about 395 psig. However, it depends on pressure setting at downstream of Natural Gas Regulating Station. Higher the downstream pressure, higher would be gas flow rate and lower would be the upstream pressure. Natural Gas Regulating Station Inlet Pressure = 400 to 500 psig Outlet Pressure = 50 to 100 psig 6”Pipeline 12km Domestic Consumer Network Required 2 to 3 MMSCFD in 2014 Forecast for 2015 is 5 to 6 MMSCFD 6”Offtake 20 meters 16”Burried Mainline near Natural Gas Regulating Station
  • 2.
    October 24, 2014 2 ---- Muhammad Waqas Manzoor ---- Process Engineer ---- Engr.waqasmanzoor@gmail.com ---- HYSYS Simulation Results: Following are the results of the Dynamic Simulation, S. No. Pressure at U/S of Regulating Station (psig) Pressure at D/S of Regulating Station (psig) Max. Flow rate across NPS 6” 12 km long pipeline at D/S of Regulating Station (MMSCFD) 1. 397.0 50 2.08 2. 396.4 60 2.46 3. 395.2 80 3.23 4. 394.6 90 3.62 5. 394.0 100 4.01 It may also be noted that the actual absolute roughness would also be higher than 0.0457 millimeters depending on the aging of pipeline and therefore, the actual maximum flow rate would be less than the values calculated in this simulation. Therefore, the said line would be unable to cater the natural gas demand if it increases beyond 4 MMSCFD in 2015, as per the forecast. The application of Dynamic Simulation in this particular case holds significance because Steady State Simulation cannot simulate pressure balancing and therefore, can never imitate actual process in which flow rate depends on pressure differential only. Even the pipe model in Steady State Simulation was unable to calculate natural gas flow rate after the total pressure drop had been specified across the 6” dia. 12 km long pipeline.
  • 3.
    October 24, 2014 3 ---- Muhammad Waqas Manzoor ---- Process Engineer ---- Engr.waqasmanzoor@gmail.com ---- Gas Composition The average gas composition for last month at the Regulating Station is used in the HYSYS Simulation. HYSYS Simulation Snapshots All these simulation snapshots were taken after the variables had reached their maximum or minimum values. Maximum Flow rate for 50 psig is 2.08 MMSCFD
  • 4.
    October 24, 2014 4 ---- Muhammad Waqas Manzoor ---- Process Engineer ---- Engr.waqasmanzoor@gmail.com ---- Maximum Flow rate for 60 psig is 2.46 MMSCFD Maximum Flow rate for 80 psig is 3.23 MMSCFD
  • 5.
    October 24, 2014 5 ---- Muhammad Waqas Manzoor ---- Process Engineer ---- Engr.waqasmanzoor@gmail.com ---- Maximum Flow rate for 90 psig is 3.62 MMSCFD Maximum Flow rate for 100 psig is 4.01 MMSCFD
  • 6.
    October 24, 2014 6 ---- Muhammad Waqas Manzoor ---- Process Engineer ---- Engr.waqasmanzoor@gmail.com ---- Steady State Simulation The pipe model in Steady State Simulation was unable to calculate natural gas flow rate after the total pressure drop had been specified across the 6” dia. 12 km long pipeline. Total Pressure Drop = 50 psig - 0 psig = 50 psi
  • 7.
    October 24, 2014 7 ---- Muhammad Waqas Manzoor ---- Process Engineer ---- Engr.waqasmanzoor@gmail.com ---- Flow rate calculation using Different Pressure Drop Correlations Below is the comparison between flow rate calculated using different pressure drop correlations in the Dynamic Simulation of only the 6” pipe,
  • 8.
    October 24, 2014 8 ---- Muhammad Waqas Manzoor ---- Process Engineer ---- Engr.waqasmanzoor@gmail.com ---- Impact of No. of Pipe Segments on the flow rate calculated by Pipe Model Flow rate calculation using 01 pipe segment in pipe model of 6” dia. 12 km long pipeline Flow rate calculation using 02 pipe segments in pipe model 6” dia. 12 km long pipeline
  • 9.
    October 24, 2014 9 ---- Muhammad Waqas Manzoor ---- Process Engineer ---- Engr.waqasmanzoor@gmail.com ---- Flow rate calculation using 03 pipe segments in pipe model 6” dia. 12 km long pipeline Flow rate calculation using 04 pipe segments in pipe model 6” dia. 12 km long pipeline
  • 10.
    October 24, 2014 10 ---- Muhammad Waqas Manzoor ---- Process Engineer ---- Engr.waqasmanzoor@gmail.com ---- Flow rate calculation using 06 pipe segments in pipe model 6” dia. 12 km long pipeline Flow rate calculation using 10 pipe segments in pipe model 6” dia. 12 km long pipeline
  • 11.
    October 24, 2014 11 ---- Muhammad Waqas Manzoor ---- Process Engineer ---- Engr.waqasmanzoor@gmail.com ---- Flow rate calculation using 12 pipe segments in pipe model 6” dia. 12 km long pipeline
  • 12.
    October 24, 2014 12 ---- Muhammad Waqas Manzoor ---- Process Engineer ---- Engr.waqasmanzoor@gmail.com ----
  • 13.
    October 24, 2014 13 ---- Muhammad Waqas Manzoor ---- Process Engineer ---- Engr.waqasmanzoor@gmail.com ----