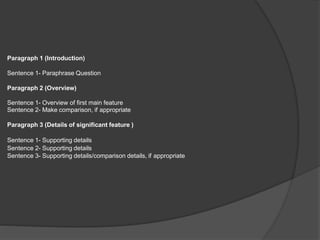
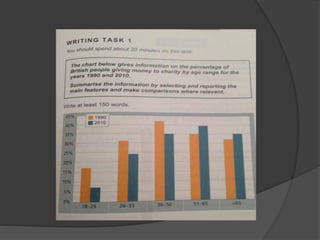
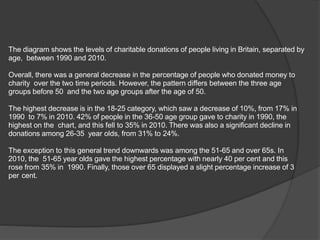
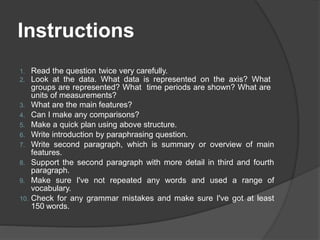
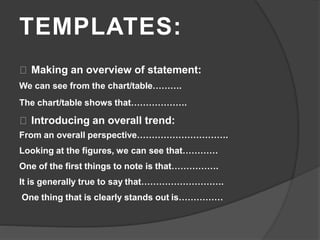
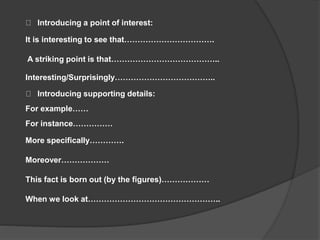
The document provides guidance on writing a report based on a graph or diagram for IELTS Task 1. It emphasizes considering varying vocabulary, grammatical structures, organizing information coherently, focusing on both details and the overall picture, and finding suitable comparisons. The ideal time to spend is 20 minutes. Key points include interpreting data, paraphrasing, choosing relevant details, and providing an overall statement in addition to paragraph details. Templates are given for introducing trends, comparisons, and supporting details. Guidance is also provided on focusing details for different types of charts, tables, diagrams, processes, and maps.