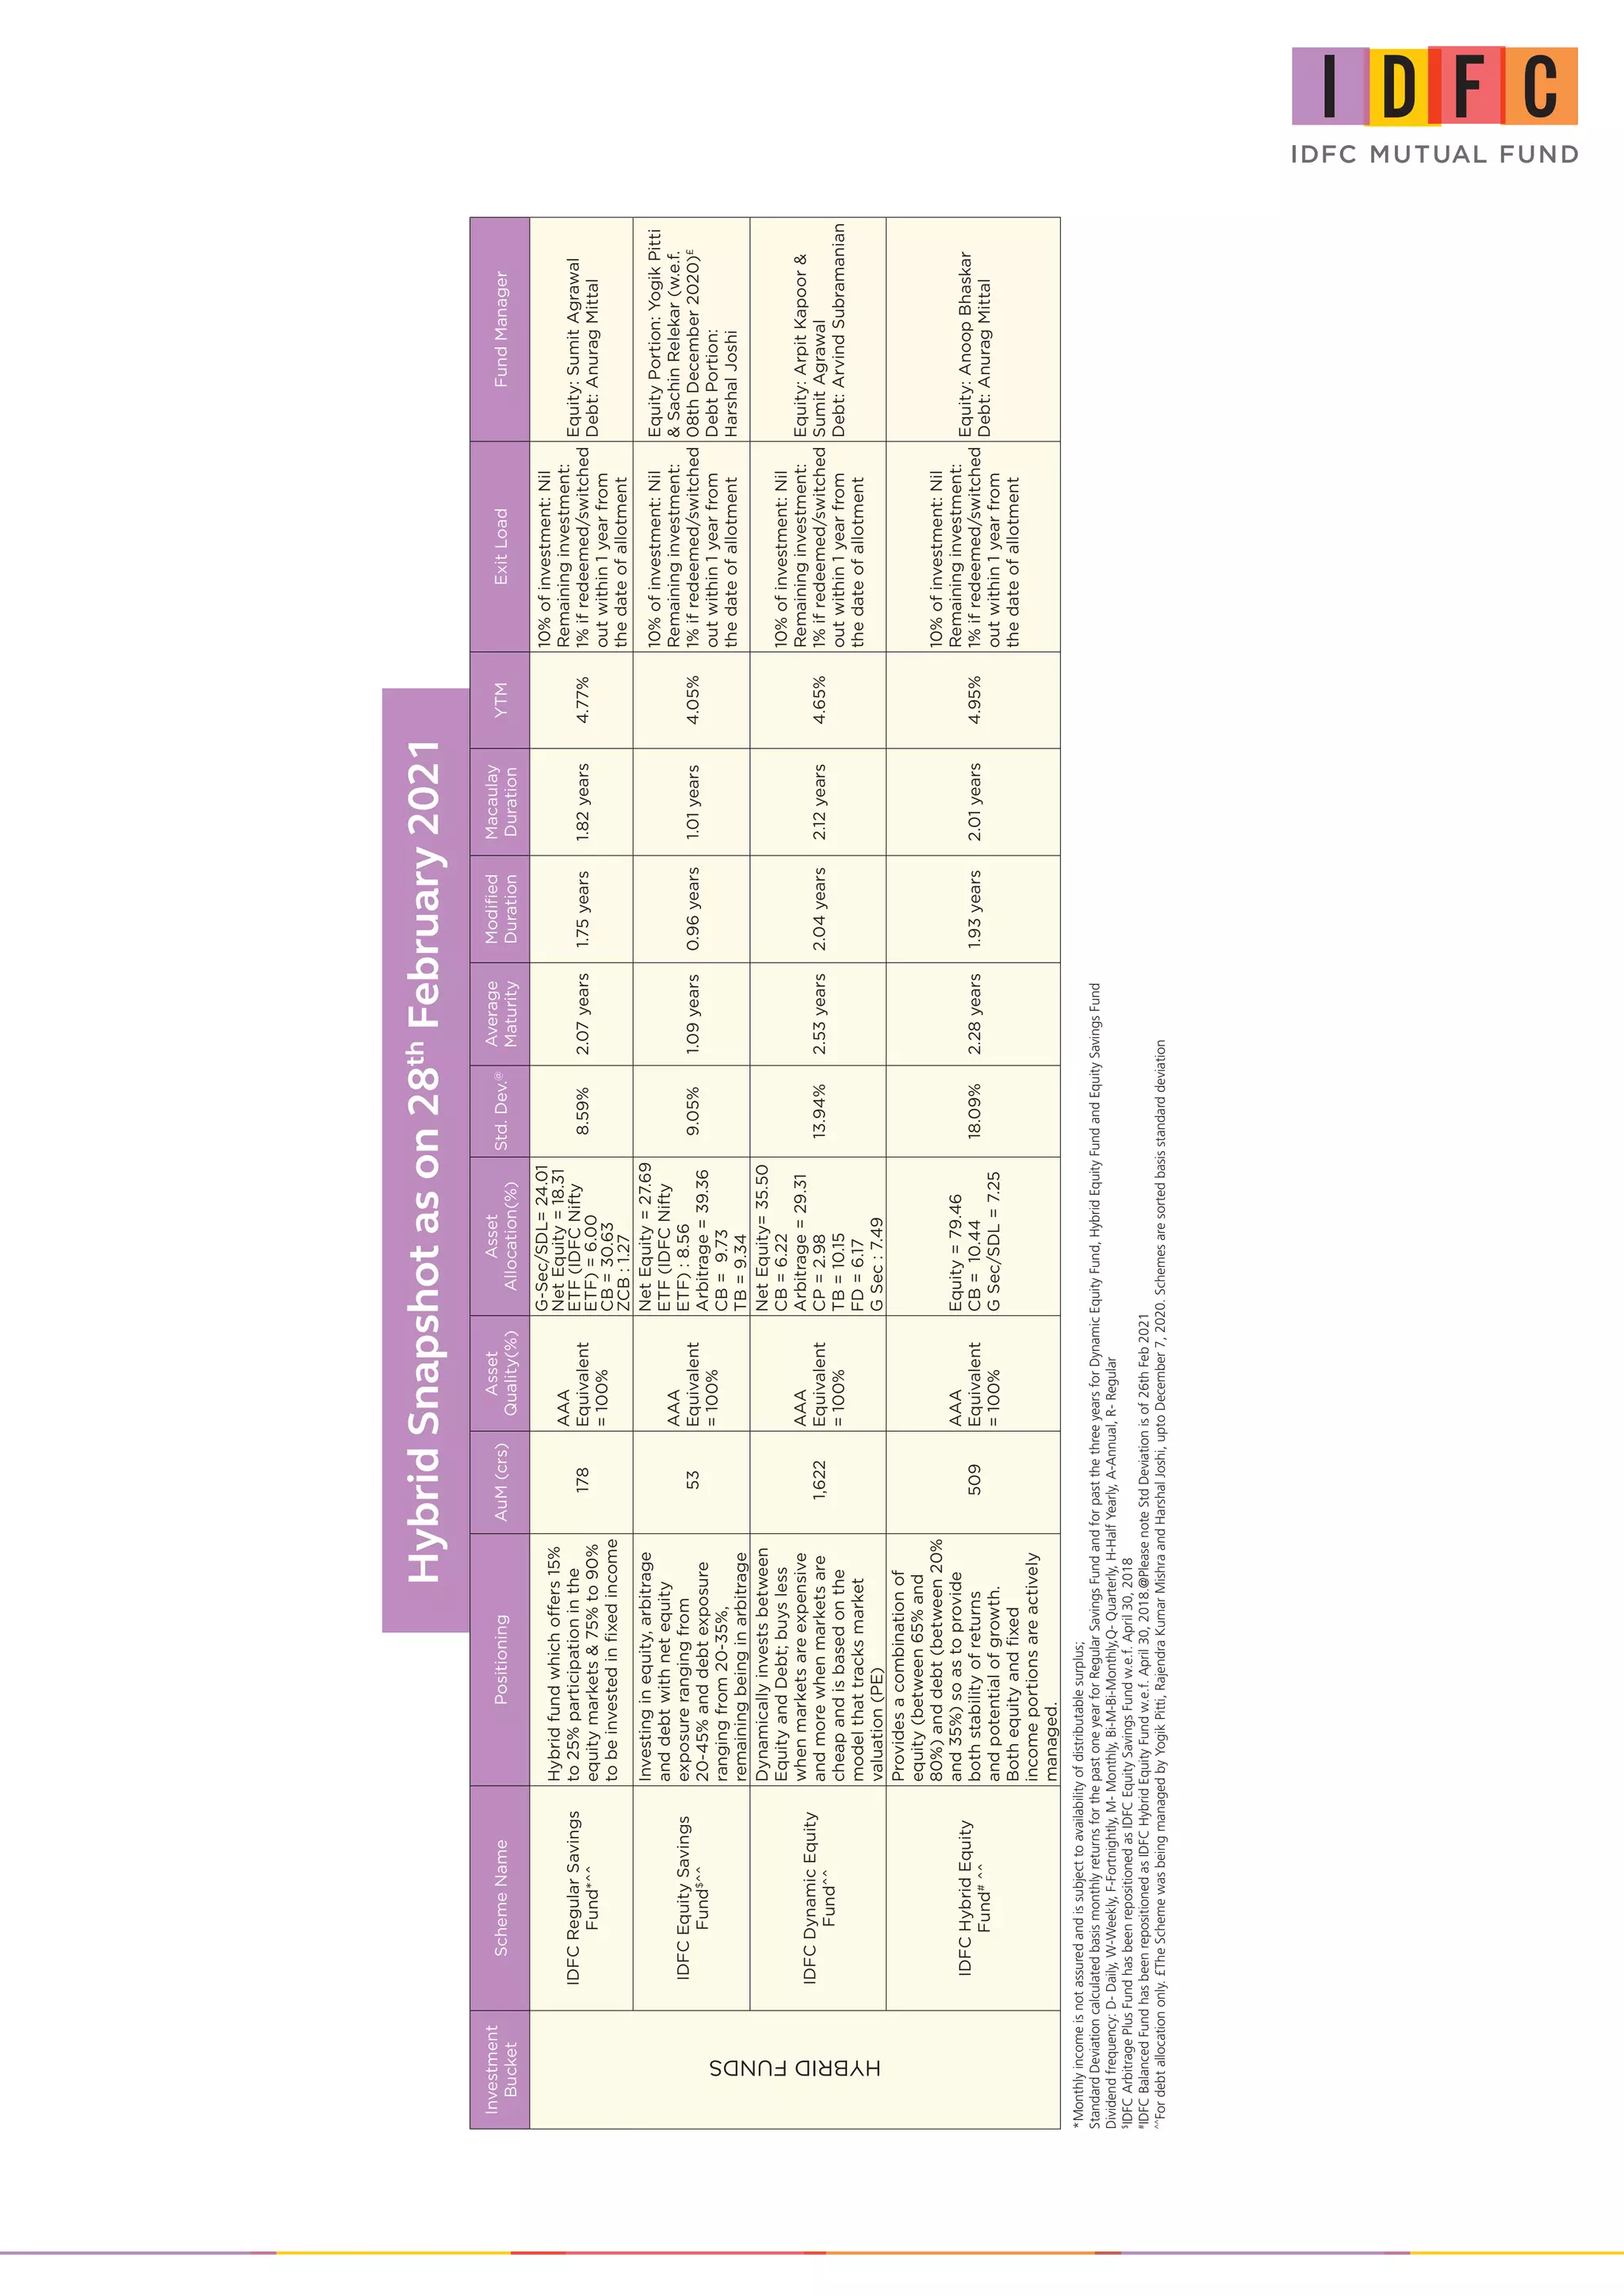
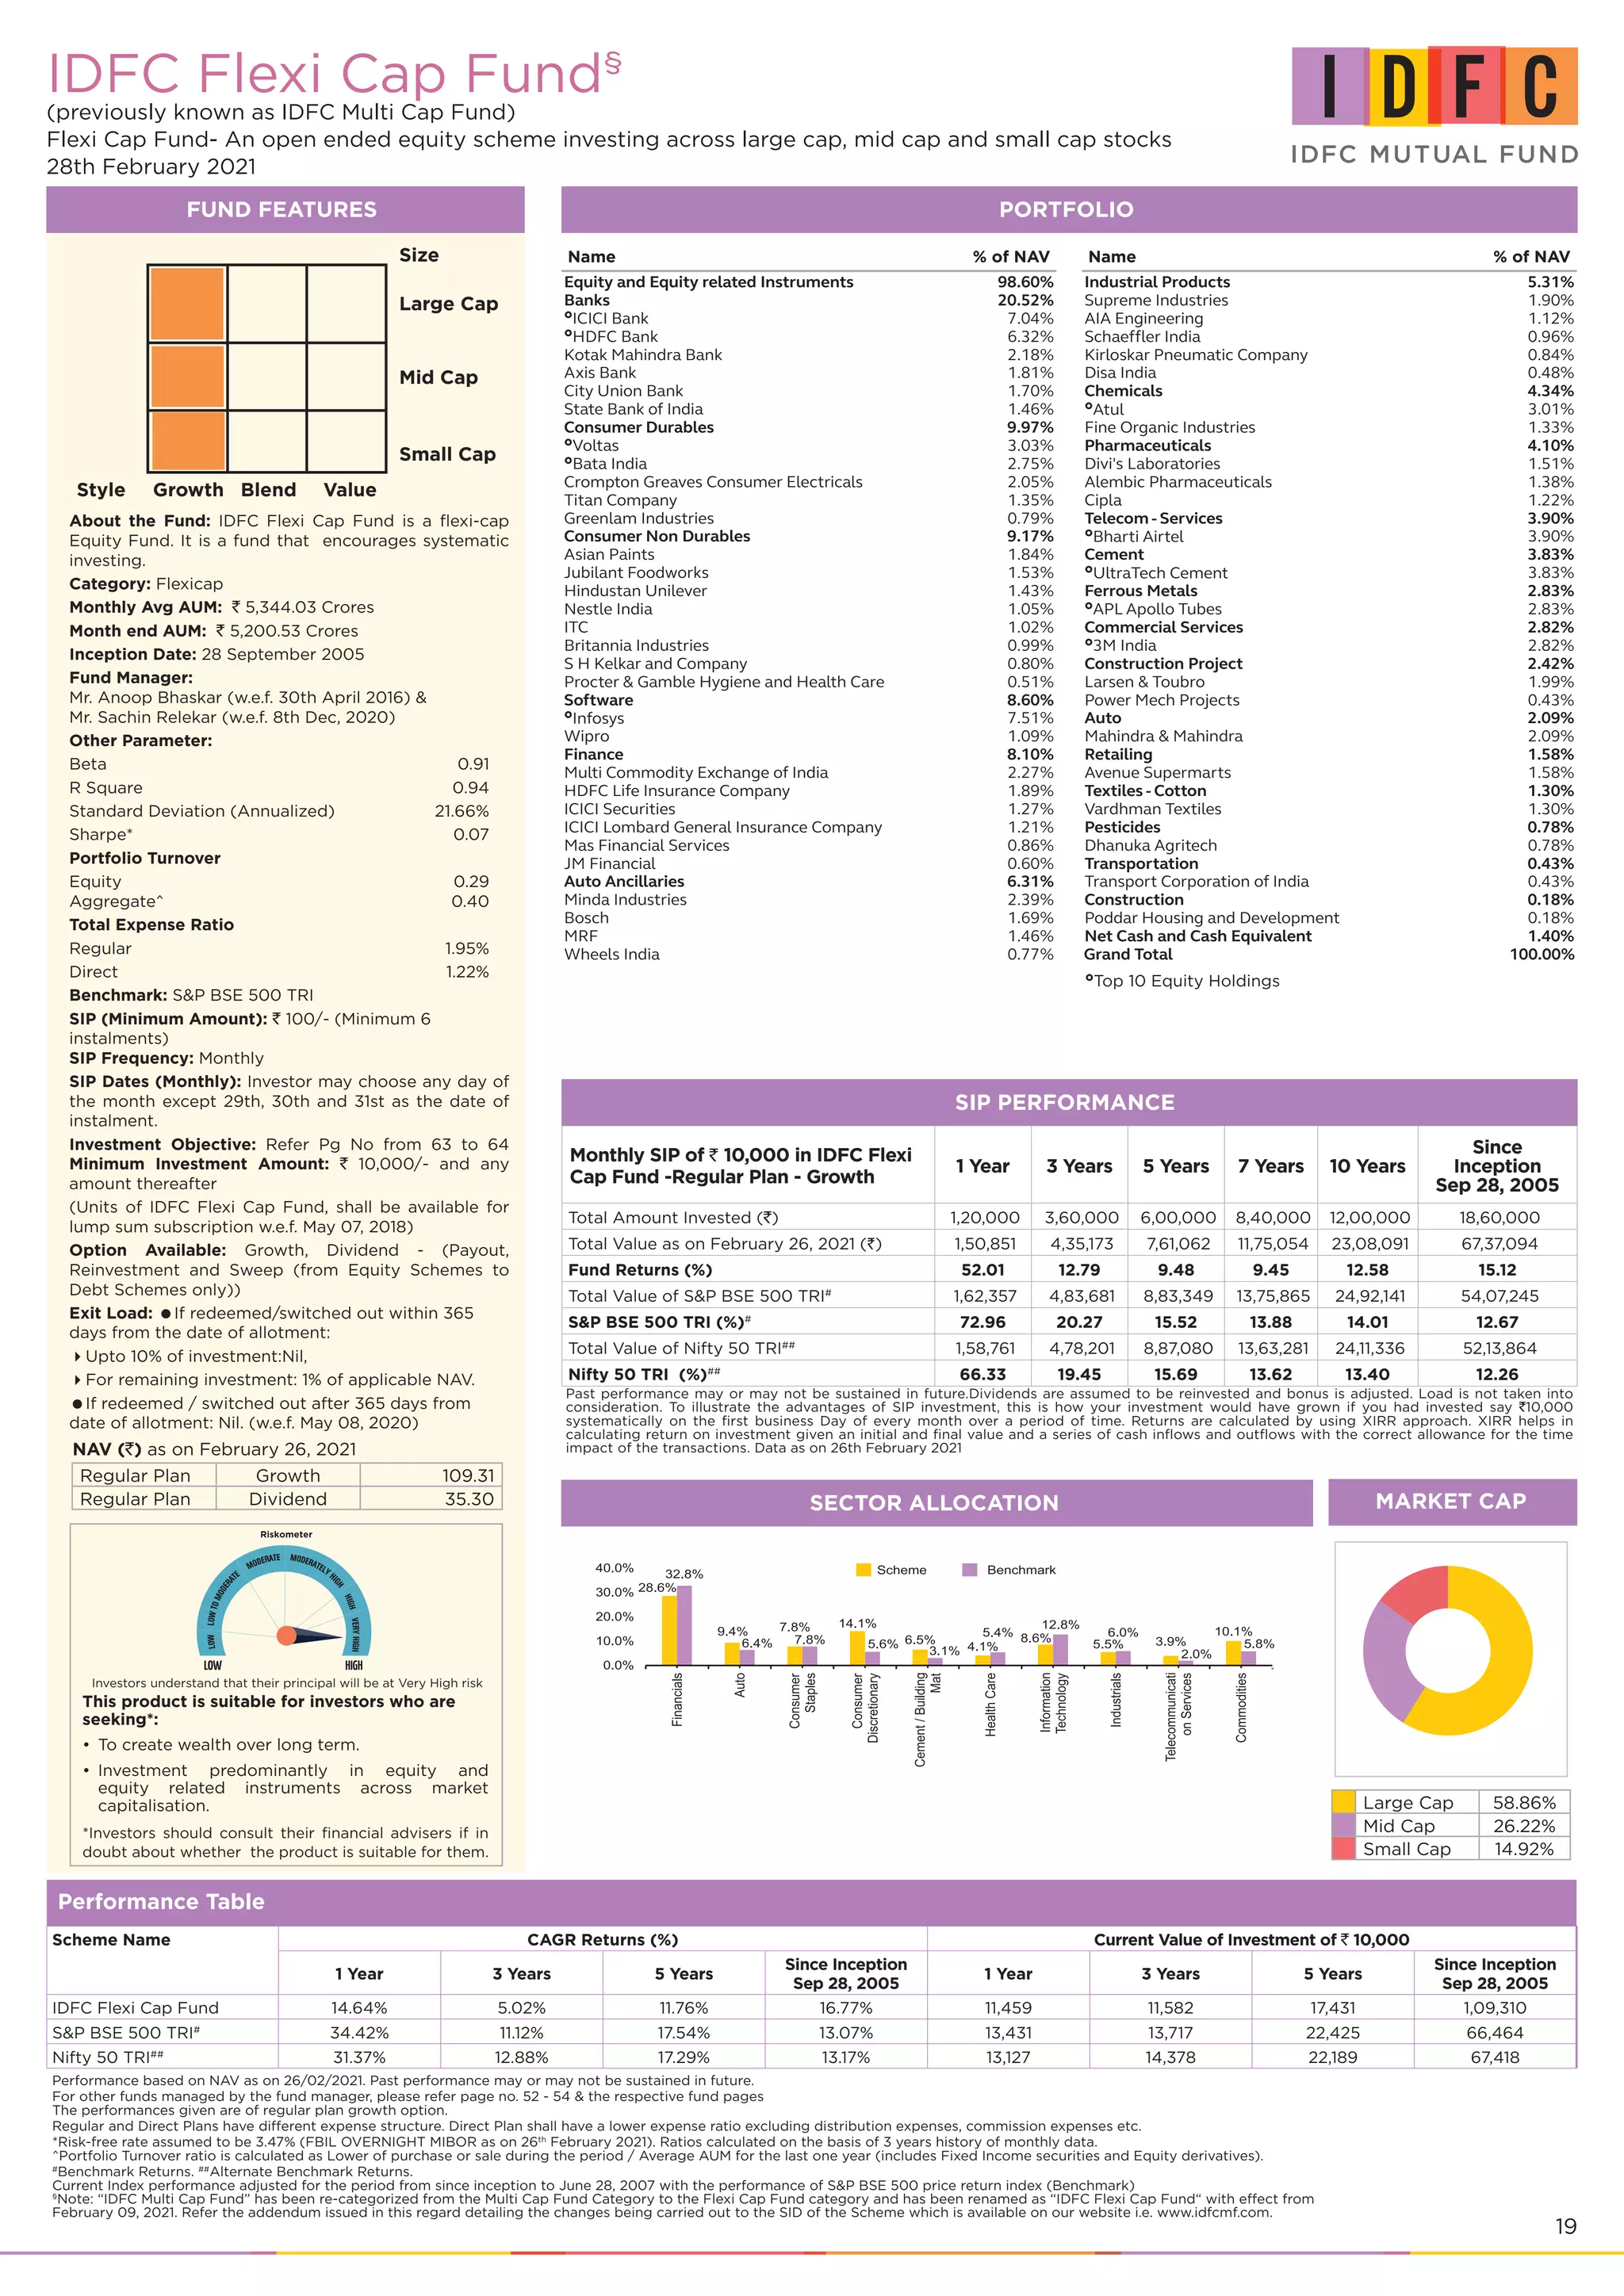
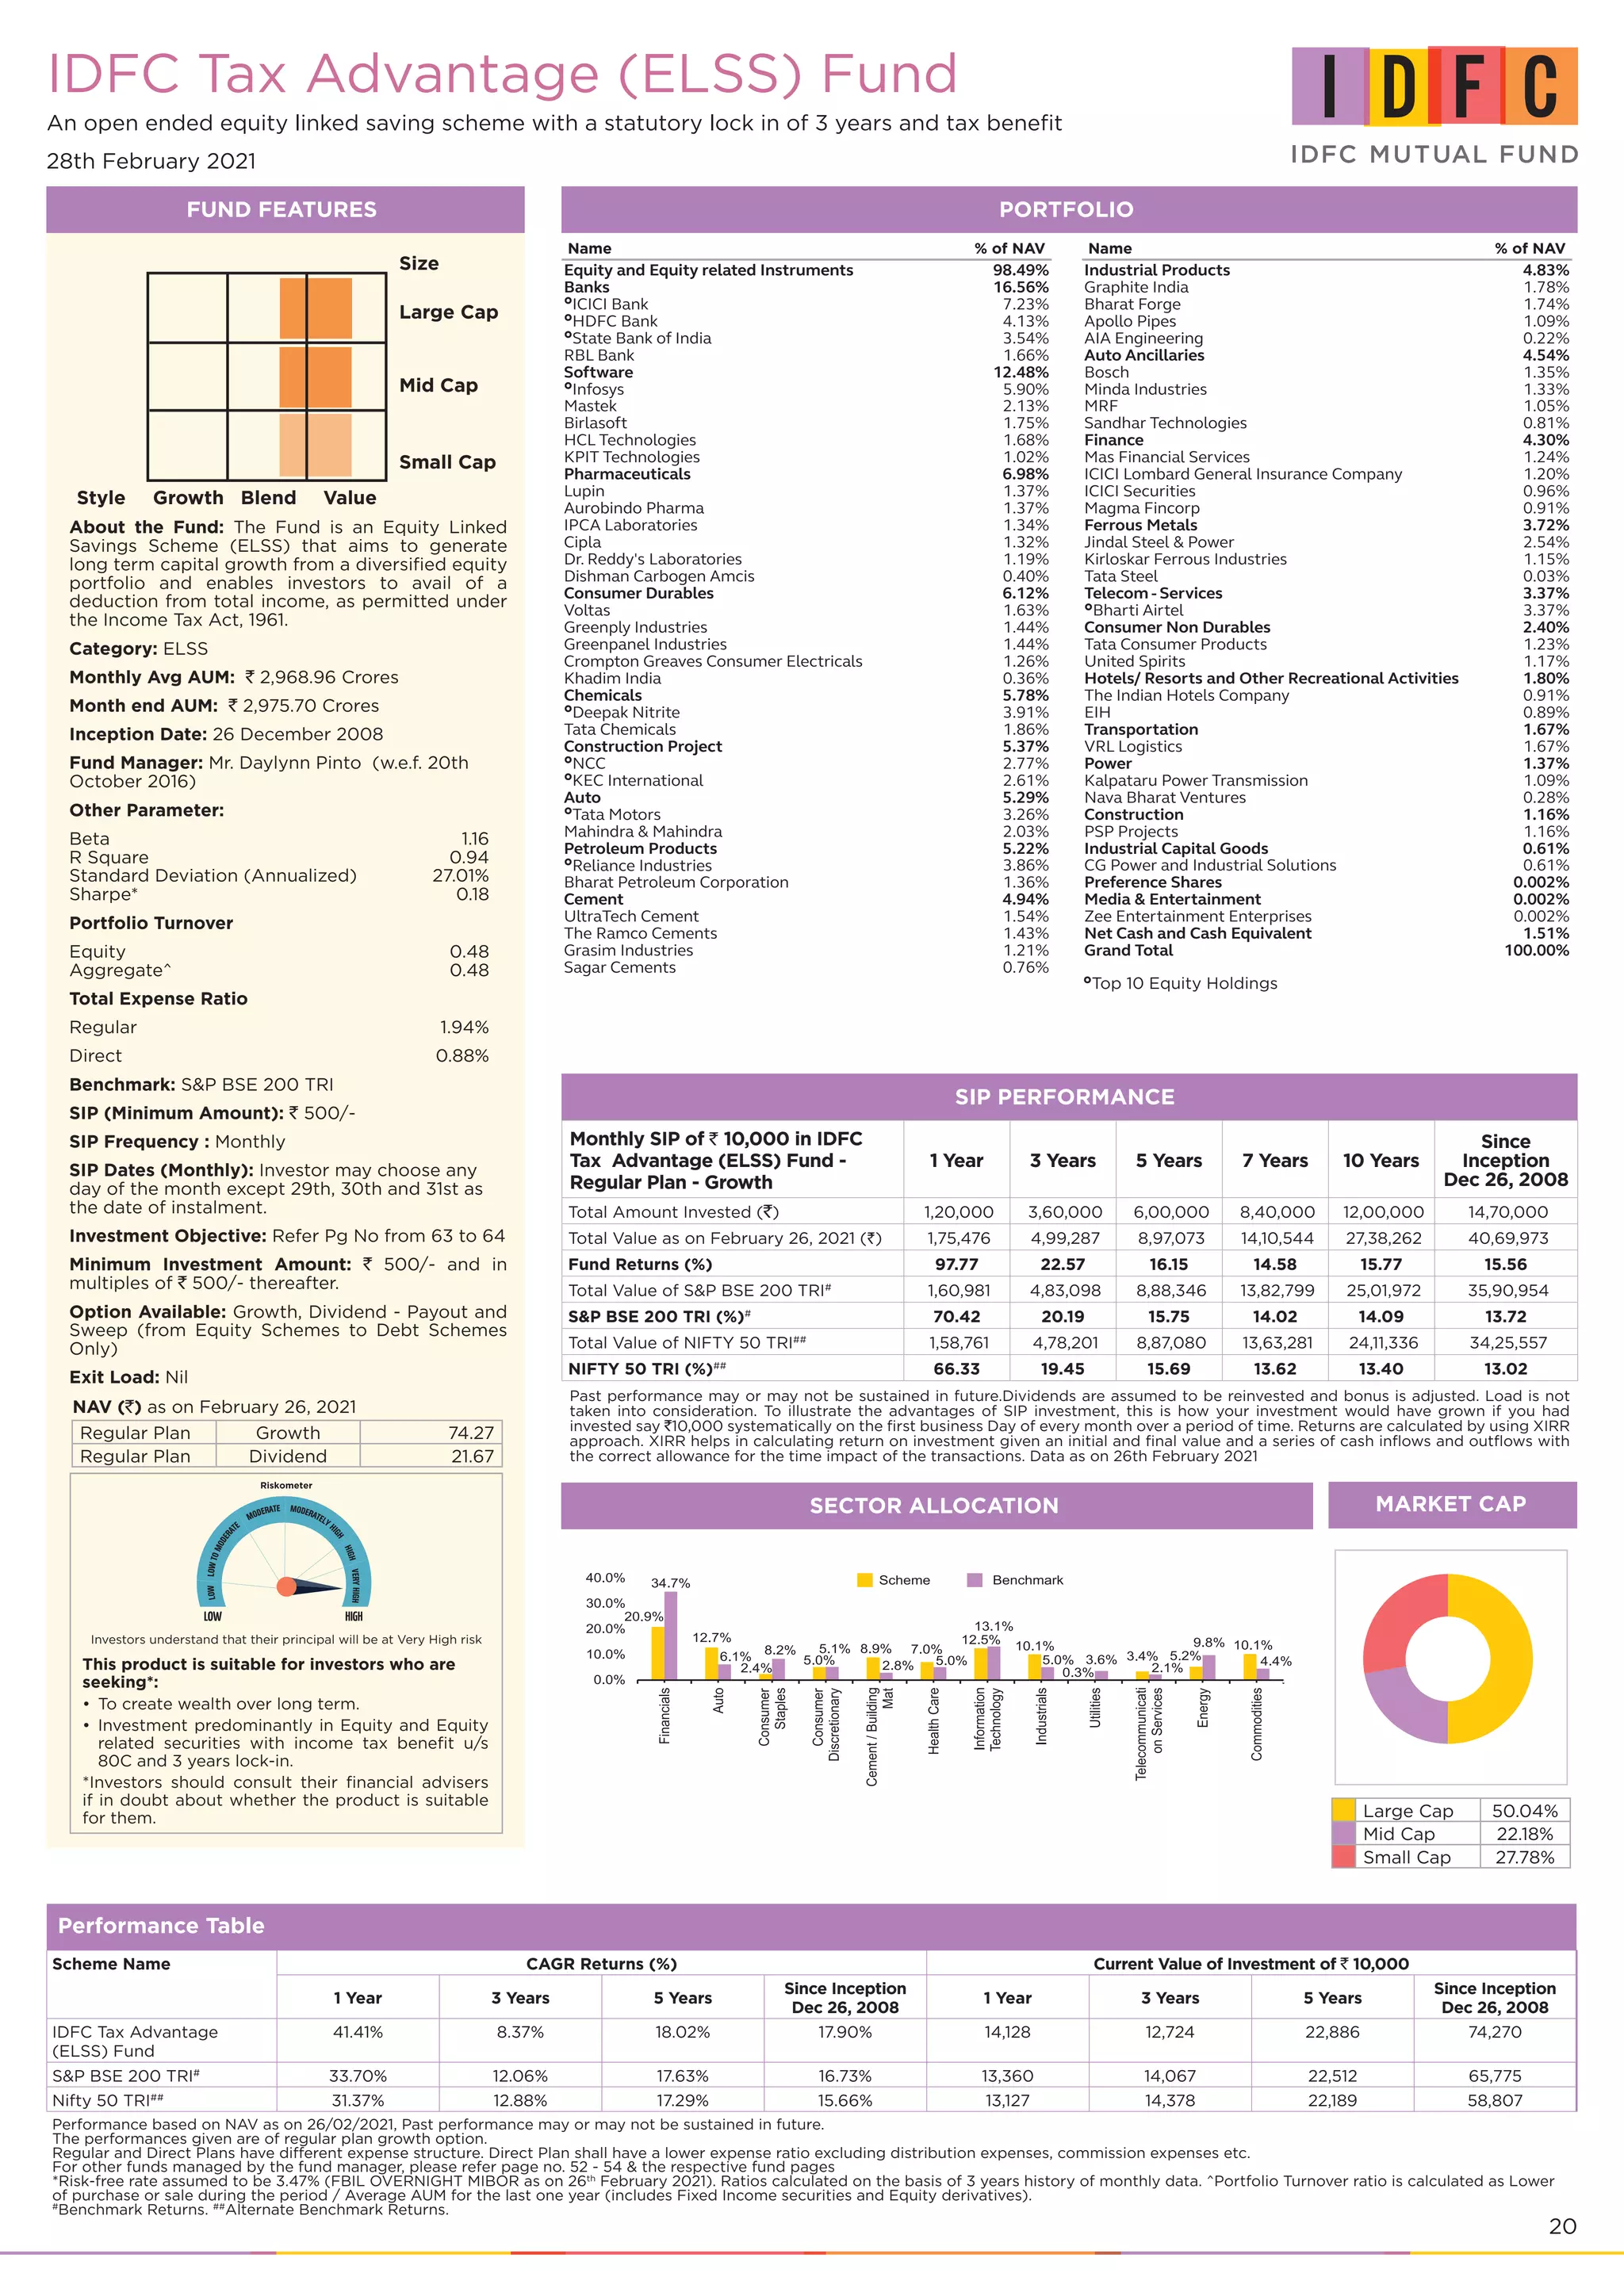
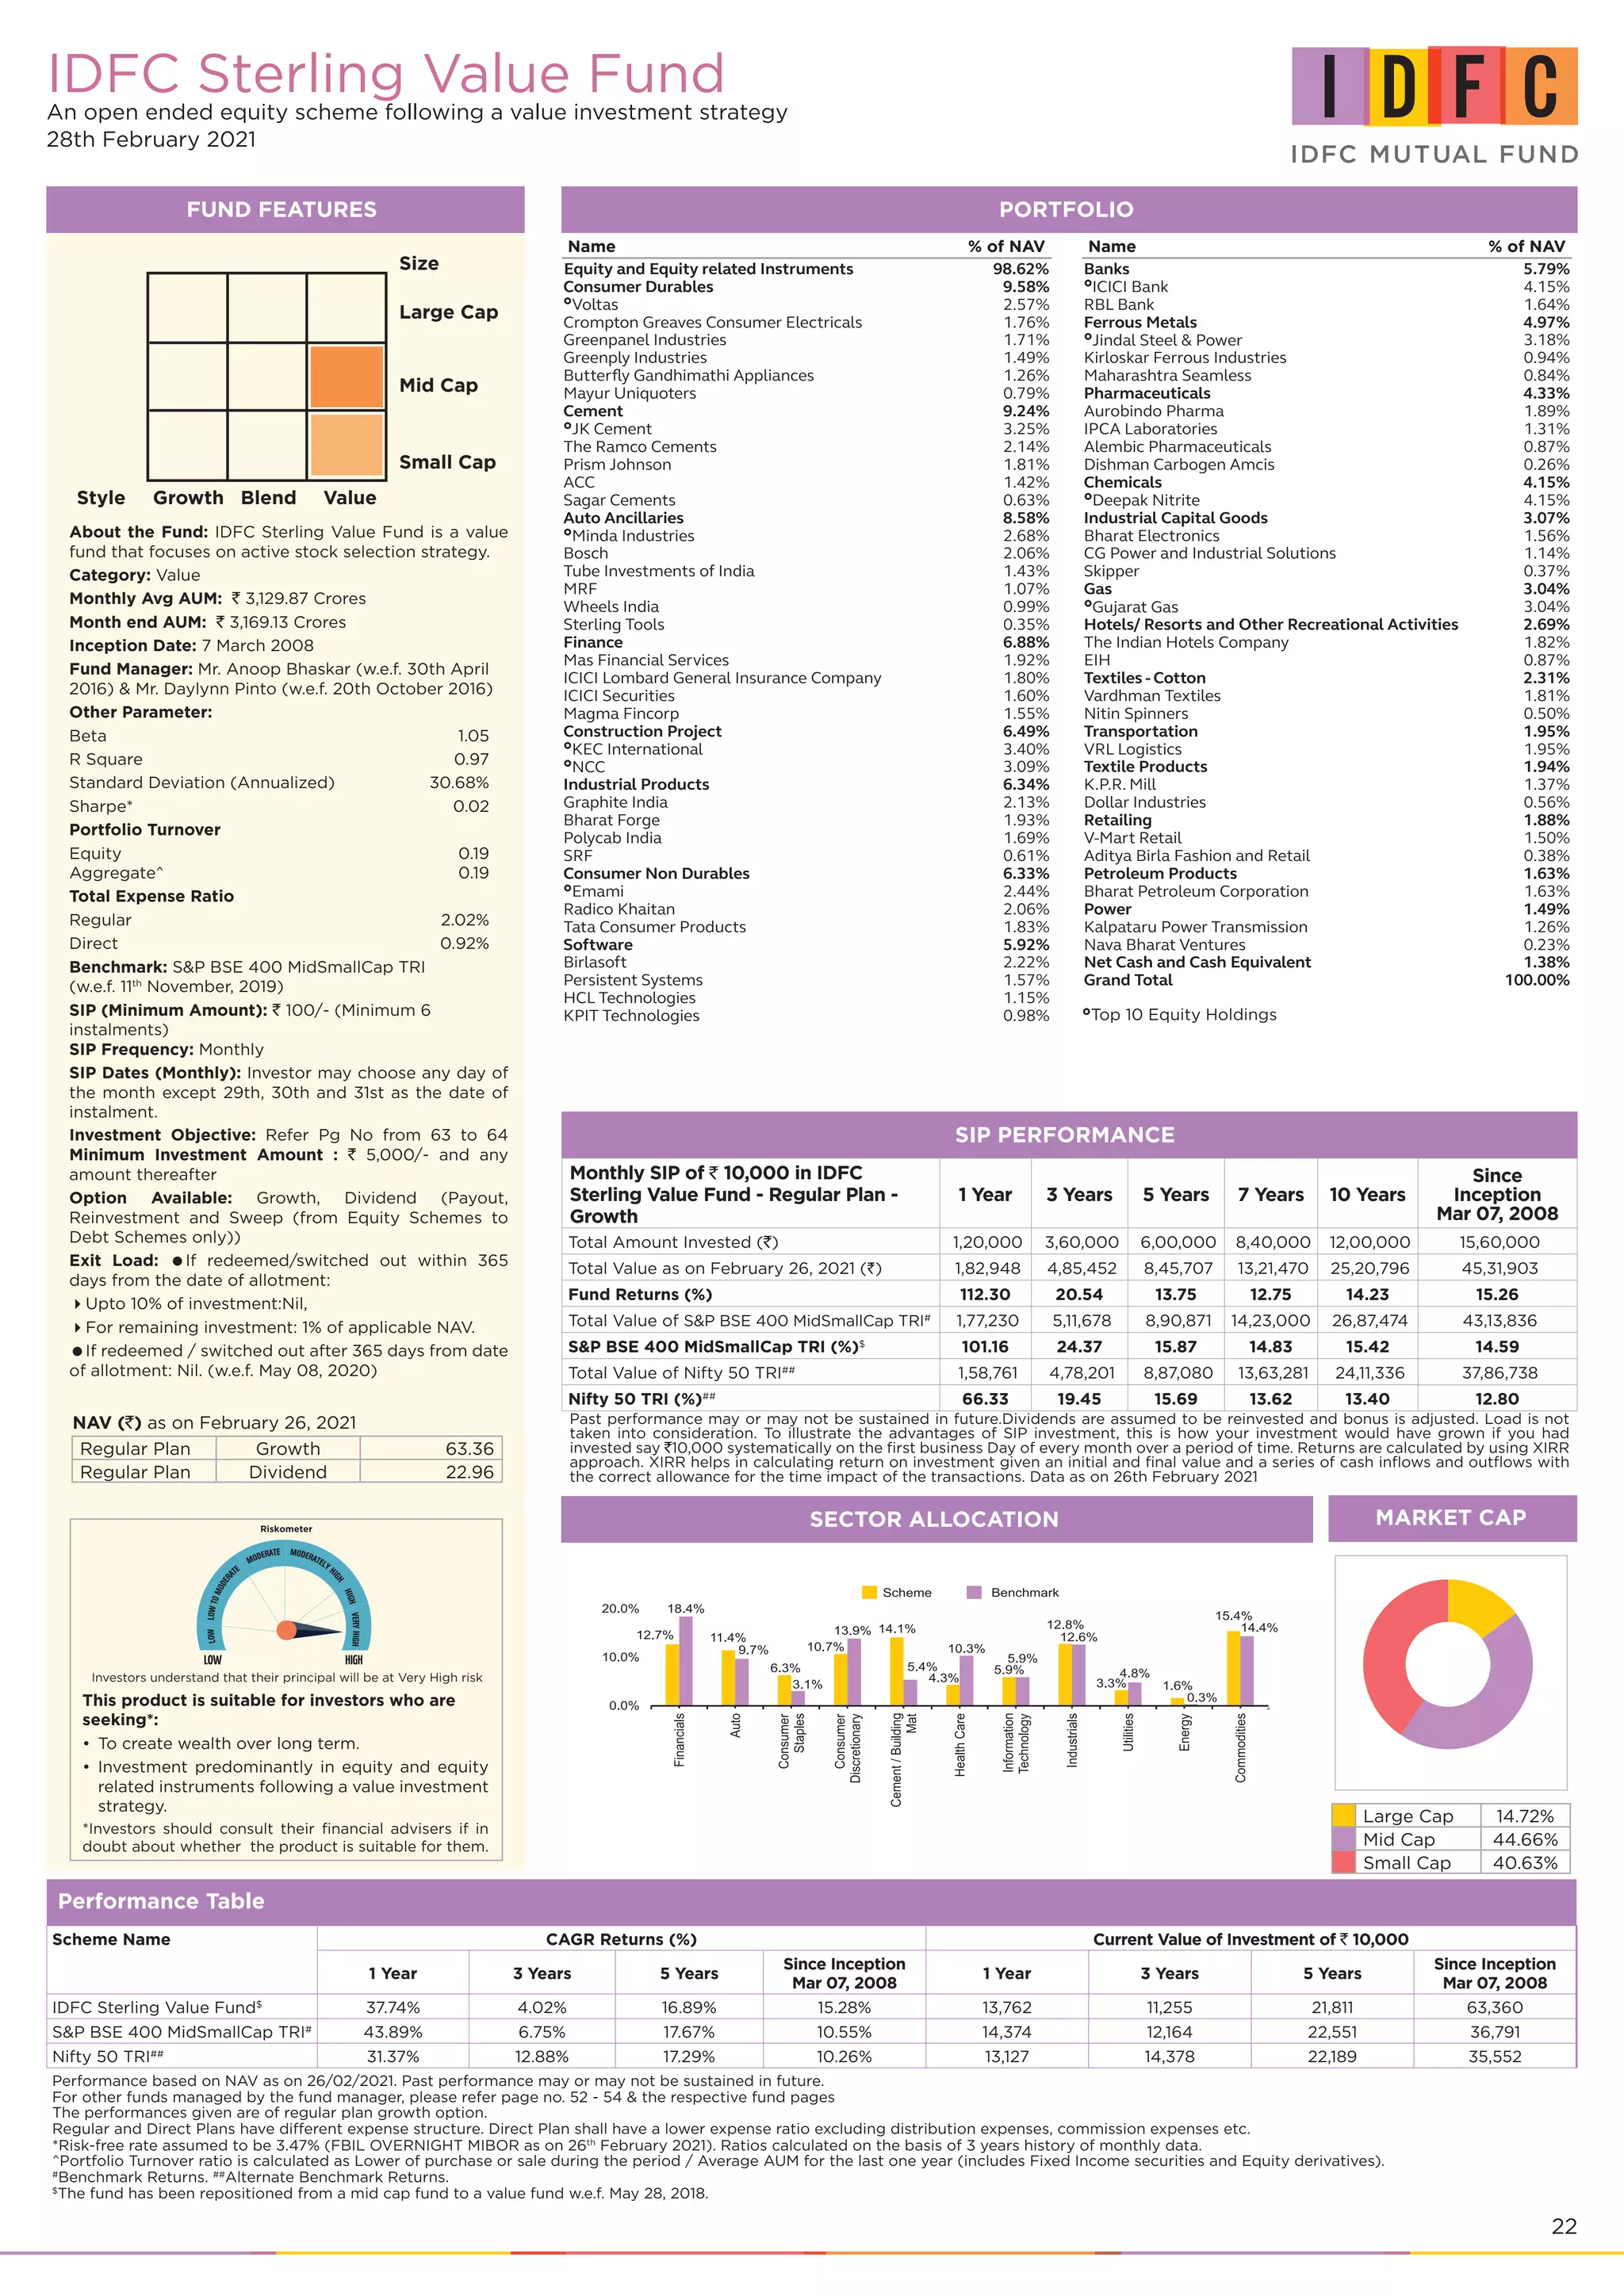
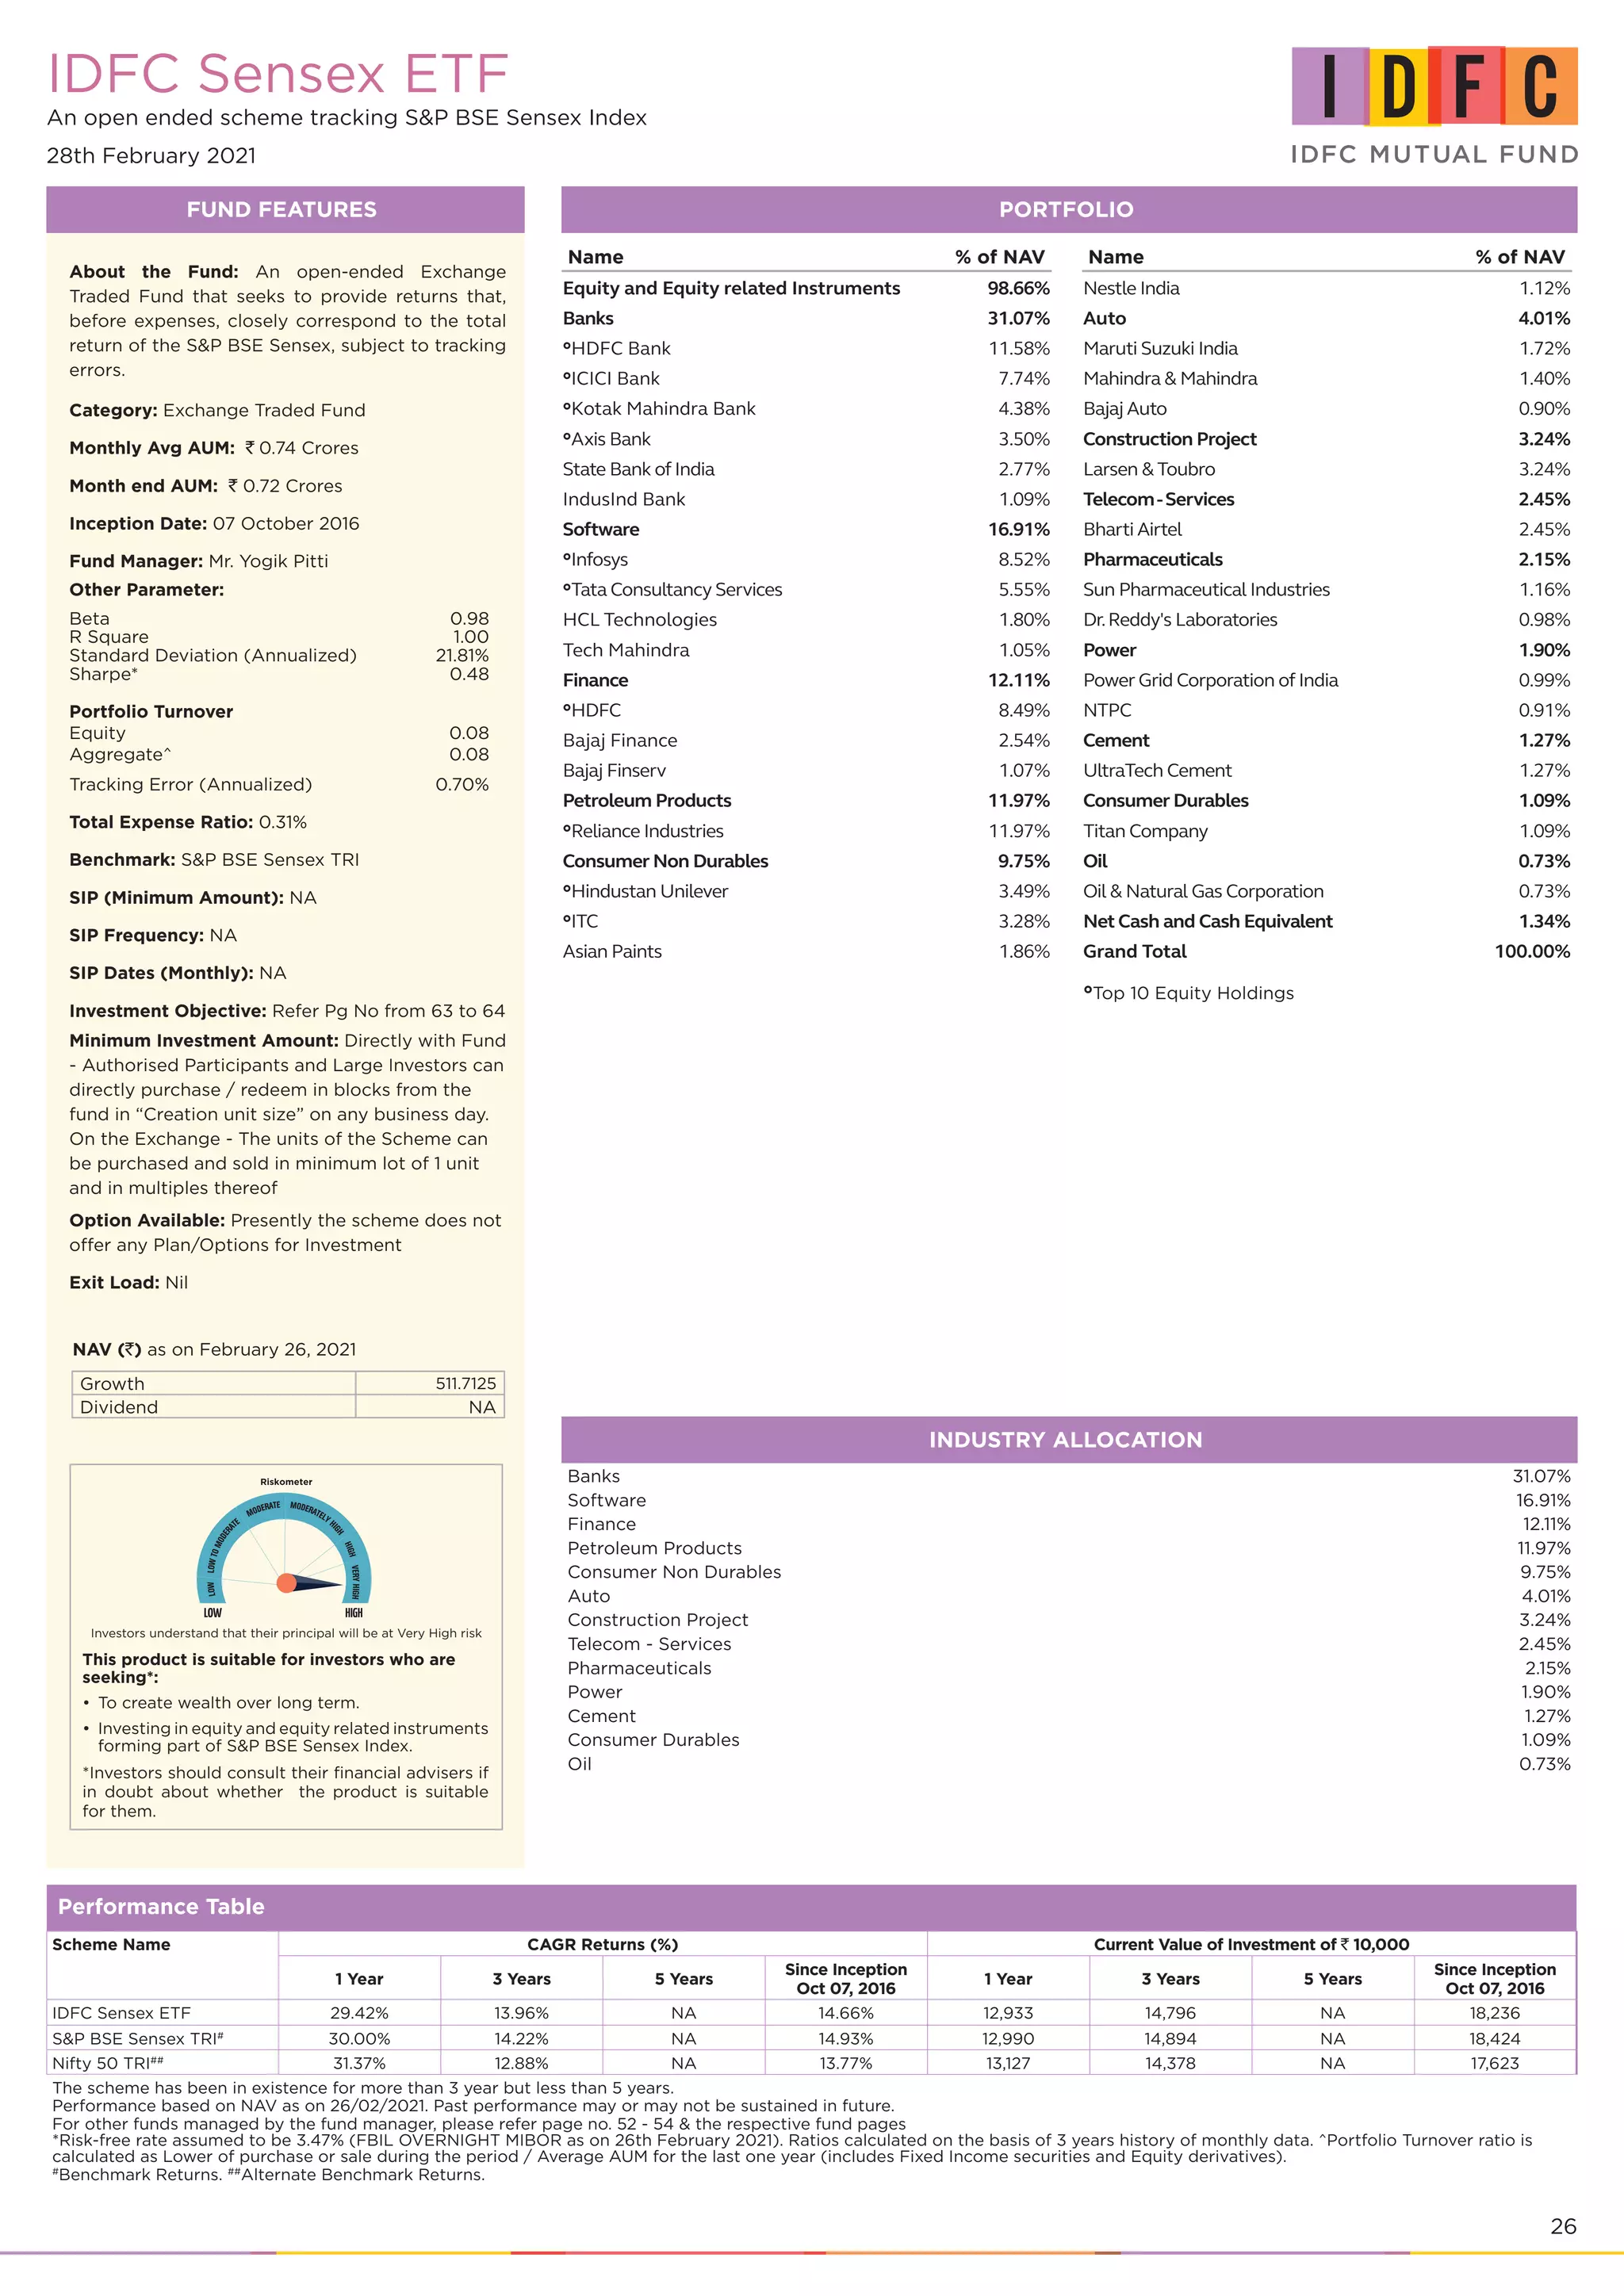
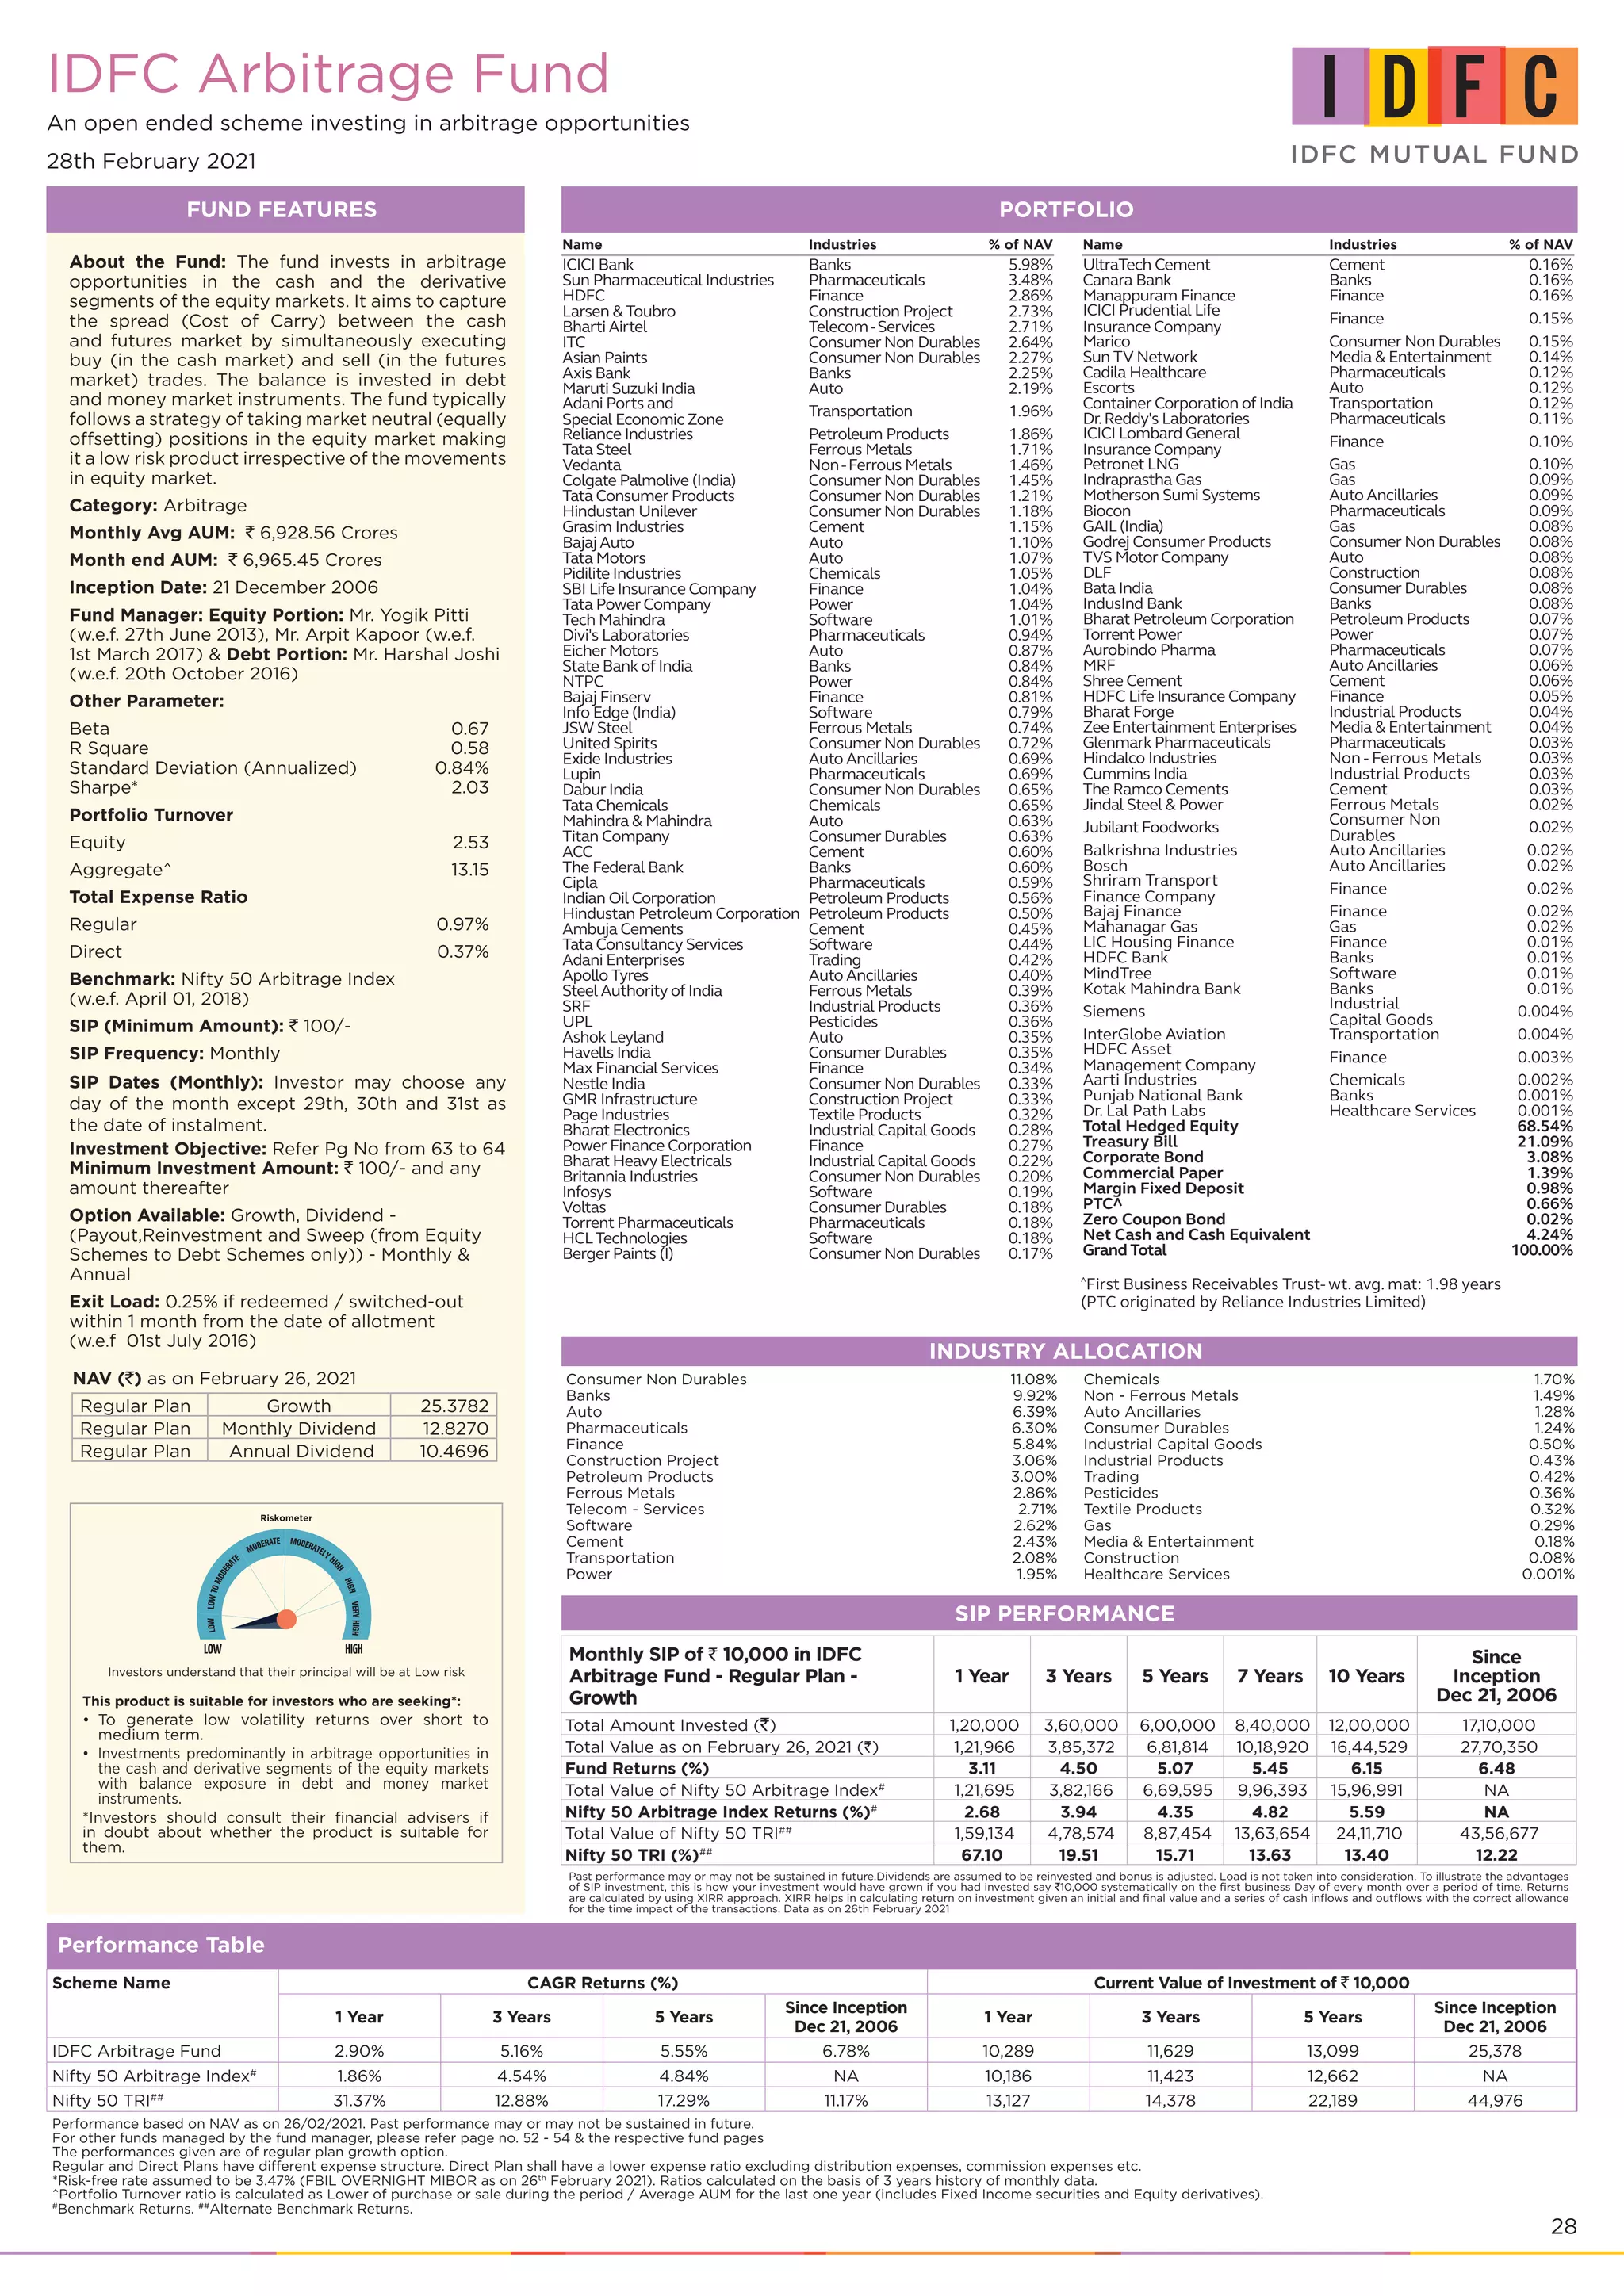
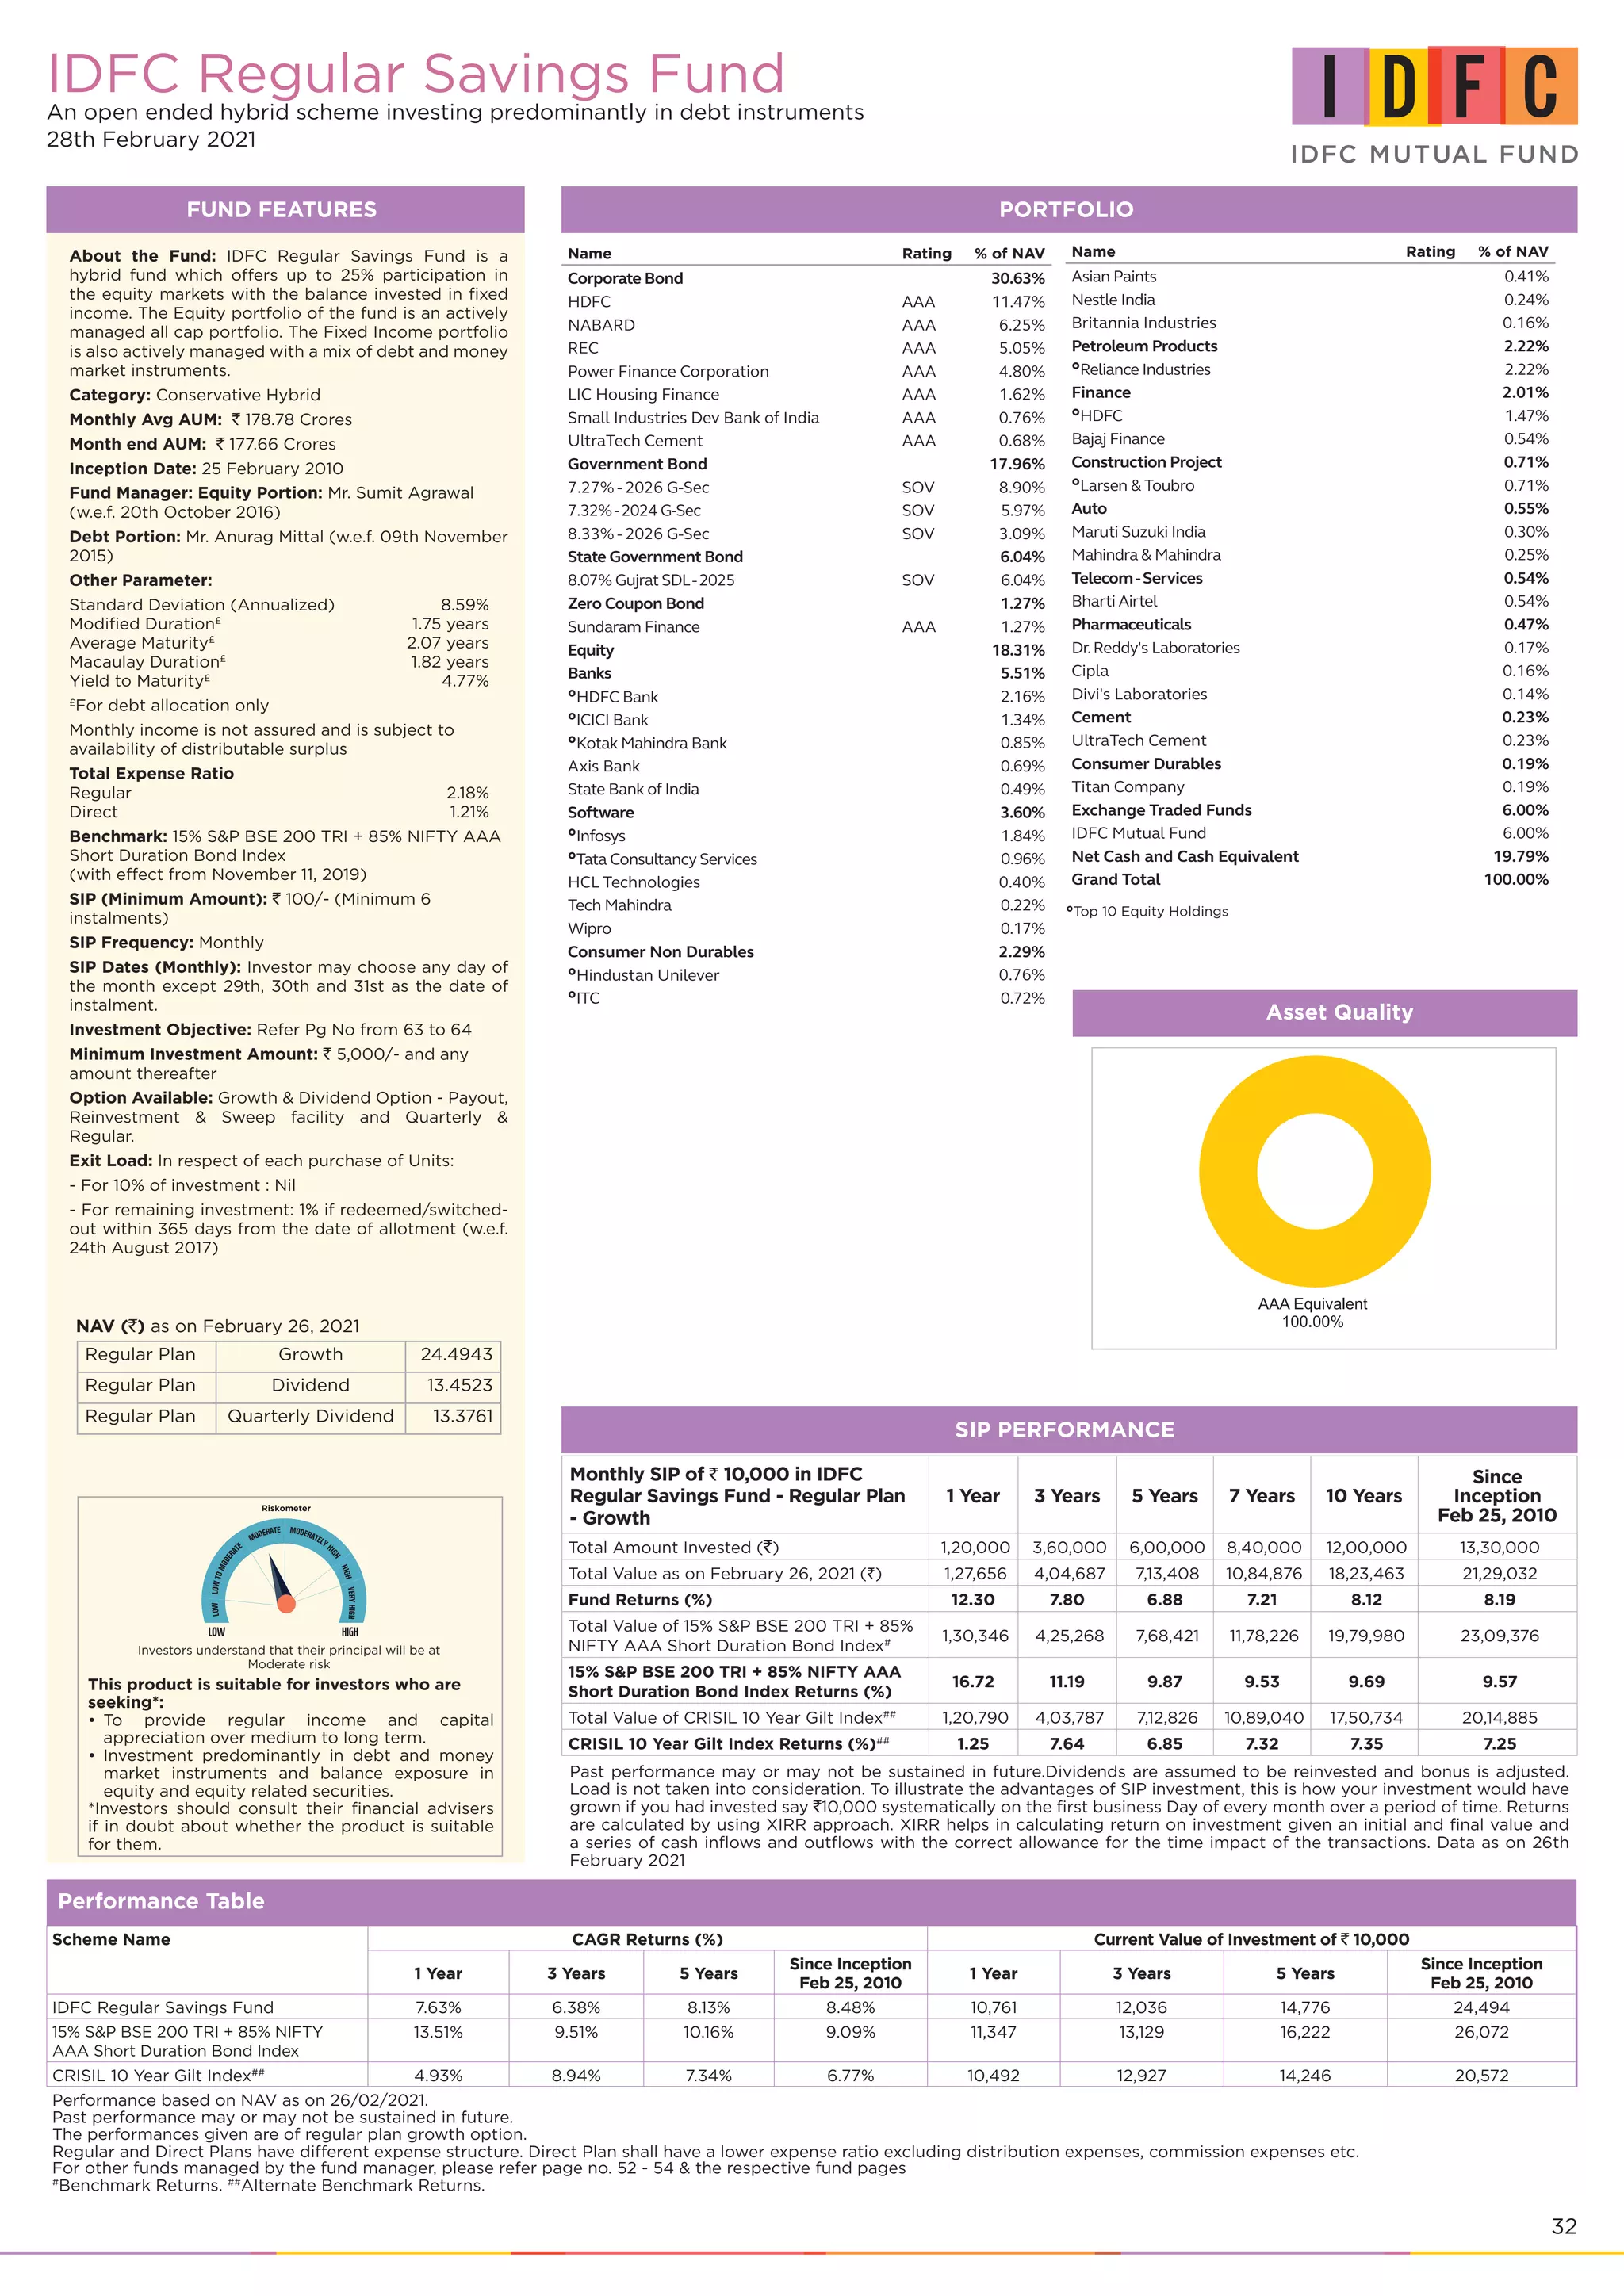
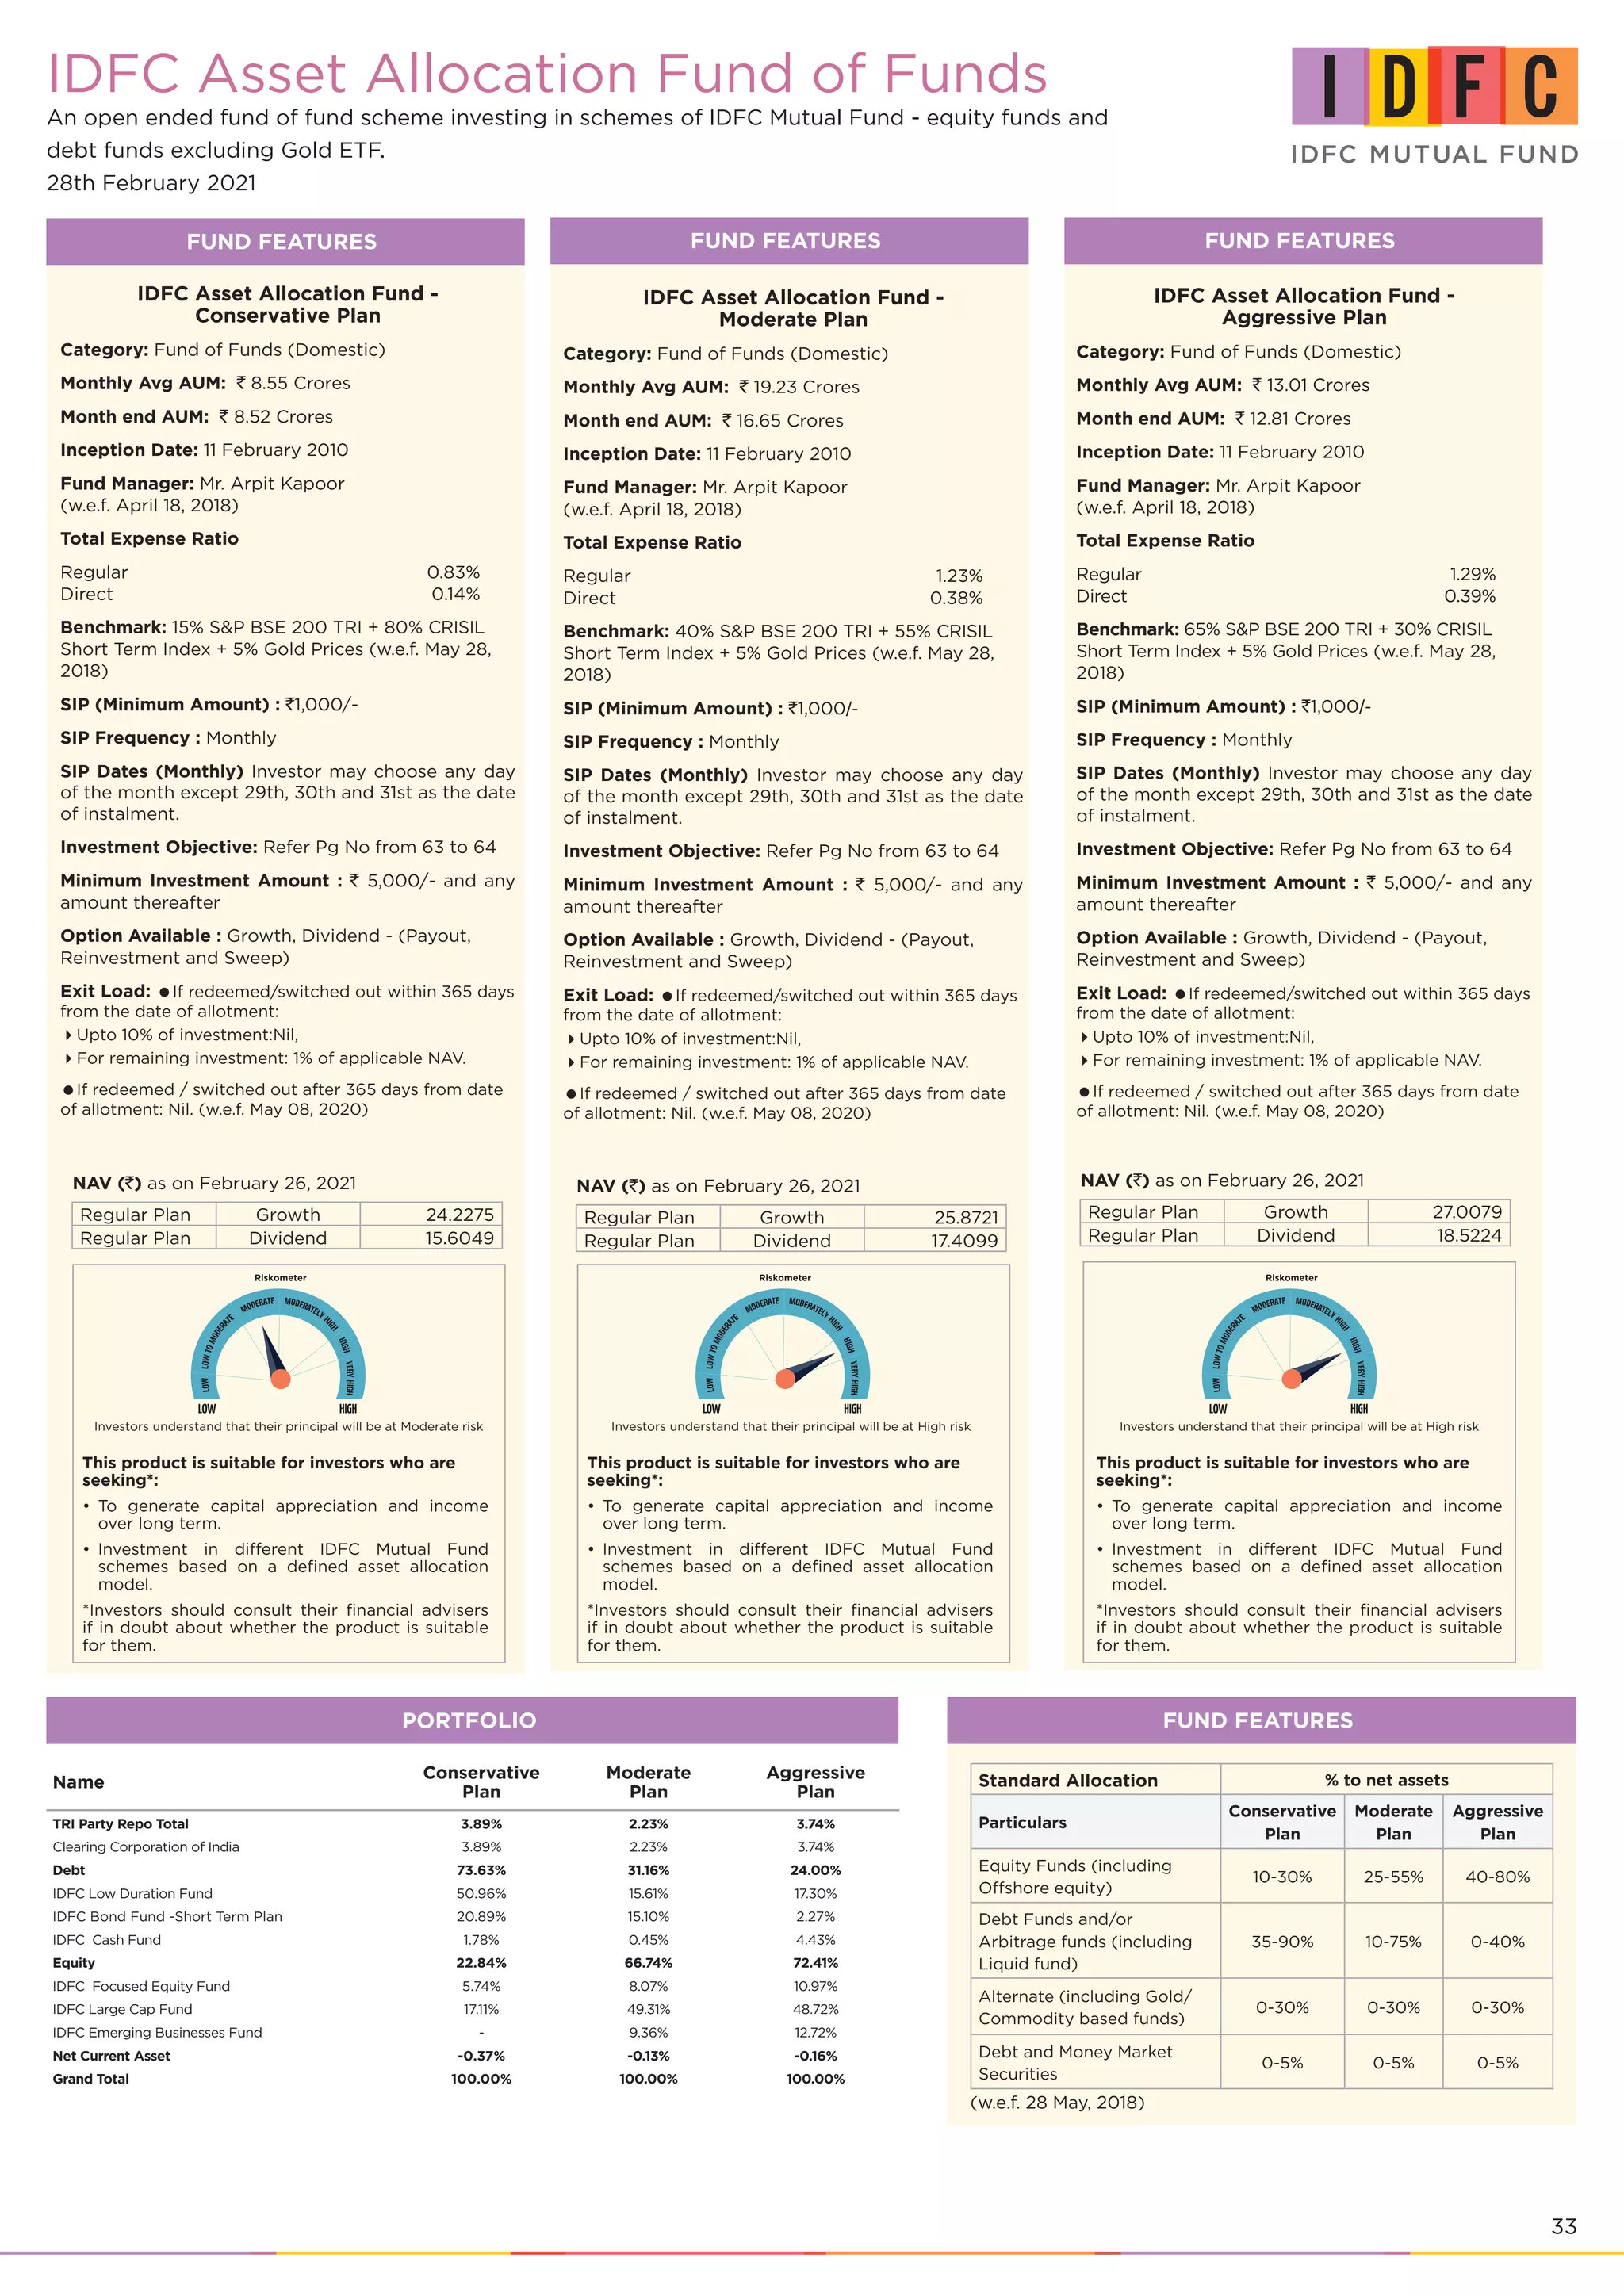
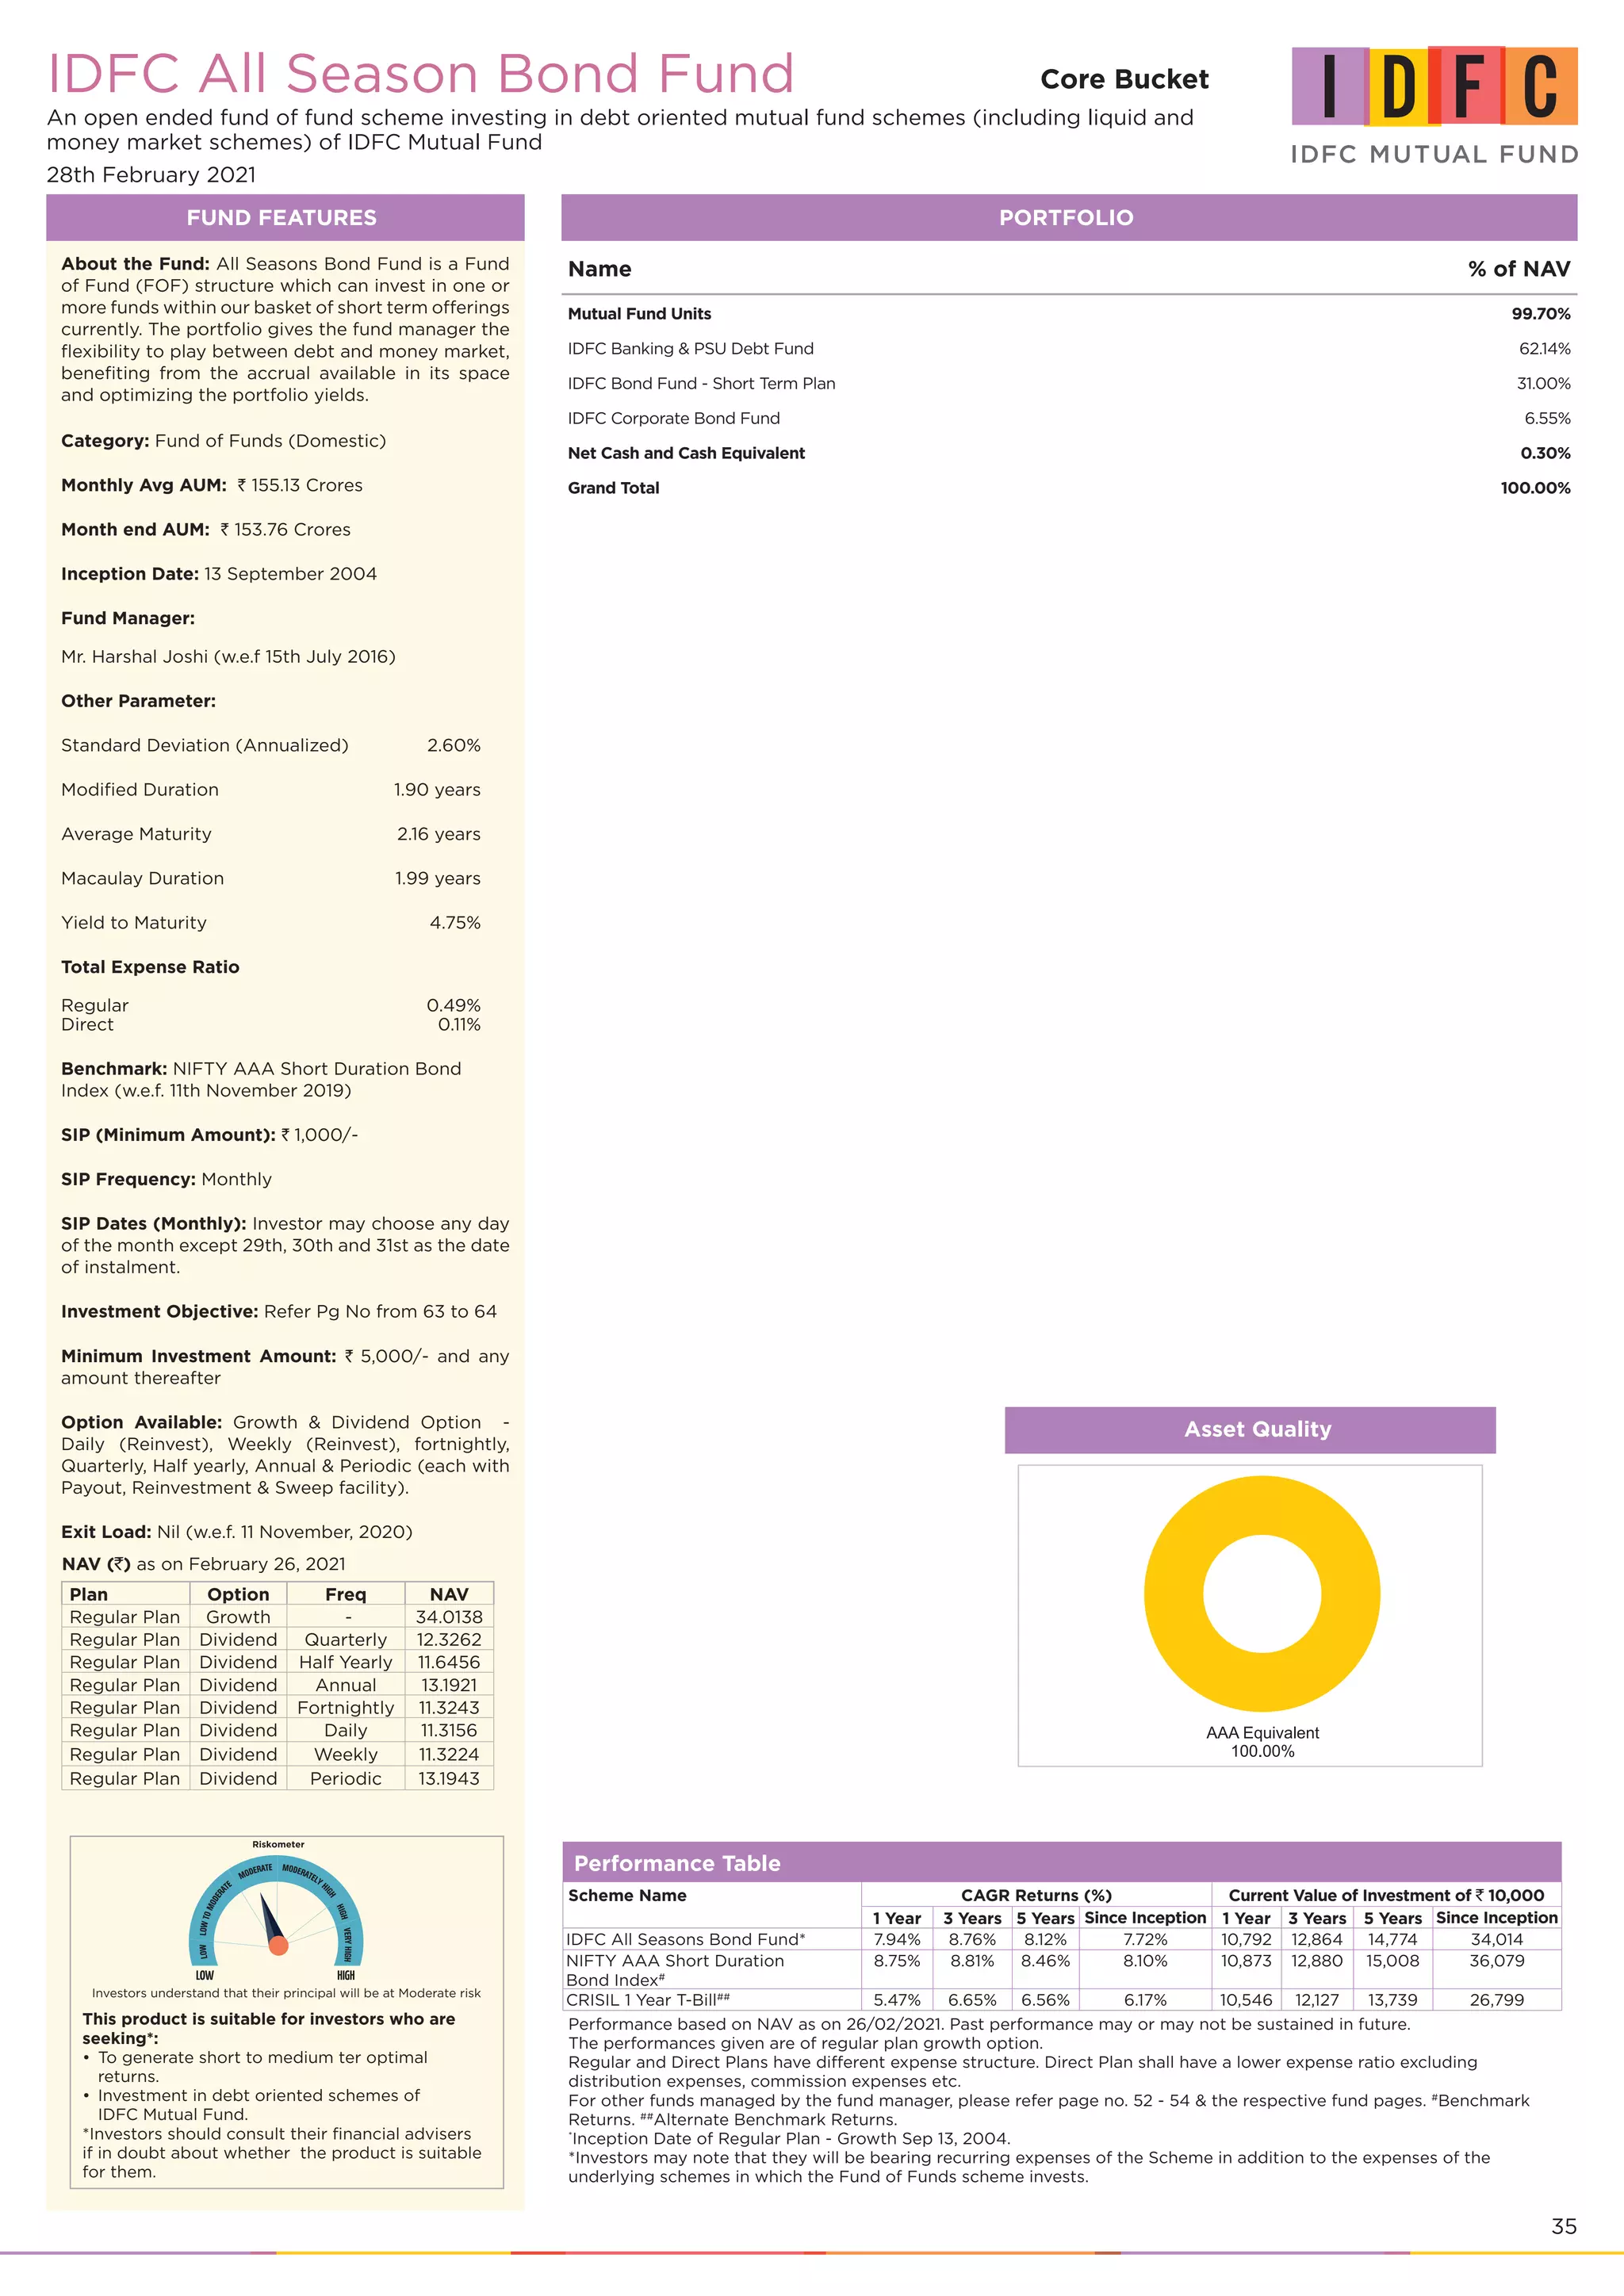
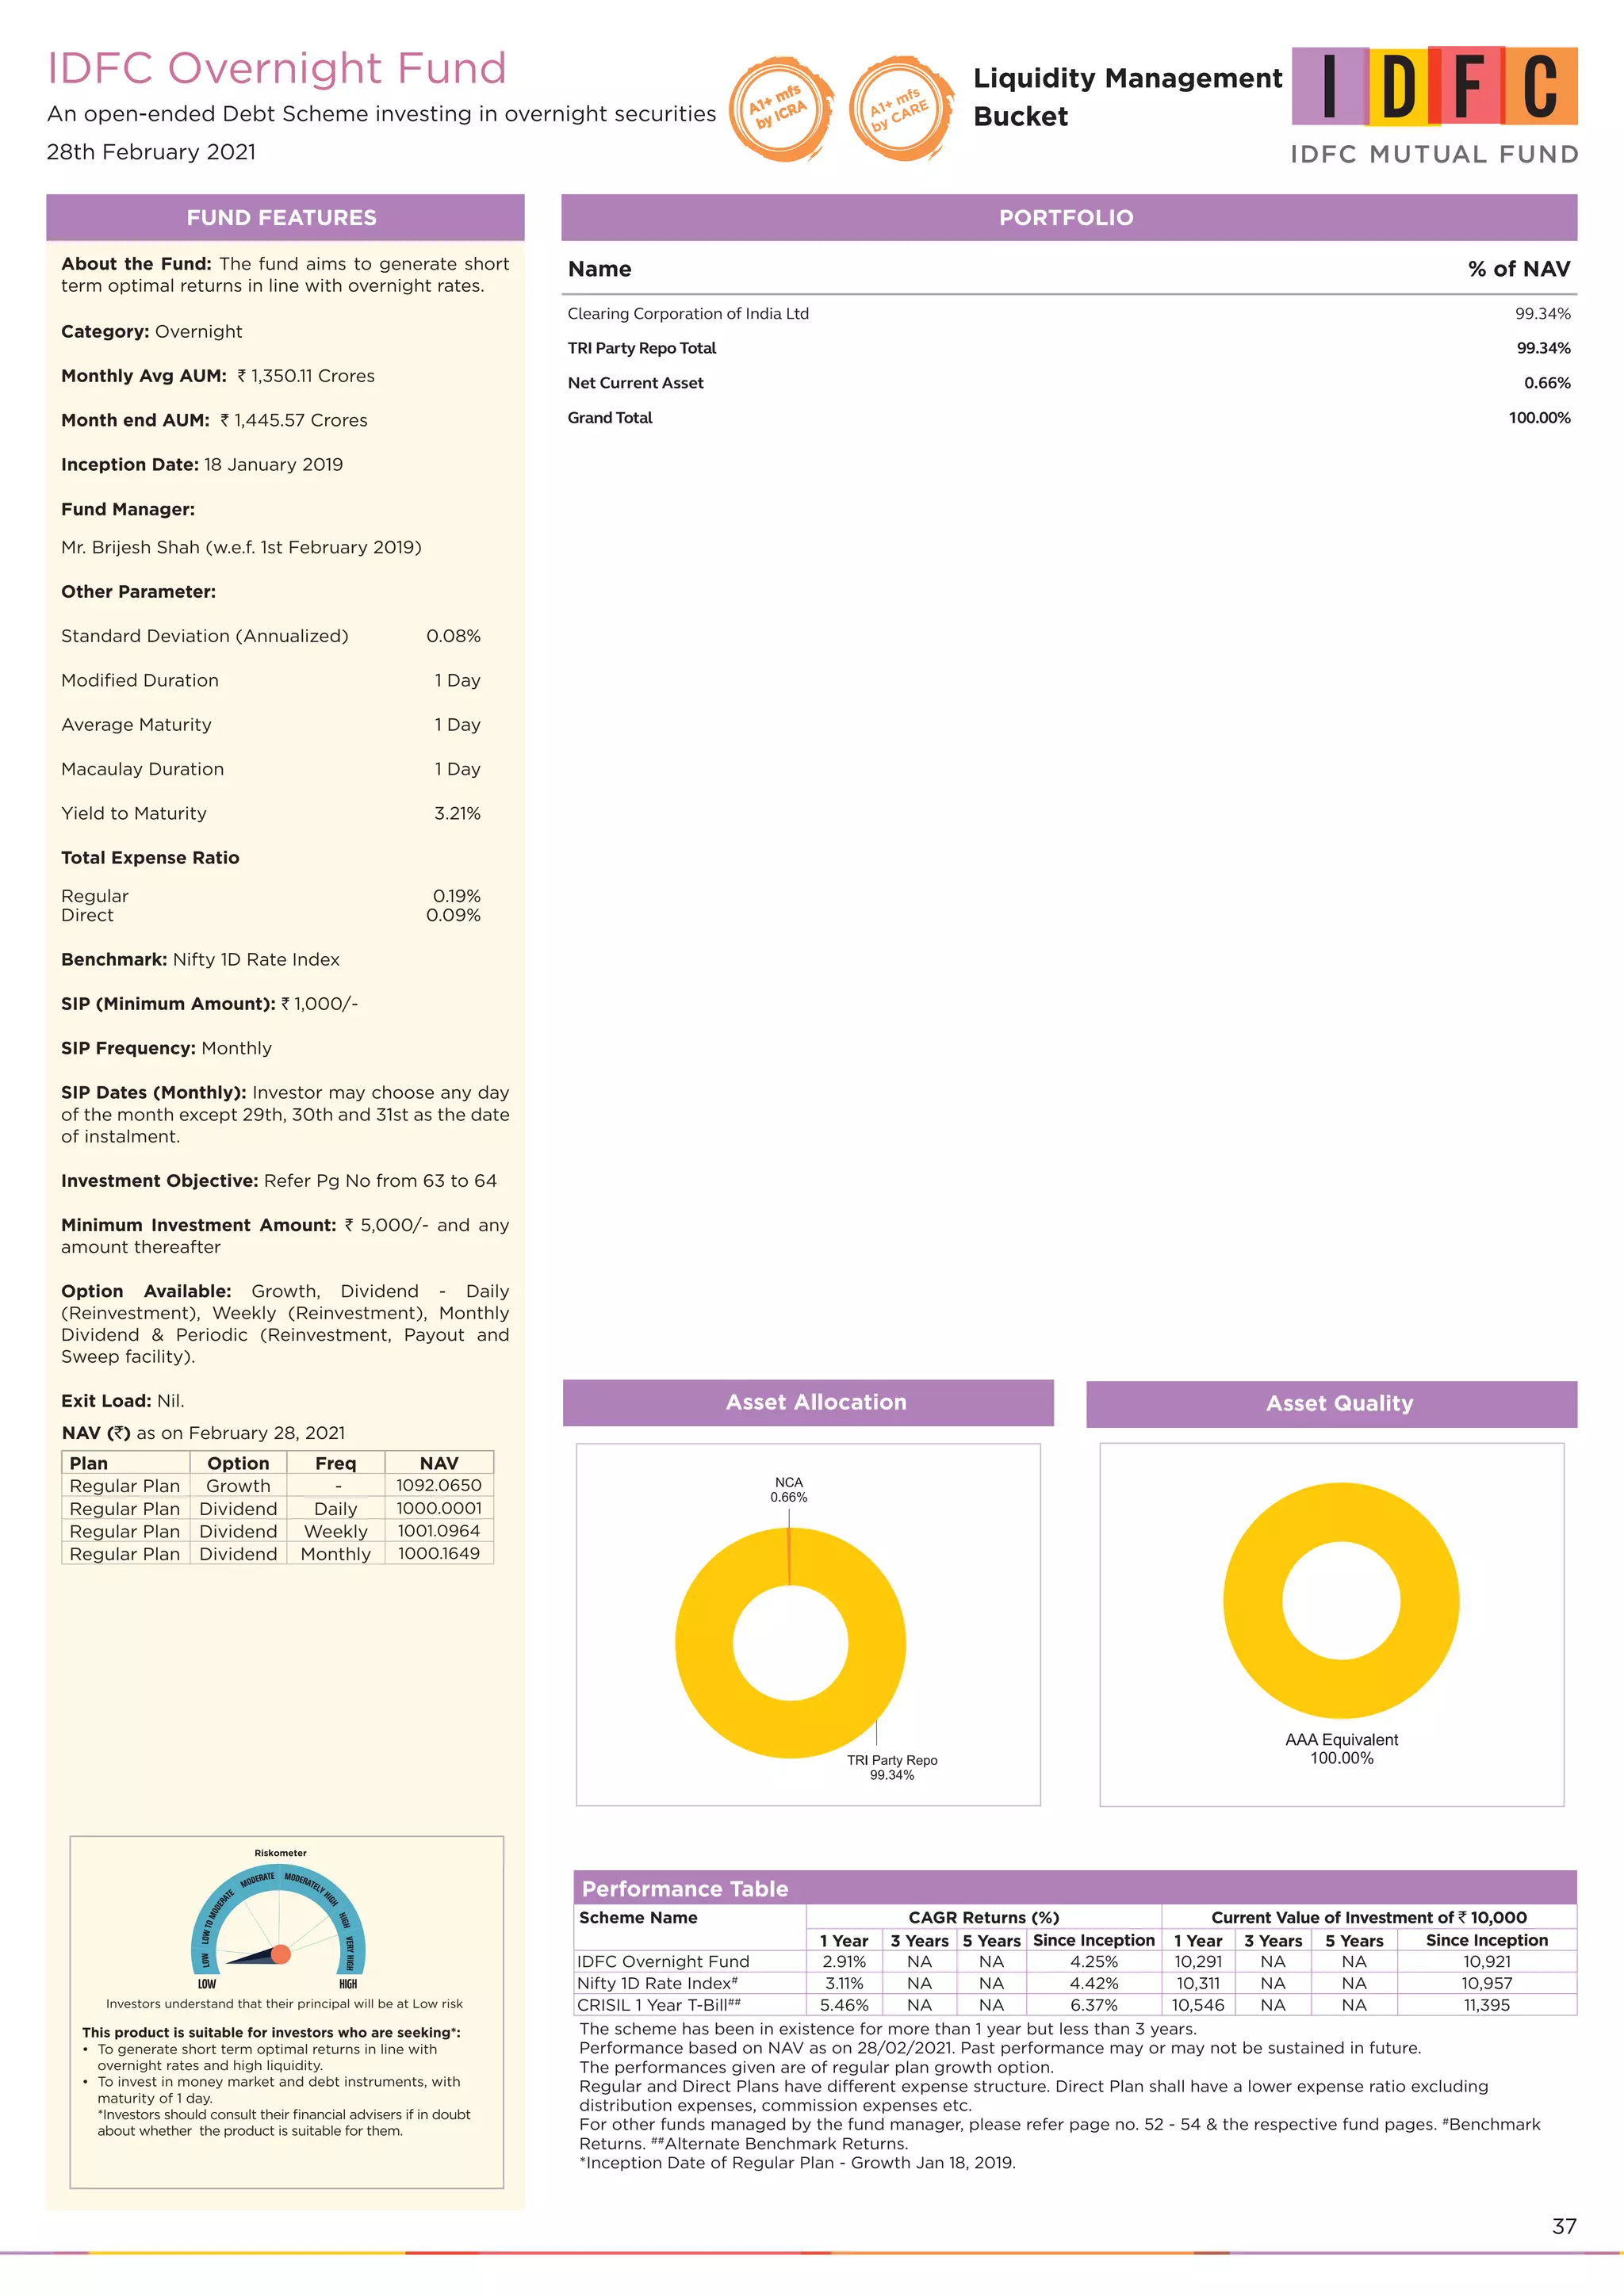
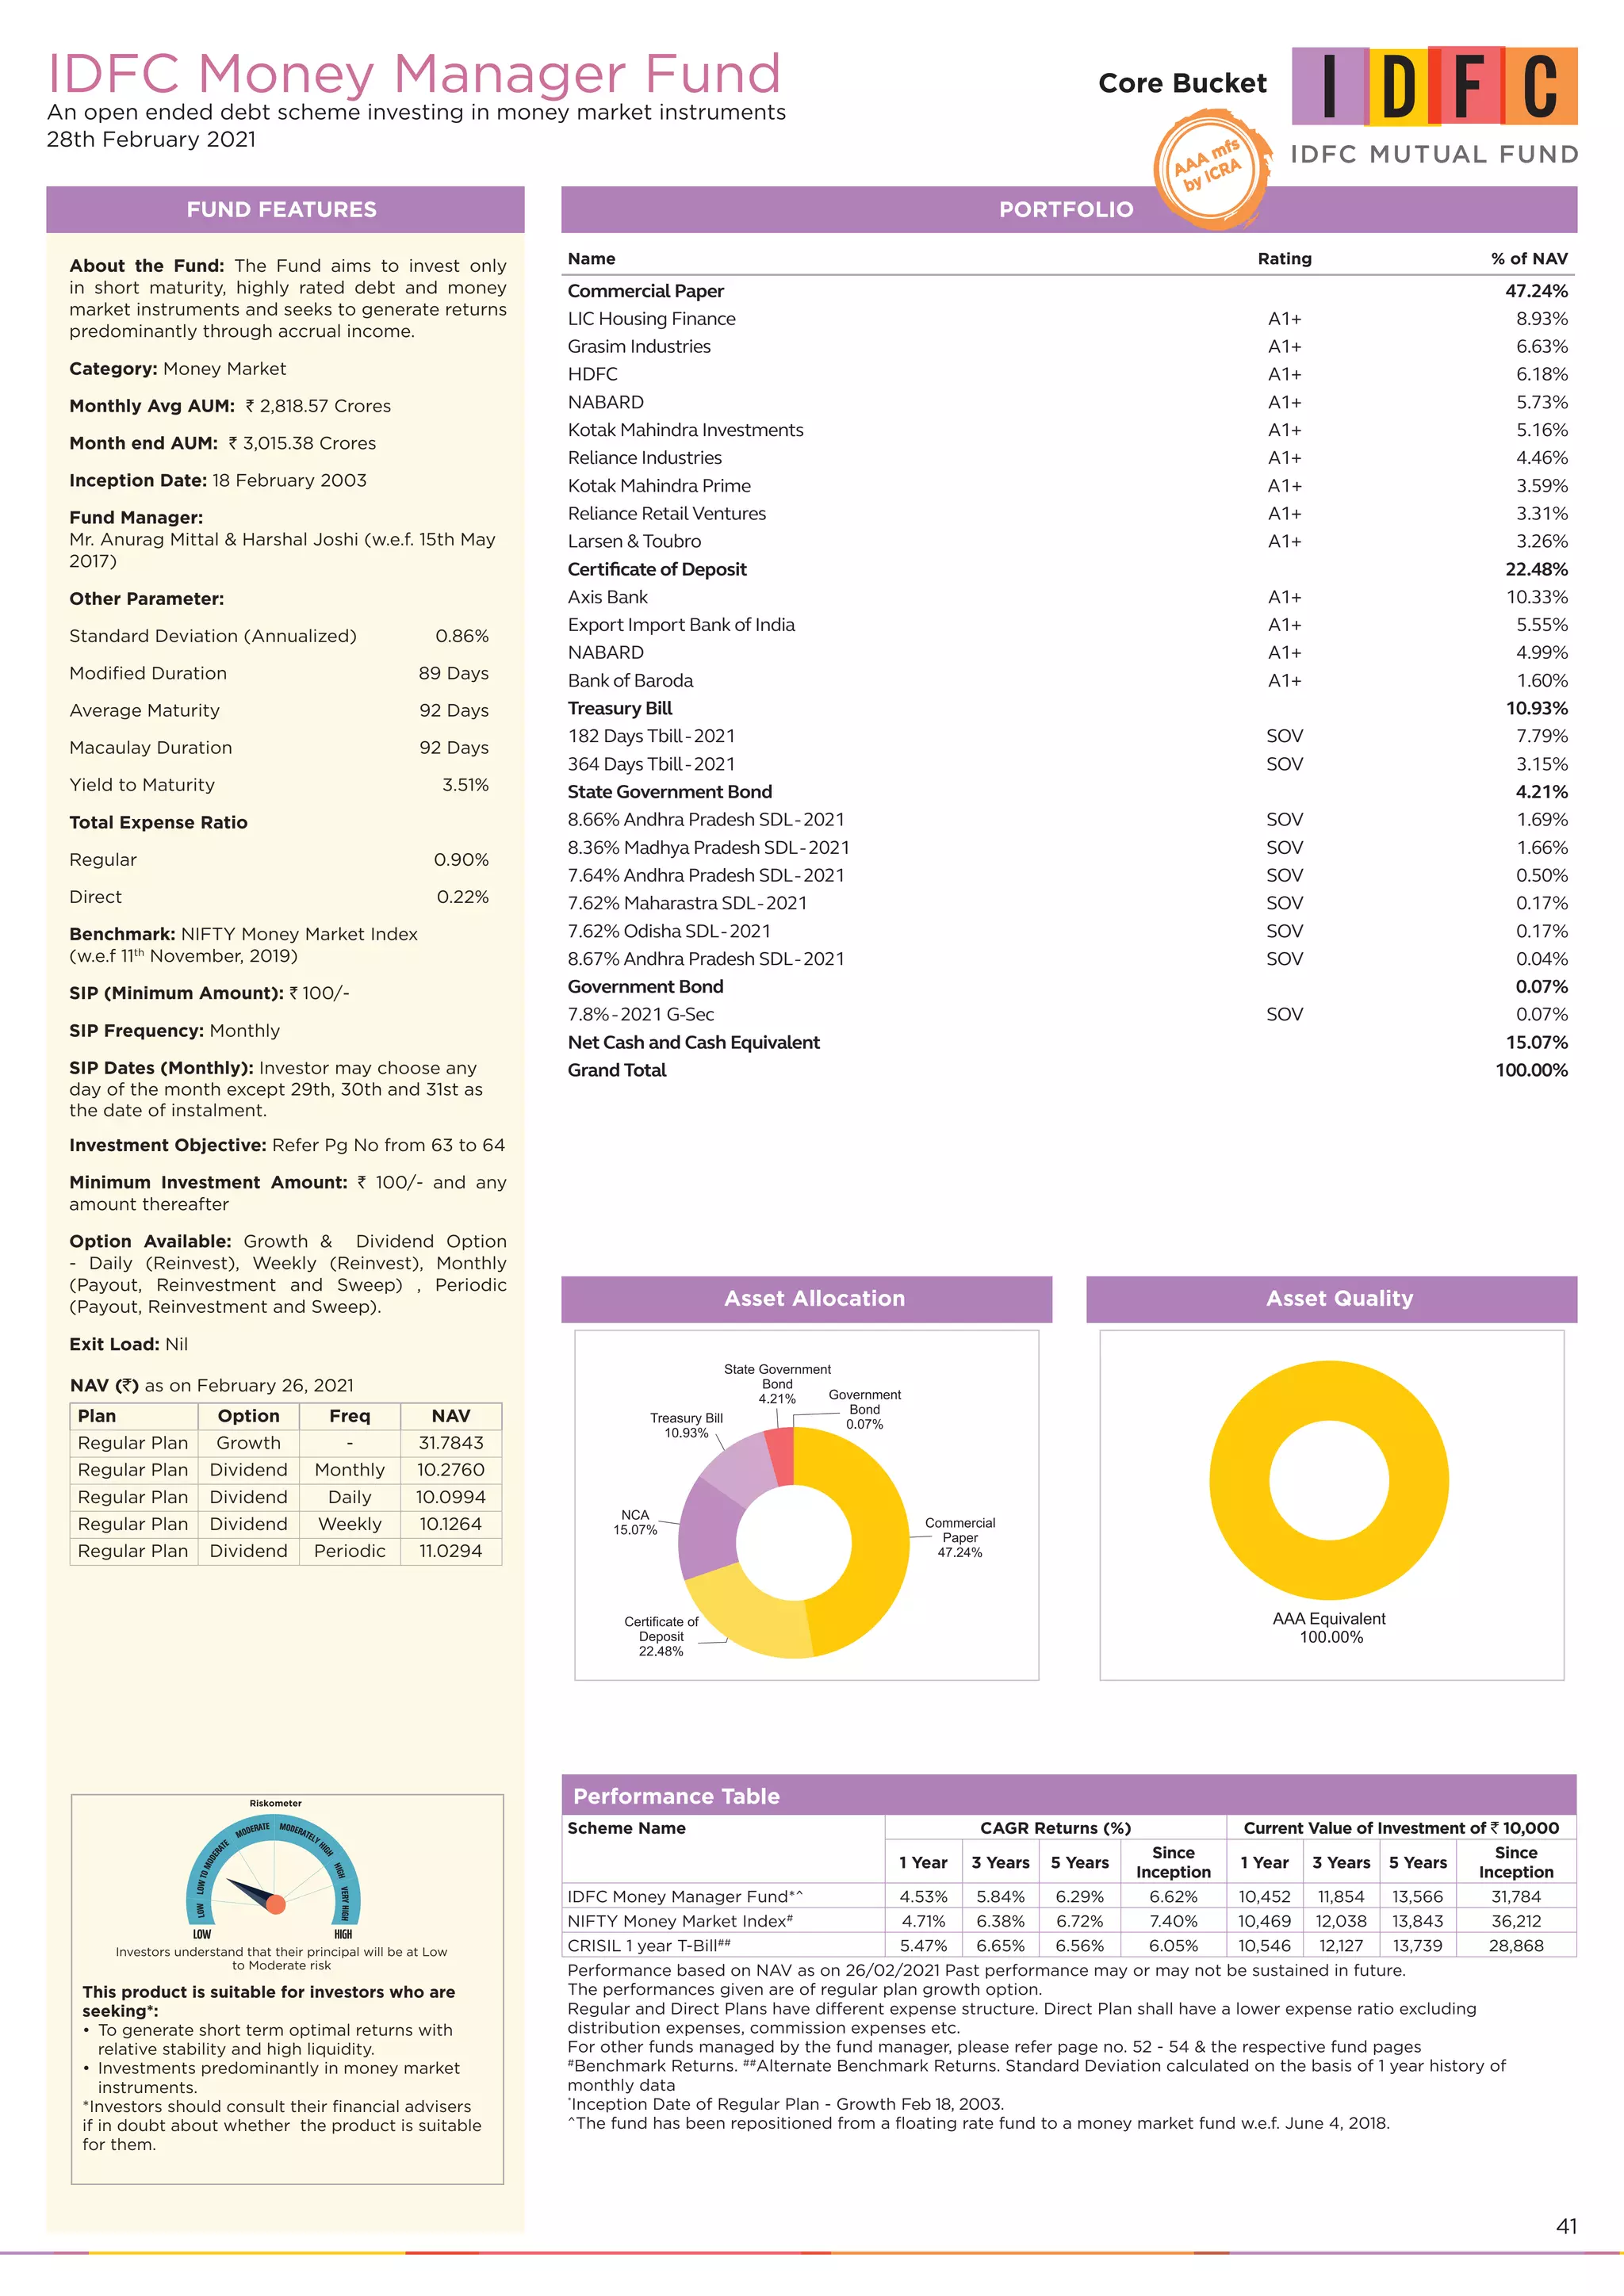
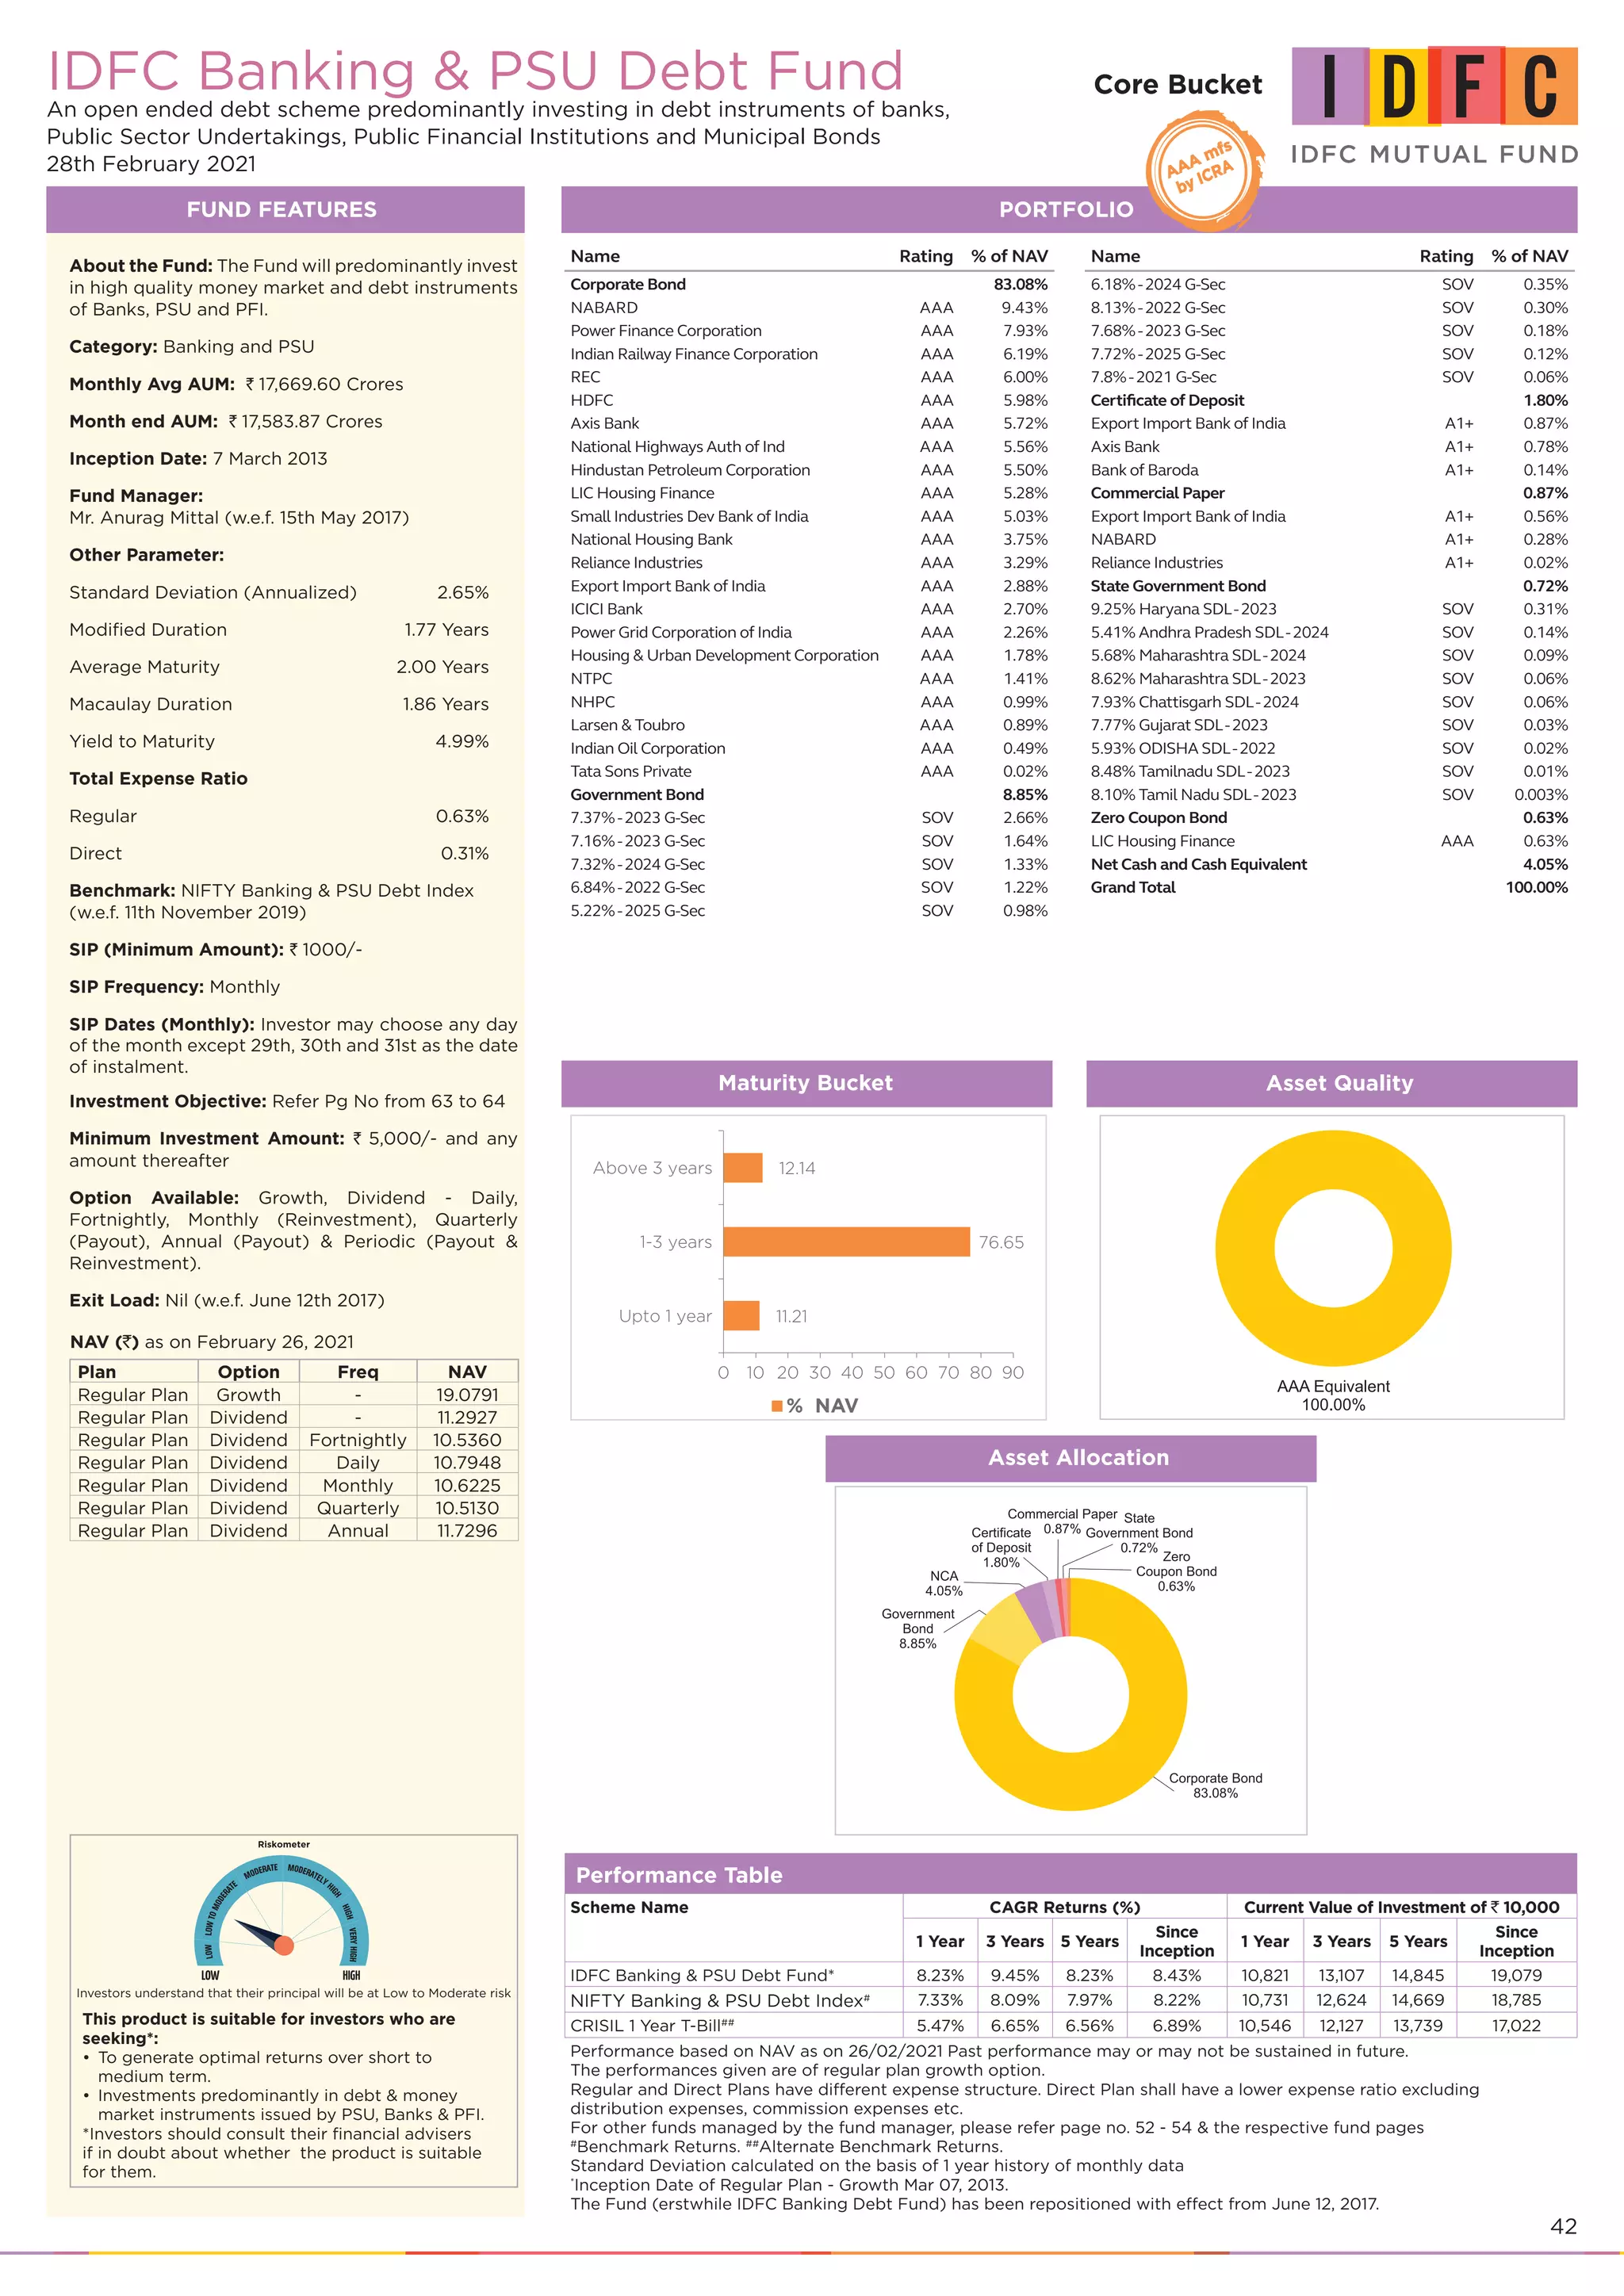
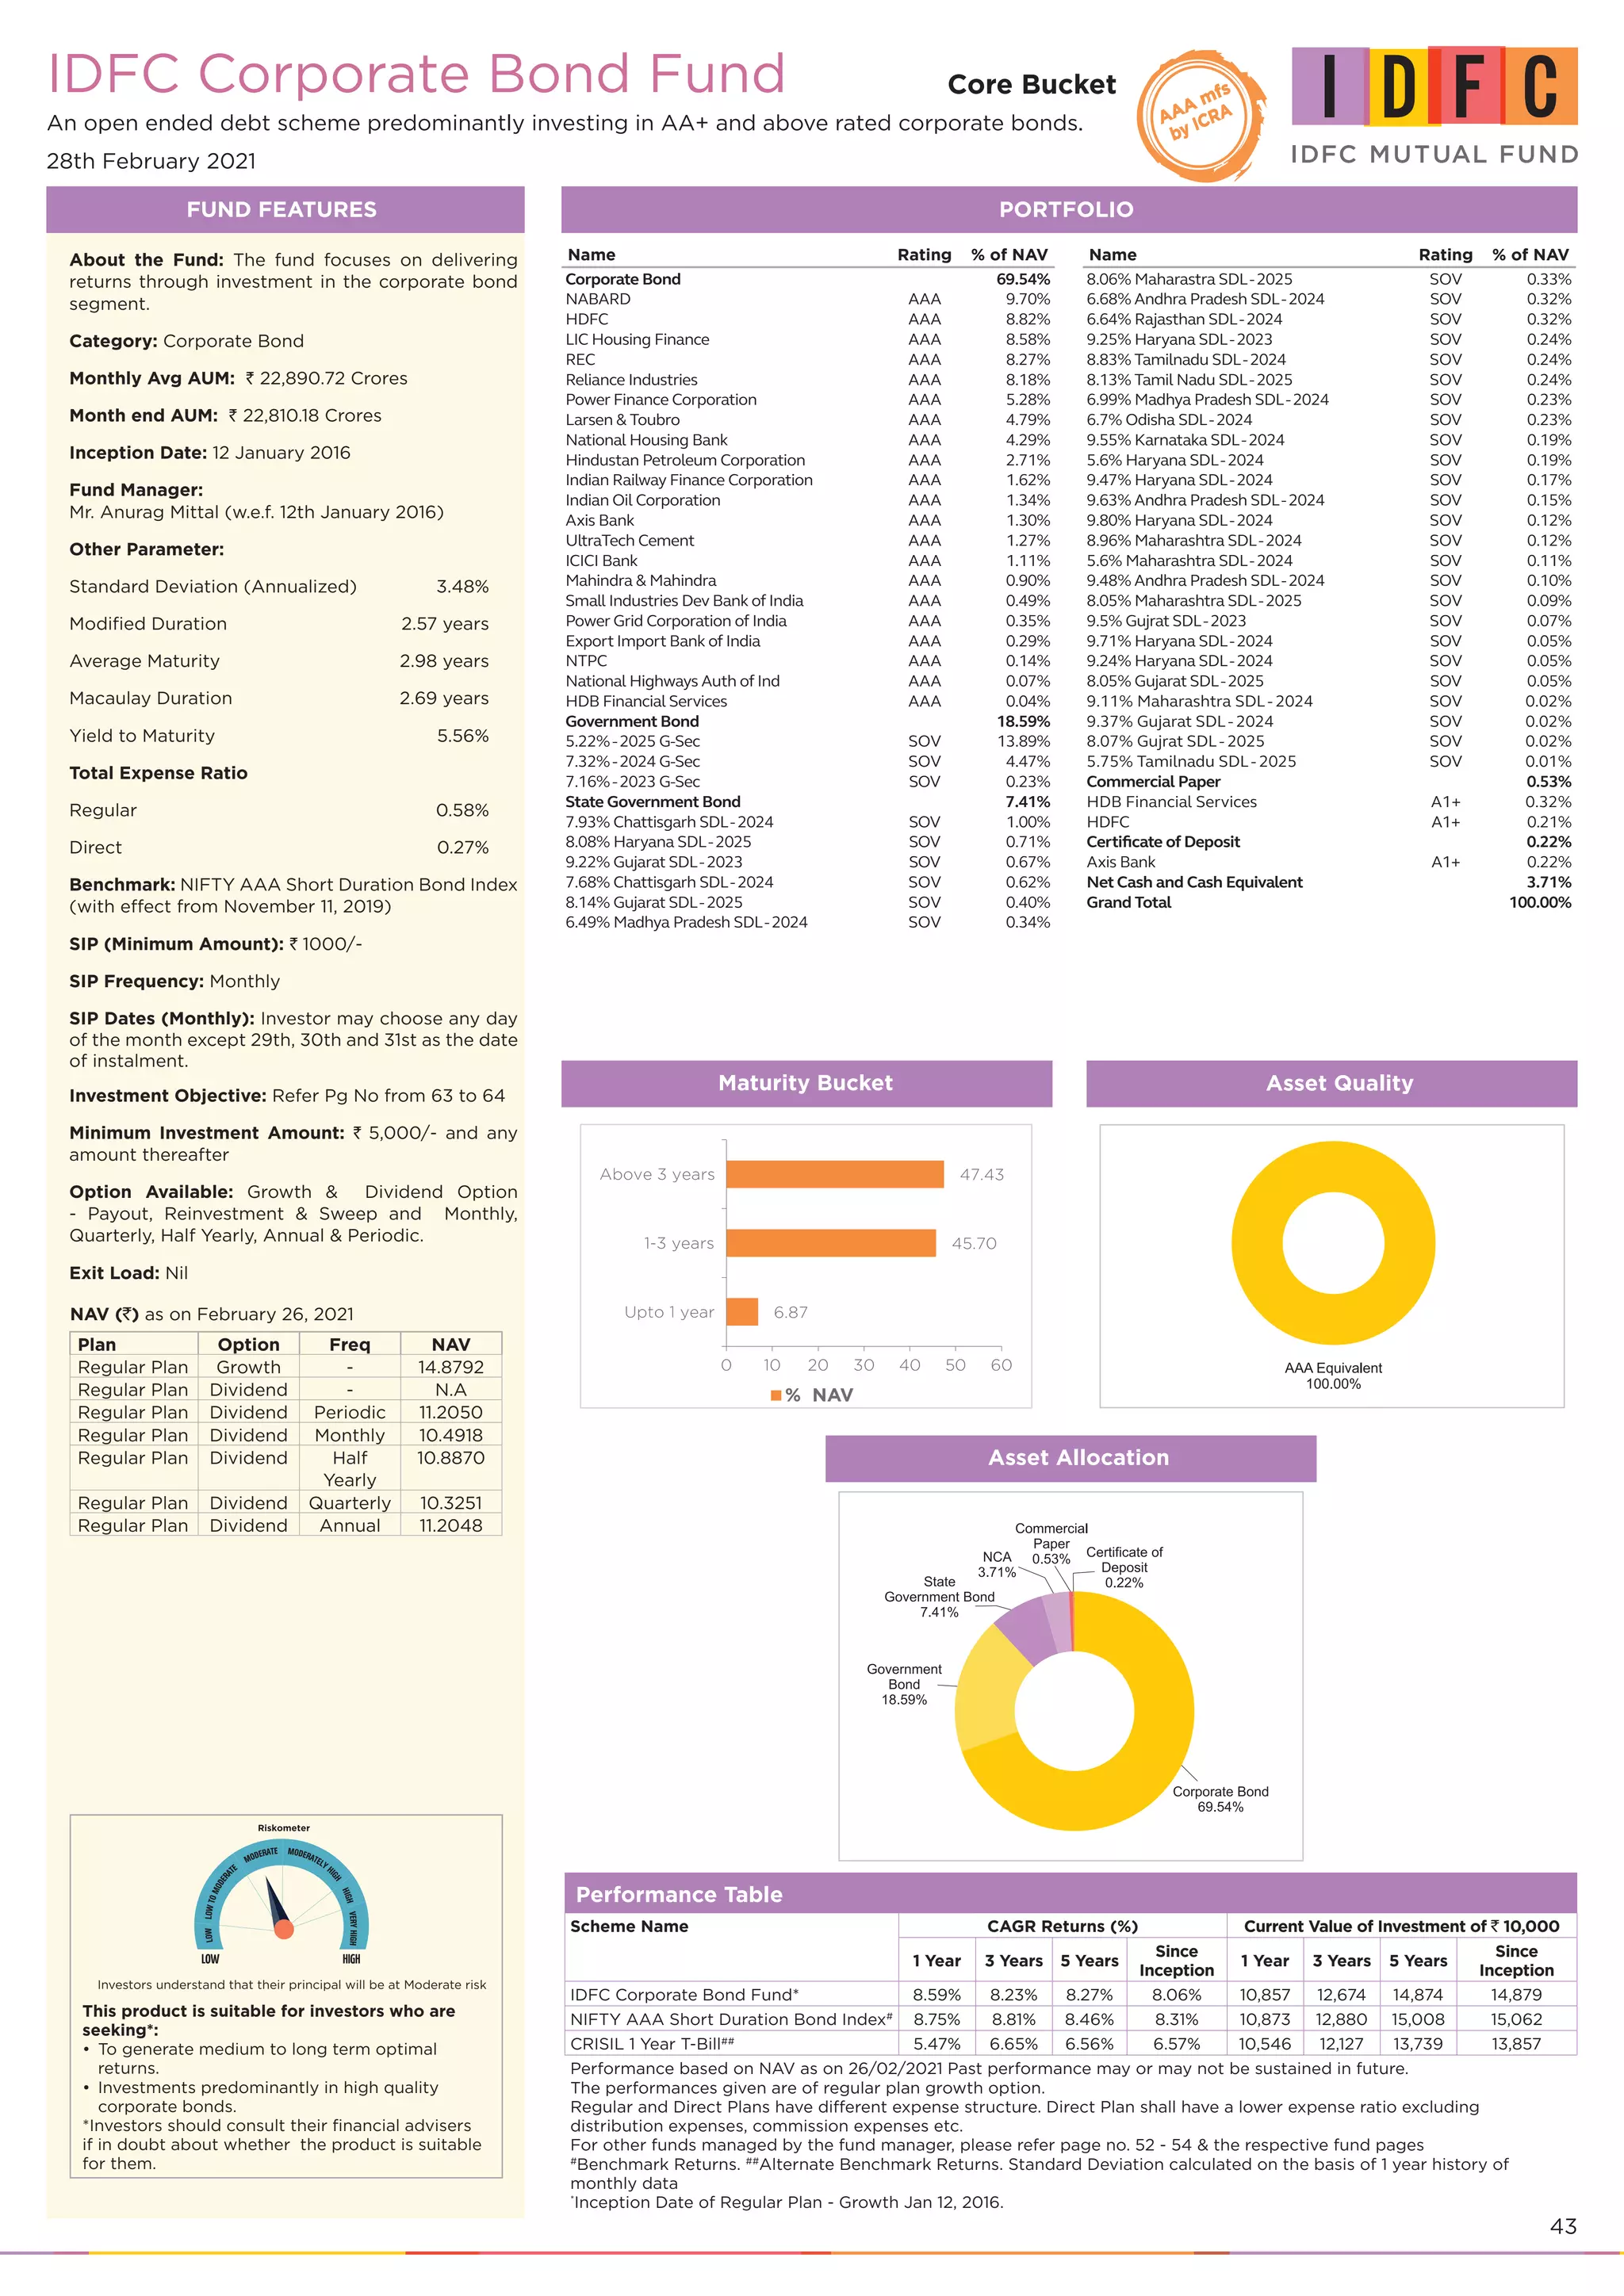
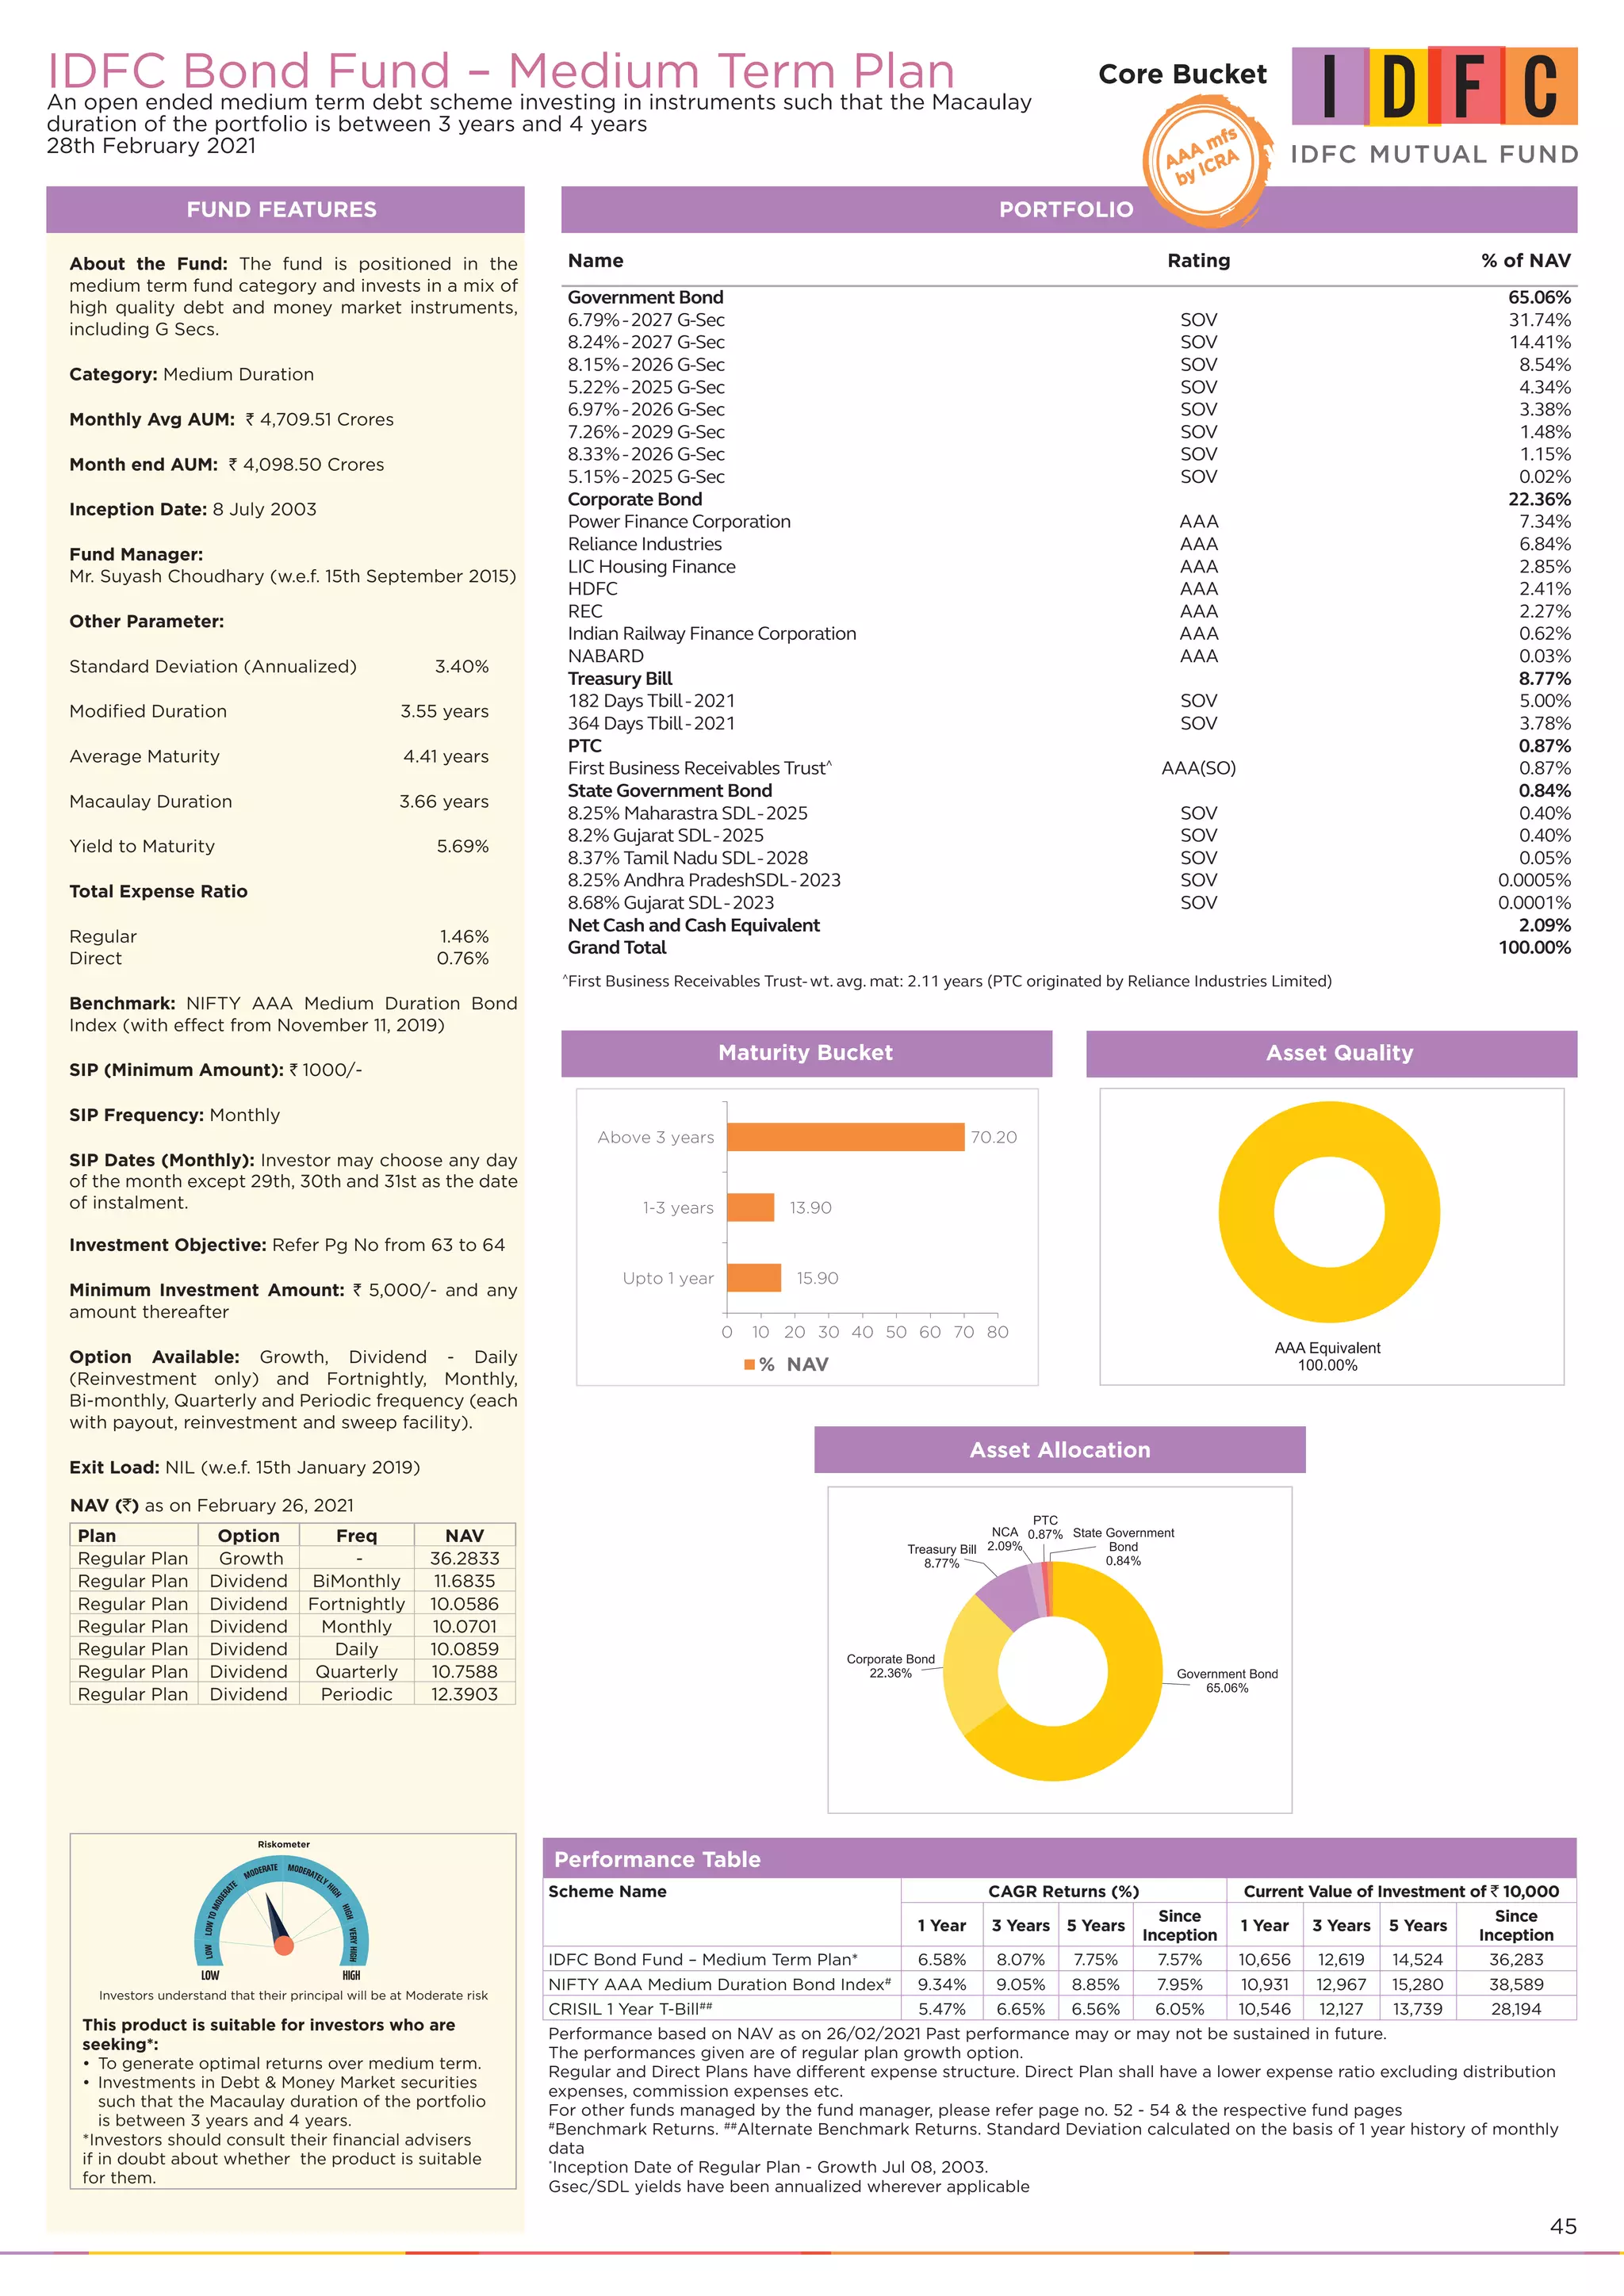
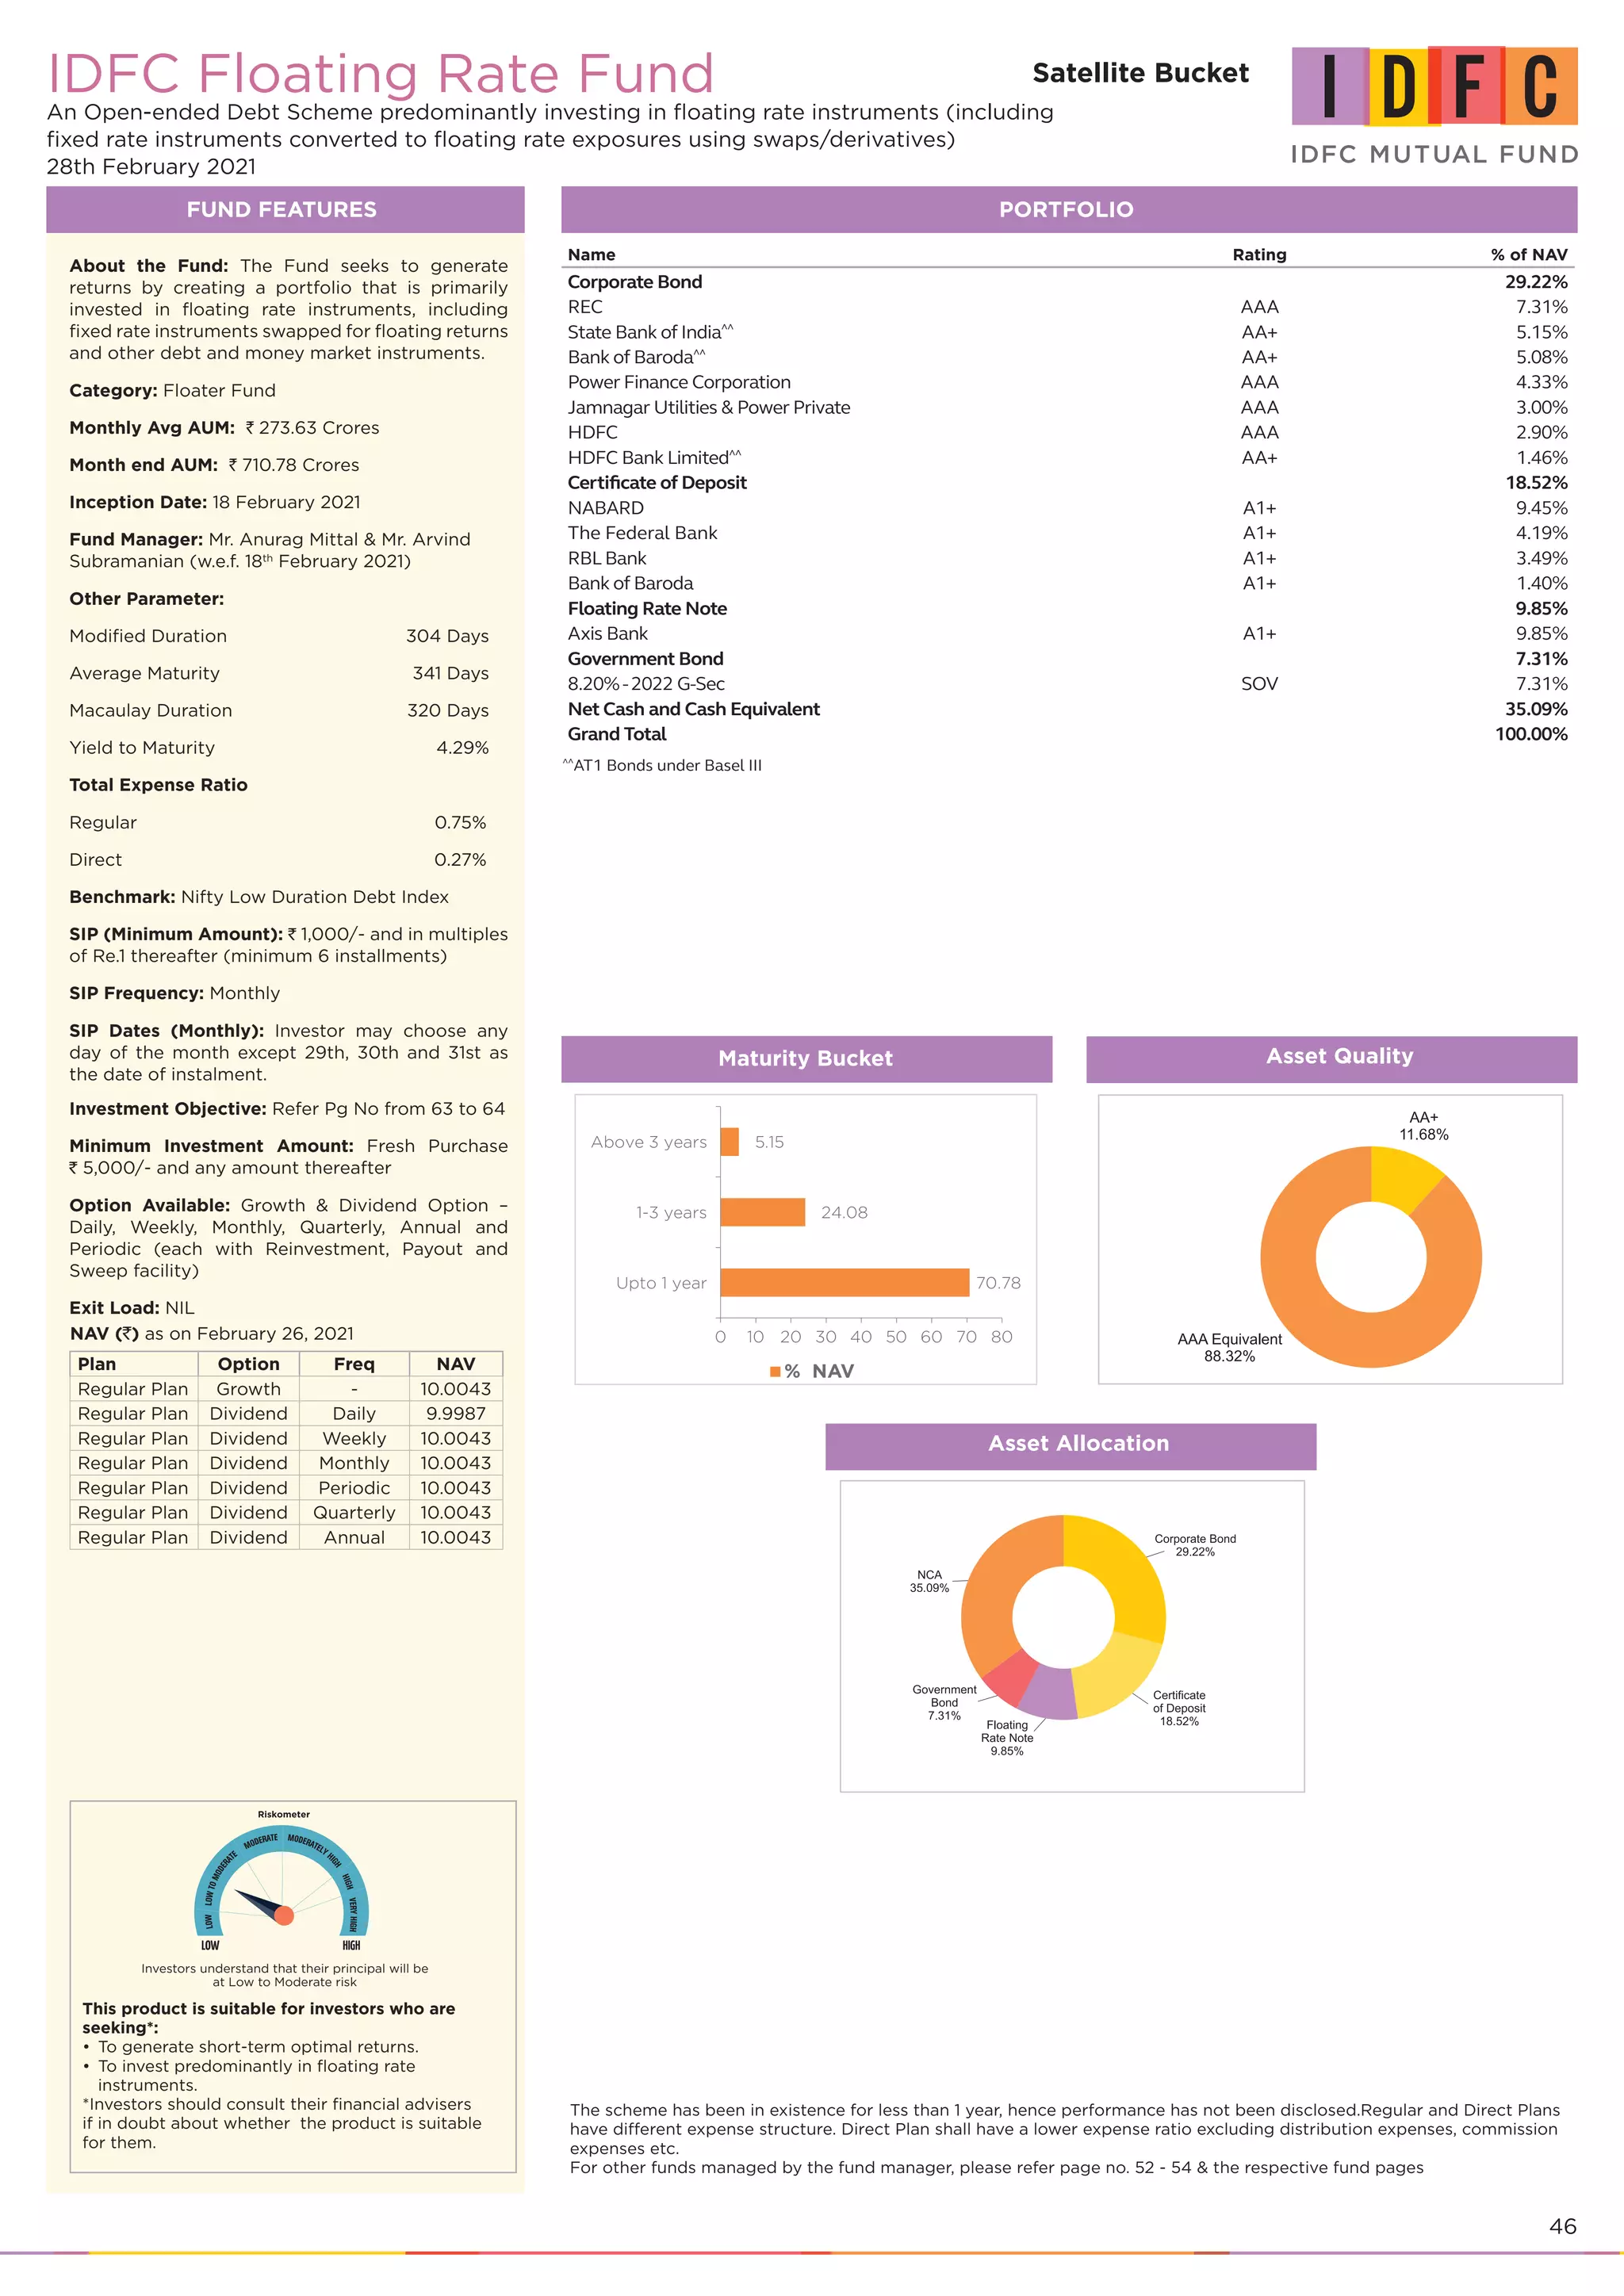
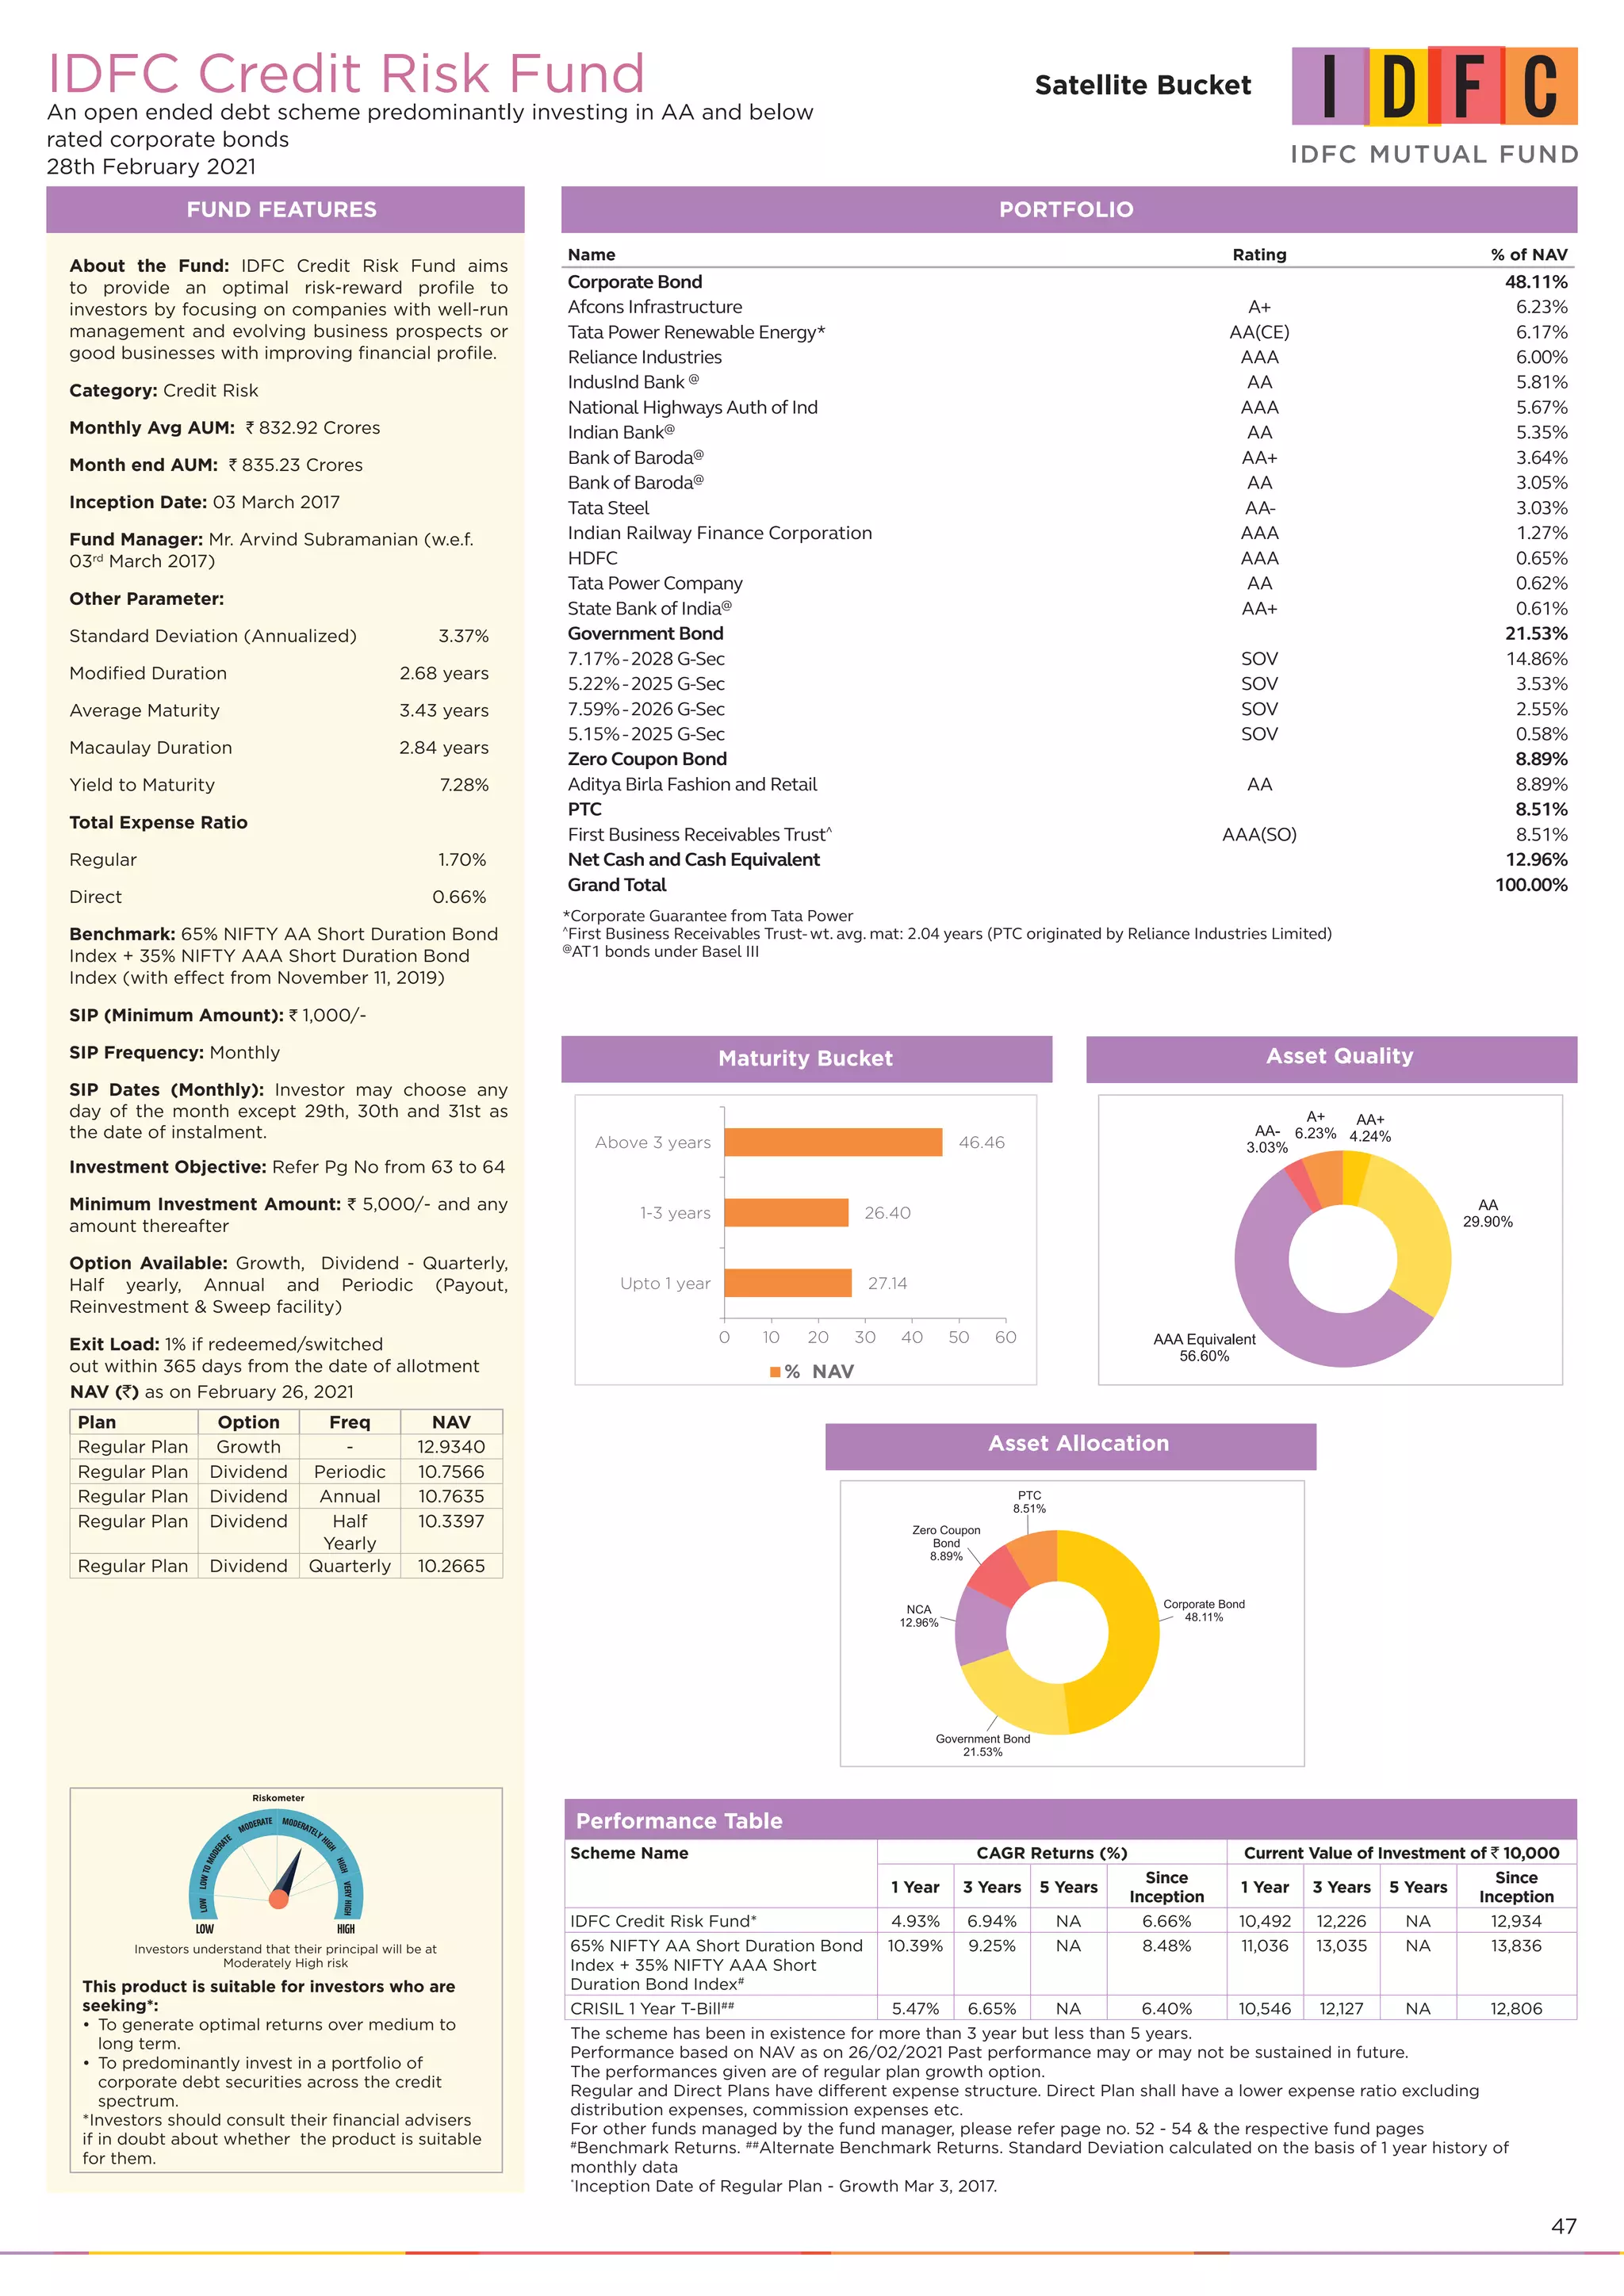
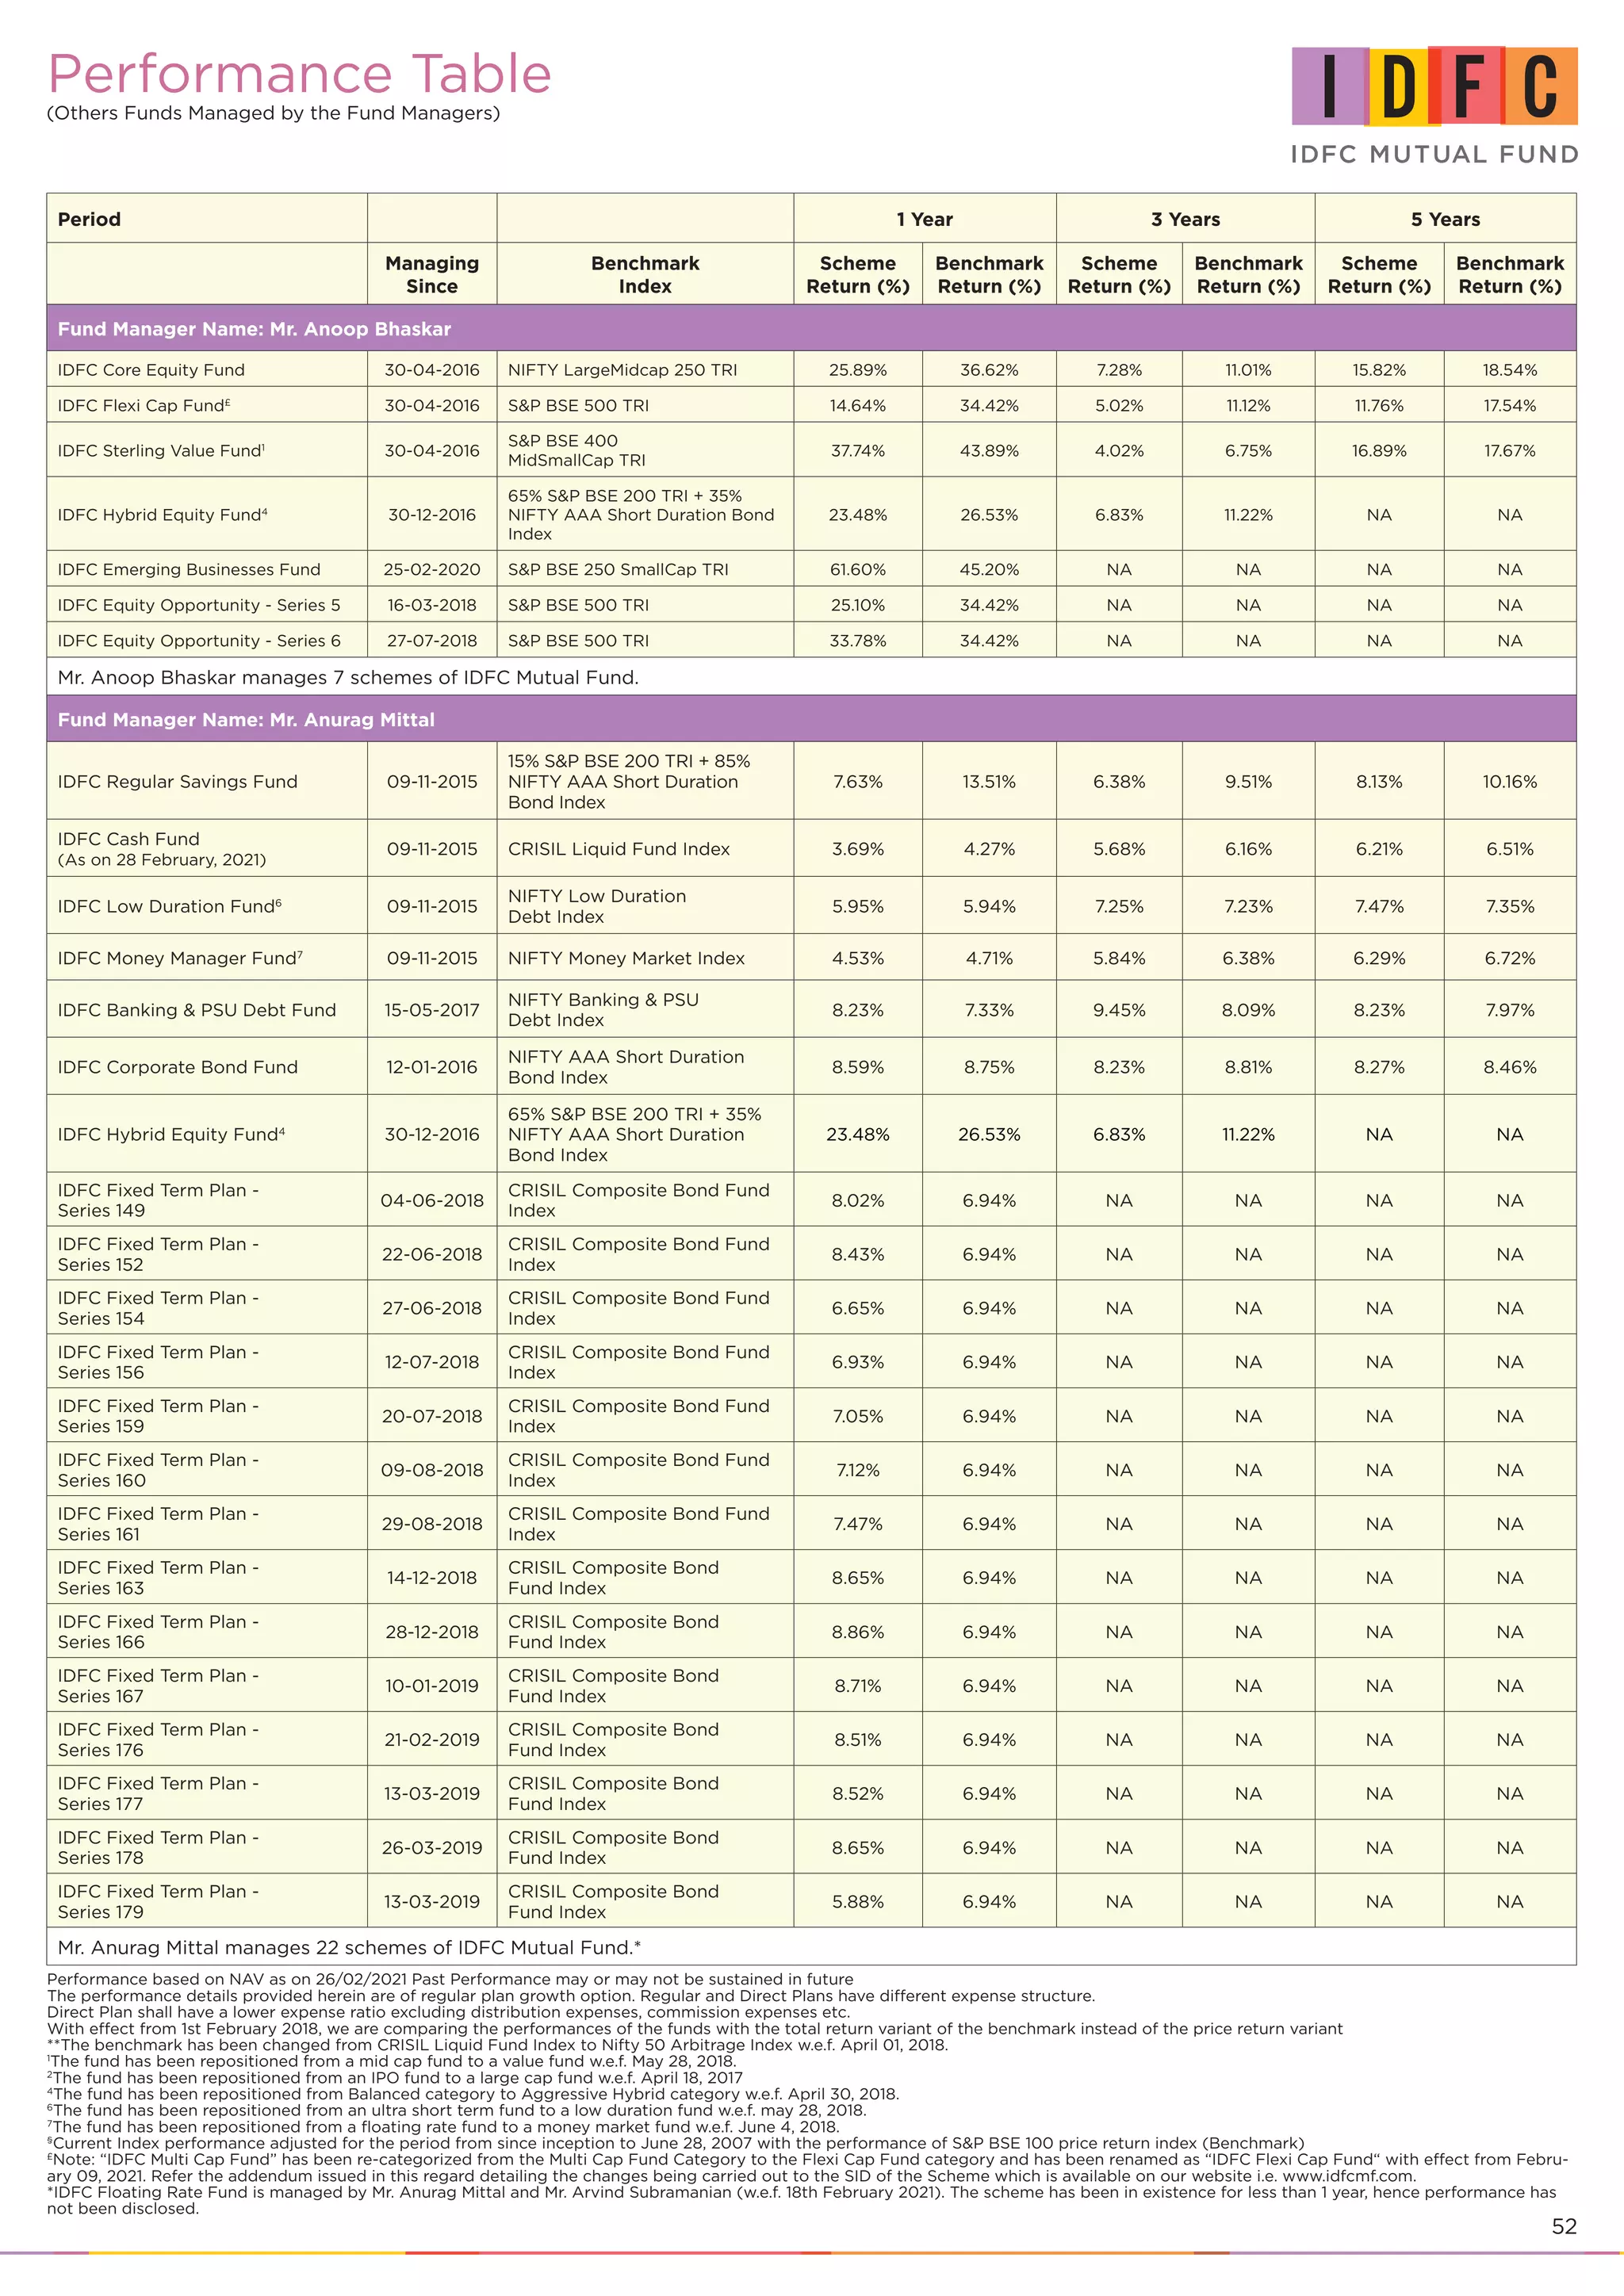
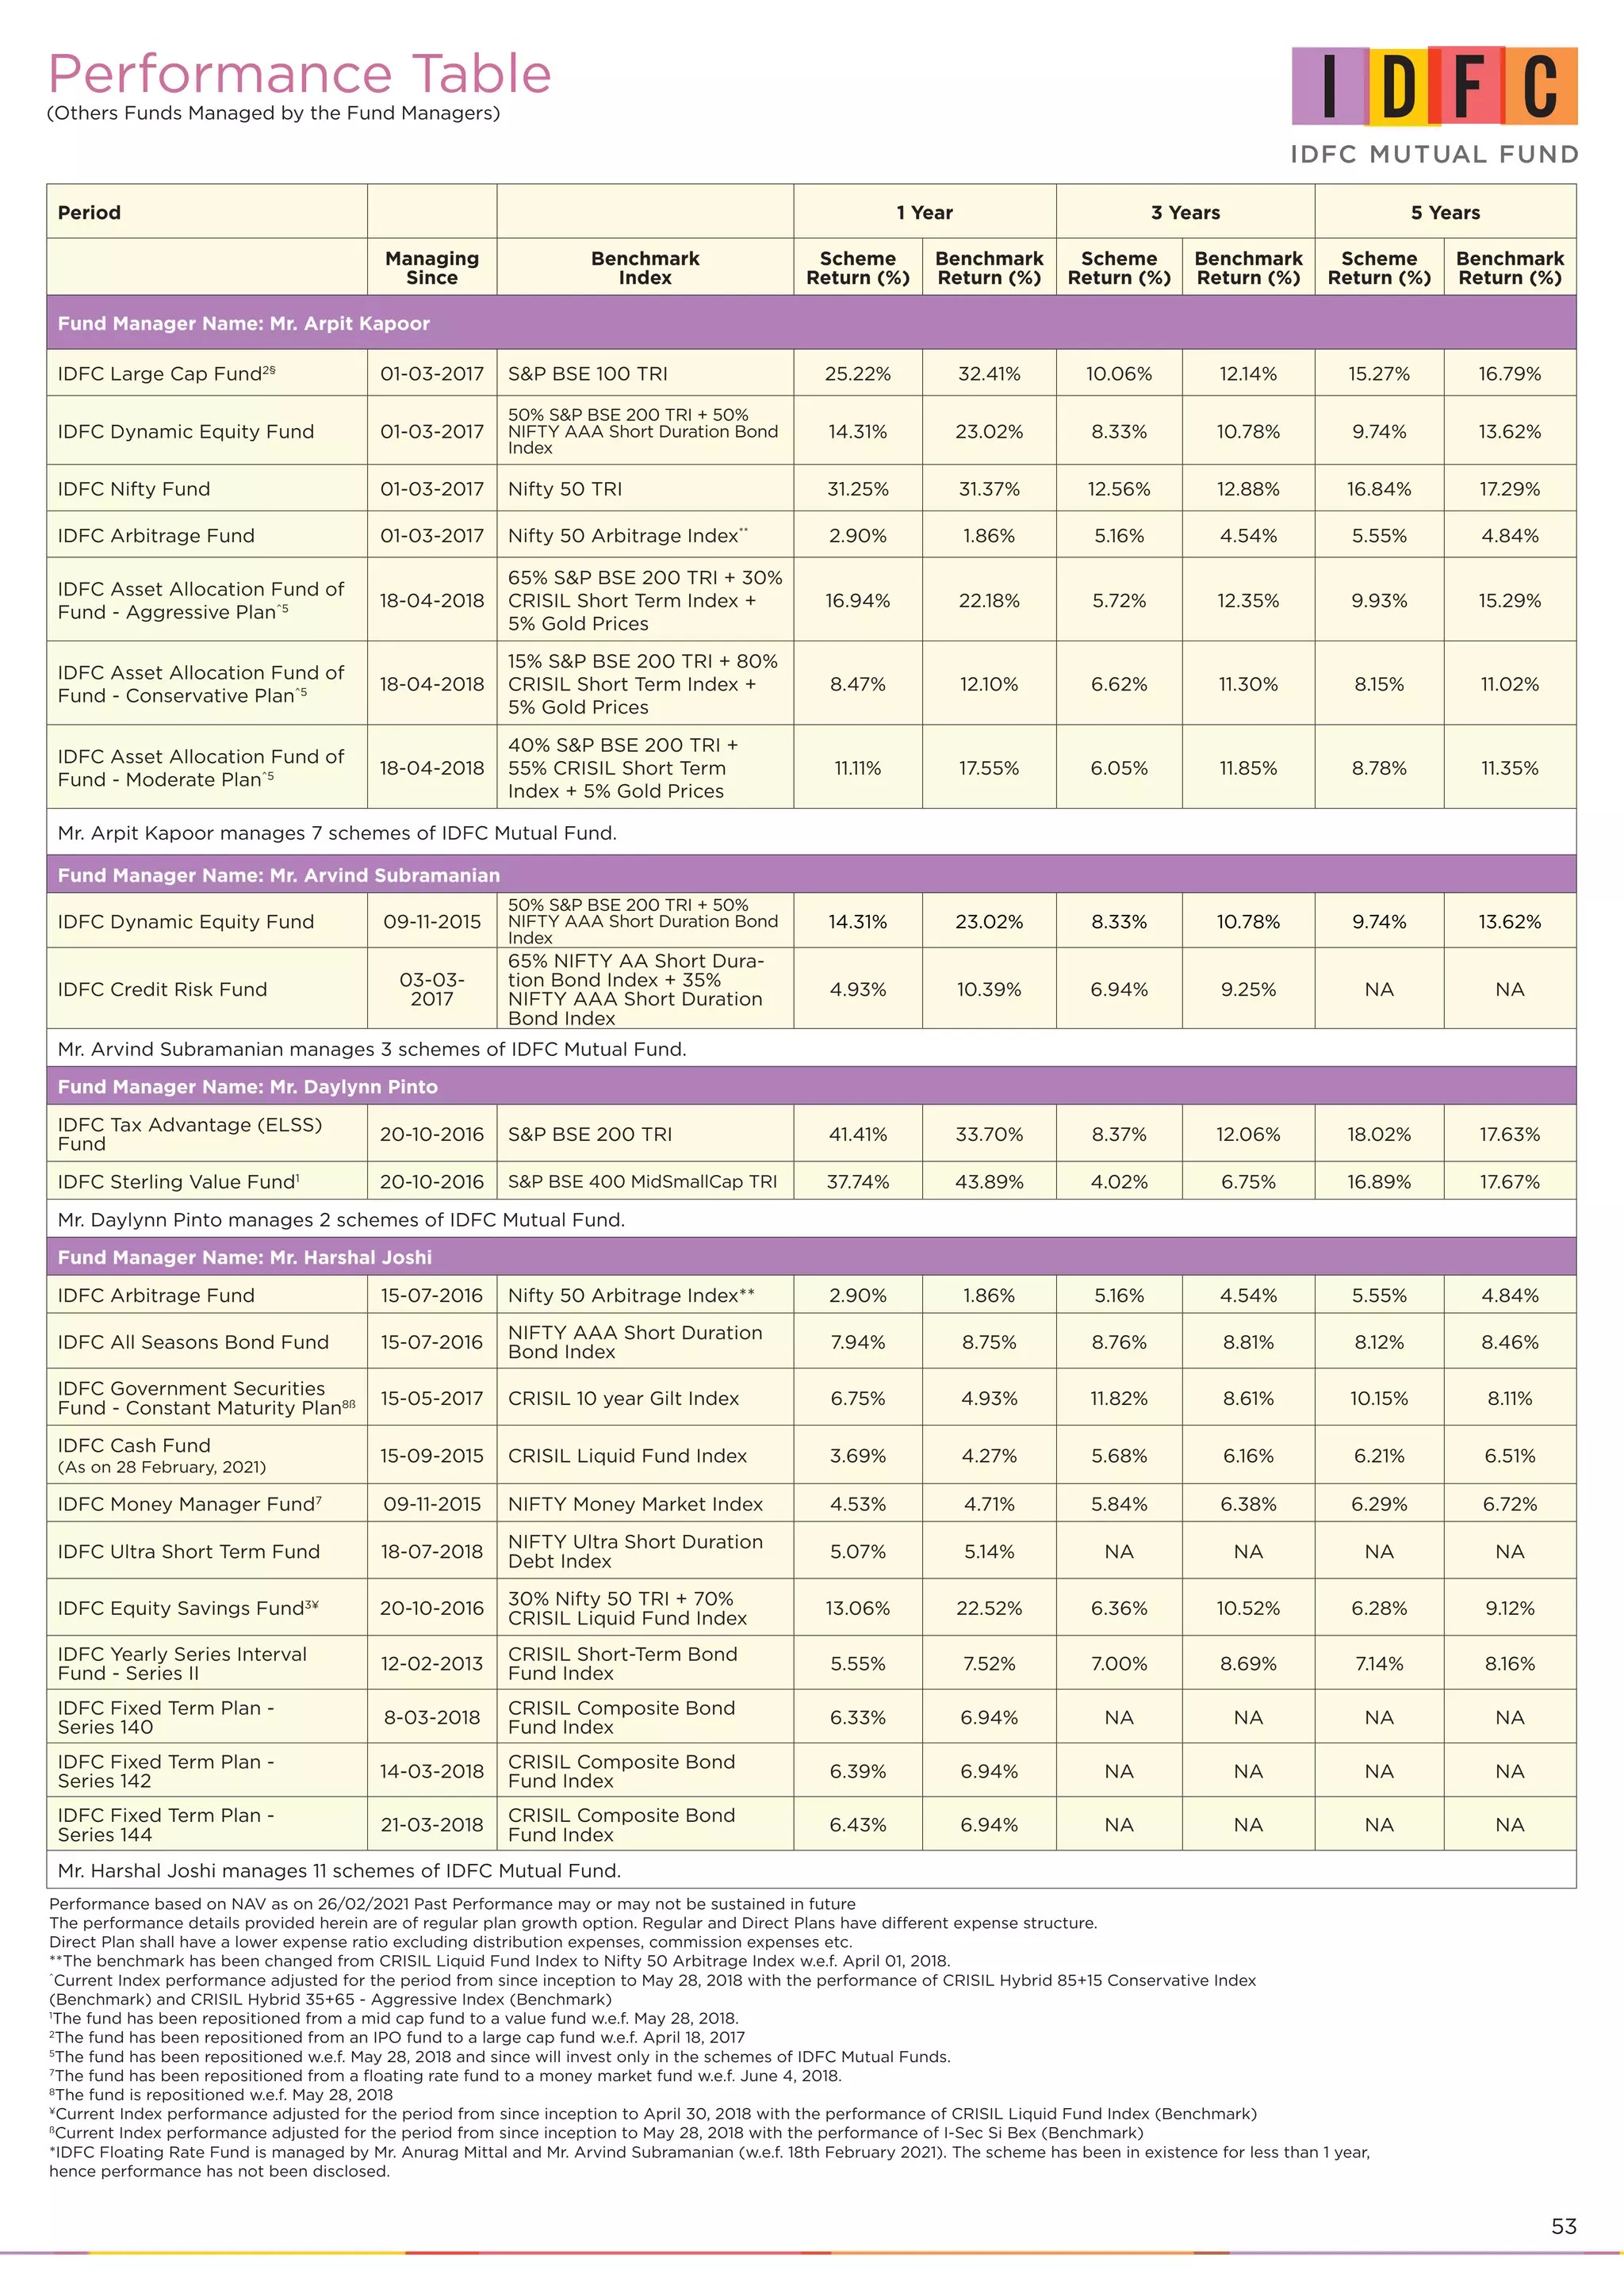
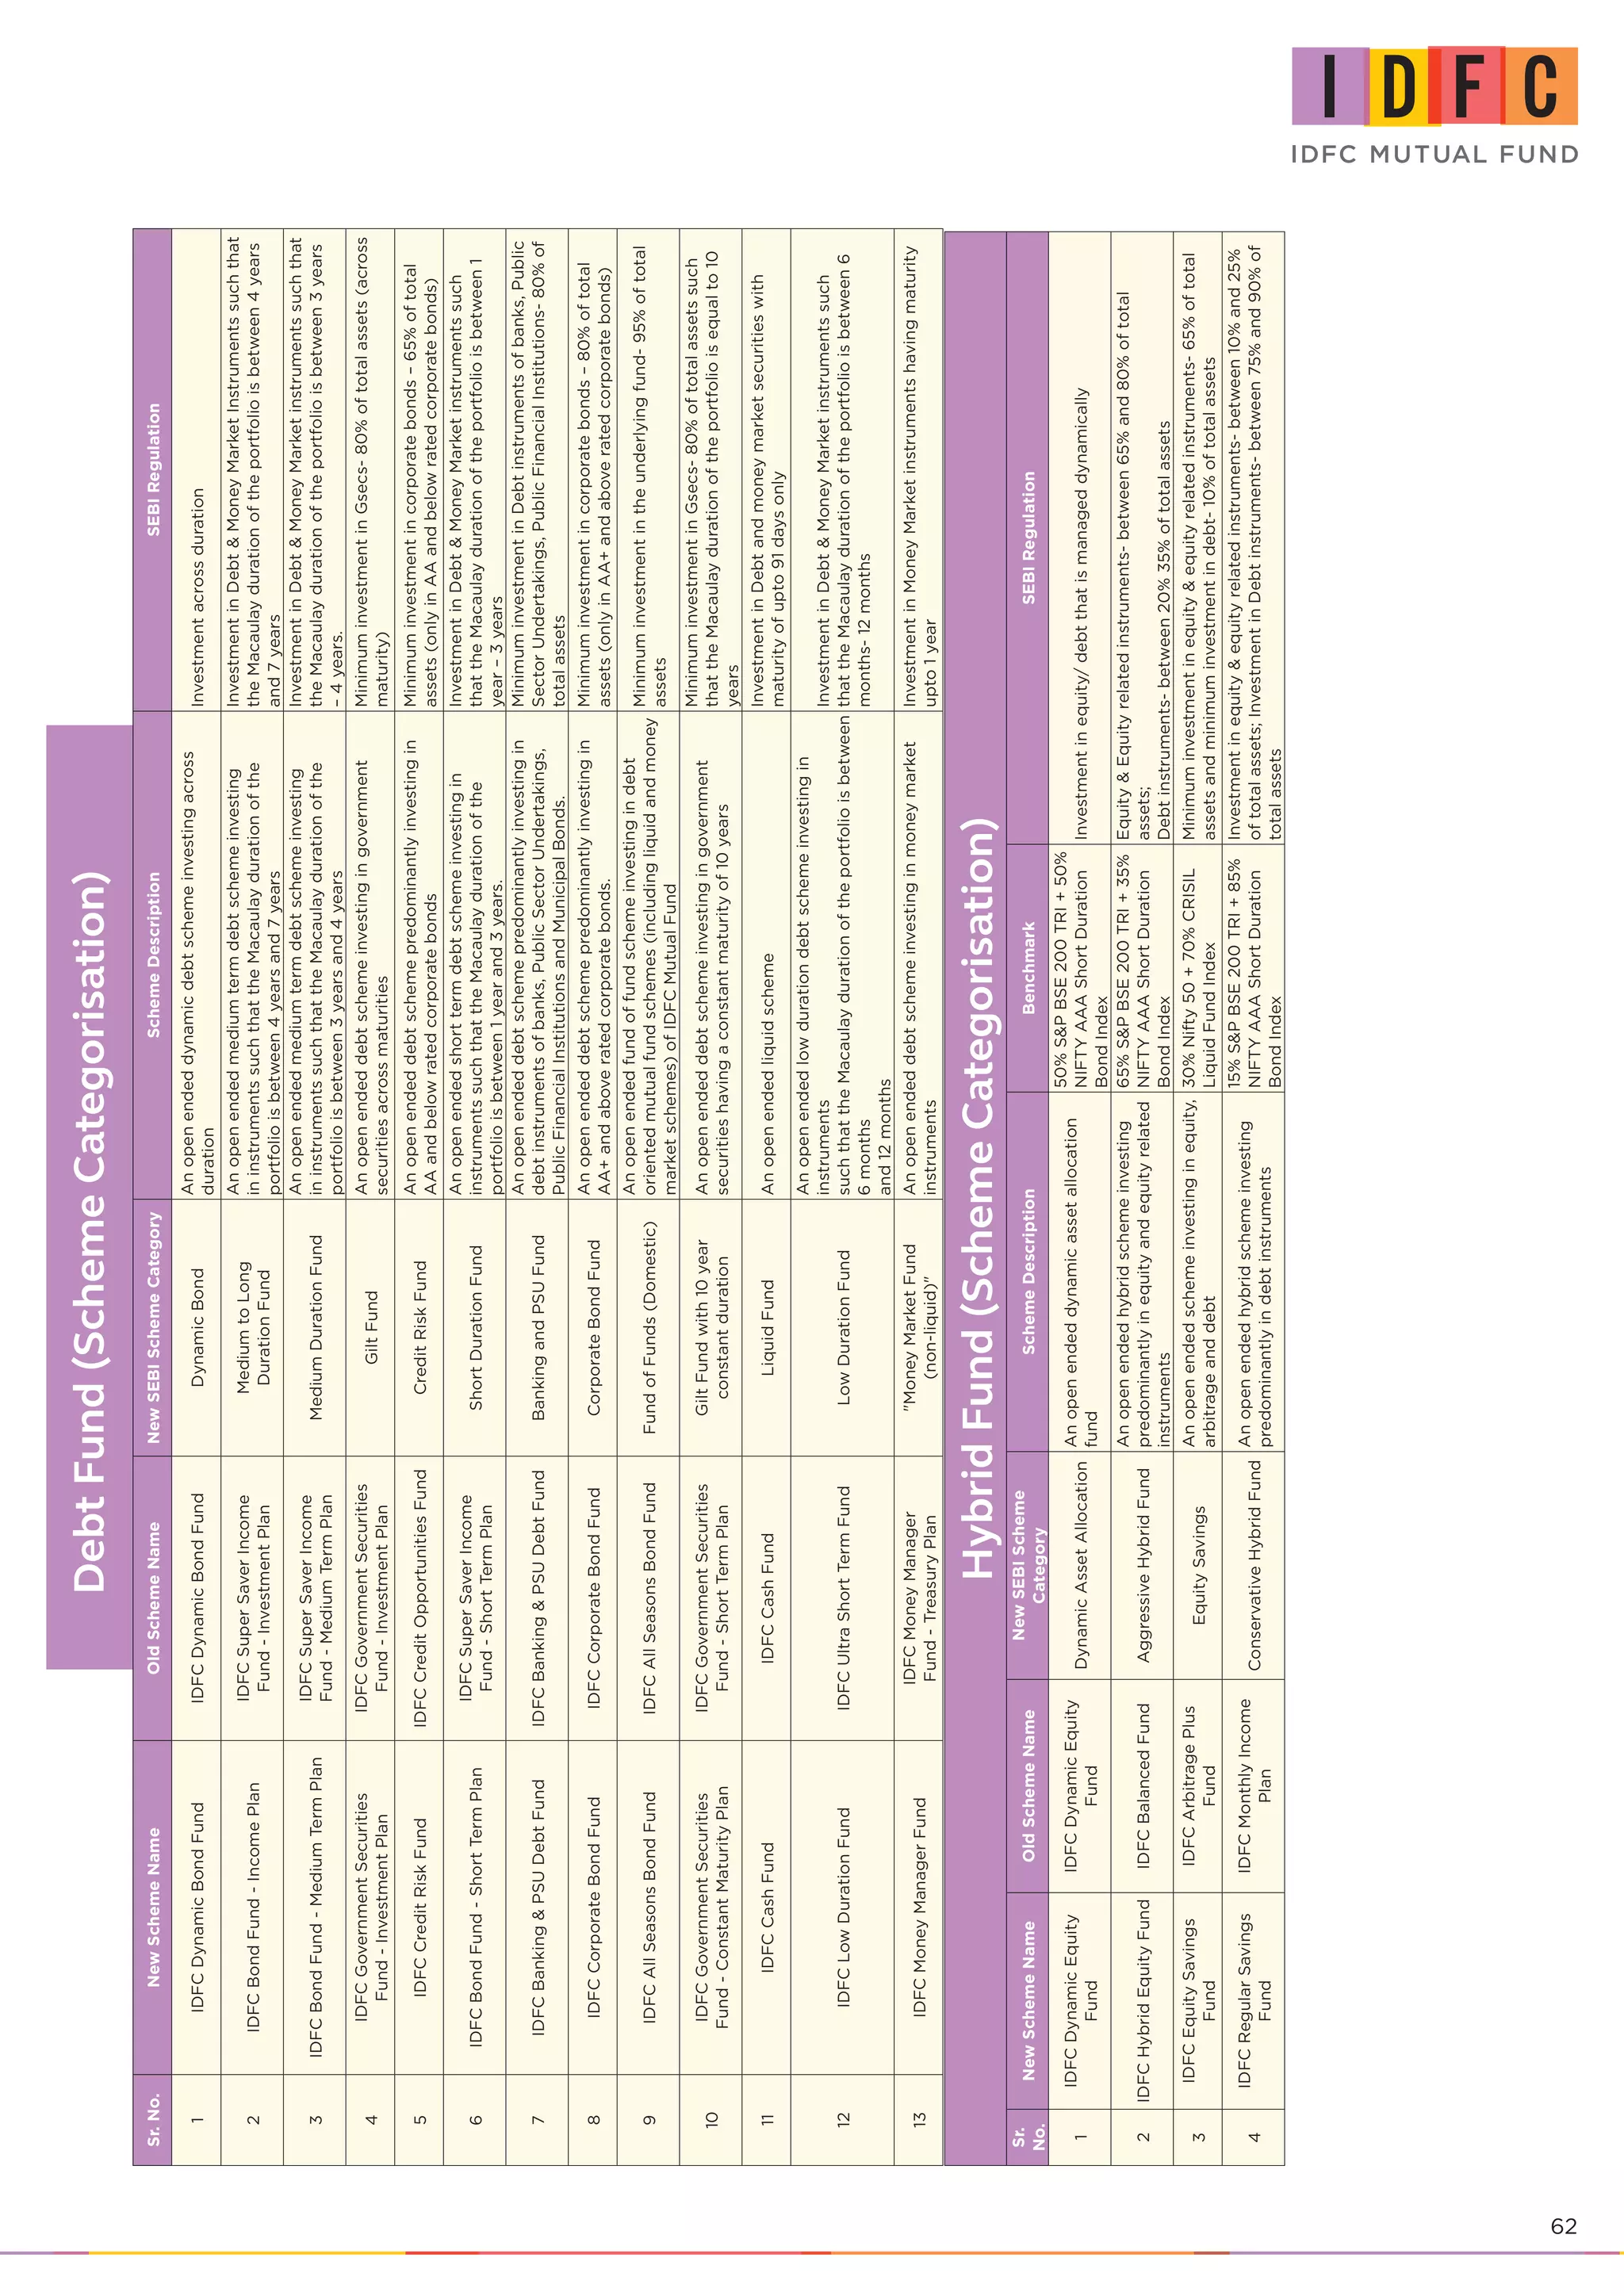
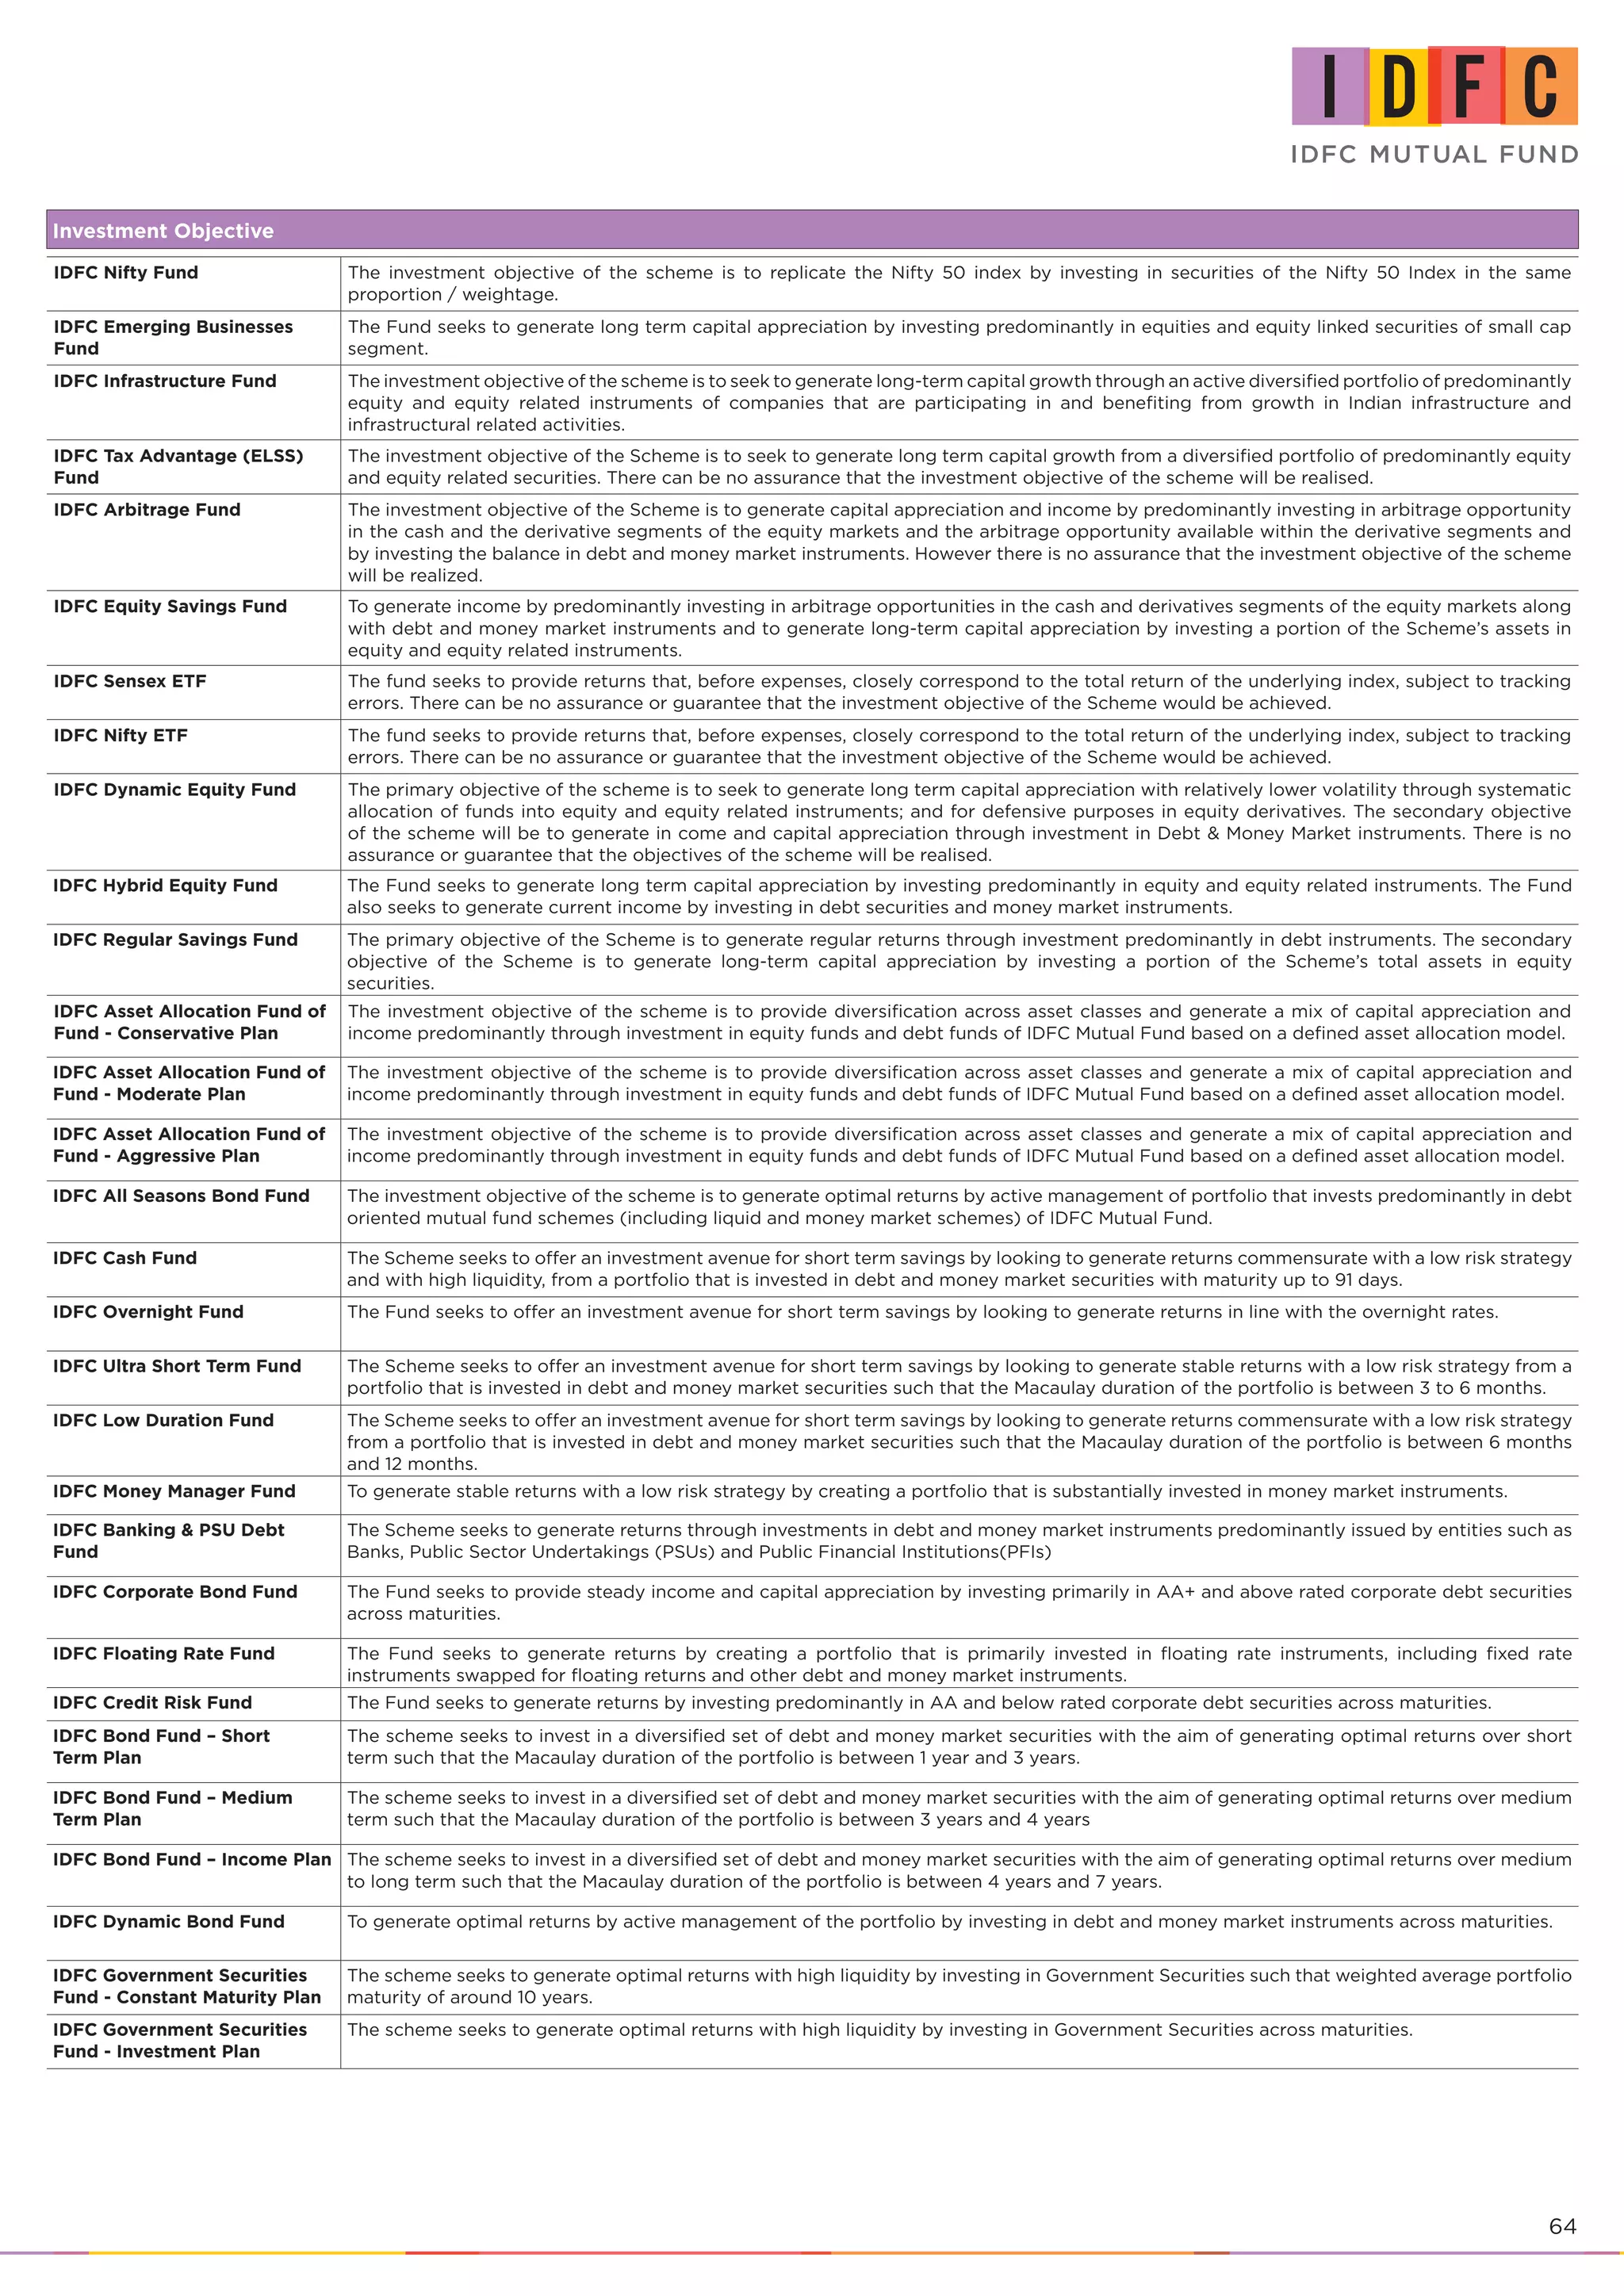
This document provides an overview of IDFC Mutual Fund schemes as of February 28, 2021. It includes details on the investment objective, style and framework for 17 equity funds, 7 hybrid/fund of funds, and 12 debt funds. Performance metrics like month-end AUM, top 10 holdings, sector allocation and fund managers are provided for each scheme. Commentary on the equity and debt market outlook is also included.


![@IDFCAMC IDFC Mutual Fund
IDFC
C M IDFC Mutual Fund
ual Fund
Mutu IDFC
C Mutu
WEST
Ahmedabad B Wing, 3rd Floor, Chandan House Opp Gruh Finance, Mithakhali Six Roads, Law Garden, Tel.:079-26460923/925
Ahmedabad 380006.
Bhopal Plot No. 49, First Floor, Above Tata Capital Limited, M P Nagar, Zone II, Bhopal [M.P.] - 462011.
Bhilai 26, Commercial Complex, Nehru Nagar (East), Bhilai, Chhattisgarh, Pin - 490020. Mobile No. 8871144134.
Goa F -27 & F -28, 1st Floor, Alfran Plaza, M.G Road, Opp. Don Bosco High School, Panjim - Goa. 403001,
Tel.: +91-0832-6631022.
Indore 405, 4th Floor, 21/ 1, D. M. Tower, Race Course Road, Indore - 452 001. Tel.: +91-731-4206927/ 4208048.
Fax: +91-731-4206923.
Mumbai
Mumbai
(Borivali)
6th Floor, One World Center, Jupiter Mills Compound, 841 Senapati Bapat Marg, Mumbai - 400013.
Tel No. 6628 9999
Ground Floor, Kapoor Apartment CHS, Near Punjabi lane, Chandavarkar Road, Borivali (West), Mumbai -
400092. Tel.: 022 48794555.
Mumbai
(Churchgate)
Unit No. 27, Ground Floor, Khetan Bhavan, 198, Jamshedji Tata Road, Churchgate, Mumbai-400020.
Tel.:+912266289999.
Mumbai
(Ghatkopar)
Mumbai
(Thane)
Office No. 308, Zest Business Spaces, M. G. Road, Ghatkopar (East), (Maharashtra) Mumbai- 400077.
Shop No. 1, Konark Towers, Ghantali Devi Road, Thane (West) 400602.
Nagpur Fortune Business Centre, First Floor, 6, VasantVihar, W. H. C. Rd., Shankar Nagar, Nagpur - 440 010.
Tel.: +91-712-6451428/ 2525657.
Nasik Shop No - 6, Rajvee Enclave, New Pandit Colony, Off Sharanpur Road, Nasik - 422002. Tel.: 0253-2314611.
Pune 1st Floor, Dr. Herekar Park Building, Next to Kamala Nehru Park, Off. Bhandarkar Road, Pune - 411 004.
Tel.: +91-20-66020965/ 4.
Raipur T-19,III Floor, Raheja Tower, Near Hotel Celebration, Jail Road, Raipur (C G) - 492001. Tel: 0771-2526606.
Mobile: +91 9589838890.
Rajkot “Star Plaza”, 2nd Floor, Office No. 201, Phulchab Chowk, Rajkot - 360 001. Tel.: +91-281-6620921 / 2475237.
Surat HG-12, Higher Ground Floor, International Trade Centre,Majura Gate Crossing, Ring Road, Surat - 395 002.
Tel.: +91-261-2475060, 2475070.
Vadodara 301, 2nd Floor, Earth Complex, Opposite Vaccine Ground, Above Indian Overseas Bank, Old Padra Road,
Vadodara - 380015. Tel No.: 0265 - 2339623/2339624/2339325.
Jaipur 301-A, 3rd Floor, Ambition Tower, Agersen Circle, Malan Ka Chaurah, Subash Marg, C-Scheme, Jaipur - 302 001.
Tel. No. : +91-0141- 2360945, 2360947, 2360948
NORTH
Agra Office No. 307A, 3rd Floor, Block #38/4A, Sumriddhi Business Suites, Sanjay Place, Agra - 282 002.
Tel.:+91- 562-4064889
Amritsar Unit No. SF-1, 2nd Floor, Eminent Mall, Mall Road, Amritsar - 143001. Tel.:+911835030393.
Chandigarh SCO 2469 - 70, 1st Floor, Sector 22C, Chandigarh - 160 022. Tel.: +91 17 2507 1918 / 5071919,
Fax: +91-172-5071918.
Dehradun G-12 B NCR Plaza, Ground Floor, 24 A, 112/28, Ravindranath Tagore Marg, New Cantt Road, Dehradun-248001.
Mobile: 9897934555, 8171872220
Jalandhar 1st floor, Satnam Complex, BMC Chowk, G.T.Road, Jalandhar-144001. Punjab-India. Tel.: 01815018264.
Kanpur Office No. 214-215, IInd Floor, KAN Chambers, 14/113, Civil Lines, Kanpur - 208 001. Tel.: +91-512-2331071,
2331119.
Lucknow 1st floor, Aryan Business Park, Exchange Cottage, 90.M.G. Marg, Park Road, Lucknow-226001, Mob: 9792999940,
Tel.: 0522-4928100 - 106, 0522-6888012
Allahabad S. N. Tower, 2nd Floor, 4C, Maharshi Dayanand Marg, Opp. Radio Station, Civil Lines, Allahabad - 211 001.
Mobile: 9026582330
Ludhiana SCO 124, 1st Floor, Feroze Gandhi Market, Ludhiana - 141 001. Tel.: 0161-5022155/ 56/ 57.
New Delhi 4th Floor, NarainManzil, 23, Barakhamba Road, New Delhi - 110 001. Tel.: +91-11-47311301/ 02/ 03/ 04/ 05.
Varanasi IDFC Asset Management Co. Ltd. 3rd Floor, Premise No. D-64/127, CH, Arihant Complex, Sigra Varanasi - 221010
(U.P). Phone No. 05422226527
Gurugram 117, 1st Floor, Vipul Agora, M. G. Road, Gurugram - 122 001. Ph: 011-47311336.
Pitampura,
Delhi
IDFC AMC LTD., Shop No. 01 and 02, Ground Floor, Pearls Best Heights-II, Plot No. C-9, Pitampura, Delhi,
Contact Details - 011-47311347
SOUTH
Bengaluru 6th Floor, East Wing, Raheja Towers, #26 & 27, M. G. Road, Bengaluru - 560 001. Tel.: +91-80-43079000/ 01/
02/ 03, Fax - +91-80-43079009.
Chennai K4th Floor, Capitale Tower, 555 Anna Salai, Thiru Vi Ka Kudiyiruppu, Teynampet, Chennai - 600018,
Tamil Nadu. - 600 031. Tel.: +91-44-45644201/ 202.
Cochin 39/3993 B2, Gr. Floor, Vantage Point, VRM Rd, Ravipuram, Cochin - 682 016. Tel: +91-484-3012639/ 4029291,
Fax: +91-484-2358639.
Coimbatore A Complex , No. 49, Father Randy Street, Azad Road, R. S. Puram, Coimbatore - 641 002.
Hyderabad 3rd Floor, SB Towers, Banjara Hills Road No. 1, Nearby Nagarjuna Circle, Hyderabad -500 034
Madurai No.278, 1st Floor, Nadar Lane, North Perumal Maistry Street, Madurai - 625 001. Tel.: 0452-6455530.
Mangalore 1st Floor, Crystal Arcade, Balmatta Road, Hampankatta, Mangalore - 575001. Tel.: +91 8242980769.
EAST
Bhubaneswar Rajdhani House, 1st Floor, 77 Kharvel Nagar, Janpath, Bhubaneswar - 751001. Phone : 0674 6444252 / 0674
2531048 / 0674 2531148.
Guwahati 4E, 4th Floor, Ganapati Enclave, G. S. Road, Ulubari, Opp. Bora Service Station, Guwahati - 781 007. Mobile:
9207410763, 9207410764, 9207410765, 9207410766.
Jamshedpur IDFC Mutual Fund, Room No.111, 1st Floor, Yashkamal Complex, Main Road, Bistupur, Jamshedpur-831001, Ph No.
0657-2230112/111/222, Mobile No. : 9431102883.
Kolkata Oswal Chambers, 1st Floor, 2 Church Lane, Kolkata - 700 001. Tel.: +91-33-40171000/ 1005.
Patna 406, Ashiana Hariniwas, New Dakbanglow Road, Patna - 800 001. Tel.: +91-612-6510353.
Ranchi Shop No. 104 and 105, 1st Floor, Satya Ganga Arcade, Vinod Ashram Road, Ranchi - 834001.
Te.: 0651-221259/92.
Durgapur
(West Bengal)
6/2A, Suhatta, 6th Floor, City Centre, Durgapur - 713216. Phone No.: +91 8537867746.
Mutual Fund investments are subject to market risks, read all scheme related documents carefully.](https://image.slidesharecdn.com/factsheet-210317154555/75/IDFC-Flexi-Cap-Fund_Factsheet-66-2048.jpg)


