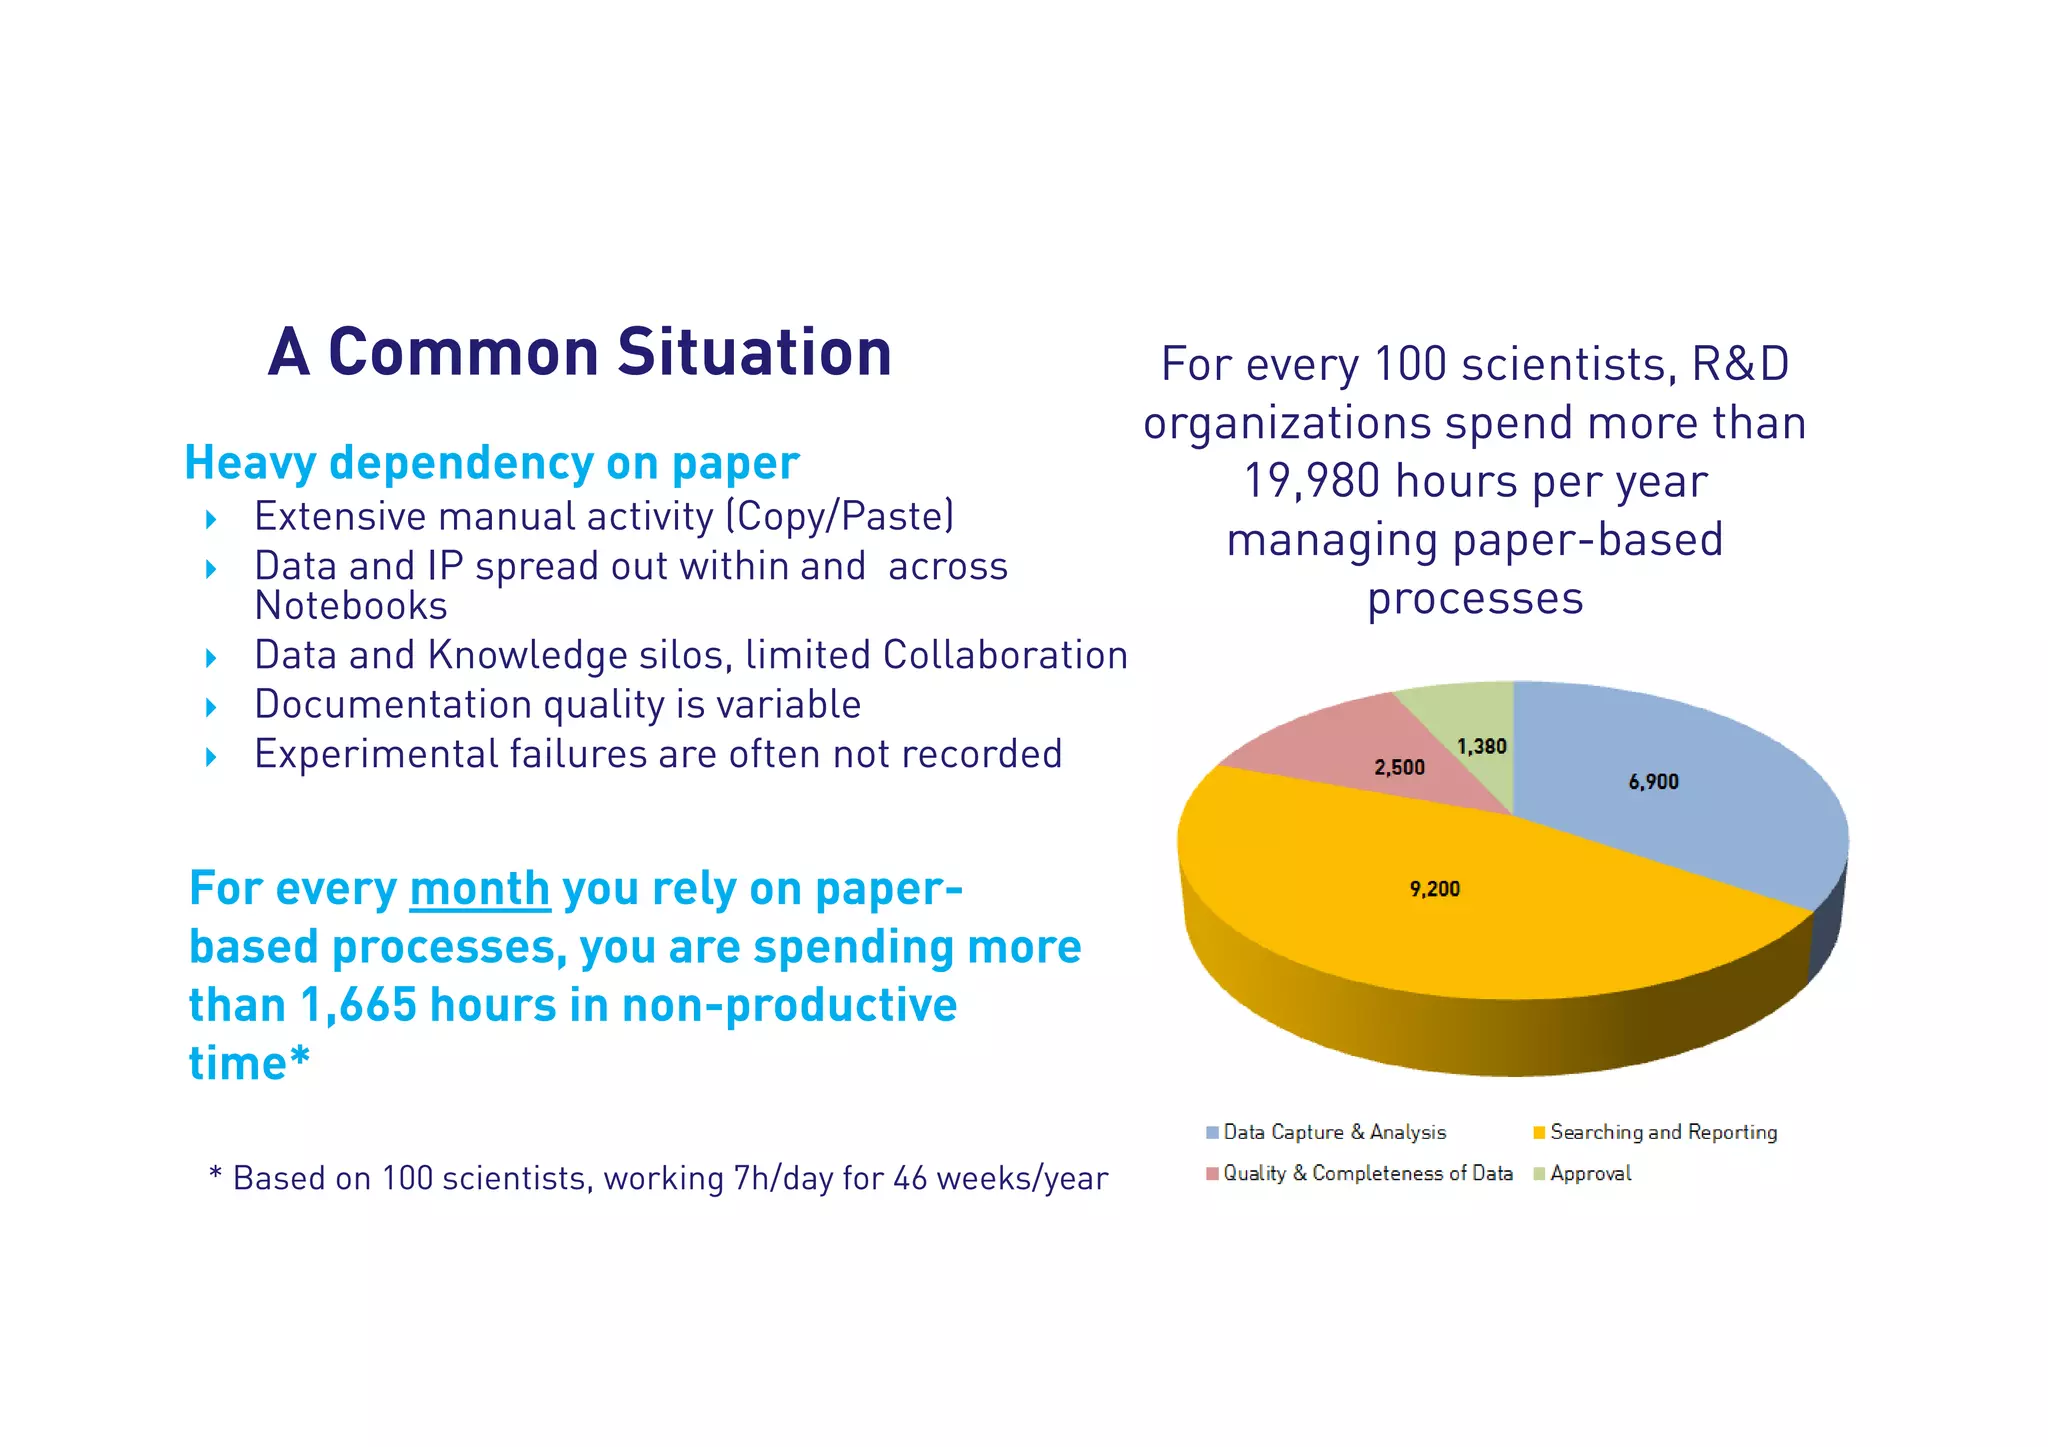
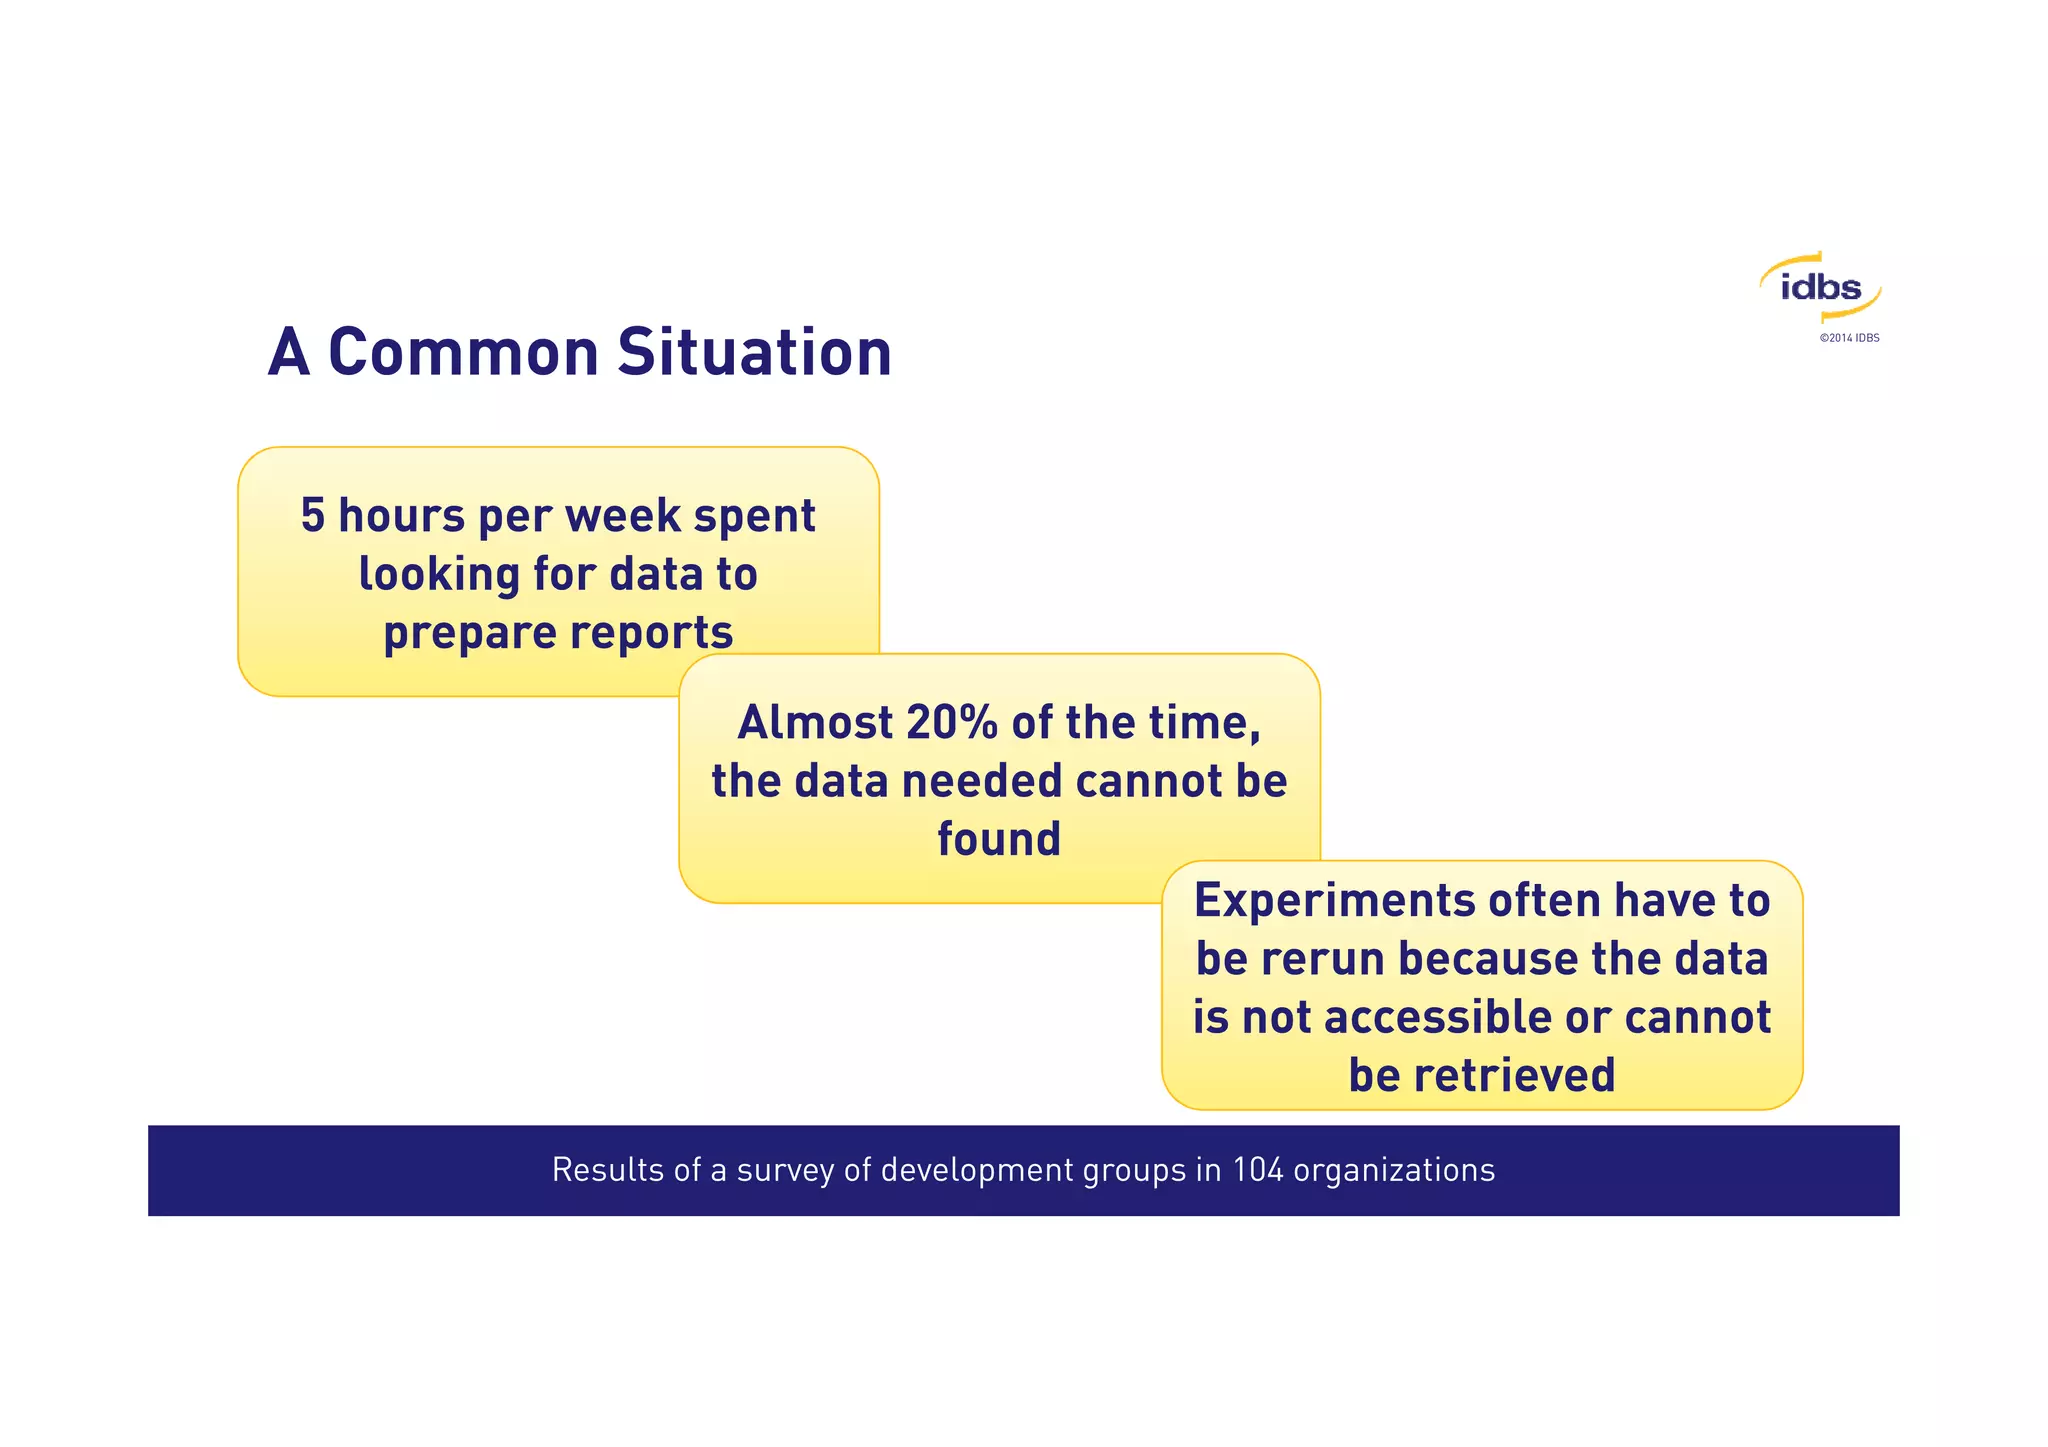
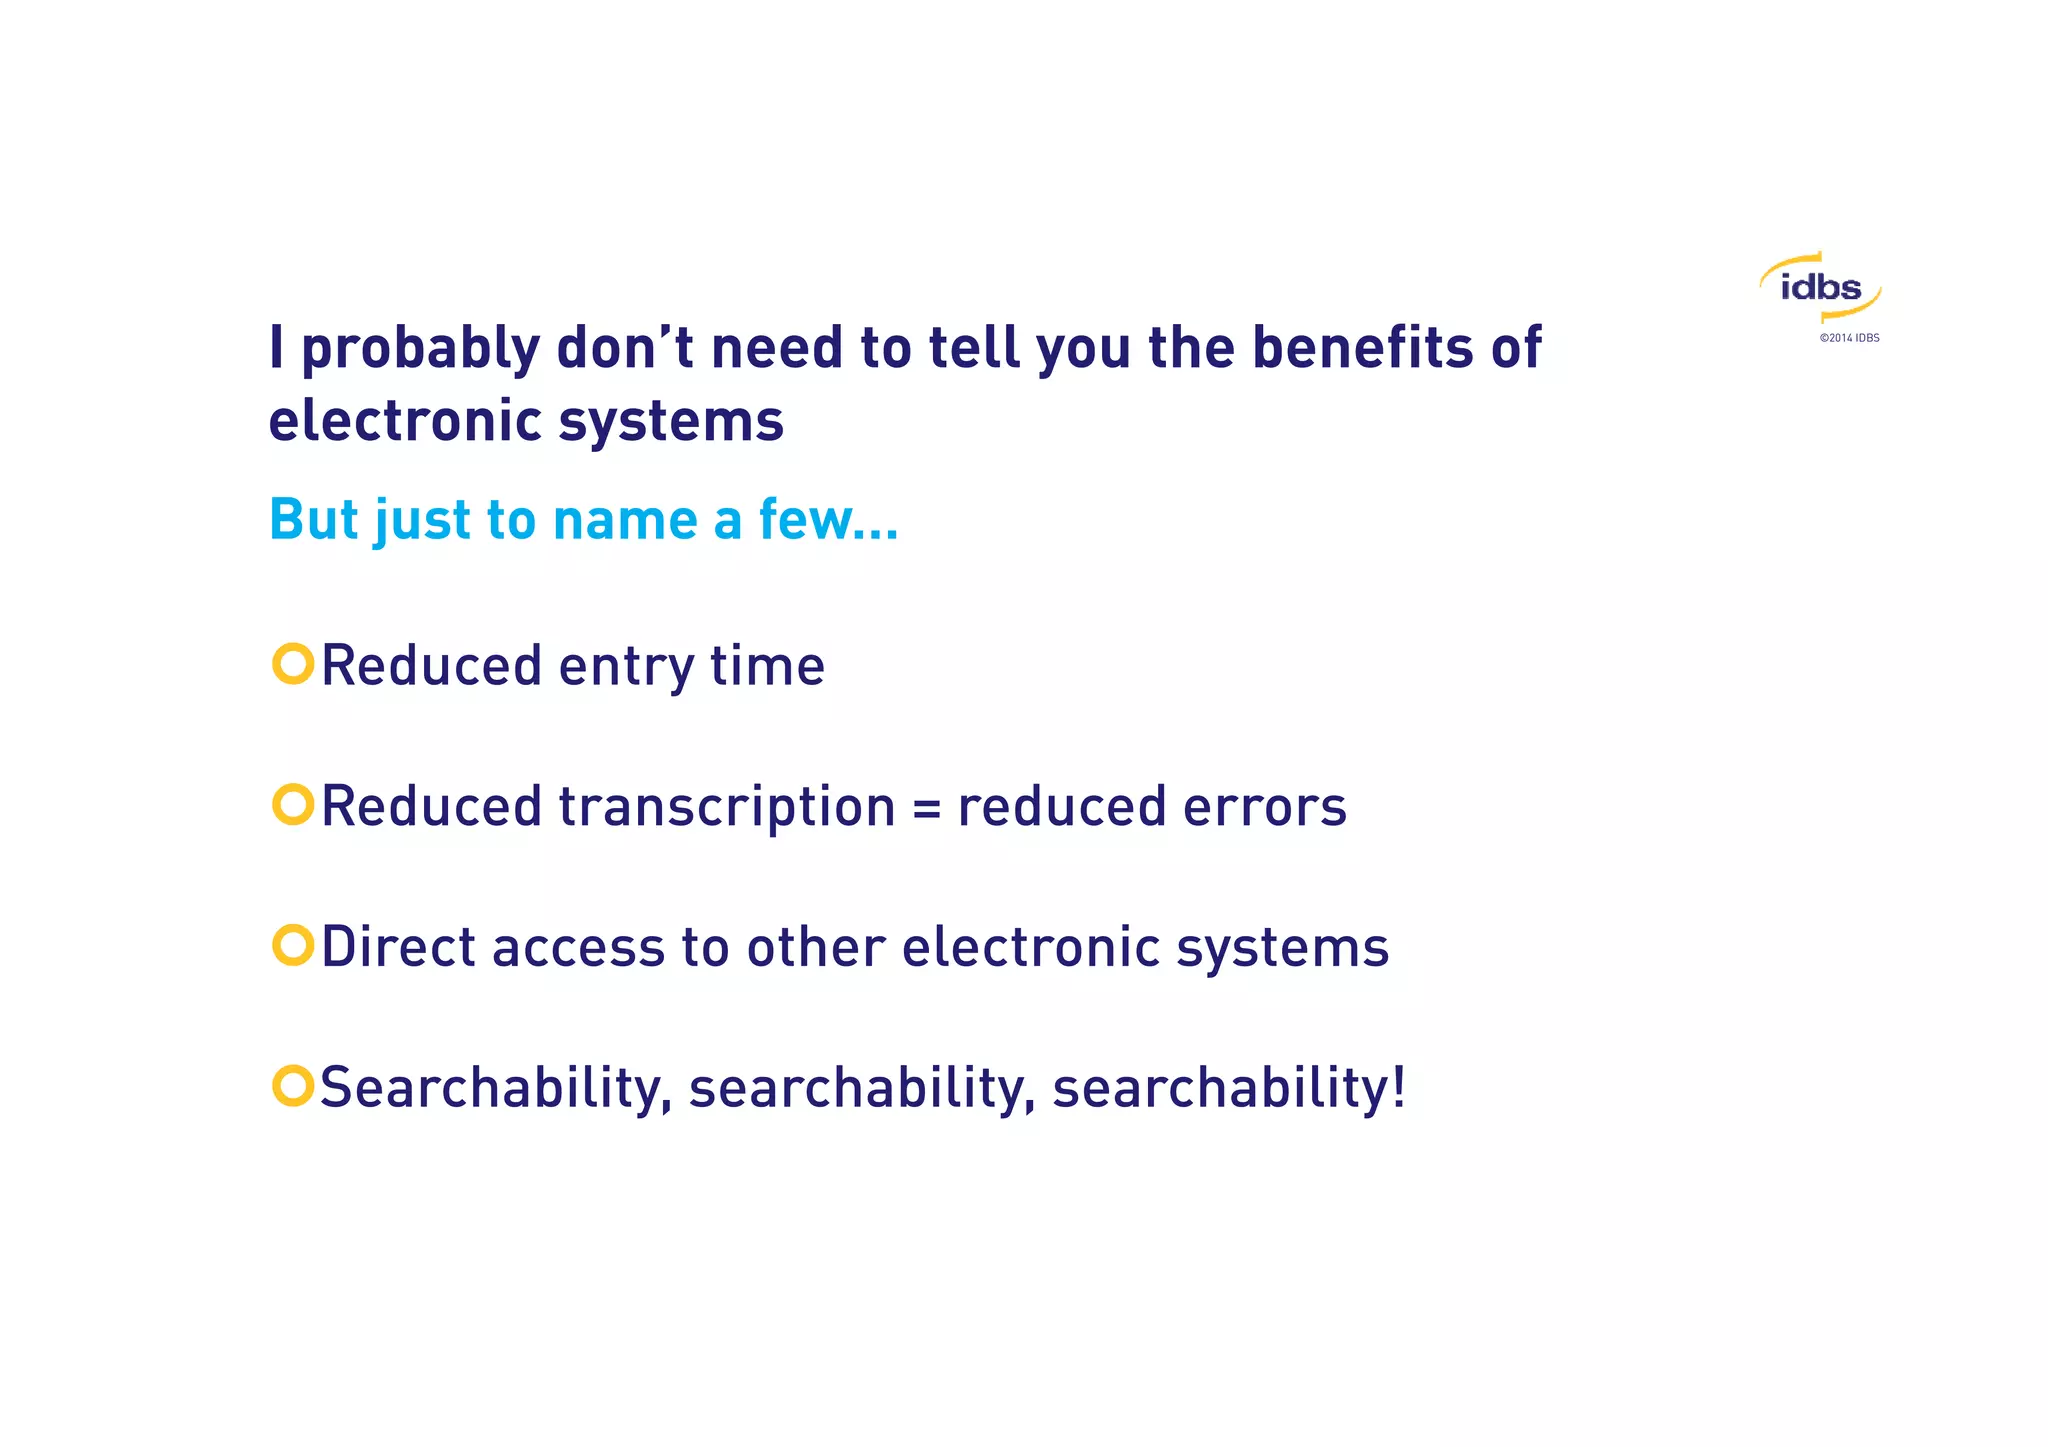
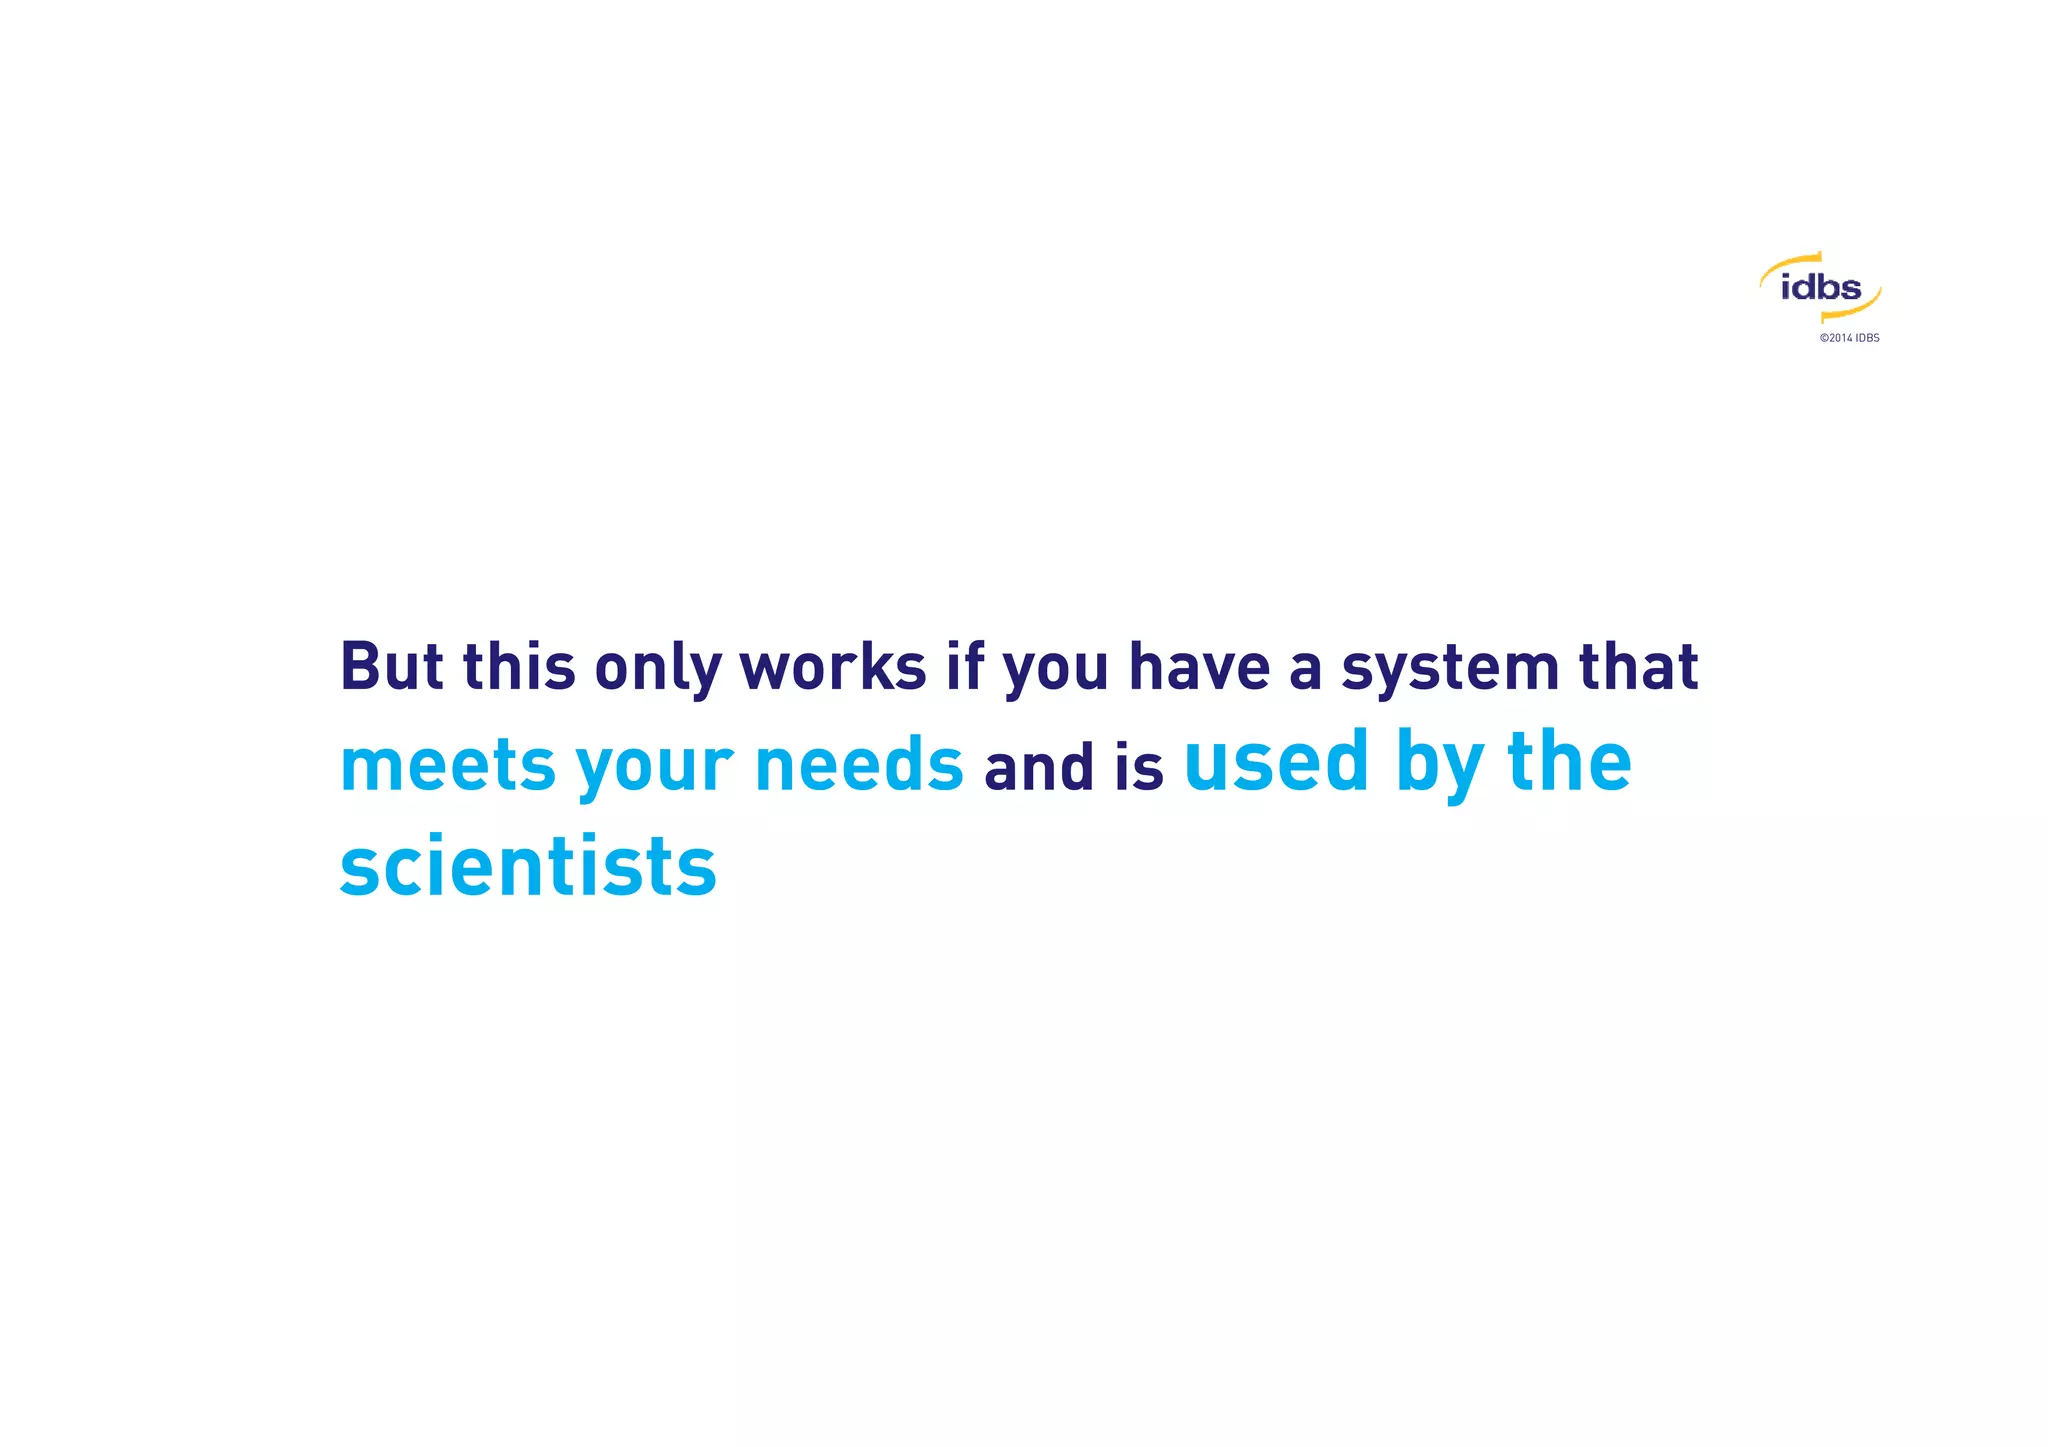
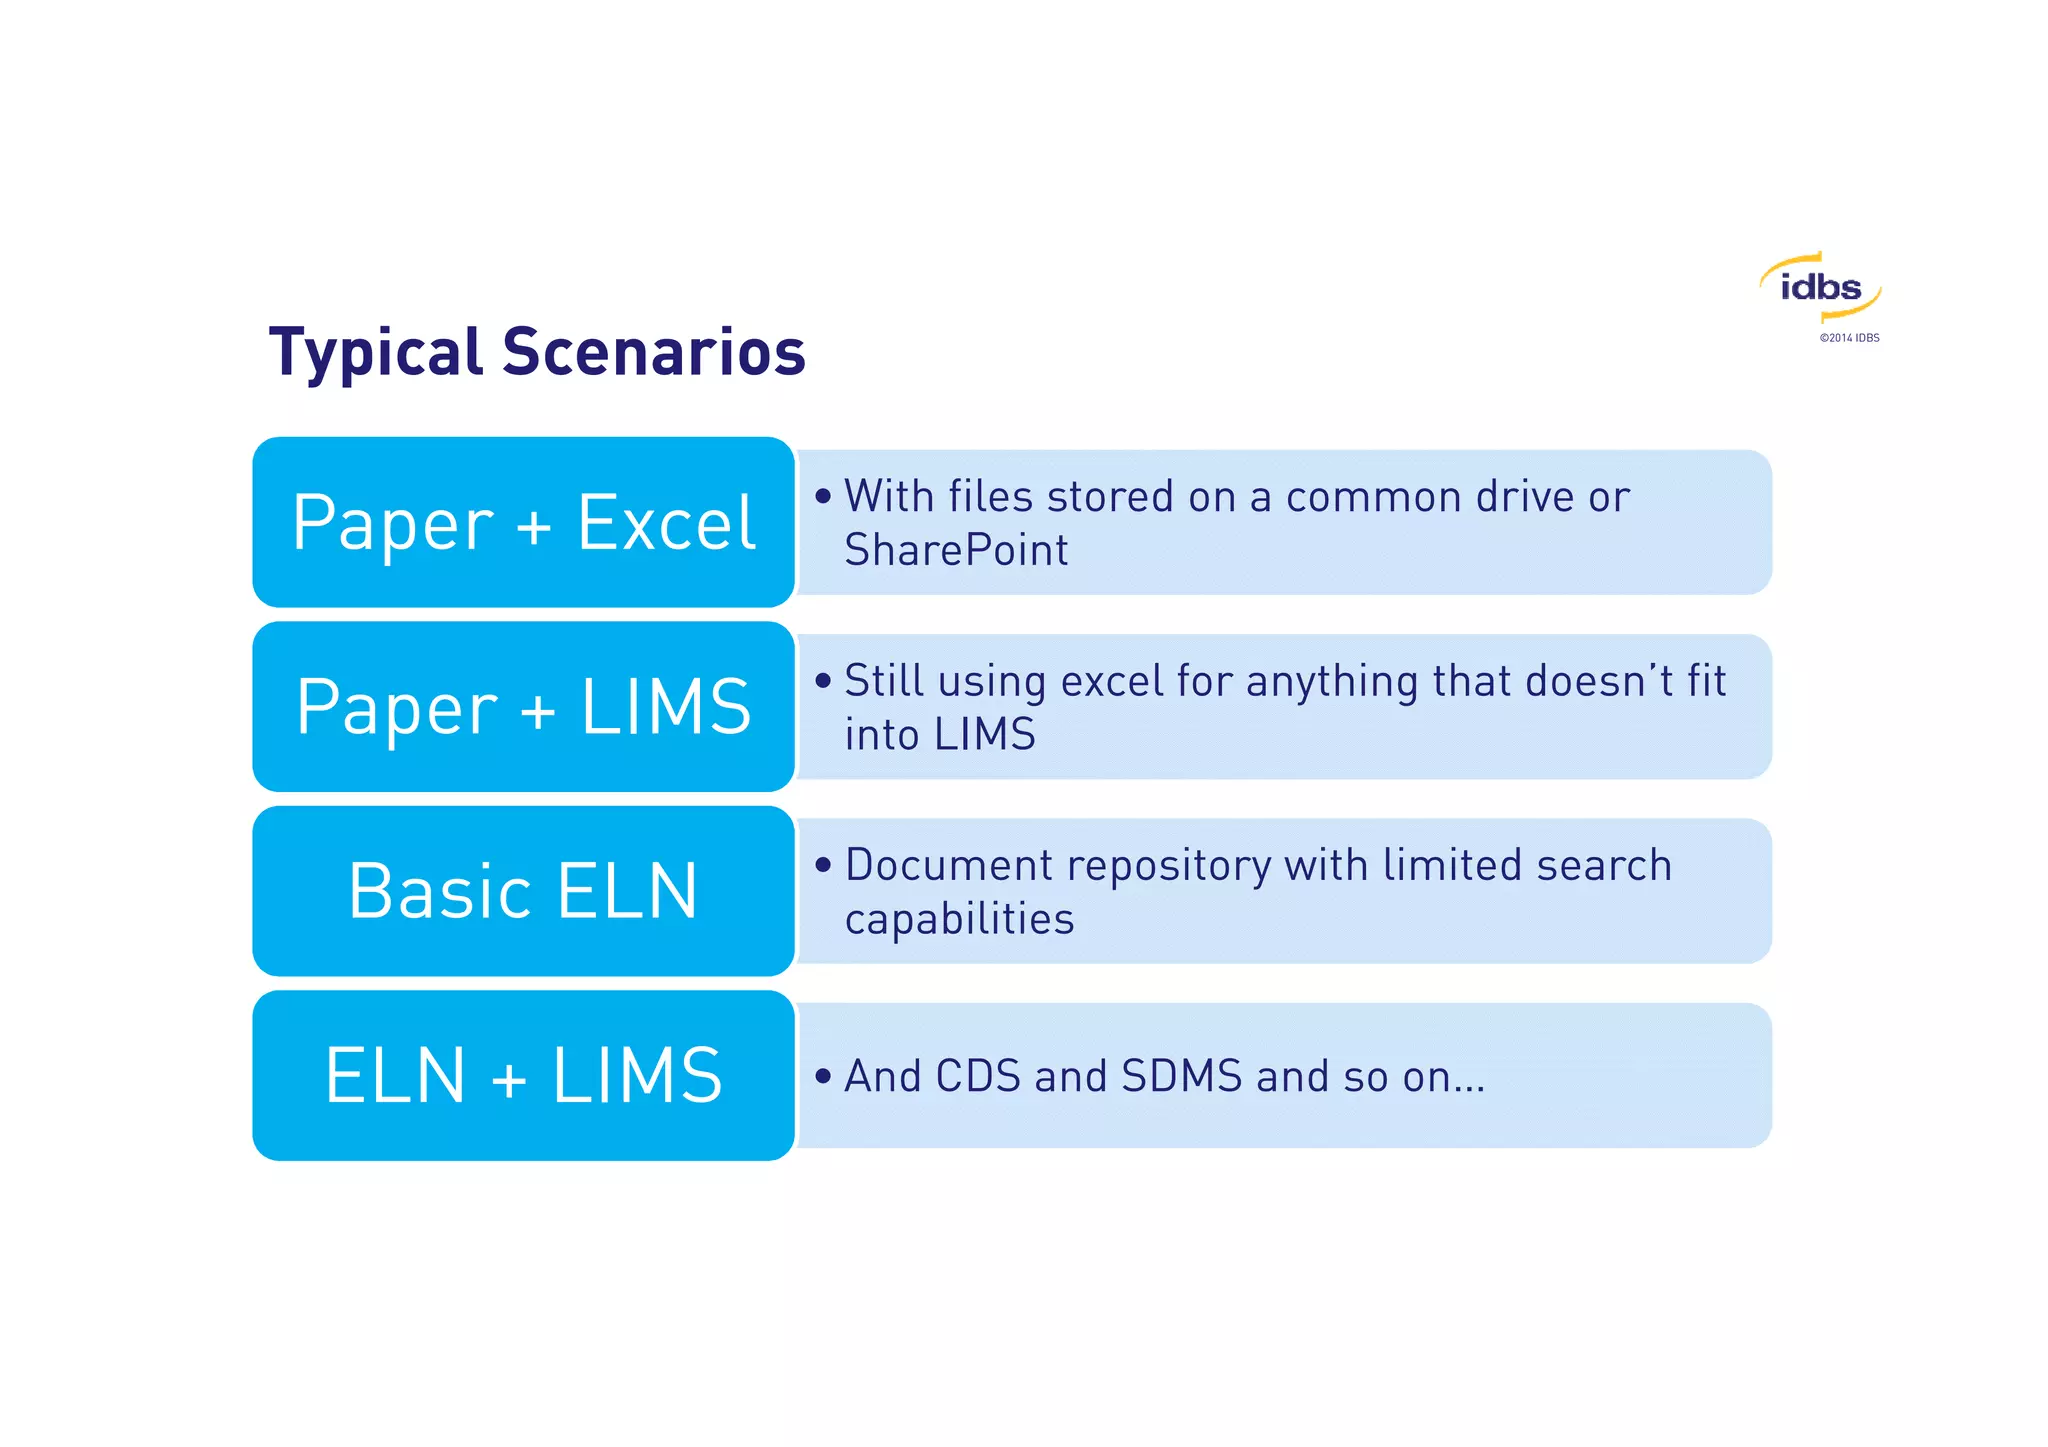
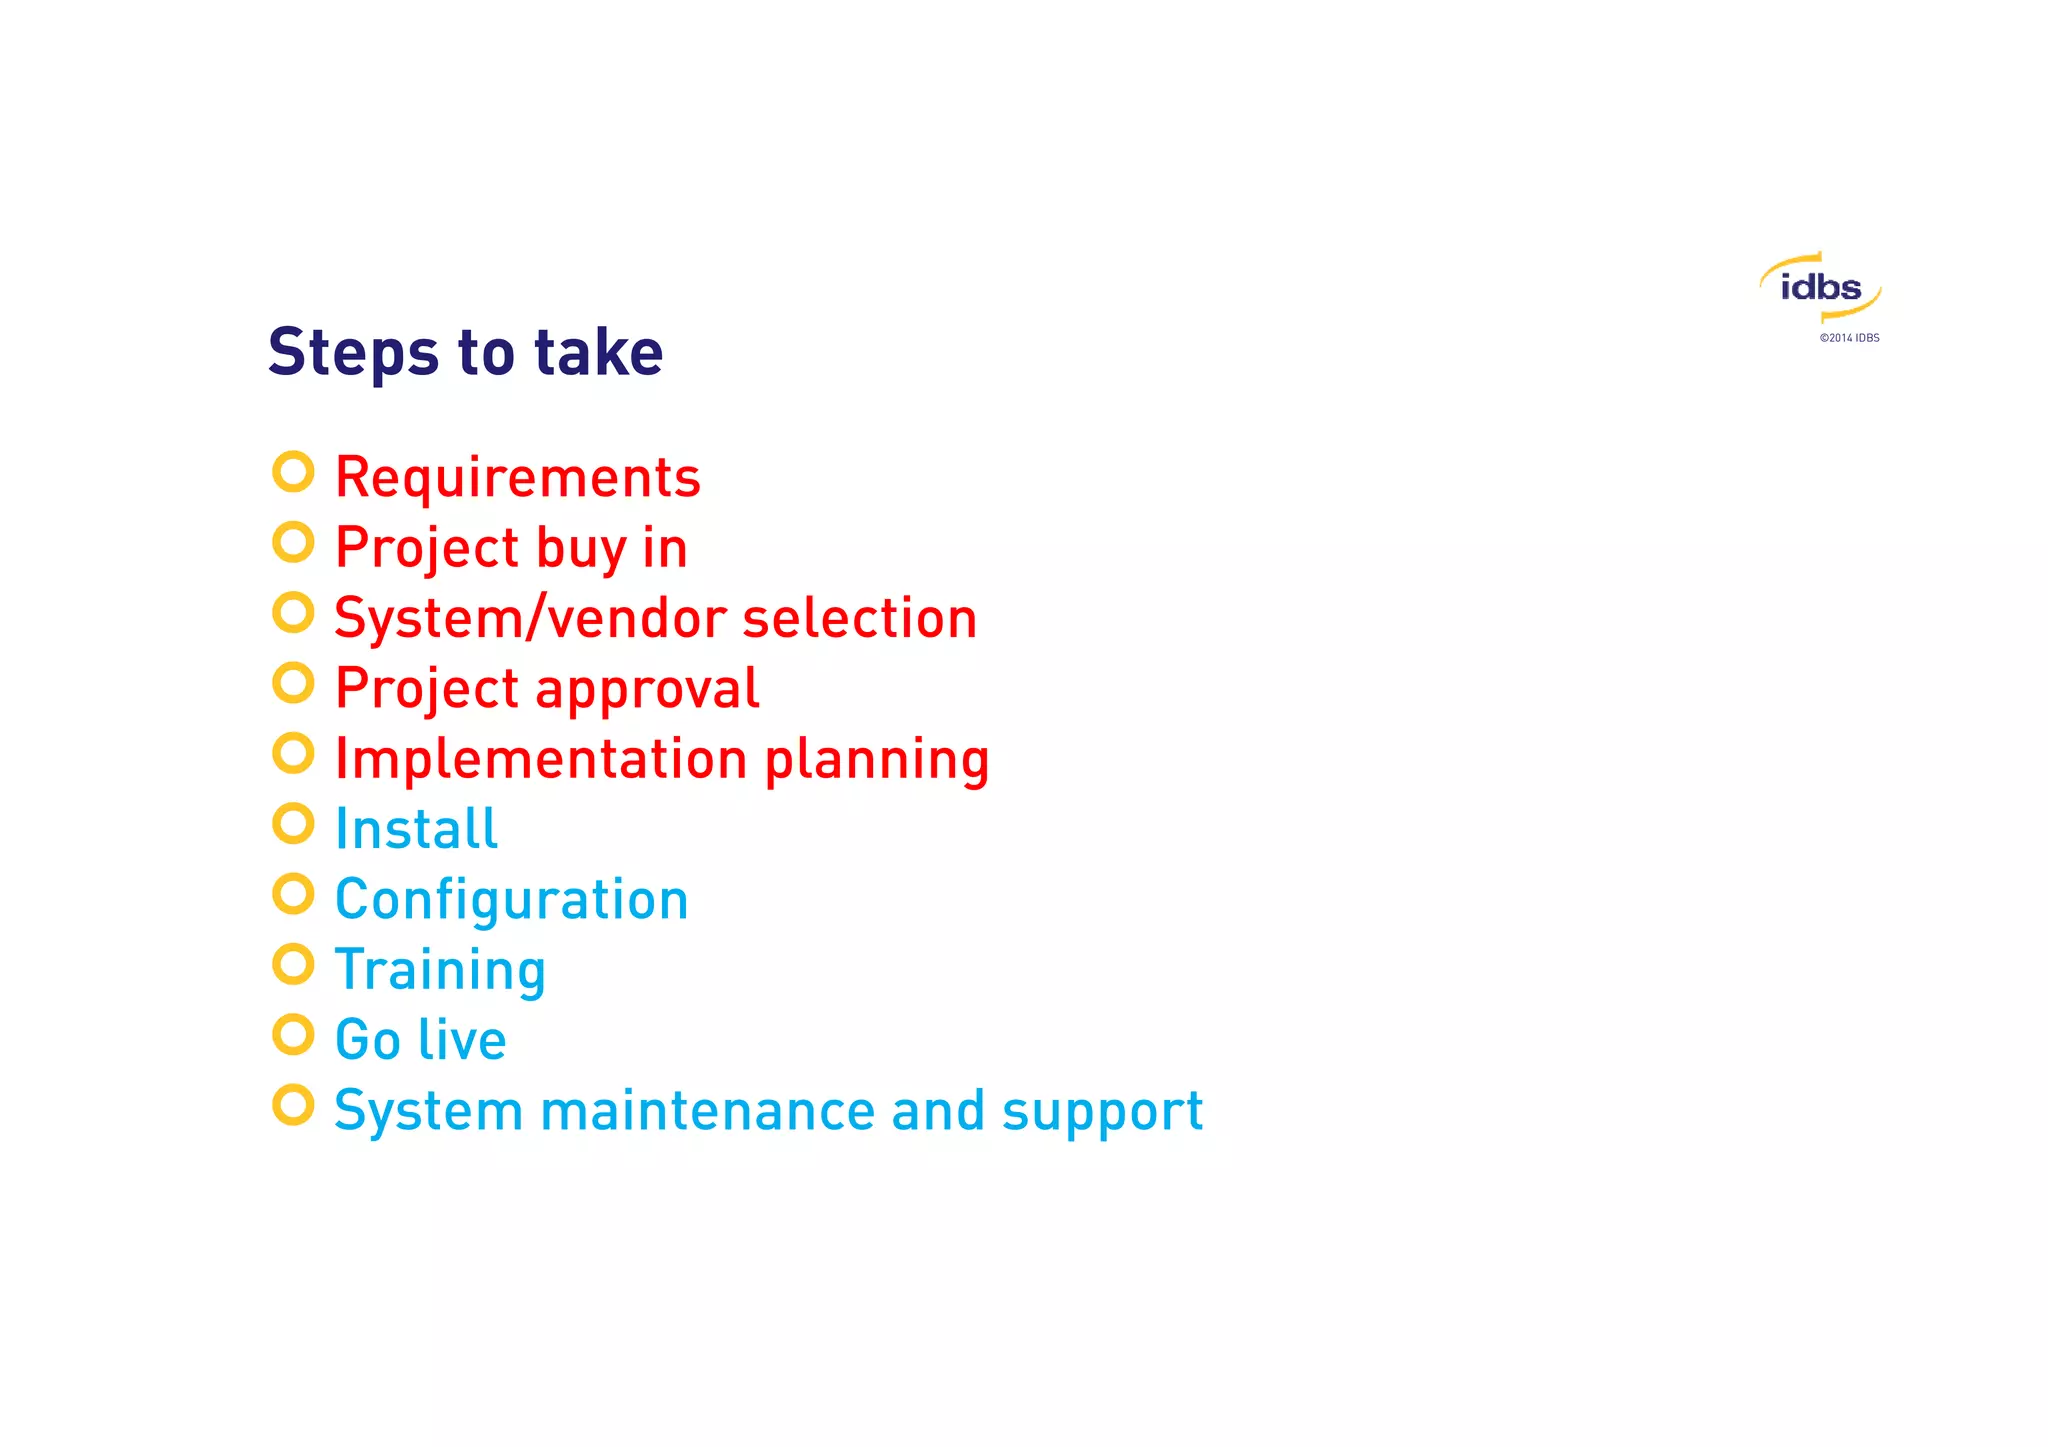
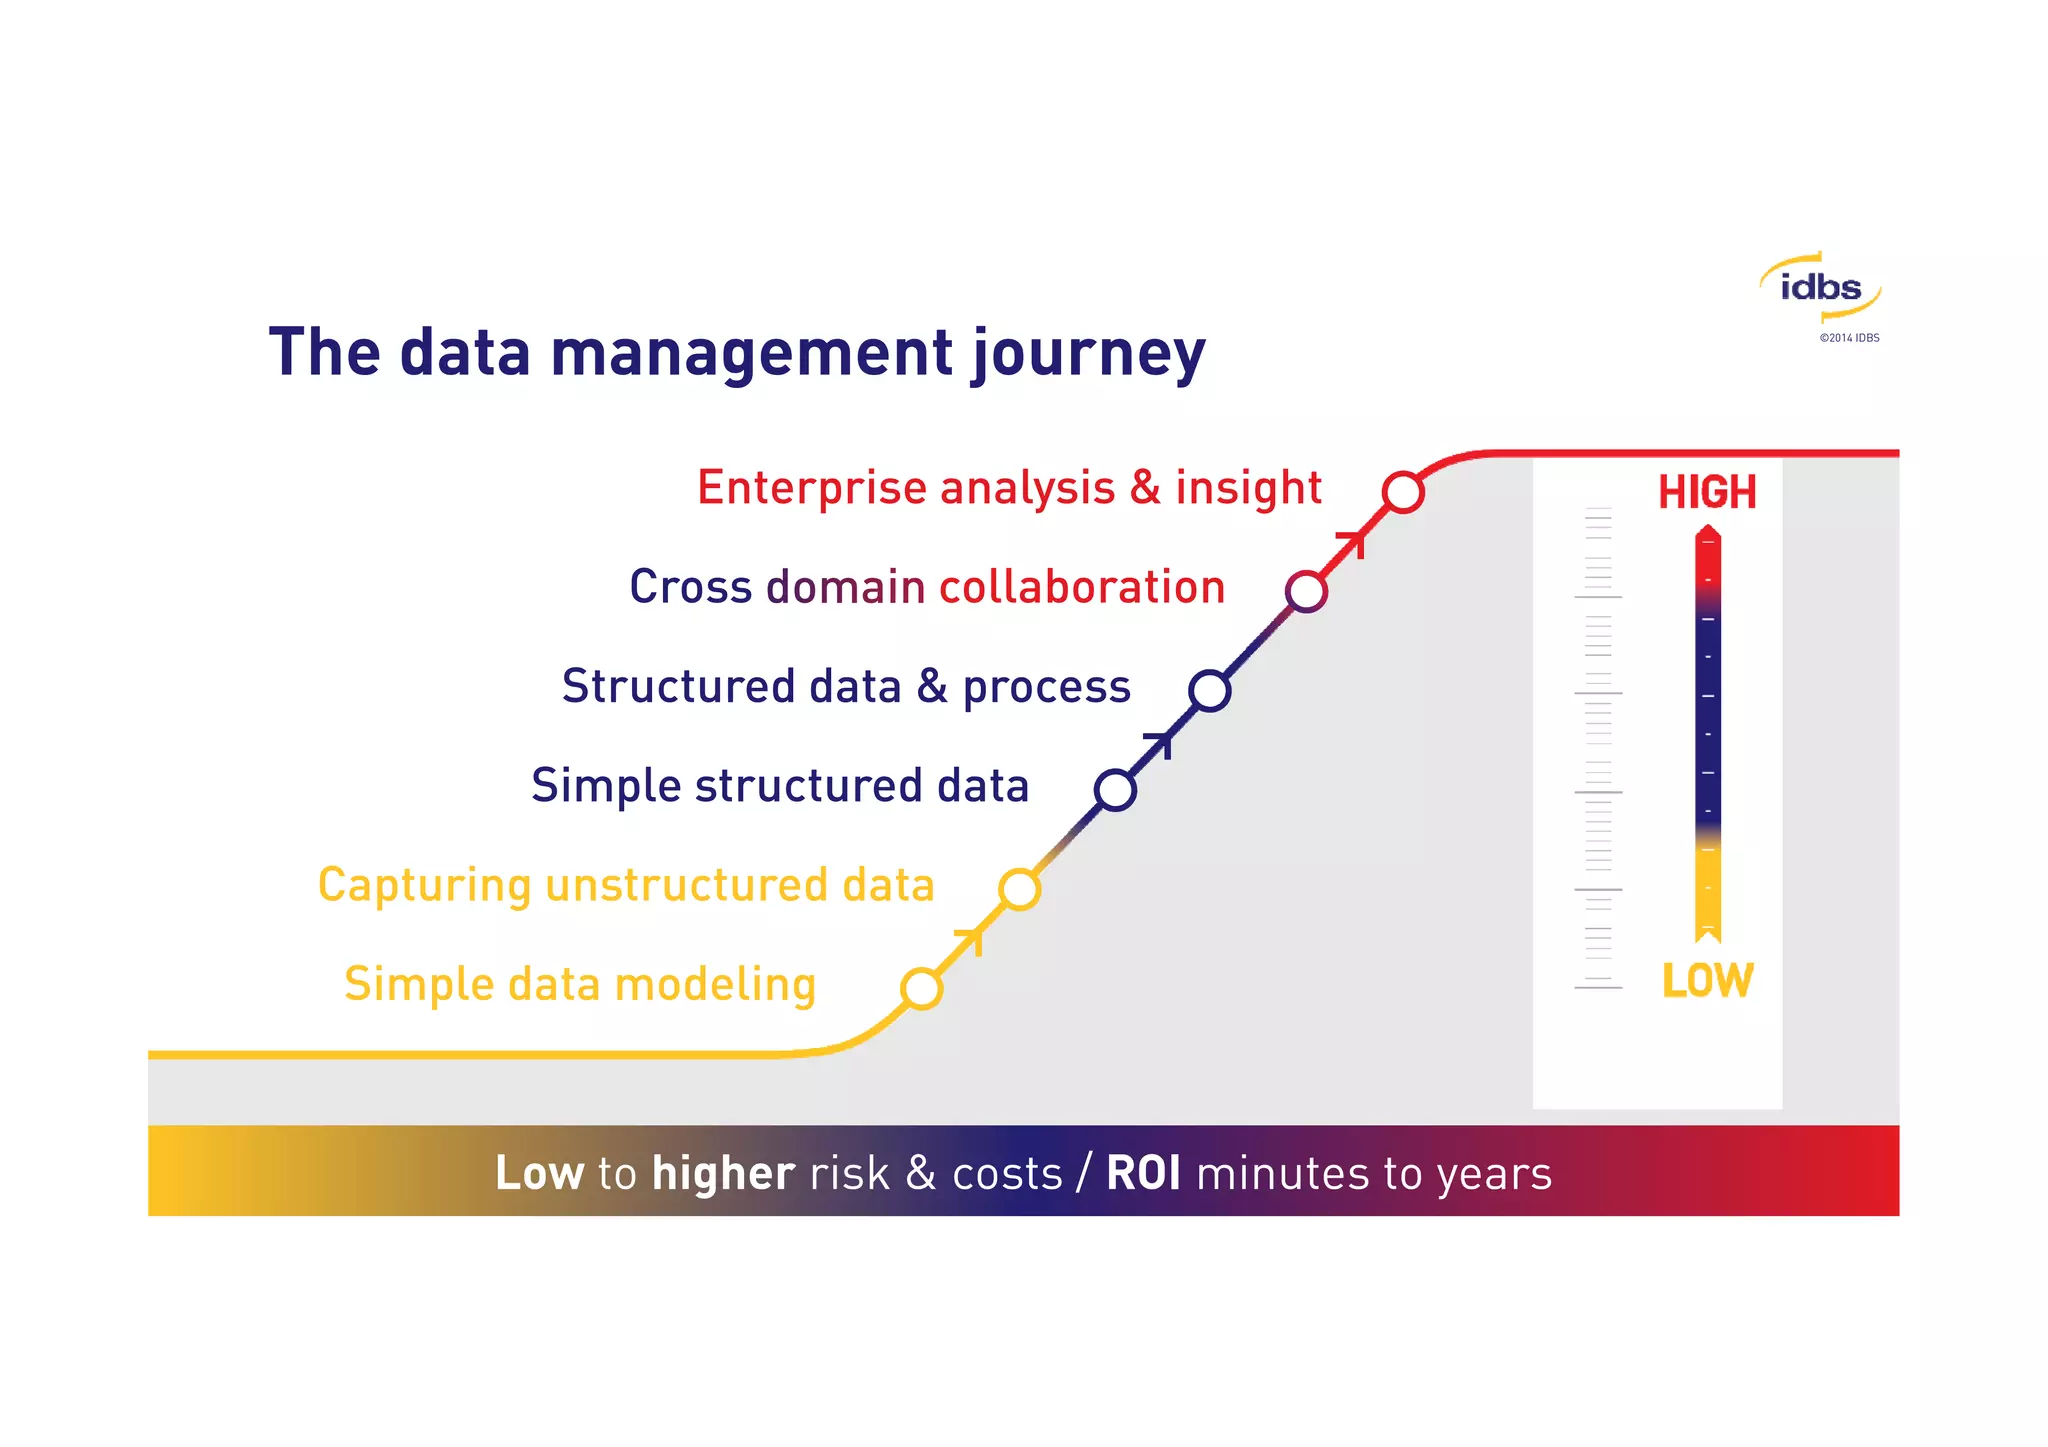
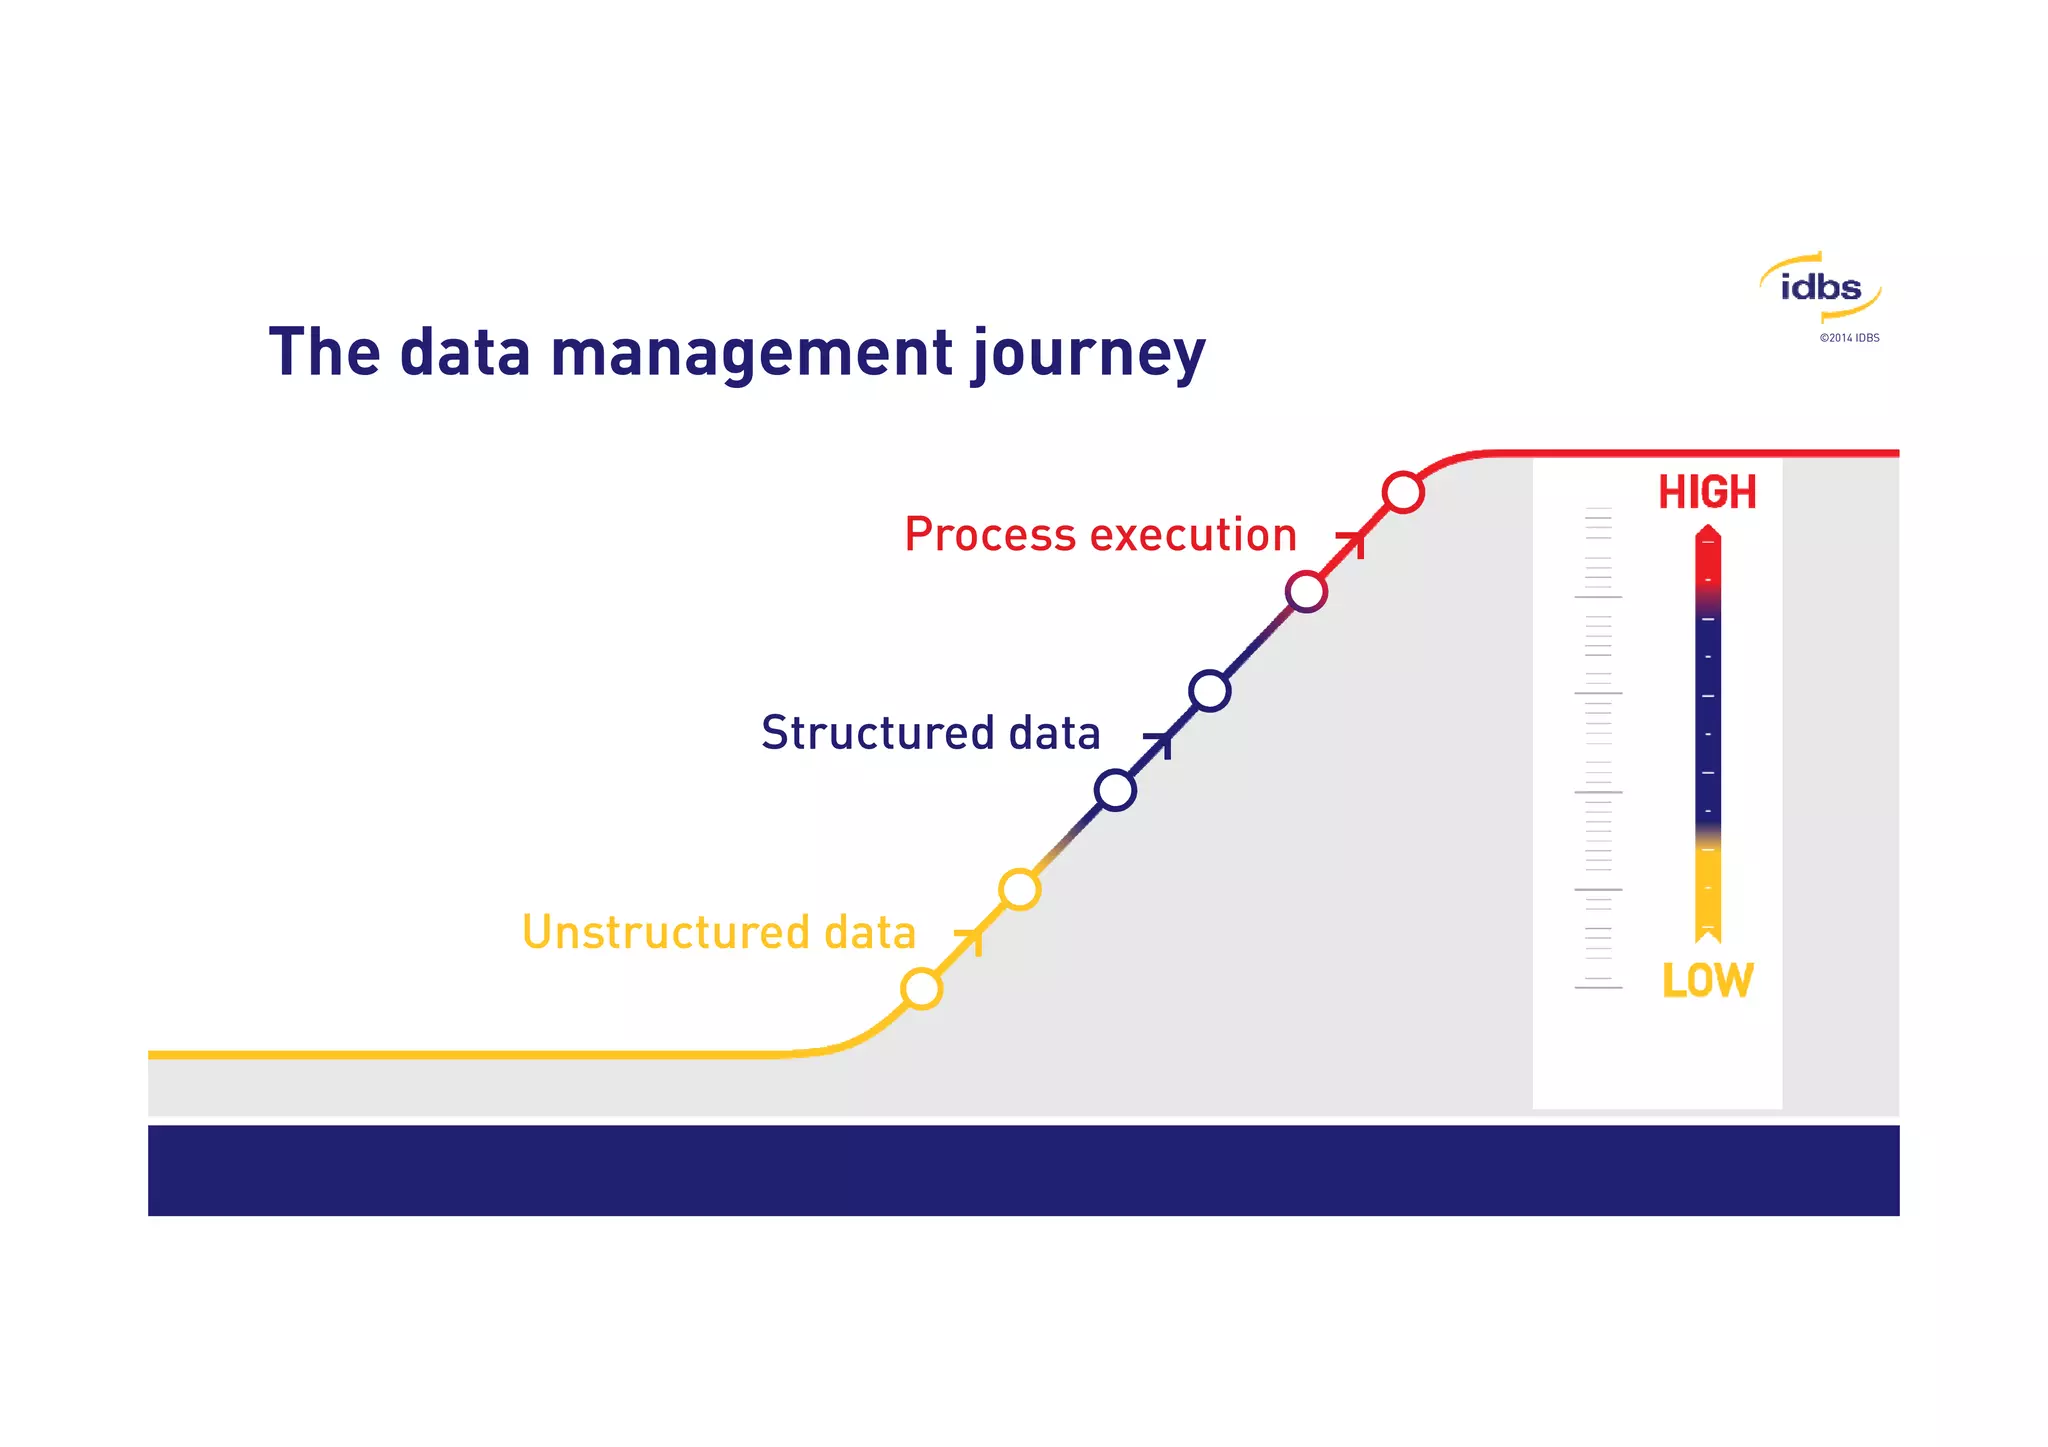
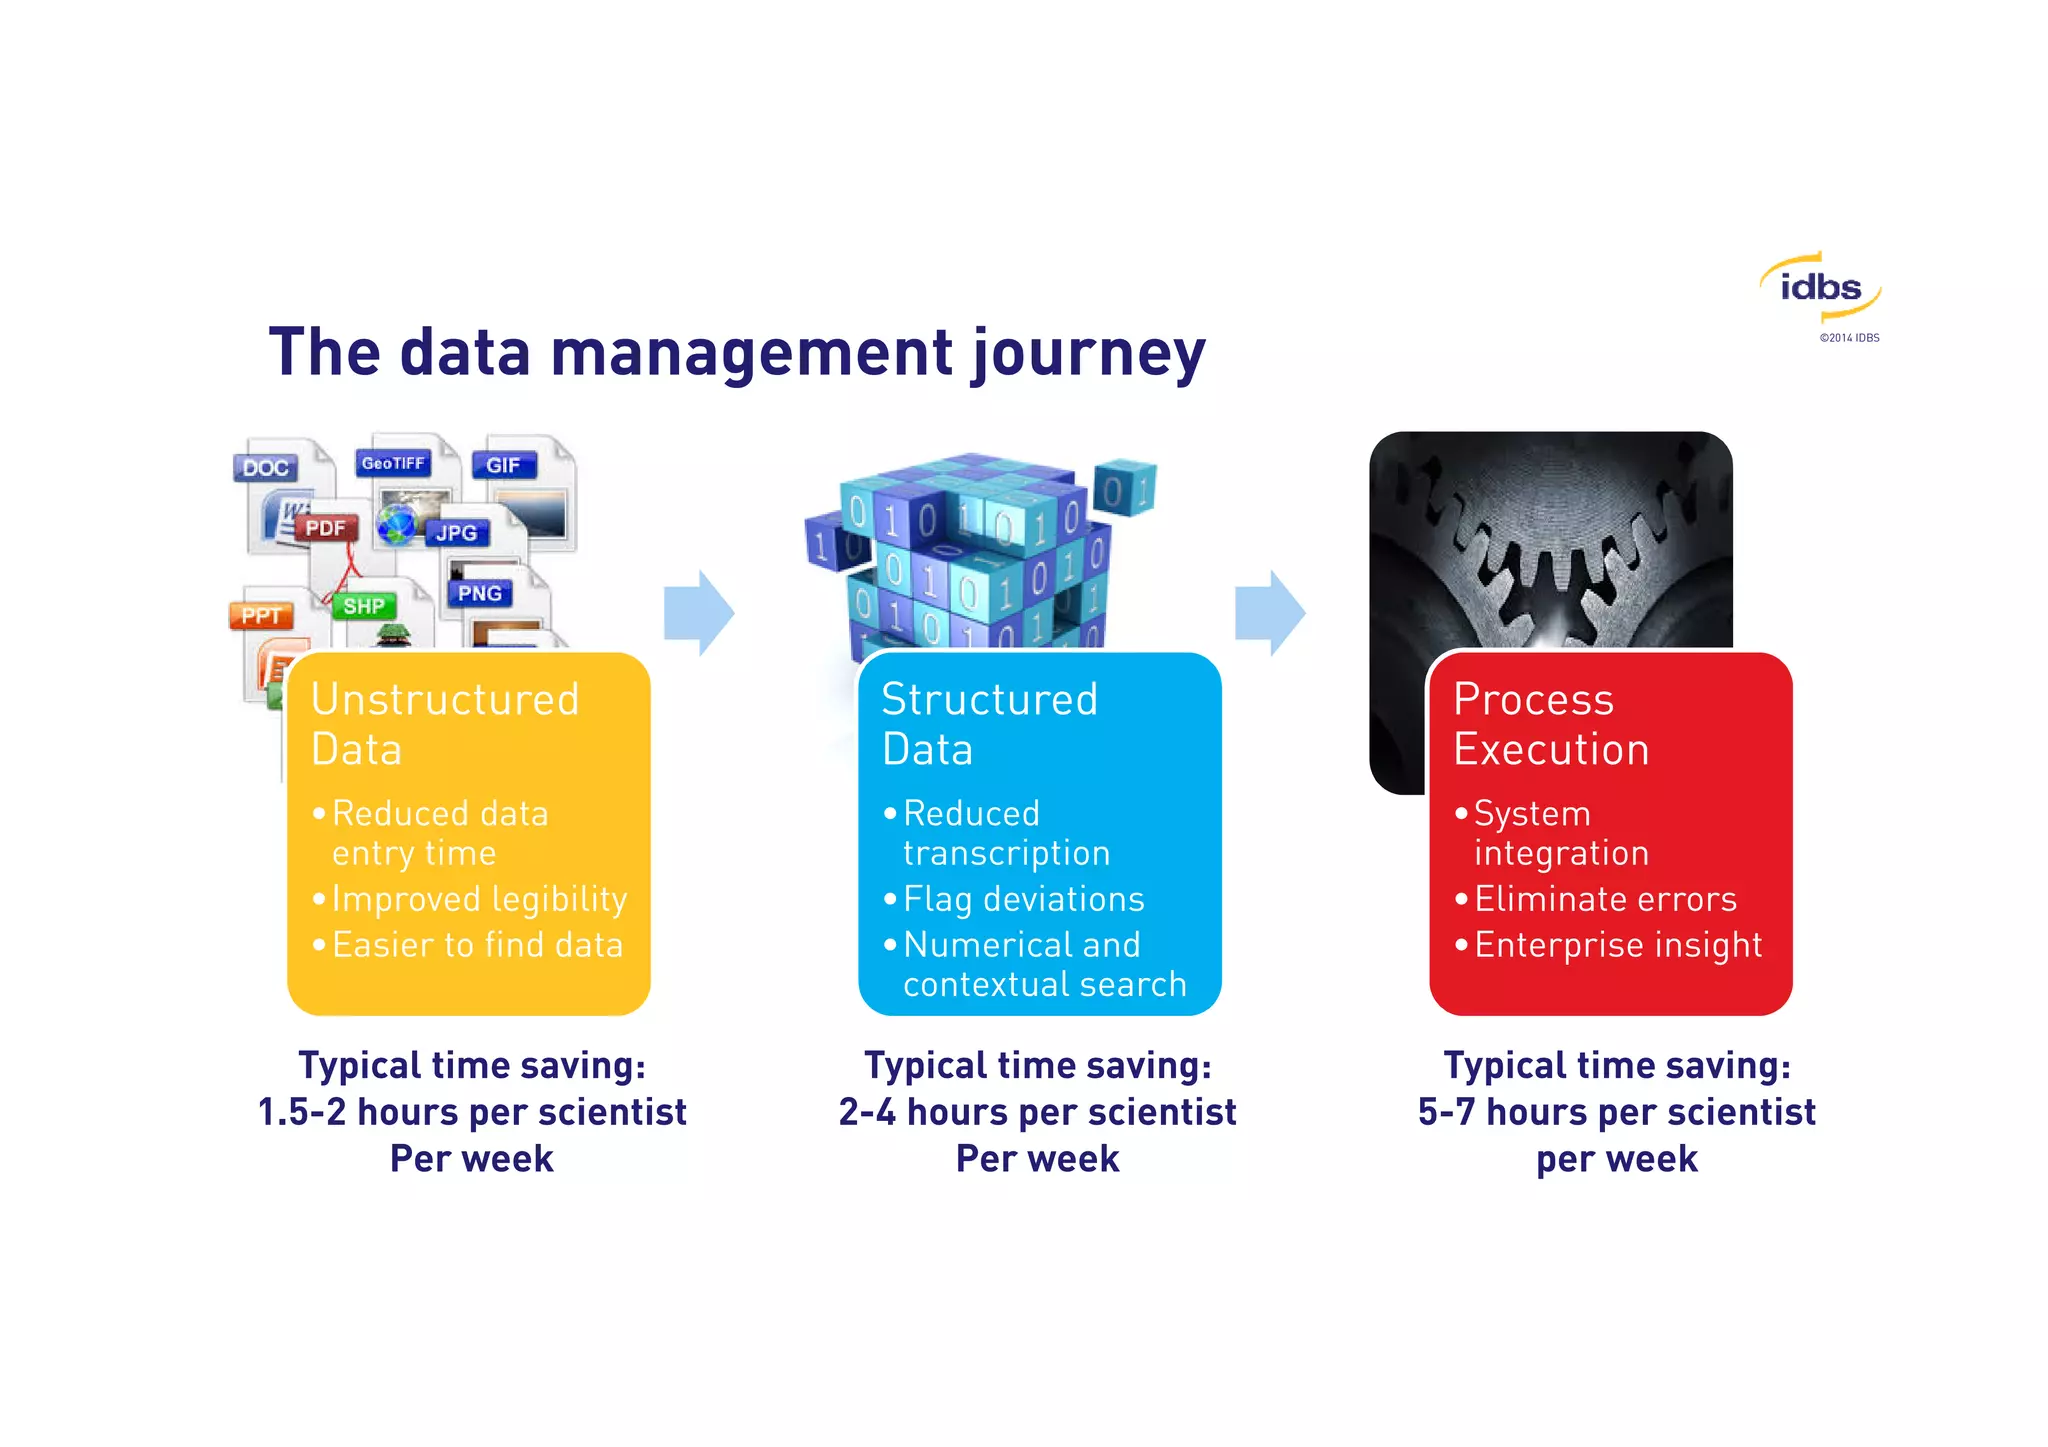
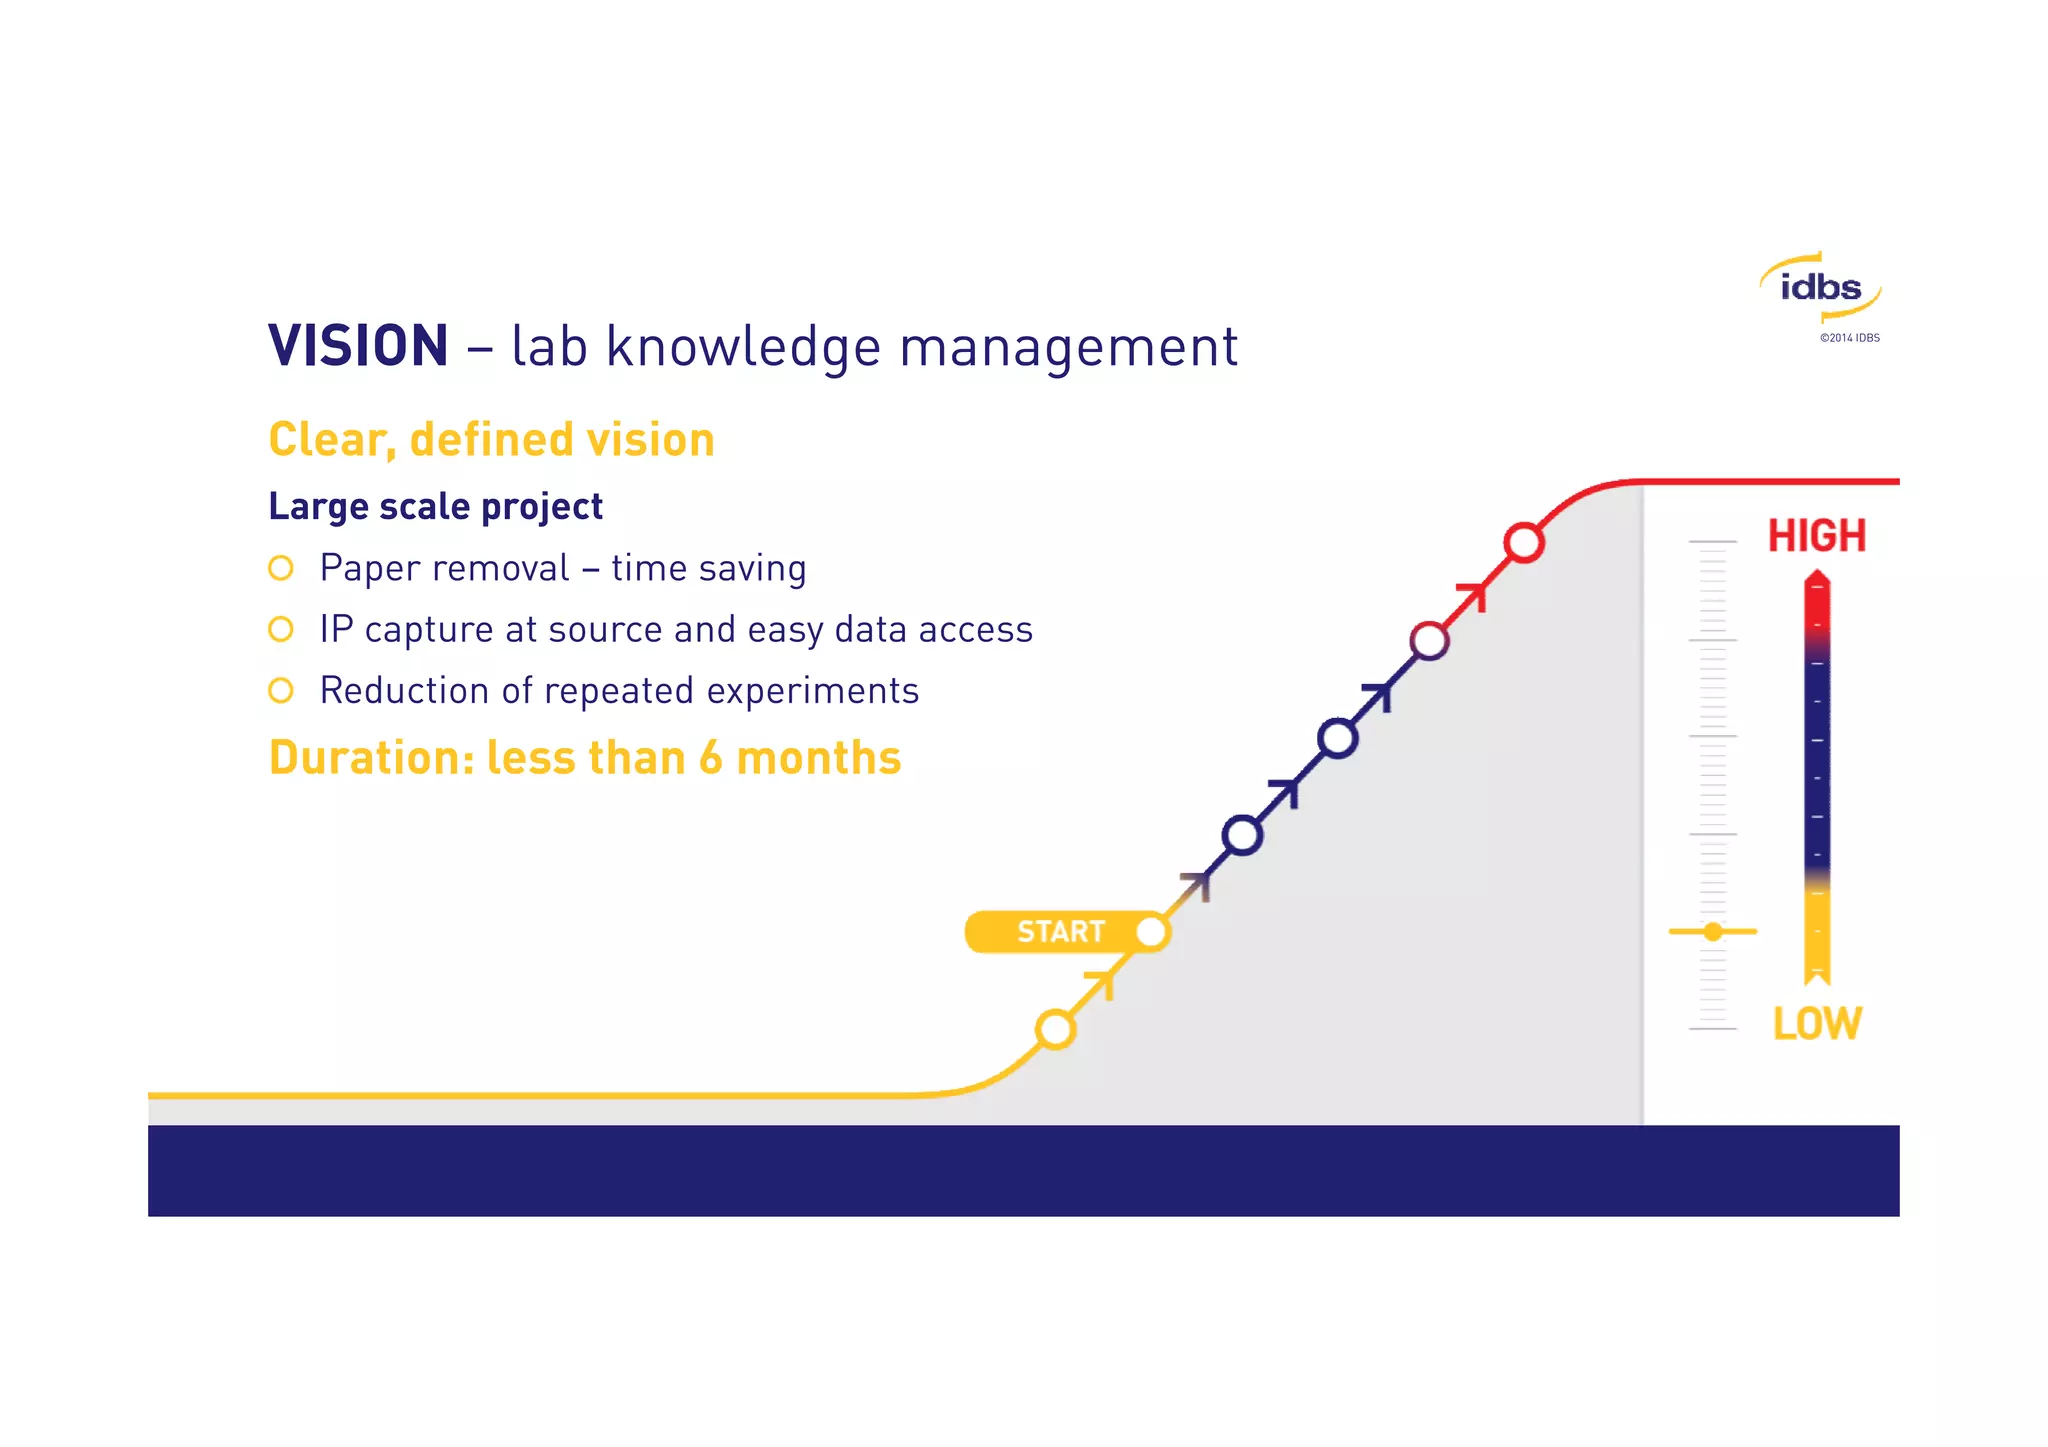
The Evolution of Laboratory 
Data Systems 
Replacing Paper, Streamlining Process Execution, 
and Delivering Product and Process Insight 
Jarrod Medeiros 
22 October 2014 
© 2014 ID Business Solutions. All Rights Reserved
©2014 IDBS 
How do you manage the most important 
product in your lab your data
©2014 IDBS 
Are you still using paper? 
Maybe SharePoint or a basic ELN?
A Common Situation 
Heavy dependency on paper 
 Extensive manual activity (Copy/Paste) 
 Data and IP spread out within and across 
Notebooks 
 Data and Knowledge silos, limited Collaboration 
 Documentation quality is variable 
 Experimental failures are often not recorded 
For every 100 scientists, RD 
organizations spend more than 
19,980 hours per year 
managing paper-based 
processes 
For every month you rely on paper-based 
processes, you are spending more 
than 1,665 hours in non-productive 
time* 
* Based on 100 scientists, working 7h/day for 46 weeks/year
©2014 IDBS 
A Common Situation 
5 hours per week spent 
looking for data to 
prepare reports 
Almost 20% of the time, 
the data needed cannot be 
found 
Experiments often have ttoo 
be rerun because the data 
is not accessible or cannot 
be retrieved 
Results of a survey of development groups in 104 organizations
©2014 IDBS 
Where do you want to take your RD?
©2014 IDBS 
I probably don’t need to tell you the benefits of 
electronic systems 
But just to name a few… 
Reduced entry time 
Reduced transcription = reduced errors 
Direct access to other electronic systems 
Searchability, searchability, searchability!
©2014 IDBS 
But this only works if you have a system that 
meets your needs and is used by the 
scientists
©2014 IDBS Typical Scenarios 
•With files stored on a common drive or 
SharePoint Paper + Excel 
• Still using excel for anything that doesn’t fit 
into LIMS Paper + LIMS 
• Document repository with limited search 
capabilities Basic ELN 
• And CDS ELN + LIMS and SDMS and so on…
©2014 IDBS 
SSSSTTTTOOOOPPPP!!!! 
Where are you going to get the most value most quickly?
©2014 IDBS 
What system is right, or systems? 
What are your overall goals and how do the 
requirements align with them? 
Have you put together the business case? 
By mapping functionality to requirements to 
goals you can ensure that the system meets 
the needs of the organization
©2014 IDBS 
ELN vs LIMS vs LES vs MES vs SDMS…
©2014 IDBS Common drivers will affect your project 
Link data to data 
Link data to people 
Link people to people 
1111000011110000 0000111100001111
©2014 IDBS Steps to take 
 Requirements 
 Project buy in 
 System/vendor selection 
 Project approval 
 Implementation planning 
 Install 
 Configuration 
 Training 
 Go live 
 System maintenance and support
©2014 IDBS 
System Requirements 
Common pitfalls 
Too few business experts 
• What one user needs may not suit another user 
• Better option is to gather requirements from as many 
users as possible and focus on the core requirements 
All requirements are must have 
• Categorizing and prioritizing requirements allows you to 
control scope and budget, focusing on high value areas
©2014 IDBS 
Application Integration 
Start simple
©2014 IDBS Other things to consider 
 Deployment Methodology 
• Carrot vs Stick 
 Logistical Support 
• Getting all the labs ready for digital 
• System administration strategy
©2014 IDBS 
The more data goes in, the more it comes out 
Not quite…
©2014 IDBS 
The data management journey 
Enterprise analysis  insight 
Cross collaboration 
Structured data  process 
Simple structured data 
Capturing unstructured data 
Simple data modeling 
Low to higher risk  costs / ROI minutes to years
©2014 IDBS The data management journey 
Process execution 
Structured data 
Unstructured data
©2014 IDBS The data management journey 
Unstructured 
Data 
•Reduced data 
entry time 
•Improved legibility 
•Easier to find data 
Structured 
Data 
•Reduced 
transcription 
•Flag deviations 
•Numerical and 
contextual search 
Process 
Execution 
•System 
integration 
•Eliminate errors 
•Enterprise insight 
Typical time saving: 
1.5-2 hours per scientist 
Per week 
Typical time saving: 
2-4 hours per scientist 
Per week 
Typical time saving: 
5-7 hours per scientist 
per week
©2014 IDBS 
Case Studies 
Examples of customer deployments
©2014 IDBS 
VISION – lab knowledge management 
Clear, defined vision 
Large scale project 
Paper removal – time saving 
IP capture at source and easy data access 
Reduction of repeated experiments 
Duration: less than 6 months
©2014 IDBS 
VISION – evolved over time 
Flexible, ambitious vision 
Large scale project 
Increased data quality 
Reduced collation time 
International process harmonization 
IP standardization 
Streamlined reporting 
Wanted to do more! 
Duration: 6 years
©2014 IDBS 
VISION – full process integration  alignment 
Two stage, ambitious vision 
Large scale project across many groups 
Process harmonization 
Real time process reporting 
Less errors  time looking for them 
Holistic view of development process 
Foundations of QBD 
Duration: 1 year
©2014 IDBS Measured Time Savings
©2014 IDBS Before you start your journey… 
 Define your vision 
 Understand your drivers 
 Focus on the ROI 
 Create a stepwise plan 
 Start simple!
©2014 IDBS 
Questions? 
For more information, visit IDBS 
at Booth 104 (far left aisle) or 
idbs.com

The Evolution of Laboratory Data Systems: Replacing Paper, Streamlining Process Execution, and Delivering Product and Process Insight

  • 1.
    The Evolution ofLaboratory Data Systems Replacing Paper, Streamlining Process Execution, and Delivering Product and Process Insight Jarrod Medeiros 22 October 2014 © 2014 ID Business Solutions. All Rights Reserved
  • 2.
    ©2014 IDBS Howdo you manage the most important product in your lab your data
  • 3.
    ©2014 IDBS Areyou still using paper? Maybe SharePoint or a basic ELN?
  • 4.
    A Common Situation Heavy dependency on paper Extensive manual activity (Copy/Paste) Data and IP spread out within and across Notebooks Data and Knowledge silos, limited Collaboration Documentation quality is variable Experimental failures are often not recorded For every 100 scientists, RD organizations spend more than 19,980 hours per year managing paper-based processes For every month you rely on paper-based processes, you are spending more than 1,665 hours in non-productive time* * Based on 100 scientists, working 7h/day for 46 weeks/year
  • 5.
    ©2014 IDBS ACommon Situation 5 hours per week spent looking for data to prepare reports Almost 20% of the time, the data needed cannot be found Experiments often have ttoo be rerun because the data is not accessible or cannot be retrieved Results of a survey of development groups in 104 organizations
  • 6.
    ©2014 IDBS Wheredo you want to take your RD?
  • 7.
    ©2014 IDBS Iprobably don’t need to tell you the benefits of electronic systems But just to name a few… Reduced entry time Reduced transcription = reduced errors Direct access to other electronic systems Searchability, searchability, searchability!
  • 8.
    ©2014 IDBS Butthis only works if you have a system that meets your needs and is used by the scientists
  • 9.
    ©2014 IDBS TypicalScenarios •With files stored on a common drive or SharePoint Paper + Excel • Still using excel for anything that doesn’t fit into LIMS Paper + LIMS • Document repository with limited search capabilities Basic ELN • And CDS ELN + LIMS and SDMS and so on…
  • 10.
    ©2014 IDBS SSSSTTTTOOOOPPPP!!!! Where are you going to get the most value most quickly?
  • 11.
    ©2014 IDBS Whatsystem is right, or systems? What are your overall goals and how do the requirements align with them? Have you put together the business case? By mapping functionality to requirements to goals you can ensure that the system meets the needs of the organization
  • 12.
    ©2014 IDBS ELNvs LIMS vs LES vs MES vs SDMS…
  • 13.
    ©2014 IDBS Commondrivers will affect your project Link data to data Link data to people Link people to people 1111000011110000 0000111100001111
  • 14.
    ©2014 IDBS Stepsto take Requirements Project buy in System/vendor selection Project approval Implementation planning Install Configuration Training Go live System maintenance and support
  • 15.
    ©2014 IDBS SystemRequirements Common pitfalls Too few business experts • What one user needs may not suit another user • Better option is to gather requirements from as many users as possible and focus on the core requirements All requirements are must have • Categorizing and prioritizing requirements allows you to control scope and budget, focusing on high value areas
  • 16.
    ©2014 IDBS ApplicationIntegration Start simple
  • 17.
    ©2014 IDBS Otherthings to consider Deployment Methodology • Carrot vs Stick Logistical Support • Getting all the labs ready for digital • System administration strategy
  • 18.
    ©2014 IDBS Themore data goes in, the more it comes out Not quite…
  • 19.
    ©2014 IDBS Thedata management journey Enterprise analysis insight Cross collaboration Structured data process Simple structured data Capturing unstructured data Simple data modeling Low to higher risk costs / ROI minutes to years
  • 20.
    ©2014 IDBS Thedata management journey Process execution Structured data Unstructured data
  • 21.
    ©2014 IDBS Thedata management journey Unstructured Data •Reduced data entry time •Improved legibility •Easier to find data Structured Data •Reduced transcription •Flag deviations •Numerical and contextual search Process Execution •System integration •Eliminate errors •Enterprise insight Typical time saving: 1.5-2 hours per scientist Per week Typical time saving: 2-4 hours per scientist Per week Typical time saving: 5-7 hours per scientist per week
  • 22.
    ©2014 IDBS CaseStudies Examples of customer deployments
  • 23.
    ©2014 IDBS VISION– lab knowledge management Clear, defined vision Large scale project Paper removal – time saving IP capture at source and easy data access Reduction of repeated experiments Duration: less than 6 months
  • 24.
    ©2014 IDBS VISION– evolved over time Flexible, ambitious vision Large scale project Increased data quality Reduced collation time International process harmonization IP standardization Streamlined reporting Wanted to do more! Duration: 6 years
  • 25.
    ©2014 IDBS VISION– full process integration alignment Two stage, ambitious vision Large scale project across many groups Process harmonization Real time process reporting Less errors time looking for them Holistic view of development process Foundations of QBD Duration: 1 year
  • 26.
  • 27.
    ©2014 IDBS Beforeyou start your journey… Define your vision Understand your drivers Focus on the ROI Create a stepwise plan Start simple!
  • 28.
    ©2014 IDBS Questions? For more information, visit IDBS at Booth 104 (far left aisle) or idbs.com