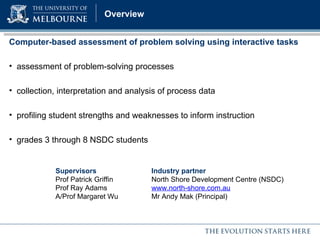
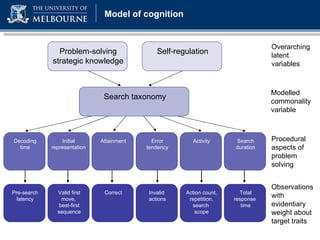
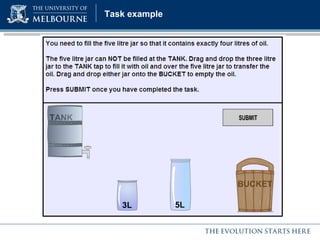
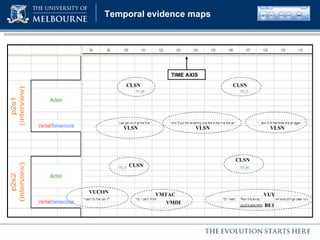
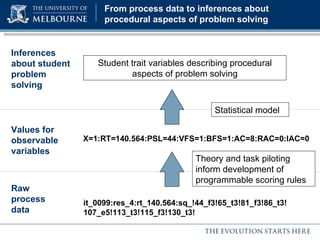
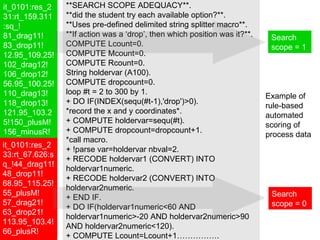
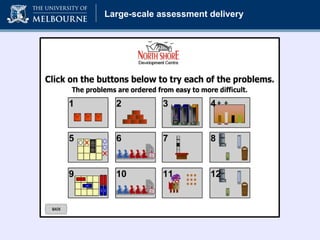
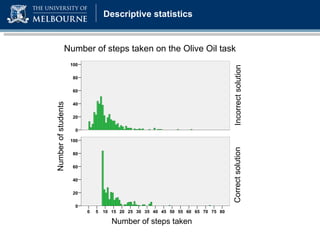
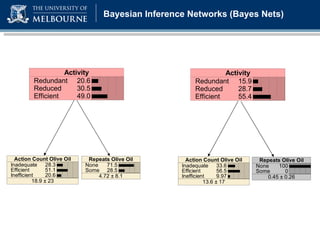
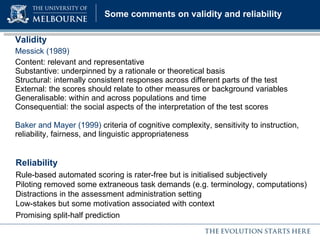
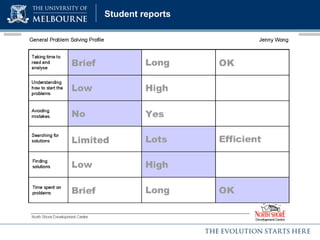
Invited presentation at the  Psychologisches Institut der Universität Heidelberg 25 May 2010 Nathan ZOANETTI
Computer-based assessment of problem solving using interactive tasks assessment of problem-solving processes collection, interpretation and analysis of process data profiling student strengths and weaknesses to inform instruction grades 3 through 8 NSDC students Page Title / heading goes here Overview Supervisors  Industry partner Prof Patrick Griffin North Shore Development Centre (NSDC) Prof Ray Adams  www.north-shore.com.au A/Prof Margaret Wu Mr Andy Mak (Principal)
Problem solving is broadly defined… Problem solving is cognitive processing directed at achieving a goal when no solution method is obvious to the problem solver (Mayer, 2002). In the present study the following overarching objectives were in place: the assessment needed to support educators in targeting instruction to improve student problem solving educationally important and instructionally sensitive aspects of problem solving were to be identified interactive computer-based tasks were to be designed to assess the chosen aspects via collection, interpretation and statistical modelling of process data Problem solving
Sequential steps Polya (1945, 1957), Garofalo and Lester (1985) Information processing Newell and Simon (1972), Ericsson and Simon (1984) Dynamic/interactive Buchner (1995), Wirth and Klieme (2003), Ridgway and McCusker (2003) Affective or situated Salomon and Perkins (1989), Lave (1988) Search-based versus schema-driven Gick (1986), Marshall (1995), O’Neil (1999) Expert versus novice differences Glaser (1991), Mislevy (1993, 2008), Lester (1994) Problem solving perspectives and paradigms
What are the strategies and attributes of students in an interactive computer-based problem-solving environment and how are they related to one another? What are the design implications for computer-based assessments of procedural aspects of problem solving?   Research questions
Page Title / heading goes here Model of cognition Problem-solving strategic knowledge Self-regulation Search taxonomy Decoding time Initial representation Attainment Error tendency Activity Search duration Total response  time Action count, repetition, search  scope Invalid  actions Correct Valid first move,  best-first sequence Pre-search latency Overarching latent variables Procedural aspects of problem solving Observations with evidentiary weight about target traits Modelled commonality variable
Page Title / heading goes here Task example
Page Title / heading goes here Computer-captured process data Computer-captured data as evidence it_0099:res_0:rt_193.627:sq_!44_f3!62_t3!68_f3!77_f3!82_e3!95_t3!112_t3!127_e5!135_roSub!147_e5!151_e5!155_f3!158_f3!167_f3!177_e3!181_e3!183_f3! Need to assign codes to meaningful performance features in terms of the student traits of interest  i.e. need to develop scoring rules to assign values to observable variables
Page Title / heading goes here Temporal evidence maps  CLSN CLSN CLSN CLSN VLSN VLSN VLSN VUCON VMTAC VMDI BE1 VUY TIME AXIS
Page Title / heading goes here From process data to inferences about procedural aspects of problem solving it_0099:res_4:rt_140.564:sq_!44_f3!65_t3!81_f3!86_t3!107_e5!113_t3!115_f3!130_t3! Raw process data Values for observable variables X=1:RT=140.564:PSL=44:VFS=1:BFS=1:AC=8:RAC=0:IAC=0 Theory and task piloting inform development of programmable scoring rules Inferences about student problem solving Statistical model Student trait variables describing procedural aspects of problem solving
**SEARCH SCOPE ADEQUACY**. **did the student try each available option?**. **Uses pre-defined delimited string splitter macro**. **If action was a ‘drop’, then which position was it?**. COMPUTE Lcount=0. COMPUTE Mcount=0. COMPUTE Rcount=0. String holdervar (A100). COMPUTE dropcount=0. loop #t = 2 to 300 by 1. + DO IF(INDEX(sequ(#t-1),'drop')>0). *record the x and y coordinates*. + COMPUTE holdervar=sequ(#t). + COMPUTE dropcount=dropcount+1. *call macro. + !parse var=holdervar nbval=2. + RECODE holdervar1 (CONVERT) INTO holdervar1numeric. + RECODE holdervar2 (CONVERT) INTO holdervar2numeric. + END IF. + DO IF(holdervar1numeric<60 AND holdervar1numeric>-20 AND holdervar2numeric>90 AND holdervar2numeric<120). + COMPUTE Lcount=Lcount+1……………. it_0101:res_231:rt_159.311:sq_!81_drag11!83_drop11!12.95_109.25!102_drag12!106_drop12!56.95_100.25!110_drag13!118_drop13!121.95_103.25!150_plusM!156_minusR!159_roSub! it_0101:res_233:rt_67.626:sq_!44_drag11!48_drop11!68.95_115.25!55_plusM!57_drag21!63_drop21!113.95_103.4!66_plusR! Search scope = 1 Search scope = 0 Example of rule-based automated scoring of process data
Page Title / heading goes here Large-scale assessment delivery
Page Title / heading goes here Descriptive statistics Number of steps taken Number of students Incorrect solution Correct solution Number of steps taken on the Olive Oil task
Page Title / heading goes here Bayesian Inference Networks (Bayes Nets)
Page Title / heading goes here Evidence accumulation (2)  Bayesian Inference Networks Bayes Net probabilistic model
Page Title / heading goes here Case studies (1) – from evidence to inference Case Work product  (actual example) Observables Interpretation Probability distributions for student trait class membership A None None Prior probability distribution B sq_!24_t3!33_roSub!45_roSub!48_f3!59_roSub!62_roSub!82_t3!97_e5!103_f3!108_e3!113_f3!118_e3!163_e5!166_roSub!169_f3!175_t3!190_f3!198_t3!211_e3!227_e5!238_f3!243_roSub!260_t3!266_f3!272_t3!279_roSub!290_e5!304_roSub!305_roSub!308_t3!313_f3!319_t3! Valid first: No Best first: No Actions: Excessive Invalid: Some Repeats: Some Correct: Yes PSL: Intermediate RT: Extended Lacks understanding of the task objects and how they relate to goal-attainment in the first instance. Persists with errors and repetition until the goal is attained. Takes a long time to solve the problem but persists.
Page Title / heading goes here Case studies (2) – same score but disparate Case Score Interpretation Probability distributions for student trait class membership C 6/9 Expert with reasonable automaticity D 6/9 Efficient solution paths but much slower E 6/9 Rapid-fire, legitimate actions, with high redundancy
Page Title / heading goes here Indices for model evaluation 2. Predicting observations 3. Predicting student traits 1. Sensitivity analysis Predicted Error rate 14.81% Low Inefficient 56 4 Low Actual 8 13 Inefficient Student trait variable Misclassification rates Split-half reliability point estimate Decoding time 26.0% 74.0% Initial representation 26.8% 73.2% Error tendency 30.3% 69.7% Activity 40.4% 59.6% Duration 29.6% 70.4% Attainment 29.7% 70.3% Search class 56.0% 44.0% Observable variable node Entropy reduction Variance reduction BAYES_0107_PSL 0.279 0.073 BAYES_0106_PSL 0.196 0.032 BAYES_0077_PSL 0.175 0.022
Page Title / heading goes here Some comments on validity and reliability Validity Messick (1989)  Content: relevant and representative Substantive: underpinned by a rationale or theoretical basis   Structural: internally consistent responses across different parts of the test   External: the scores should relate to other measures or background variables   Generalisable: within and across populations and time   Consequential: the social aspects of the interpretation of the test scores Baker and Mayer (1999)  criteria of cognitive complexity, sensitivity to instruction, reliability, fairness, and linguistic appropriateness Reliability Rule-based automated scoring is rater-free but is initialised subjectively Piloting removed some extraneous task demands (e.g. terminology, computations) Distractions in the assessment administration setting Low-stakes but some motivation associated with context Promising split-half prediction
Page Title / heading goes here Student reports
Page Title / heading goes here Concluding remarks Importance Understanding  how  students solve problems provides additional information for informing instruction. Problem solving in search-based and interactive environments is underpinned by competencies which are likely to grow in importance in 21 st  century educational and vocational settings. Contribution This research extends existing methodologies for analysing and describing student problem solving processes in a computer-based context. Future research possibilities Interventions, alternative models and data, adaptivity, external validations.

Heidelberg presentation

  • 1.
    Invited presentation atthe Psychologisches Institut der Universität Heidelberg 25 May 2010 Nathan ZOANETTI
  • 2.
    Computer-based assessment ofproblem solving using interactive tasks assessment of problem-solving processes collection, interpretation and analysis of process data profiling student strengths and weaknesses to inform instruction grades 3 through 8 NSDC students Page Title / heading goes here Overview Supervisors Industry partner Prof Patrick Griffin North Shore Development Centre (NSDC) Prof Ray Adams www.north-shore.com.au A/Prof Margaret Wu Mr Andy Mak (Principal)
  • 3.
    Problem solving isbroadly defined… Problem solving is cognitive processing directed at achieving a goal when no solution method is obvious to the problem solver (Mayer, 2002). In the present study the following overarching objectives were in place: the assessment needed to support educators in targeting instruction to improve student problem solving educationally important and instructionally sensitive aspects of problem solving were to be identified interactive computer-based tasks were to be designed to assess the chosen aspects via collection, interpretation and statistical modelling of process data Problem solving
  • 4.
    Sequential steps Polya(1945, 1957), Garofalo and Lester (1985) Information processing Newell and Simon (1972), Ericsson and Simon (1984) Dynamic/interactive Buchner (1995), Wirth and Klieme (2003), Ridgway and McCusker (2003) Affective or situated Salomon and Perkins (1989), Lave (1988) Search-based versus schema-driven Gick (1986), Marshall (1995), O’Neil (1999) Expert versus novice differences Glaser (1991), Mislevy (1993, 2008), Lester (1994) Problem solving perspectives and paradigms
  • 5.
    What are thestrategies and attributes of students in an interactive computer-based problem-solving environment and how are they related to one another? What are the design implications for computer-based assessments of procedural aspects of problem solving? Research questions
  • 6.
    Page Title /heading goes here Model of cognition Problem-solving strategic knowledge Self-regulation Search taxonomy Decoding time Initial representation Attainment Error tendency Activity Search duration Total response time Action count, repetition, search scope Invalid actions Correct Valid first move, best-first sequence Pre-search latency Overarching latent variables Procedural aspects of problem solving Observations with evidentiary weight about target traits Modelled commonality variable
  • 7.
    Page Title /heading goes here Task example
  • 8.
    Page Title /heading goes here Computer-captured process data Computer-captured data as evidence it_0099:res_0:rt_193.627:sq_!44_f3!62_t3!68_f3!77_f3!82_e3!95_t3!112_t3!127_e5!135_roSub!147_e5!151_e5!155_f3!158_f3!167_f3!177_e3!181_e3!183_f3! Need to assign codes to meaningful performance features in terms of the student traits of interest i.e. need to develop scoring rules to assign values to observable variables
  • 9.
    Page Title /heading goes here Temporal evidence maps CLSN CLSN CLSN CLSN VLSN VLSN VLSN VUCON VMTAC VMDI BE1 VUY TIME AXIS
  • 10.
    Page Title /heading goes here From process data to inferences about procedural aspects of problem solving it_0099:res_4:rt_140.564:sq_!44_f3!65_t3!81_f3!86_t3!107_e5!113_t3!115_f3!130_t3! Raw process data Values for observable variables X=1:RT=140.564:PSL=44:VFS=1:BFS=1:AC=8:RAC=0:IAC=0 Theory and task piloting inform development of programmable scoring rules Inferences about student problem solving Statistical model Student trait variables describing procedural aspects of problem solving
  • 11.
    **SEARCH SCOPE ADEQUACY**.**did the student try each available option?**. **Uses pre-defined delimited string splitter macro**. **If action was a ‘drop’, then which position was it?**. COMPUTE Lcount=0. COMPUTE Mcount=0. COMPUTE Rcount=0. String holdervar (A100). COMPUTE dropcount=0. loop #t = 2 to 300 by 1. + DO IF(INDEX(sequ(#t-1),'drop')>0). *record the x and y coordinates*. + COMPUTE holdervar=sequ(#t). + COMPUTE dropcount=dropcount+1. *call macro. + !parse var=holdervar nbval=2. + RECODE holdervar1 (CONVERT) INTO holdervar1numeric. + RECODE holdervar2 (CONVERT) INTO holdervar2numeric. + END IF. + DO IF(holdervar1numeric<60 AND holdervar1numeric>-20 AND holdervar2numeric>90 AND holdervar2numeric<120). + COMPUTE Lcount=Lcount+1……………. it_0101:res_231:rt_159.311:sq_!81_drag11!83_drop11!12.95_109.25!102_drag12!106_drop12!56.95_100.25!110_drag13!118_drop13!121.95_103.25!150_plusM!156_minusR!159_roSub! it_0101:res_233:rt_67.626:sq_!44_drag11!48_drop11!68.95_115.25!55_plusM!57_drag21!63_drop21!113.95_103.4!66_plusR! Search scope = 1 Search scope = 0 Example of rule-based automated scoring of process data
  • 12.
    Page Title /heading goes here Large-scale assessment delivery
  • 13.
    Page Title /heading goes here Descriptive statistics Number of steps taken Number of students Incorrect solution Correct solution Number of steps taken on the Olive Oil task
  • 14.
    Page Title /heading goes here Bayesian Inference Networks (Bayes Nets)
  • 15.
    Page Title /heading goes here Evidence accumulation (2) Bayesian Inference Networks Bayes Net probabilistic model
  • 16.
    Page Title /heading goes here Case studies (1) – from evidence to inference Case Work product (actual example) Observables Interpretation Probability distributions for student trait class membership A None None Prior probability distribution B sq_!24_t3!33_roSub!45_roSub!48_f3!59_roSub!62_roSub!82_t3!97_e5!103_f3!108_e3!113_f3!118_e3!163_e5!166_roSub!169_f3!175_t3!190_f3!198_t3!211_e3!227_e5!238_f3!243_roSub!260_t3!266_f3!272_t3!279_roSub!290_e5!304_roSub!305_roSub!308_t3!313_f3!319_t3! Valid first: No Best first: No Actions: Excessive Invalid: Some Repeats: Some Correct: Yes PSL: Intermediate RT: Extended Lacks understanding of the task objects and how they relate to goal-attainment in the first instance. Persists with errors and repetition until the goal is attained. Takes a long time to solve the problem but persists.
  • 17.
    Page Title /heading goes here Case studies (2) – same score but disparate Case Score Interpretation Probability distributions for student trait class membership C 6/9 Expert with reasonable automaticity D 6/9 Efficient solution paths but much slower E 6/9 Rapid-fire, legitimate actions, with high redundancy
  • 18.
    Page Title /heading goes here Indices for model evaluation 2. Predicting observations 3. Predicting student traits 1. Sensitivity analysis Predicted Error rate 14.81% Low Inefficient 56 4 Low Actual 8 13 Inefficient Student trait variable Misclassification rates Split-half reliability point estimate Decoding time 26.0% 74.0% Initial representation 26.8% 73.2% Error tendency 30.3% 69.7% Activity 40.4% 59.6% Duration 29.6% 70.4% Attainment 29.7% 70.3% Search class 56.0% 44.0% Observable variable node Entropy reduction Variance reduction BAYES_0107_PSL 0.279 0.073 BAYES_0106_PSL 0.196 0.032 BAYES_0077_PSL 0.175 0.022
  • 19.
    Page Title /heading goes here Some comments on validity and reliability Validity Messick (1989) Content: relevant and representative Substantive: underpinned by a rationale or theoretical basis Structural: internally consistent responses across different parts of the test External: the scores should relate to other measures or background variables Generalisable: within and across populations and time Consequential: the social aspects of the interpretation of the test scores Baker and Mayer (1999) criteria of cognitive complexity, sensitivity to instruction, reliability, fairness, and linguistic appropriateness Reliability Rule-based automated scoring is rater-free but is initialised subjectively Piloting removed some extraneous task demands (e.g. terminology, computations) Distractions in the assessment administration setting Low-stakes but some motivation associated with context Promising split-half prediction
  • 20.
    Page Title /heading goes here Student reports
  • 21.
    Page Title /heading goes here Concluding remarks Importance Understanding how students solve problems provides additional information for informing instruction. Problem solving in search-based and interactive environments is underpinned by competencies which are likely to grow in importance in 21 st century educational and vocational settings. Contribution This research extends existing methodologies for analysing and describing student problem solving processes in a computer-based context. Future research possibilities Interventions, alternative models and data, adaptivity, external validations.

Editor's Notes

  • #3 I’LL BE TALKING ABOUT… Taking advantage of technology and approaches to assessment design for collecting, interpreting and analysing process data The primary objective was to provide information about how students solve problems so that educators can better target instruction to improve student performance Part of an ARC Linkage Grant. North Shore is a tuition college operating across Aus and NZ, with a particular interest in assessment and instruction of problem solving. REFER TO ANDY BEING HERE REFER TO SUPERVISORS OVERVIEW OF STRUCTURE Definitions and questions Assessment design Task piloting Assessment delivery and analysis Conclusion
  • #4 Problem solving is broadly defined. It is possible to focus on very different aspects of problem solving, and very different tasks or situations It is important to define which aspects of problem solving are of interest.
  • #5 Sequential steps frameworks are conceptually simple. They assign a number of phases to the act of problem solving. Polya included ‘Understand’, ‘Plan’, ‘Carry out plan’, ‘Look back’. Garofalo and Lester elaborated these phases slightly by emphasising meta-cognitive activities including reflection and self-monitoring. One useful feature of identifying these separate steps or phases is that they provide some potentially useful targets for assessment inferences. That is, it would be useful to be determine the relative strengths and weaknesses of individual students not just overall but at each distinct phase. This would provide a means for targeting interventions more specifically than if less fine grained inferences were available. The information-processing literature about problem solving is useful on two fronts. First, it describes problem solving as the interaction between understanding and search, with the quality of search guided by differentially efficient heuristics or strategies. Several studies of problem solving as information processing have focussed on how people solve puzzle-like tasks. Second, it provides methodologies for investigating the cognitive processes underlying problem solving performances from people working through tasks. These are elaborated later. Dynamic or interactive problem solving perspectives are particularly relevant here. They are concerned with problem solving tasks where the state of each problem changes concurrently with a problem solver’s interactions. There is some evidence that tasks constructed in this way demand distinct competencies when compared to static analytical problem tasks. These competencies are receiving attention as targets of new technology-rich assessments owing to their congruence with 21 st century skills i.e. information-rich educational and vocational settings. The influence of attitudinal and situational factors on cognition is well-documented. This is relevant to problem solving performance. In this study there was no intention to measure attitudes or the impact of the assessment context. However, these factors were taken into account where it was practical in terms of task design, the timing of the assessment administration, and the way the assessments were administered. The search-based versus schema-driven paradigm illustrates an important distinction. It provides a useful framework for differentiating between problem solvers and problem tasks. Schema in this context can be thought of as learned compounds of knowledge which are suitable for solving particular classes of problems. For example, in mathematical problem solving, useful schema include computational procedures. These are often domain-specific. That is, they don’t generalise to problem solving outside of solving mathematical tasks. On the other hand, search-based approaches can also be used in problem solving. And their use generalises across various problem types and learning areas. Search-based strategies include trial and error, making comparisons, looking for sub-goals, working backwards and so on. These general search-based strategies are useful when effective schema are not available to a problem solver. The present study wasn’t tied to any particular curricular domain and tasks emphasising the capacity to search for solution using a range of general strategies appealed. The expert versus novice paradigm is particularly important in the context of assessment design. It has received a great deal of attention in problem-solving research. Well-known studies have been conducted in the fields of mathematics, physics and chess. Several researchers have documented the main differences evident in the performances of expert and novice problem solvers. These differences become relevant indicators that assessments should seek to elicit and record. They provide a basis for informing task design such that different patterns of performance across a range of tasks can be mapped to differential levels of expertise. Recent studies of problem solving in computer-based contexts have contextualised these differences as they apply to relative performance efficacy on search-based interactive tasks.
  • #6 Need to spend some time on each of the terms The term “strategies” refers to approaches to problem solving like reading the question, looking for sub-goals, conducting trial and error, planning ahead, working backwards and others. The term “attributes” refers to tendencies such as persistence, error avoidance and self-monitoring. Interactivity refers to a modifiable task environment, where objects within tasks need to be manipulated by performing clicks, rolls, drags and drops with the mouse cursor. This question was addressed via literature review in the first instance, and then empirically through task piloting exercises using verbal protocol analysis which I will describe later. What strategies and attributes are documented in the literature? What strategies and attributes arise through piloting various different tasks? The second question is about the implications from theory for task construction, data collection and data analysis . How should assessment inferences be structured and communicated? What evidence is required for making inferences about the student traits of interest? How should evidence be elicited and recorded? i.e. what features should tasks have? How should evidence be accumulated? i.e. what statistical models are appropriate? What are the validity and reliability considerations? Generalisability and instructional utility were maintained as objectives of the assessment design.
  • #7 Model described This slide shows the structural representation of the cognitive model, and its links to relevant assessment observations. All variables are categorical (explained later). Top two variables are from O’Neil (1999, 2003) and colleagues and CRESST. Not interested in content knowledge. These are not modelled statistically in this study. The two top-level variables interact to give a type of search. A tendency to approach problems in a particular way given strategic knowledge and self-regulation. Each search type is characterised by various procedural traits. These are modelled as the reportable outcomes for students and educators. Inferences about each of these can be made by collecting evidence which is relevant and carries some evidentiary weight in reasoning about the latent state of a student. The bottom tier of variables includes the observations identified in literature about problem-solving strategies and expert-novice differences. The crux of this study is that different patterns of these observations across a number of tasks can be modelled to estimate a student’s performance tendency for each of a profile of procedural aspects of problem solving (i.e. the second tier from the bottom). Importantly, educators can tailor instruction to modify the behaviour of students at the level of observations so that their profile changes to one which is more consistent with good problem solving habits and relative expertise. Some theoretical and empirical findings in support of the model At the level of procedural student traits, it can be seen that leftmost two variables provide diagnostic information about how students tend to behave and perform when commencing problem solving. The initial phases of problem solving from the sequential steps frameworks of Polya and Garofalo and Lester are the focus here. Moving down now to the level of observable variables, we see the kinds of information relevant to the student trait variables which make useful targets for task design. E.g. Paek for PSL, Newell Simon for BFS, Stevens for redundancy, Mislevy or Glaser for response time. Implications for task design Differentiation between students who differ in the target proficiencies Need to design opportunities for redundancy, automaticity, misunderstanding Data of sufficient scope and detail for indentifying salient performance features Need to collect data describing redundancy, automaticity, misunderstanding Immediate appeal of graphics, sustained appeal of interactivity (Richardson, 2002) Minimal demand for construct-irrelevant knowledge (e.g. basic computations only)
  • #8 This is called the Olive Oil task and it is based on a task featuring water jugs in the cognitive science literature 67 years ago by Luchins. If we now work through it, it becomes possible to see how certain aspects of the design serve to elicit evidence which can be related back to the student traits of interest. In particular there are certain impasses in this task which help to differentiate between differentially expert problem solvers. While I’m working through this task, it is recording a great deal of information about what I am doing and when I am doing it. In the next slide we take a look at what this information typically looks like.
  • #9 Computer-captured data is the primary source of evidence in this study. A computer-based environment can capture salient solution processes in an unobtrusive way (Bennett, 1999; Mills, Potenza, Fremer &amp; Ward, 2002 ). These process data can be interpreted to provide information about the problem-solving efficacy (goal-directedness) (Wirth &amp; Klieme, 2003). There is a need to ensure that appropriate computer-captured data is being collected and then interpreted correctly in terms of performance on the domain. Due to potentially large volumes of data, great importance is placed in being able to disentangle and evaluate the data programmatically. Doing it manually is impractical. This can be supported using a concurrent evidence methodology.
  • #10 During task piloting, students were asked to think aloud as they worked through each task. Verbal protocol, sometimes coined the “…thinking aloud procedure…” (Webb, 1979, p. 84; Ericsson &amp; Simon, 1993), refers to the elicitation of processes by a problem solver by way of verbal extraction Expanding the scope of verbal protocol analysis to include additional, concurrently collected sources of process data has also been demonstrated by way of tabulation (Goldman, Chung, etc) In this study, a Temporal Evidence Map data transcription tool was devised so that convergent sources of evidence could be analysed in unison Temporal Evidence Maps explicitly reproduce the data along a time axis owing to the evidentiary weight of latencies at different points during problem solving So by combining the computer click-stream data with verbal/behavioural reports, it provides multiple sources of synchronised, concurrent evidence about the cognitive processing being undertaken. Importantly from an assessment design perspective, interpretations of the click-stream data can be calibrated and validated from corresponding verbal data. Also, errors or gaps in one source of evidence aren’t necessarily shared by others, resulting in a more complete picture of cognition throughout each solution attempt. 43 grade 5 and 6 students Saturation evident Categorisations evident for the search class variable Cues for task refinement such as language and object manipulations Empirical support for theory about expert-novice differences So verbal data can help to explain the meaning of the click-stream data. Cues for automating the interpretation and scoring of complex process data A coding scheme of evidence identification rules can be built a-priori but refined using real data from the temporal evidence maps. E.g. if at an impasse … TEMs help to reveal the dependency of elicited behaviours upon various structural features of tasks and upon the knowledge and skills of students undertaking the tasks . I argue that TEMs are more useful than lists or tabulations of concurrent evidence (which is all that is presently in the literature) because temporal information is relevant to particular inferences in dynamic problem solving (like planning or persisting at an impasse for example). SMEs can arguably benefit from high-fidelity visual reconstructions of student processing that help to reveal the relative lengths of deliberation between certain problem solving actions. Design new problems with the CTA steps in them so that we can infer thinking from certain observed behaviours.
  • #11 Outline one or two of the observable variables and show how they fit in to the Cognitive Model (slide 6)
  • #12 A priori idea of what the data will look like and how different features will relate to observable indicators Empirically verified and refined the data evaluation rules through task piloting and use of Temporal Evidence Maps Automated the scoring by programming syntax to do the job of an expert rater Some potentially informative indicators were omitted due to programming difficulties and perceived subjectivity – area for future work
  • #13 Linguistic issues and labeling terminology Object functionality refinements Tasks thrown out if computation played a major role or if the opportunities to differentiate between students were limited X tasks out, Y tasks kept, Z new tasks constructed Task collation and assessment delivery Online testing platform linked from the CPS page on NSDC site, 8 to 12 tasks per form, 1 to 2 tasks per task type per form, reasonable time demands (10-30 minutes) based on findings from piloting Achieved sample size by task mostly of the order of 700-800 students per task
  • #14 Provides information for verifying the expected different approaches used by students attempting the task. Refer to peak at 8 for ‘correct’. Refer to left tail for ‘incorrect’. Data cleaning check. Iterative scoring rule refinement. Other data analyses were also conducted at this time include correlations between observables within and between tasks.
  • #15 Bayes Nets are a graphical representation of a joint probability distribution Elements are called nodes. Lines are called arcs. Models parent-child dependencies. Here latent variables are modelled as causes of observables. Missing arcs indicate conditional independence. Each variable is categorical, even those for which continuous observable data were collected. This is necessary for most Bayes Net implementations. It is subjective but should refer to theoretically coherent criteria where possible. Can estimate the conditional probability distributions for the Bayes Net from data An EM algorithm in the software iterates towards values which best predict the empirically collected observations When an observation is made, the value or state of the observable node is known with certainty, so you see the 100% bar. This finding then updates the joint probability distribution in the network. So you can see that in this example, the observation results in an updated probability distribution for the parent node (the trait variable) and the unrecorded observable (action count). The changes are sensible too.
  • #16 The graph serves as a common representation for subject matter experts and psychometricians. Bayes nets support Profile Scoring – providing simultaneous scores on more than one aspect of proficiency. Bayes nets support multiple observed outcome variables per task. Bayes nets support Bayesian modeling of their parameters. Bayes nets can be integrated into computer-based assessments to provide task-level feedback in addition to overall feedback reports So this is the graphical representation of the full cognitive and observational statistical model. It is structured to ensure that the assessment purpose can be addressed. i.e. to support inferences about the six intermediate variables. It is structured so that direct evidence about one student trait can provide indirect evidence about the others, through the ‘Search classification’ commonality variable. It is structured to accommodate various direct dependencies between observations It includes a modeled context effect variable to account for shared variation between observations owing to their being sampled from a common task and not attributable to the trait variables.
  • #17 Three approaches to model evaluation outlined here: 1.Case studies 2. Sensitivity analyses 3. Prediction accuracy analyses Looking for interpretability, consistency with theory, stability, reliability, evidentiary weight, and implications for improving task design On the basis of one task, the latent trait profile changes noticeably. The changes are consistent with theory about expert-novice differences. The profile is also sensible and can be related to an overall search class.
  • #18 Same number of problems correct. Approximately similar balance of task complexity. There are differences in the temporal characteristics of the three students. The third student is approaching the problems differently and these differences, being marked by high redundancy and reduced solving time, are novice-like. It would be ideal to have some sort of external validation for results like these in future studies
  • #19 Three indices for quantifying evidentiary weight and prediction accuracies were calculated for the full Bayesian model. Some promising results were identified: Sensitivity analyses examine… Sensitivity analyses confirmed that observable variables included in the Bayes Net were informative and influenced the most probable student trait profile. Prediction accuracy for every observable was calculated using a repeated hold-out method with 90% of data for parameter learning and 10% of data to be predicted. Prediction accuracies for student traits based on splits of only the equiv of 3 tasks were moderate. Some implications for modeling search-based problem solving were also identified. E.g. boundary violations.
  • #20 Validity evidence was discussed in terms of Messick’s (1989) aspects and also a more targeted conceptualisation of validity applied to computer-based problem solving assessment documented by Baker and Mayer (1999). Reliability was discussed in terms of sources of noise in the collected evidence. One index quantifying the reproducibility of assessment inferences was calculated to get a benchmark for this initial assessment system and context.
  • #21 Student profile of general characteristics of the individual’s solutions. Labels adapted from the cognitive model for the target audience.
  • #22 Future research possibilities: Explicate links between student latent profiles and targeted interventions, and evaluate effectiveness of instruction Evaluate alternative cognitive models and data interpretations Correlate aspects of student performances on other related assessments Incorporate feedback in a formative assessment version Incorporate adaptivity into the selection of tasks Demonstrate that the TEM is an improvement over tabular methods Make tasks more congruent with real-world problems Look at impact on learned parameters of a controlled administration