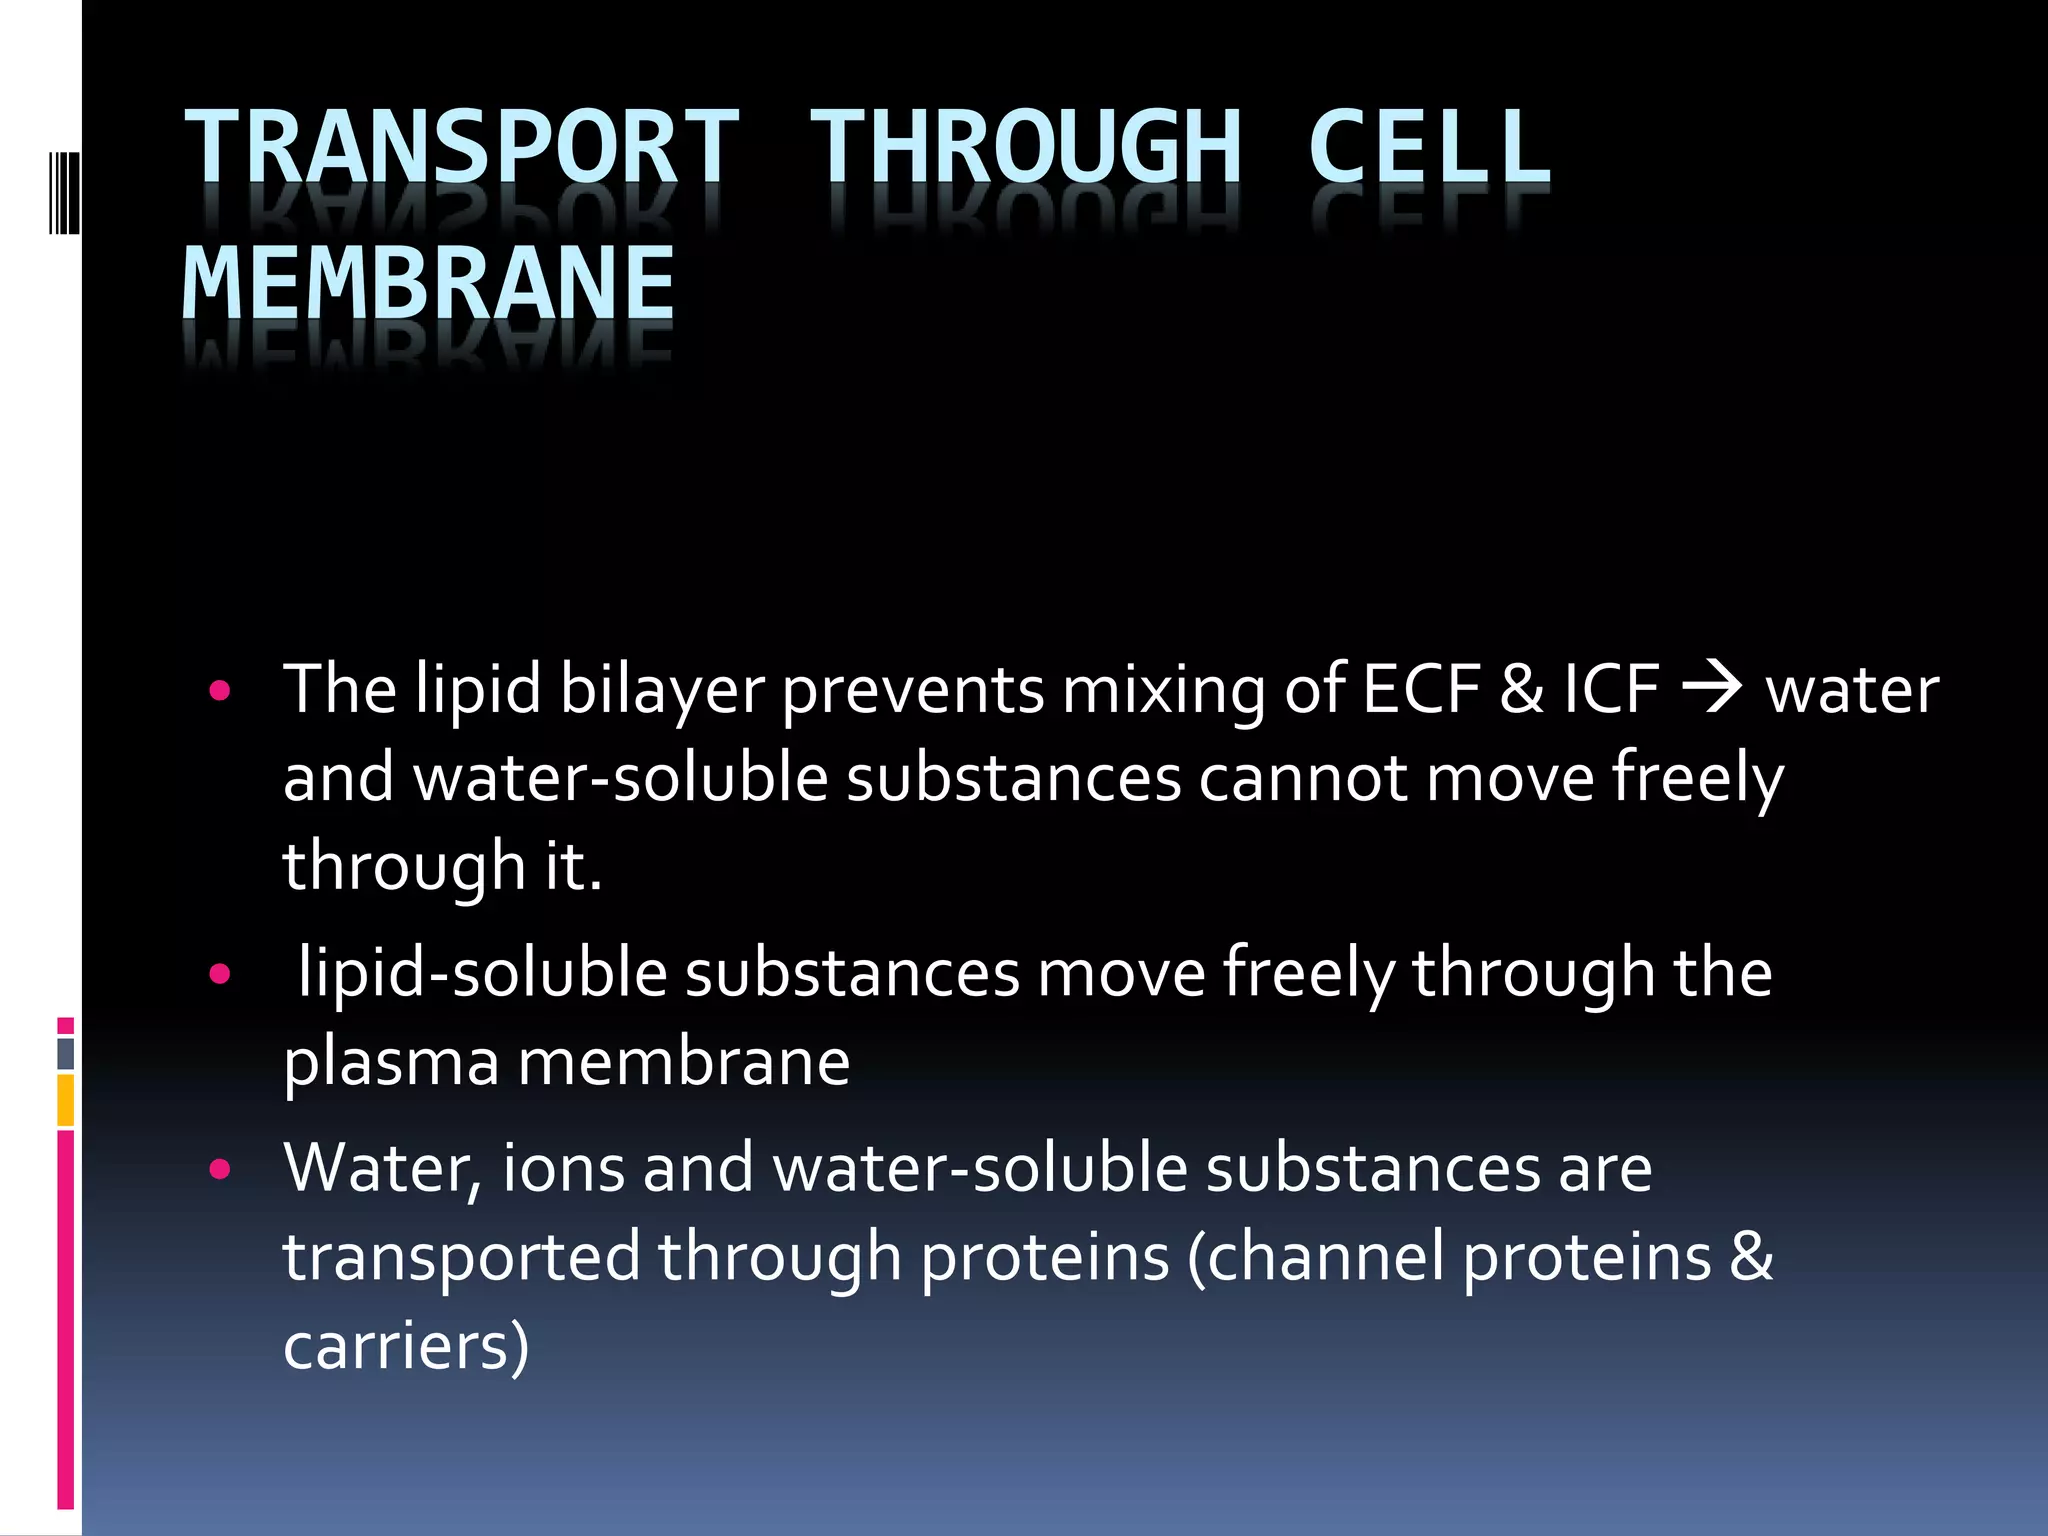
- Cells are composed of a nucleus surrounded by a nuclear membrane and cytoplasm surrounded by a plasma membrane. The plasma membrane is made mainly of proteins and lipids arranged in a bilayer that allows some substances to pass through, while preventing others.
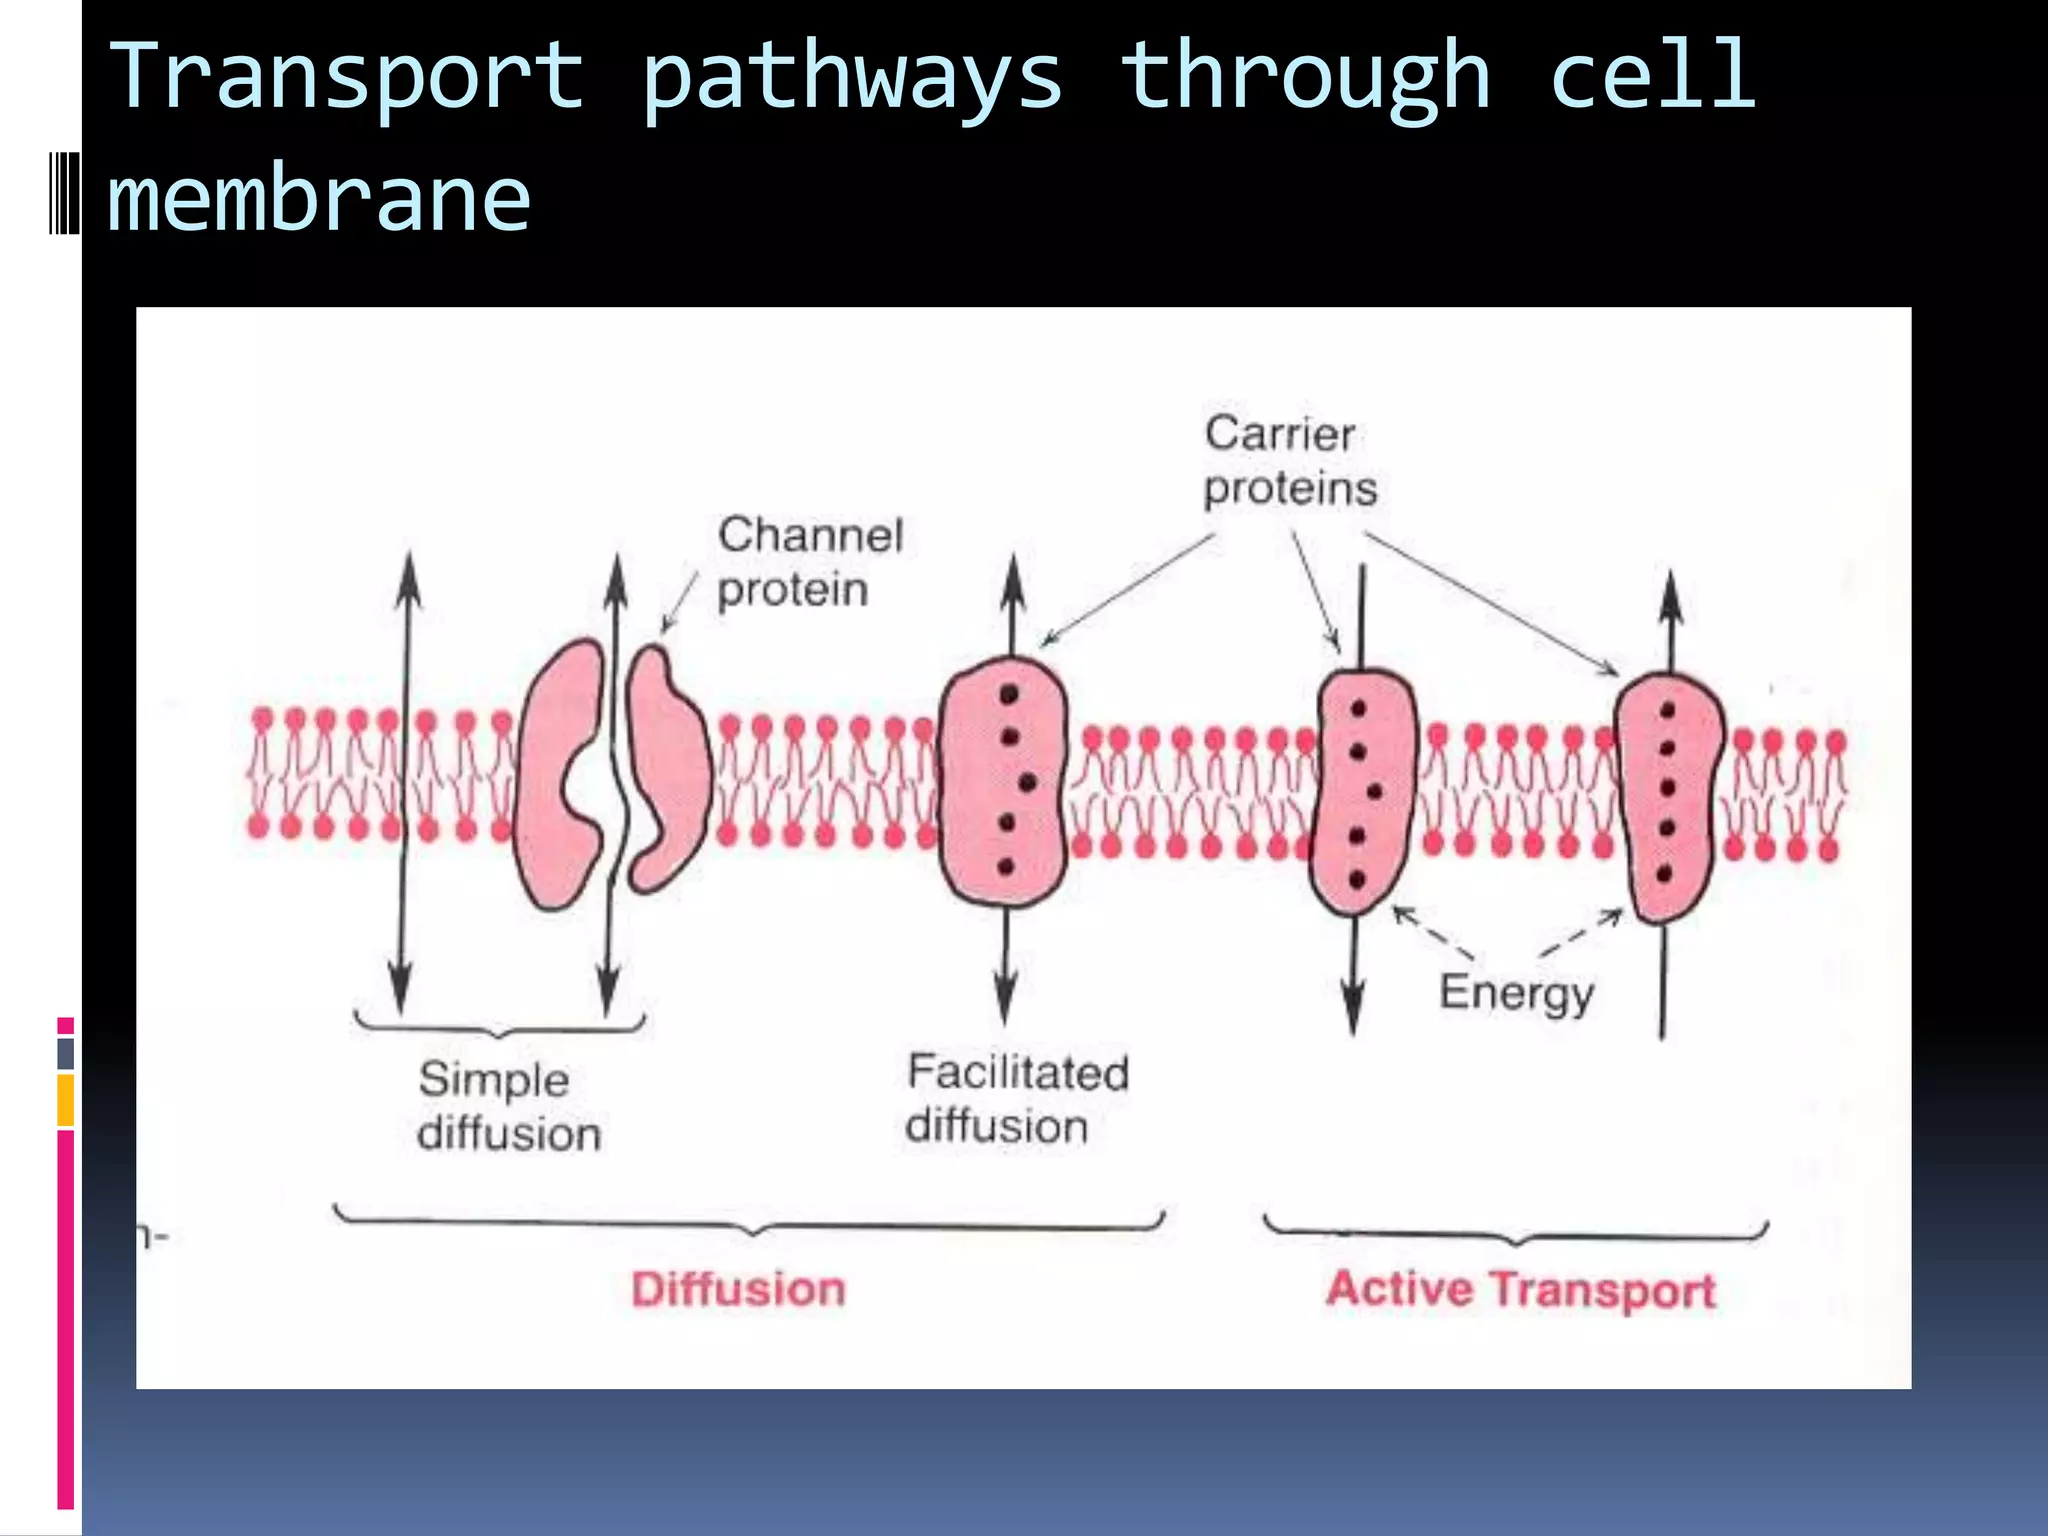
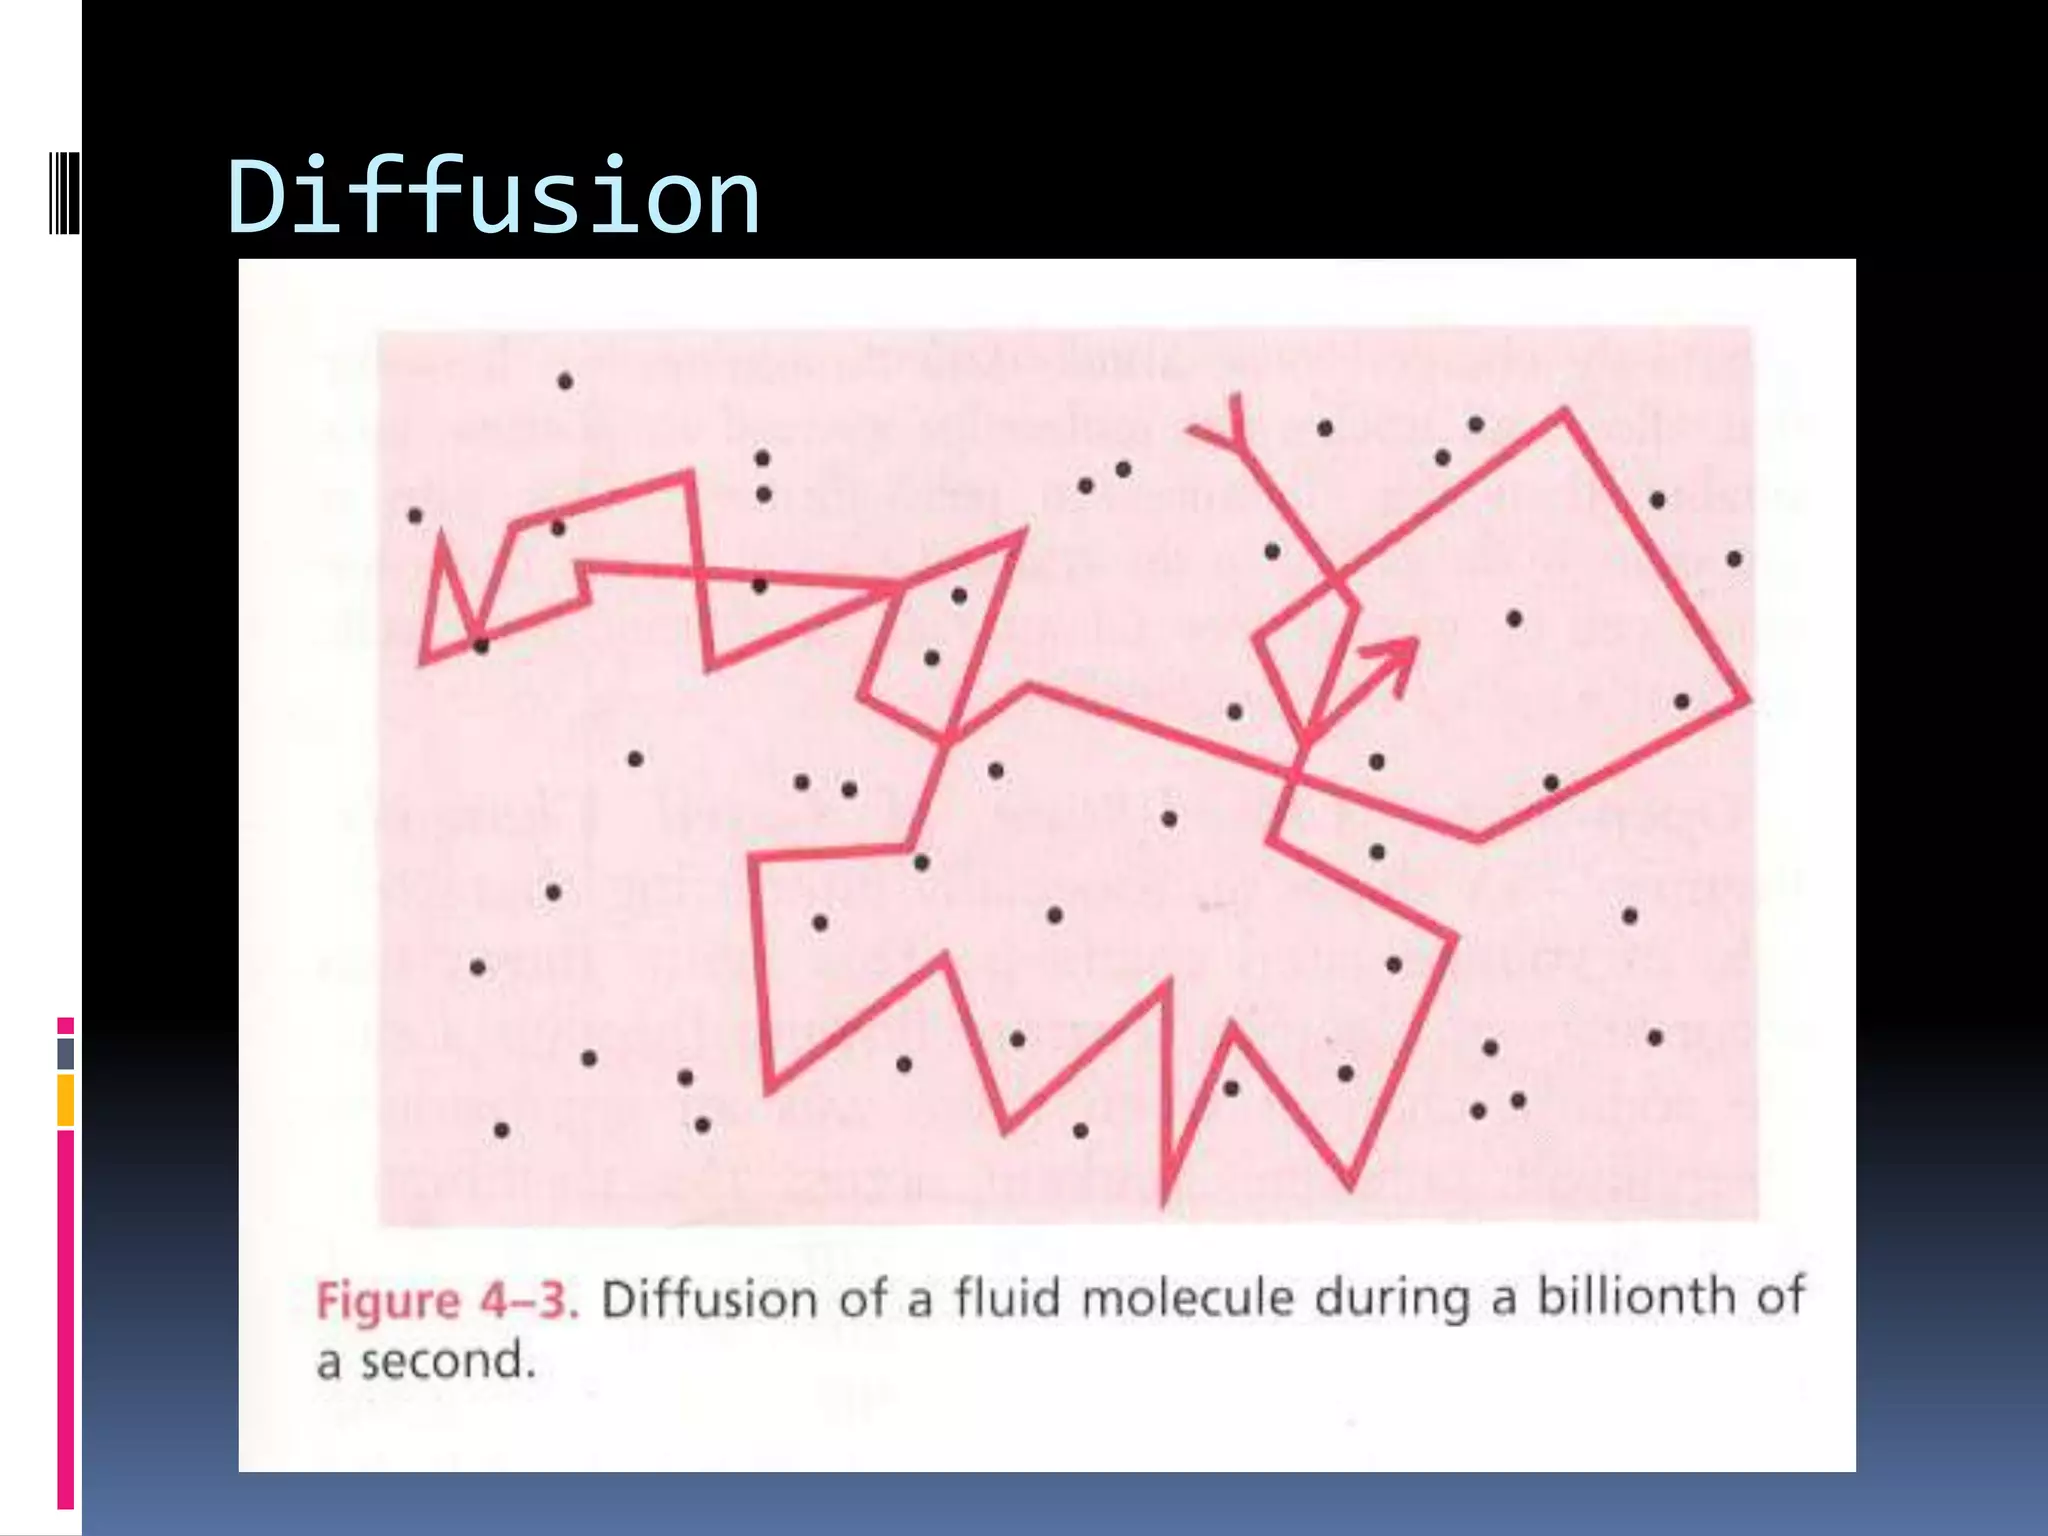
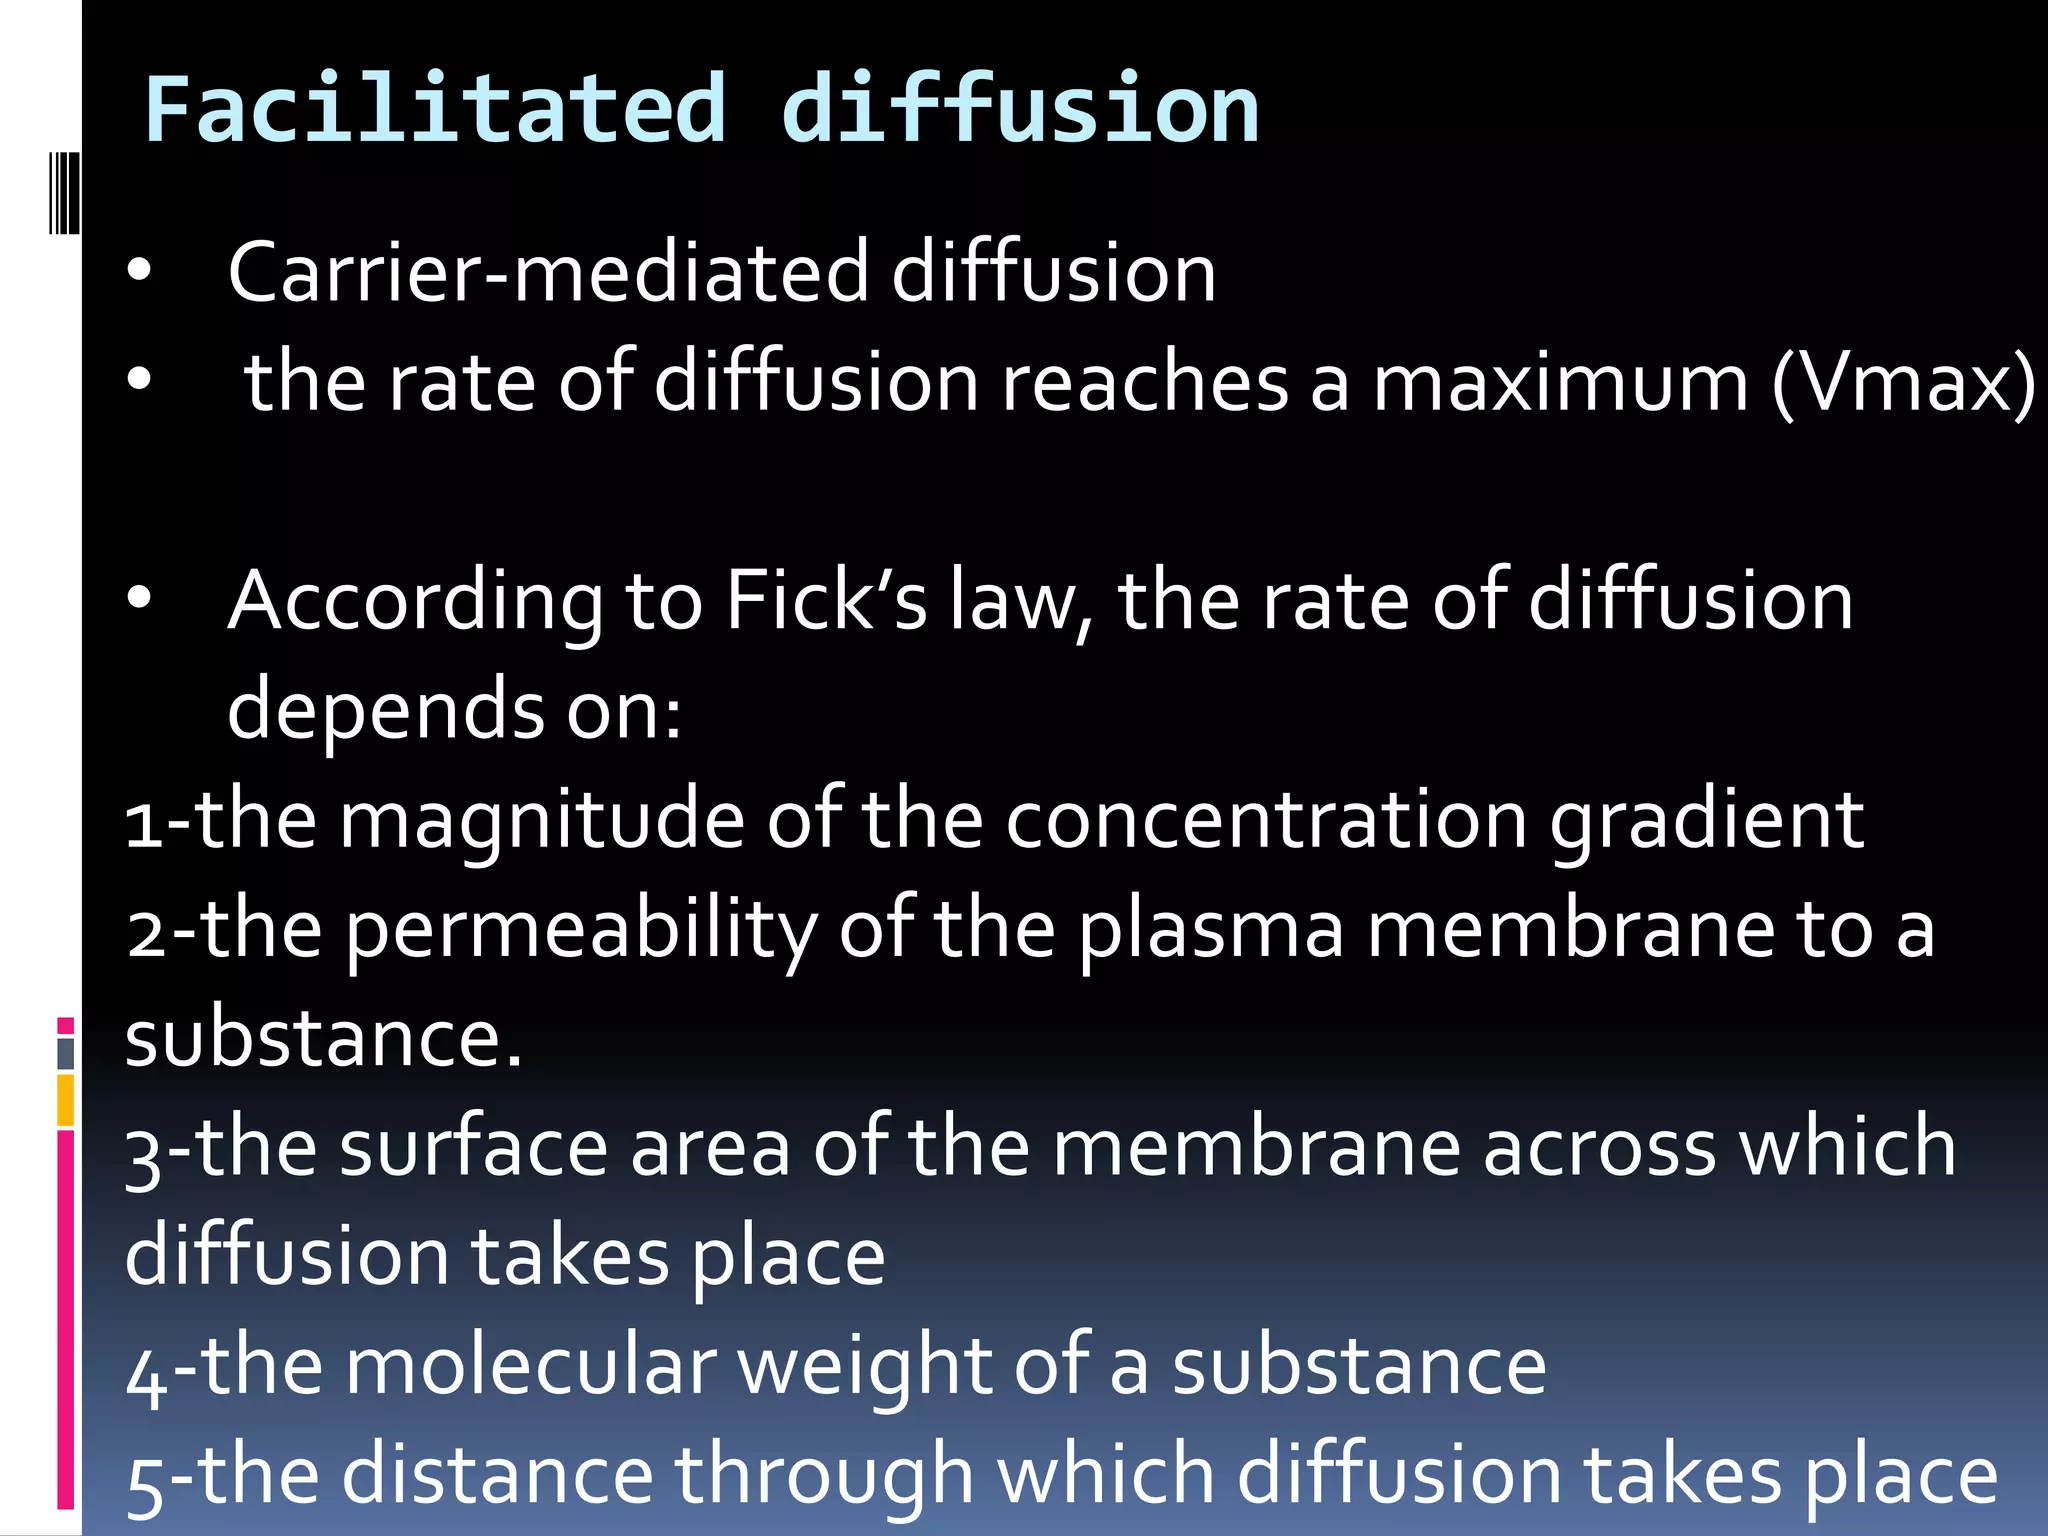
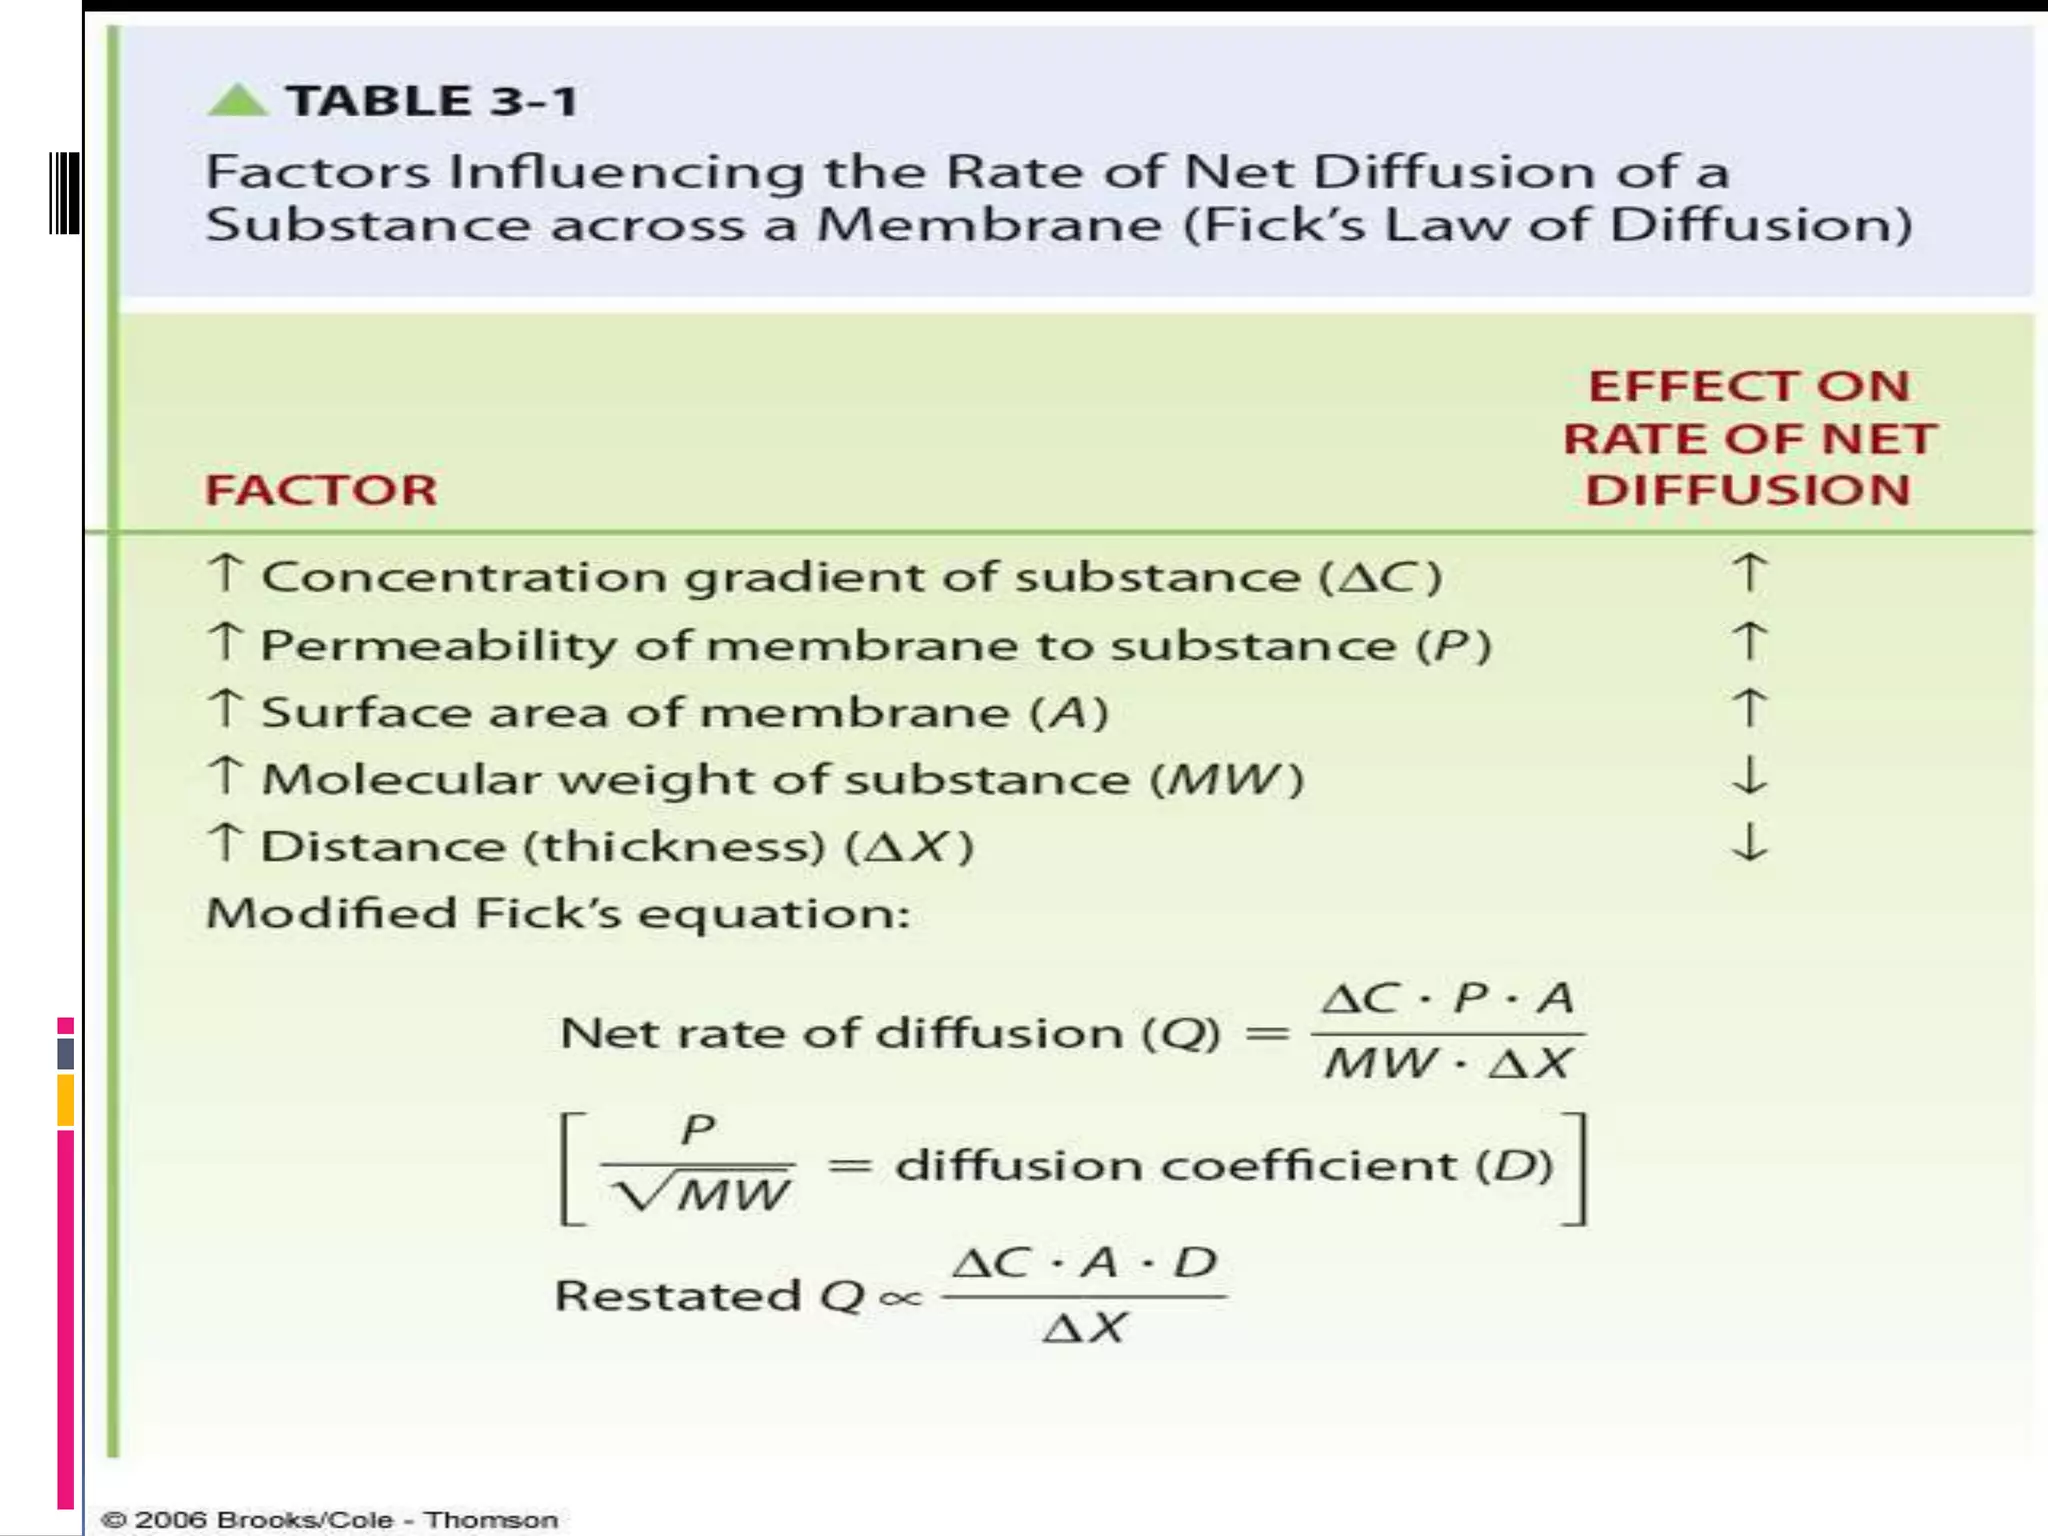
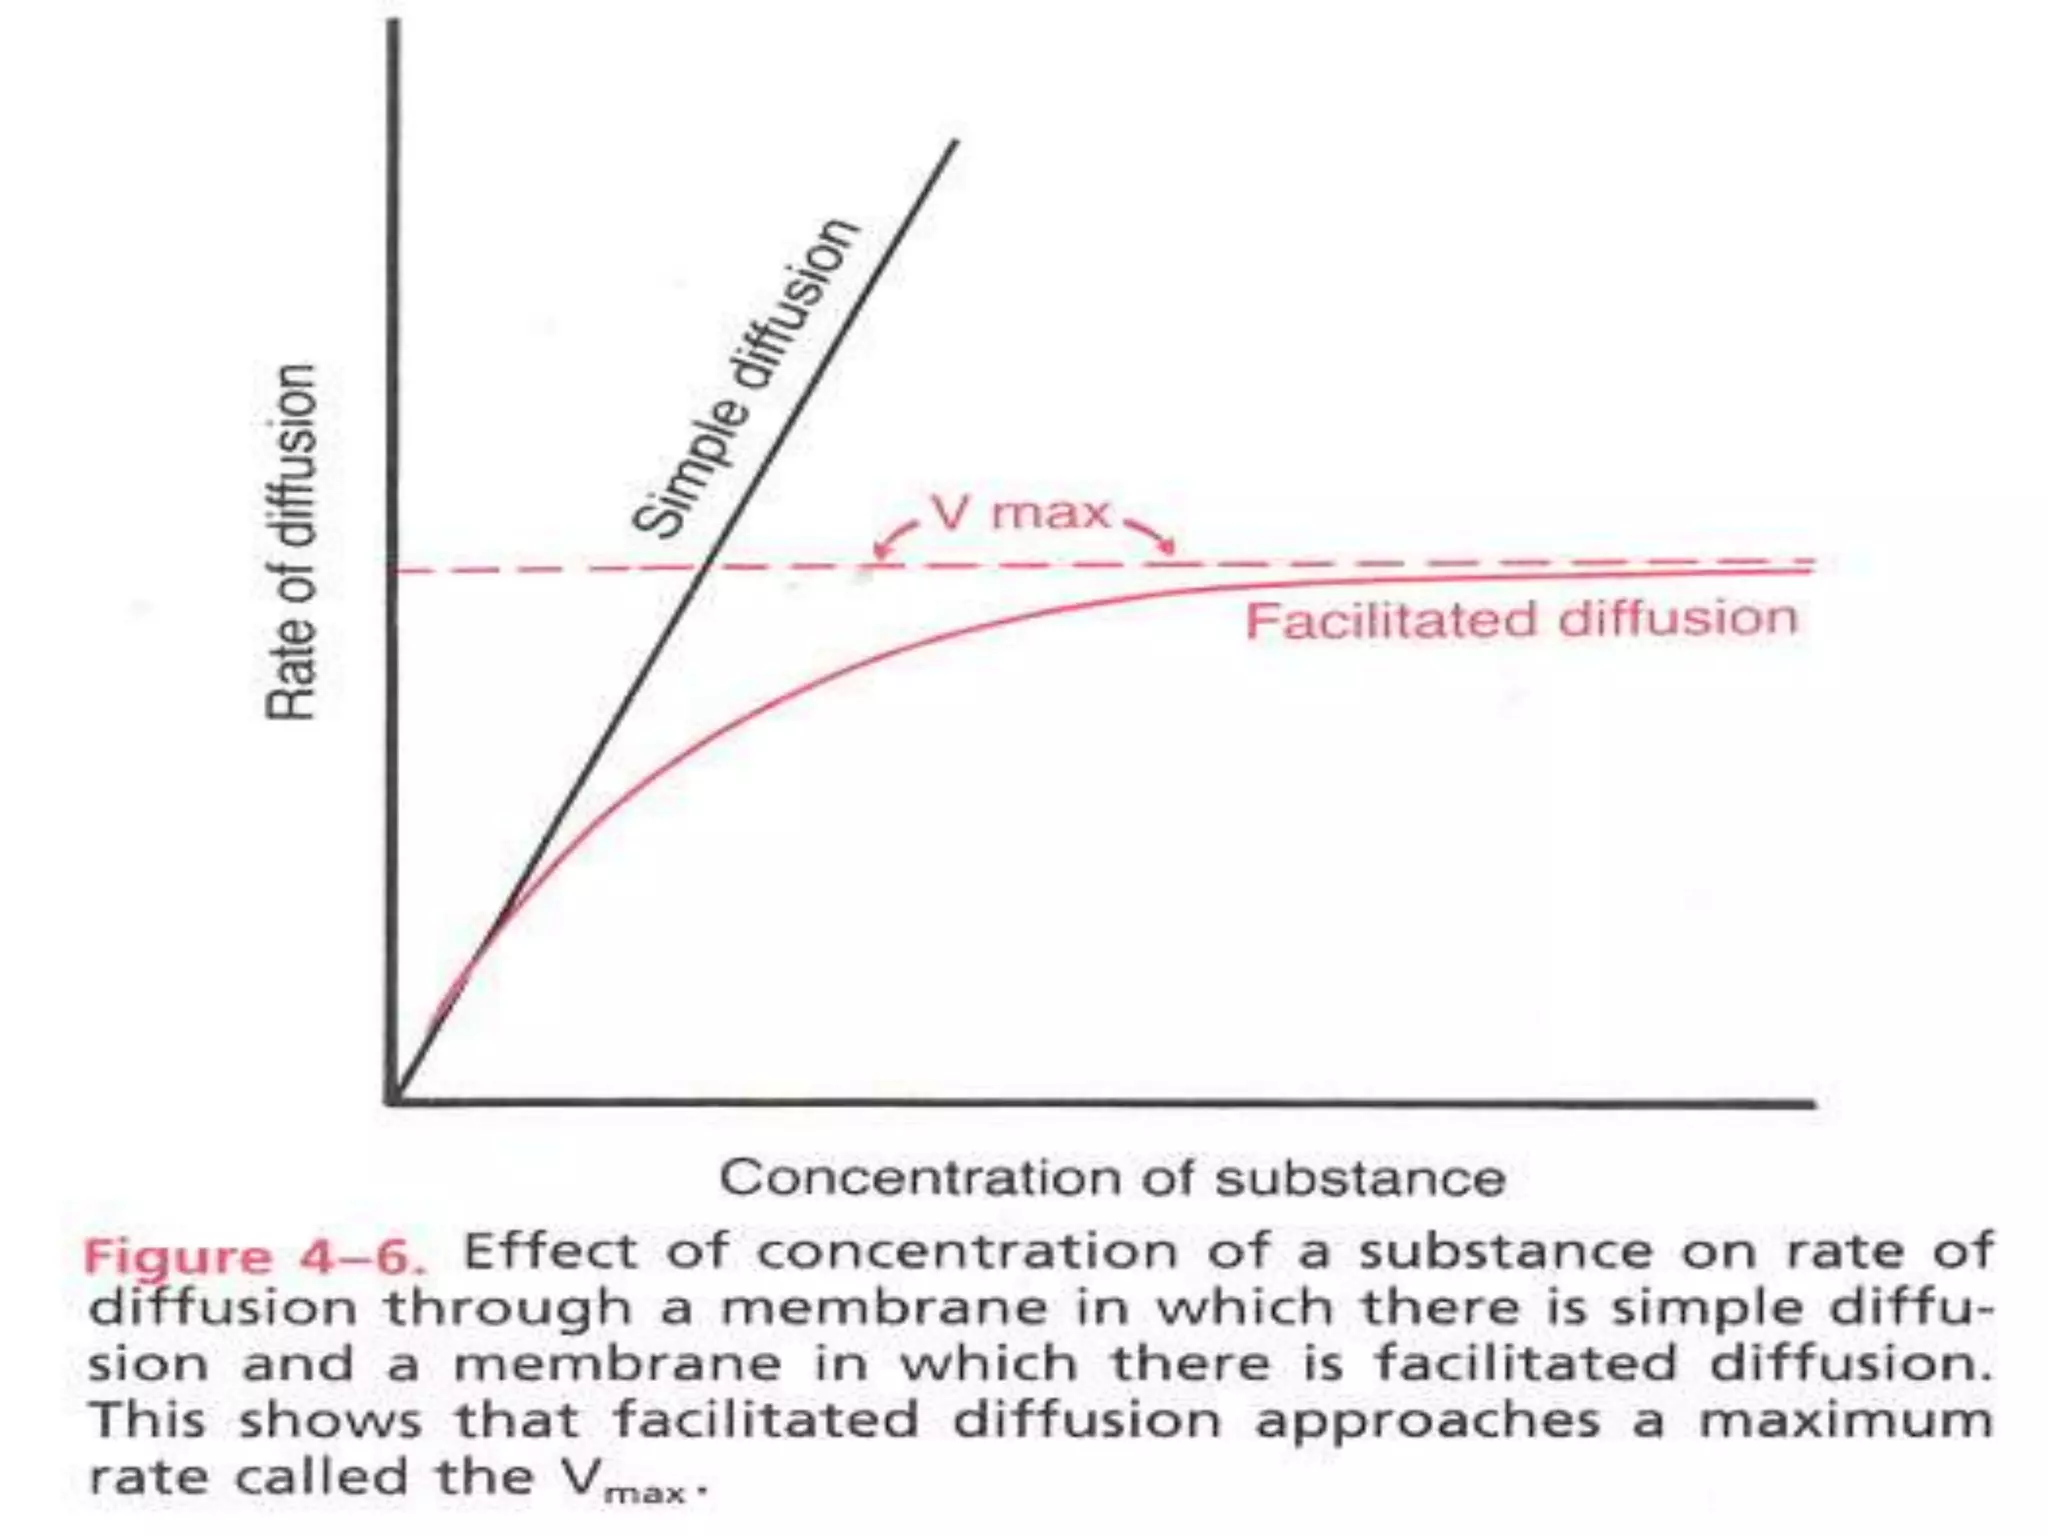
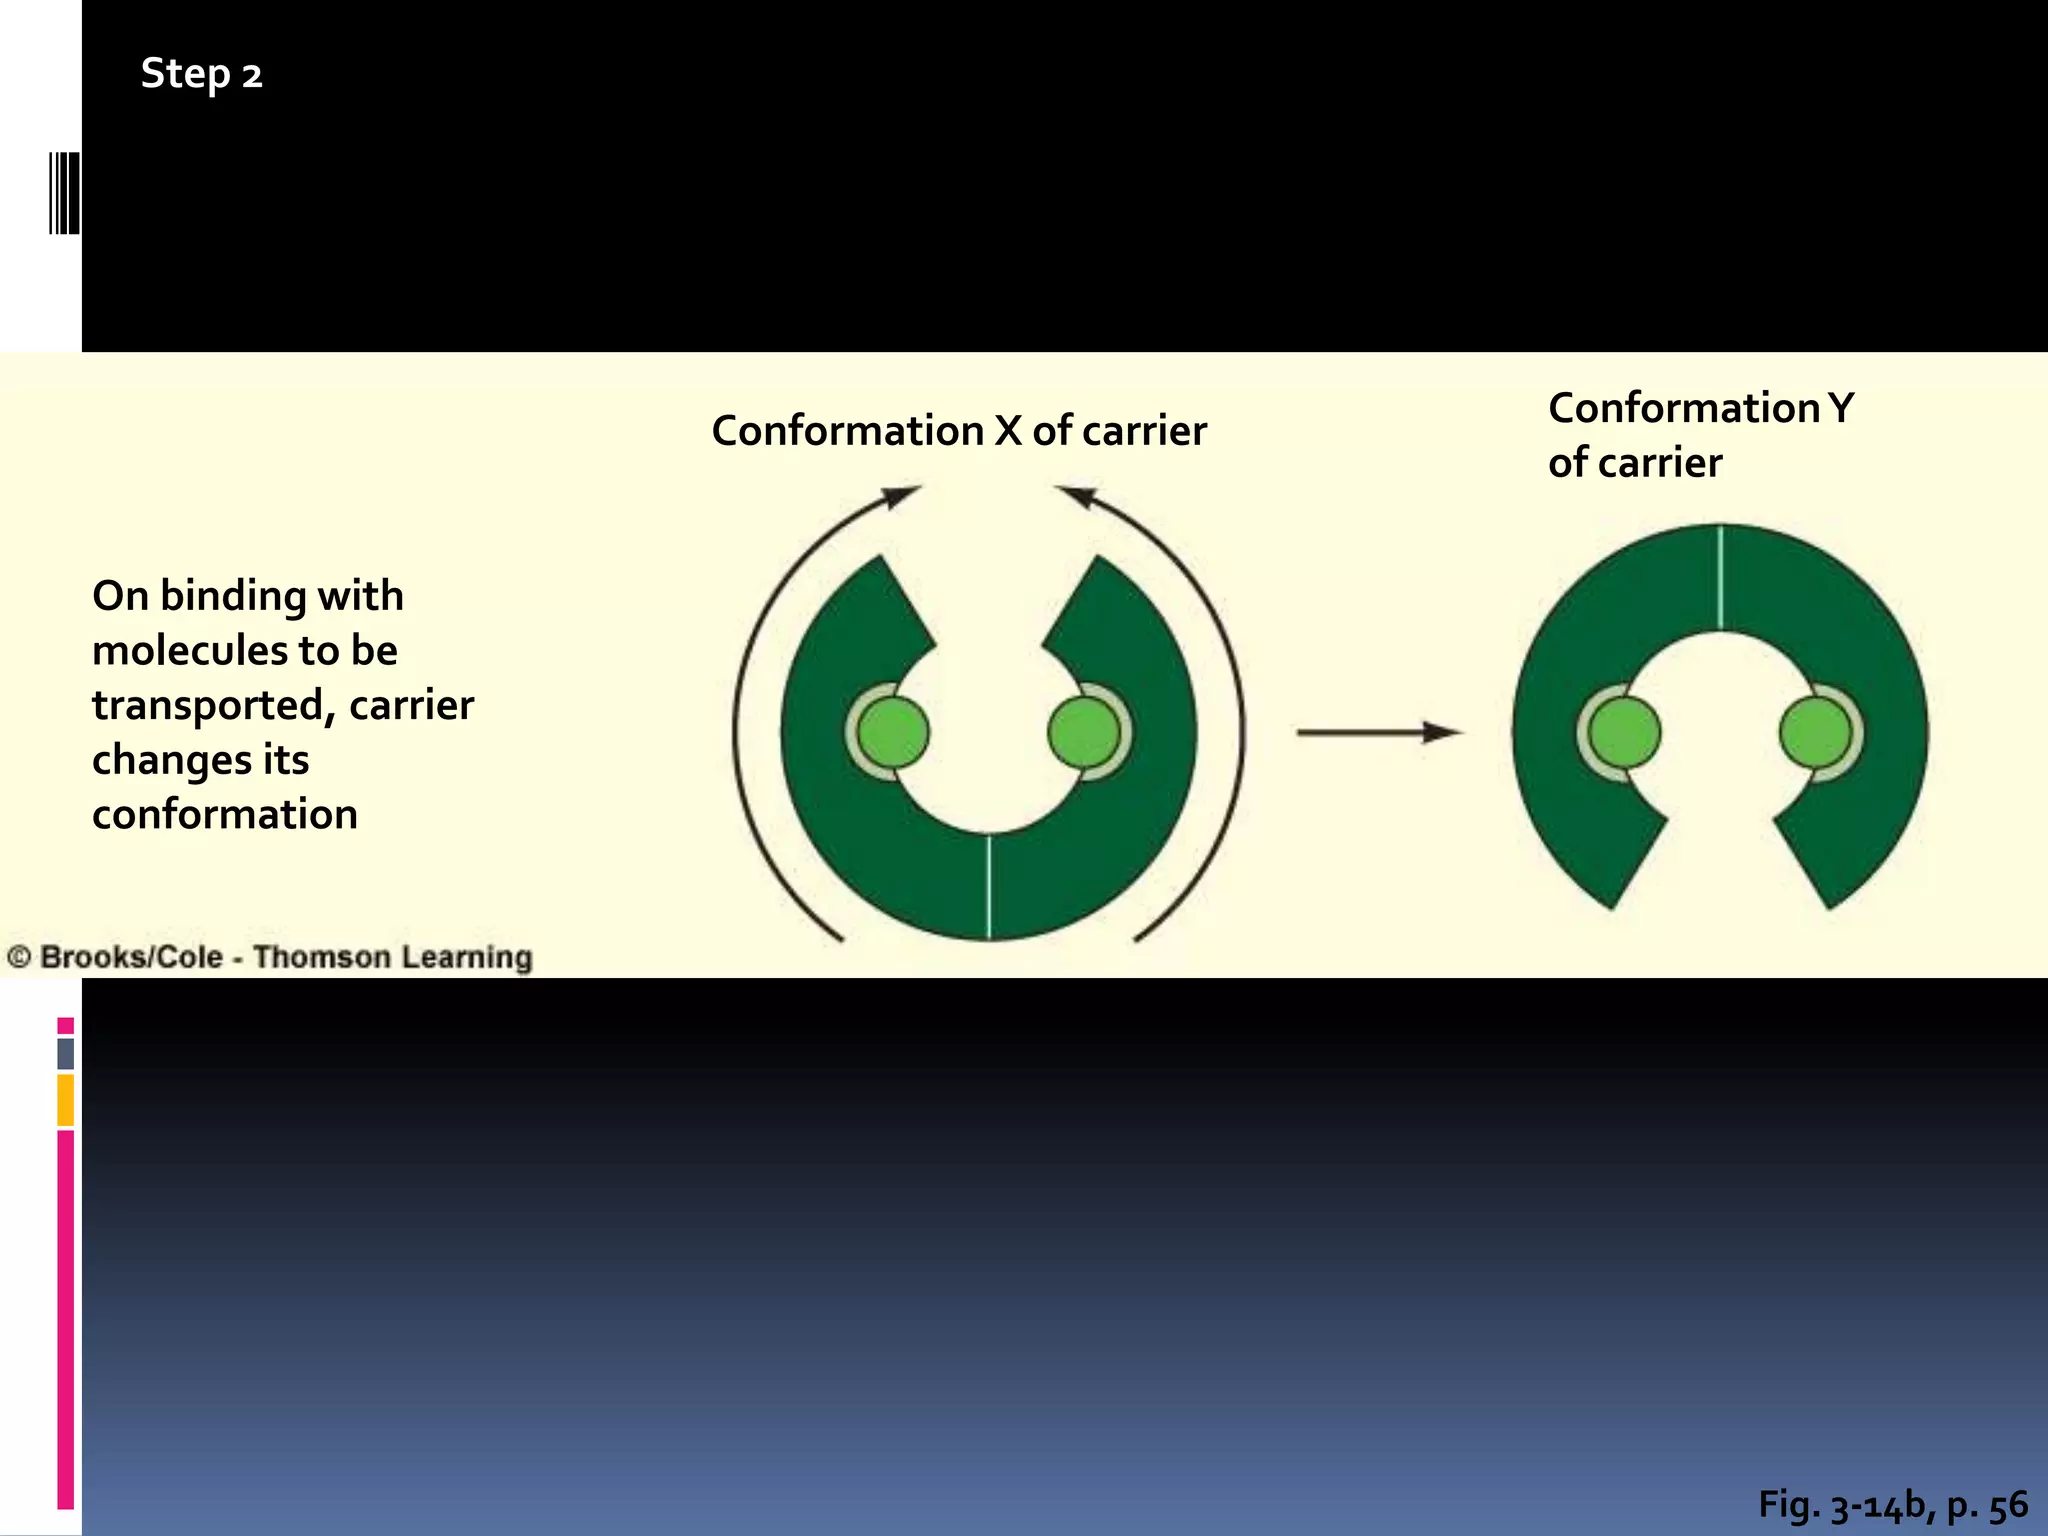
- There are two main types of transport across the plasma membrane: passive transport such as simple diffusion of lipid-soluble substances and facilitated diffusion through membrane proteins; and active transport using membrane proteins that require energy to move substances against a concentration gradient.
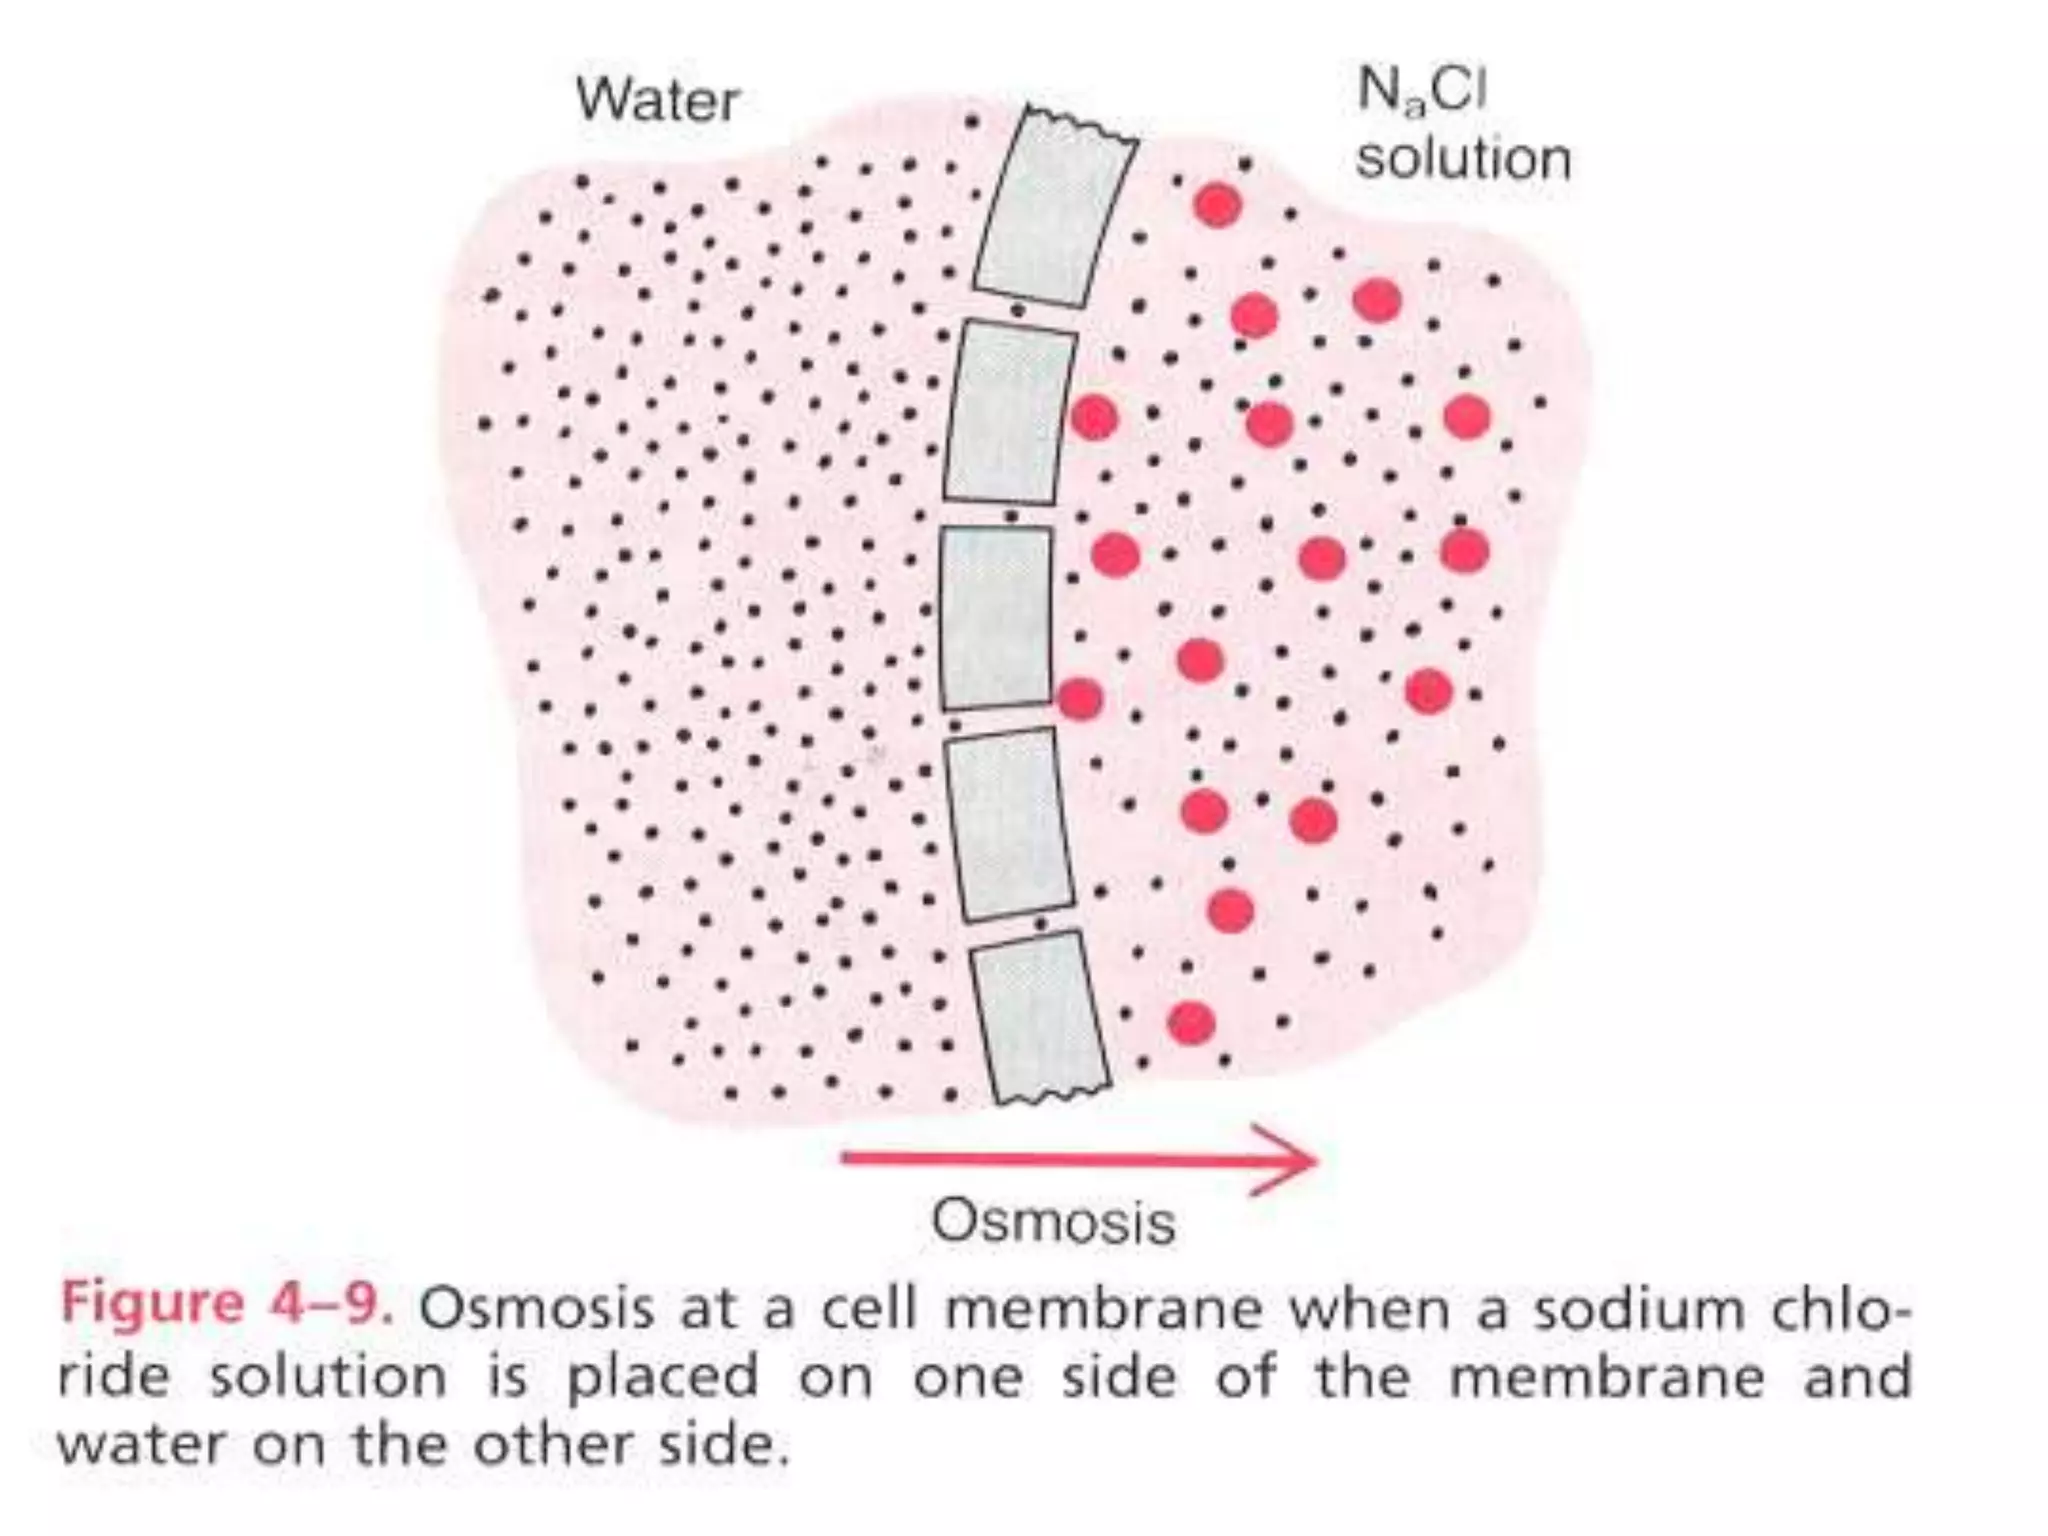
- Osmosis is the diffusion of water across a semipermeable membrane according to the concentration of solutes on each side. It allows water to move from an area of high water concentration and low solutes to an area


![•Basic principles of osmosis:
water diffuses from high [H2O] to
region of lower [H2O] . (Kinetics).
Osmosis](https://image.slidesharecdn.com/g-150215125854-conversion-gate01/75/Cell-membrane-23-2048.jpg)


![•Osmotic pressure : pressure that prevents
the osmosis .
•The higher the osmotic pressure of a
solution, the lower its [H2O] but the higher its
[solute].
•According to van’t hoff’s law:
π = CRT
π= 19300 mm Hg for 1 osmole/liter at body
temp.
π(osmotic pr.) C(solute con. In osmole/liter)
R (ideal gas const.) T(absolute temp.)](https://image.slidesharecdn.com/g-150215125854-conversion-gate01/75/Cell-membrane-34-2048.jpg)


![Epithelium[1]](https://cdn.slidesharecdn.com/ss_thumbnails/epithelium1-200323141425-thumbnail.jpg?width=640&height=640&fit=bounds)