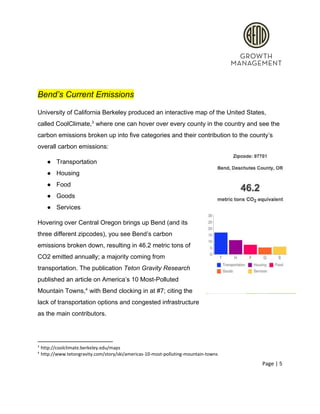
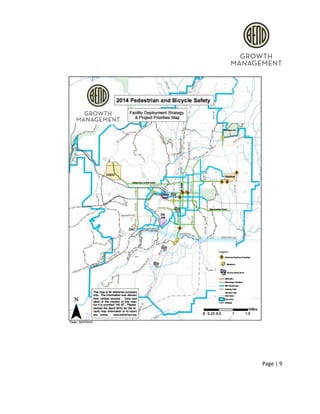
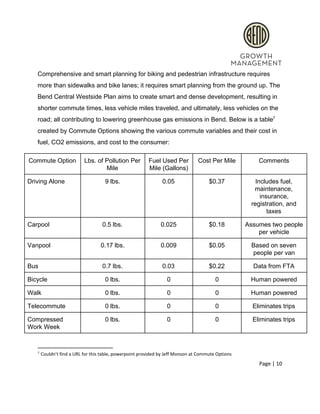
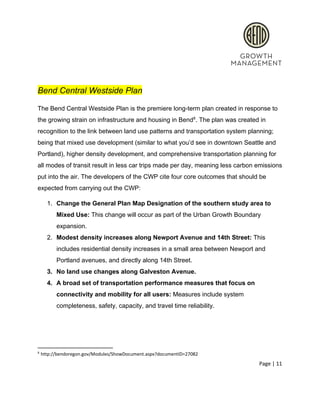
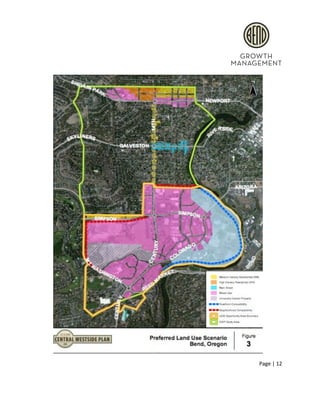
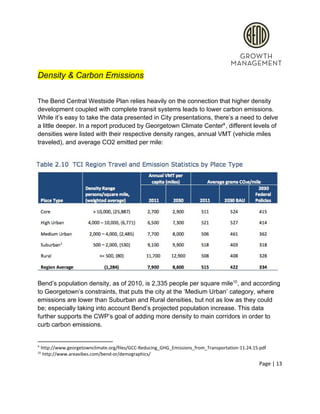
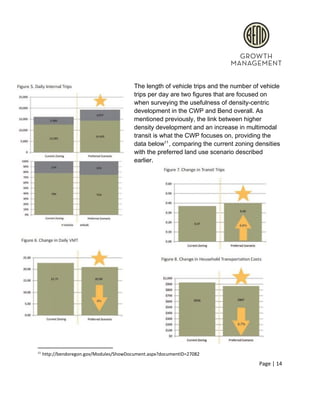
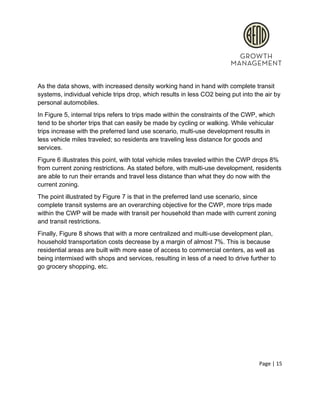
SlideShare a Scribd company logo
1 of 20
Download to read offline


GREENHOUSE GAS EMISSIONS REPORT: BEND, OR 
Austin Anderson 


Page | 1  


Table of Contents 
March, 2016 
 
Page 1 Title 
Page 3 Executive Summary 
Page 4 Background ­ Bend’s History 
Page 5 Bend’s Current Emissions 
Page 6 Transportation Goals 
Page 8 Bend Transportation 
Page 9 Bicycle System Map 
Page 10 Bend Commute Options & Costs 
Page 11 Bend Central Westside Plan 
Page 12 Preferred Land Use Scenario Map 
Page 13 Density and CO2 Table 
Page 14 CWP Trip Data 
Page 16 Portland’s Climate Strategy 
Page 18 Portland/Bend Transit Maps 
Page 20 Conclusion 


Page | 2  


EXECUTIVE SUMMARY 
Oregon’s Emission Background 
 
In the year 2004, Oregon’s governor, Ted Kulongoski, laid out three goals for the state 
to achieve in order to reduce carbon emissions that are still in effect, and guiding the 
state today: 1) mitigate emission growth by the year 2010, 2) reduce emissions by 10% 
to get below 1990 levels by the year 2020, and 3) reduce emissions by 75% to get 
below 1990 levels by the year 2050. Oregon easily met the first goal the governor set 
forth in 2004, but as of 2014, the state is not on track to meet the remaining two goals. 
In 2010, the State of Oregon established the Oregon Sustainable Transportation 
Initiative (OSTI) in order to develop and execute plans to reduce greenhouse gas 
emissions, and in 2013, OSTI submitted a Statewide Transportation Strategy for 
reducing greenhouse gas emissions for all Metropolitan Planning Regions in Oregon; 
Bend, Central Lane,Corvallis, Rogue Valley, Salem­Keizer, Albany, Middle Rogue, and 
Portland Metro. 
 
 
Page | 3  


WHERE DOES BEND STAND? 
Background & Bend 
 
Bend was incorporated as a municipality in the winter of 1905, following the construction 
of the town’s first commercial sawmill; built by Pilot Butte Development Company. The 
municipality was originally called “Farewell Bend,” a namesake to the Farewell Bend 
Ranch, which was later shortened to the name we know today by the U.S. Postal 
Service. Bend saw a steady growth in population since its inception, relying mainly on 
forestry and logging as its main industry. Bend’s transformation into a tourism and 
retirement destination caused the population of the city to explode; between the 2000 
and 2010 census, the city saw an increase of nearly twenty­five thousand people ­­ a 
47% increase.  According to the Bend Transit Plan, Bend is one of the fastest growing 1
communities in the state of Oregon,  with a long range population plan of 130,000 2
residents. The Bend Transit Plan addresses an issue the city is faced with this 
projection, being that increased strain on infrastructure through transportation and 
housing will push the city’s carbon emissions to higher levels.  
 
 
1
 https://en.wikipedia.org/wiki/Bend,_Oregon 
2
 http://www.bend.or.us/index.aspx?page=759 
Page | 4  


Bend’s Current Emissions 
University of California Berkeley produced an interactive map of the United States, 
called CoolClimate,  where one can hover over every county in the country and see the 3
carbon emissions broken up into five categories and their contribution to the county’s 
overall carbon emissions: 
● Transportation 
● Housing 
● Food 
● Goods 
● Services 
Hovering over Central Oregon brings up Bend (and its 
three different zipcodes), you see Bend’s carbon 
emissions broken down, resulting in 46.2 metric tons of 
CO2 emitted annually; a majority coming from 
transportation. The publication ​Teton Gravity Research 
published an article on America’s 10 Most­Polluted 
Mountain Towns,  with Bend clocking in at #7; citing the 4
lack of transportation options and congested infrastructure 
as the main contributors.  
3
 http://coolclimate.berkeley.edu/maps 
4
 http://www.tetongravity.com/story/ski/americas­10­most­polluting­mountain­towns 
Page | 5  


In order to combat and curb further increases in CO2 emissions for Bend, the Bend 
Metropolitan Planning Organization has been working with the City of Bend and the 
State of Oregon to establish goals for the city to reach, as well as designing new 
infrastructure and development plans to increase density and use of public transit; 
shifting the city away from a suburban model that better suits a small town to a model of 
centralized density that will better suit a city of Bend’s size. 
Bend Area General Plan 
In Chapter 7  of The Bend Area General Plan, produced by the City of Bend, it outlines 5
transportation goals for the city: 
1. Mobility & Balance 
a. Develop a transportation system that serves all modes of travel and 
reduces the reliance on the automobile. 
b. Provide a variety of practical and convenient means to move people and 
goods within the urban area. 
2. Efficiency 
a. Address traffic congestion and problem areas by evaluating the broadest 
range of transportation solutions.  
b. Coordinate and design transportation improvements to assure the 
expenditure of resources in the most cost­effective manner.  
c. Encourage the development of land use patterns that provide efficient, 
compact use of land, and facilitate a reduced number and length of trips. 
5
 http://bendoregon.gov/modules/showdocument.aspx?documentid=4073 
Page | 6  
 
 
3. Accessibility and Equity 
a. Provide people of all income levels with the widest range of travel and 
access options within the Bend urban area. 
b. Provide all transportation modes access to all parts of the community. 
4. Environmental  
a. Recognize and respect the natural features over which transportation 
improvements pass to minimize adverse impacts. 
b. Design transportation improvements to preserve air and water quality, 
minimize noise impacts, and encourage energy conservation. 
5. Economic 
a. Implement transportation improvements to foster economic development 
and business vitality. 
6. Livability 
a. Design and locate transportation facilities to be sensitive to protecting the 
livability of the community.  
7. Safety 
a. Design and construct the transportation system to enhance travel safety 
for all modes. 
These goals set by the City of Bend and Bend MPO are there to provide a clear­cut plan 
on how infrastructure and transit development needs to work for the community it’s 
meant to serve. Bend’s current transit plan lines out plans for more protected bike lanes 
(like what is seen on Riverside Boulevard along Drake Park) and more comprehensive 
bus routing than what is already in place.  
 
Page | 7  


Bend Transportation 
In 2013, the City of Bend formed a citizen’s advisory committee with the goal to guide 
the development of pedestrian and bicycling infrastructure in future city developments. 
The committee, which consisted of members from the Deschutes County Commission 
and the Bend City Council, drafted a Strategic Implementation Plan for Pedestrian and 
Biking Infrastructure  to charter their goals and objectives for future developments: 6
Biking Facilities 
1. Focus on central core where densities and land use intensity are greatest 
(Century Drive to Purcell; Butler Market to Reed Market; shown on map below). 
2. Capitalize on private development provided infrastructure. 
3. Capitalize on maintenance projects (road overlays).  
4. Provide the next level of bike facility (not just a bike lane, but instead cycle 
tracks, separated bike lanes and boxes). 
5. Create complete streets to accommodate multimodal trips.   
These goals and objectives were lined out and agreed upon by committee members 
after a public forum, where the next steps to get them included in future development 
plans included developing a design RFP (request for proposal) to provide concept 
designs for the projects, creating a budget system that would result in construction of 
projects, and establishing funding for on­going bicycle system upkeep.  
 
6
 http://bendoregon.gov/Modules/ShowDocument.aspx?documentID=24252 
Page | 8  


Page | 9  
 
 
Comprehensive and smart planning for biking and pedestrian infrastructure requires 
more than sidewalks and bike lanes; it requires smart planning from the ground up. The 
Bend Central Westside Plan aims to create smart and dense development, resulting in 
shorter commute times, less vehicle miles traveled, and ultimately, less vehicles on the 
road; all contributing to lowering greenhouse gas emissions in Bend. Below is a table  7
created by Commute Options showing the various commute variables and their cost in 
fuel, CO2 emissions, and cost to the consumer: 
Commute Option  Lbs. of Pollution Per 
Mile 
Fuel Used Per 
Mile (Gallons) 
Cost Per Mile  Comments 
Driving Alone  9 lbs.  0.05  $0.37  Includes fuel, 
maintenance, 
insurance, 
registration, and 
taxes 
Carpool  0.5 lbs.  0.025  $0.18  Assumes two people 
per vehicle 
Vanpool  0.17 lbs.  0.009  $0.05  Based on seven 
people per van 
Bus  0.7 lbs.  0.03  $0.22  Data from FTA 
Bicycle  0 lbs.  0  0  Human powered 
Walk  0 lbs.  0  0  Human powered 
Telecommute  0 lbs.   0  0  Eliminates trips 
Compressed 
Work Week 
0 lbs.  0  0  Eliminates trips 
7
 Couldn’t find a URL for this table, powerpoint provided by Jeff Monson at Commute Options 
Page | 10  


Bend Central Westside Plan 
The Bend Central Westside Plan is the premiere long­term plan created in response to 
the growing strain on infrastructure and housing in Bend . The plan was created in 8
recognition to the link between land use patterns and transportation system planning; 
being that mixed use development (similar to what you’d see in downtown Seattle and 
Portland), higher density development, and comprehensive transportation planning for 
all modes of transit result in less car trips made per day, meaning less carbon emissions 
put into the air. The developers of the CWP cite four core outcomes that should be 
expected from carrying out the CWP: 
1. Change the General Plan Map Designation of the southern study area to 
Mixed Use:​ This change will occur as part of the Urban Growth Boundary 
expansion.  
2. Modest density increases along Newport Avenue and 14th Street:​ This 
includes residential density increases in a small area between Newport and 
Portland avenues, and directly along 14th Street.  
3. No land use changes along Galveston Avenue.  
4. A broad set of transportation performance measures that focus on 
connectivity and mobility for all users: ​Measures include system 
completeness, safety, capacity, and travel time reliability.  
 
8
 http://bendoregon.gov/Modules/ShowDocument.aspx?documentID=27082 
Page | 11  


Page | 12  
 
 
Density & Carbon Emissions 
 
The Bend Central Westside Plan relies heavily on the connection that higher density 
development coupled with complete transit systems leads to lower carbon emissions. 
While it’s easy to take the data presented in City presentations, there’s a need to delve 
a little deeper. In a report produced by Georgetown Climate Center , different levels of 9
densities were listed with their respective density ranges, annual VMT (vehicle miles 
traveled), and average CO2 emitted per mile: 
Bend’s population density, as of 2010, is 2,335 people per square mile , and according 10
to Georgetown’s constraints, that puts the city at the ‘Medium Urban’ category, where 
emissions are lower than Suburban and Rural densities, but not as low as they could 
be; especially taking into account Bend’s projected population increase. This data 
further supports the CWP’s goal of adding more density to main corridors in order to 
curb carbon emissions.  
9
 http://www.georgetownclimate.org/files/GCC­Reducing_GHG_Emissions_from_Transportation­11.24.15.pdf 
10
 http://www.areavibes.com/bend­or/demographics/ 
Page | 13  


The length of vehicle trips and the number of vehicle 
trips per day are two figures that are focused on 
when surveying the usefulness of density­centric 
development in the CWP and Bend overall. As 
mentioned previously, the link between higher 
density development and an increase in multimodal 
transit is what the CWP focuses on, providing the 
data below , comparing the current zoning densities 11
with the preferred land use scenario described 
earlier.  


11
 http://bendoregon.gov/Modules/ShowDocument.aspx?documentID=27082 
Page | 14  


As the data shows, with increased density working hand in hand with complete transit 
systems, individual vehicle trips drop, which results in less CO2 being put into the air by 
personal automobiles.  
In Figure 5, internal trips refers to trips made within the constraints of the CWP, which 
tend to be shorter trips that can easily be made by cycling or walking. While vehicular 
trips increase with the preferred land use scenario, multi­use development results in 
less vehicle miles traveled; so residents are traveling less distance for goods and 
services.  
Figure 6 illustrates this point, with total vehicle miles traveled within the CWP drops 8% 
from current zoning restrictions. As stated before, with multi­use development, residents 
are able to run their errands and travel less distance than what they do now with the 
current zoning.  
The point illustrated by Figure 7 is that in the preferred land use scenario, since 
complete transit systems are an overarching objective for the CWP, more trips made 
within the CWP will be made with transit per household than made with current zoning 
and transit restrictions.  
Finally, Figure 8 shows that with a more centralized and multi­use development plan, 
household transportation costs decrease by a margin of almost 7%. This is because 
residential areas are built with more ease of access to commercial centers, as well as 
being intermixed with shops and services, resulting in less of a need to drive further to 
go grocery shopping, etc.  


Page | 15  


Portland’s Climate Strategy 
Oregon as a state is considered to be very progressive in terms of environmental policy 
to combat climate change, and Portland is revered as the premiere city leading the 
charge. Bend is quite progressive for a city its size, however, there’s 
always something new to learn and apply from the Rose City . 12
 
Portland’s combat against climate change began in 2009 with the 
formation of the Climate Smart Strategy in response to a mandate 
from the Oregon Legislature to reduce per capita greenhouse gas 
emissions from cars and small trucks by 2035. The development 
and implementation of this strategy was done in three phases.  
1. Phase 1​ began in 2011 and concluded in early 2012. This 
phase consisted of strategy testing at the regional level to 
determine which strategies would effectively help the region 
reach its emissions goal.  
2. Phase 2​ began in 2012 and concluded in October of 2013. 
During this phase, Metro worked with regional technical, 
policy advisory committees, and business and community 
leaders to shape three approaches and criteria used to 
evaluate them.  
3. Phase 3​ began in November of 2013 and concluded in 
December of 2014. The Metro Council adopted the region’s 
Climate Smart Strategy with unwavering support from local 
and state government partners.  
 
 
12
 http://www.oregonmetro.gov/sites/default/files/ClimateSmartStrategy­FinalVersion­2014.PDF 
Page | 16  
 
 
The goal of the Climate Smart Strategy is to demonstrate leadership on climate change 
by meeting agreed upon goals and targets for reducing carbon emissions and 
greenhouse gasses from light­duty vehicles while creating strong communities and 
economies.  
An overview of the strategies recommended in the Climate Smart Strategy: 
1. Implement adopted local and regional land use plans. 
2. Make transit convenient, frequent, affordable, and accessible.  
3. Make biking and walking safe and convenient.  
4. Make highways and streets safe, reliable, and connected.  
5. Use technology to actively manage the transportation system.  
6. Provide information and incentives to expand the use of travel options. 
7. Make efficient use of vehicle parking and land dedicated to parking.  
8. Support Oregon’s transition to cleaner, low­carbon fuels and more fuel­efficient 
vehicles.  
9. Secure adequate funding for transportation investments.  
Reading through the Climate Smart Strategy’s objectives, they’re a close call to the 
goals lined out in the Bend Area General Plan. Making transit accessible, securing 
funding, and providing incentives to using different modes of transportation are goals 
that both cities cite as important to creating an environmentally friendly, carbon reducing 
city; but considering the differing sizes of the respective urban areas, these goals are 
likely playing out in different ways, perhaps even more successfully in one city than the 
other.  
Transit 
Anybody that has visited Portland will tell you that the transit system throughout the city 
has improved by leaps and bounds; the MAX now runs miles in each direction (though 
comprehensive coverage outside of the city core has some catching up to do), and most 
transit is timely and relatively affordable. Compared to Bend’s still­developing system, 
Portland’s has it beat by miles. Below are two transit maps for Portland  and Bend ; 13 14
Portland has noticeably more coverage, even though Bend is much smaller.  
13
 http://www.oregonmetro.gov/sites/default/files/ClimateSmartStrategy­FinalVersion­2014.PDF 
14
 http://www.cascadeseasttransit.com/bend­bus­schedule/bend­schedule.html 
Page | 17  


Page | 18  


Such a comprehensive transit network can benefit Bend the same way it has benefitted 
Portland; although Bend doesn’t have the infrastructure for light rail like the MAX, but it 
does have the advantage of having the bare bones of a bus system. The city currently 
has 12 different bus lines servicing different parts of the city, but those lines are limited 
in where they run ­­ typically along main arterial thoroughfares, where Portland has 
main roads as well as secondary roads covered. Providing park­and­ride lots, like what 
exists on Columbia Street on the Westside, for nearby residents to be able to drive short 
distances and still be able to take advantage of transit if they don’t live near a main 
route. Not too long ago, Bend held the title as the largest city on the West Coast without 
a bus system, so this expansion on what currently exists will help reap more benefits ­­ 
like lower emissions from personal automobiles ­­ for the city.  
 
Travel/Commute Incentives 
Portland Metro employs multiple modes of outreach to incentivize people to use 
different forms of transit in the city to increase the efficiency of the city’s transit system. 
Strategies like public awareness, commuter programs, and transit tools are just a few 
ways Metro gets people to get out of their cars and use multimodal forms of transit. 
Public awareness at the most basic level is public education about transit and 
eco­driving; keeping vehicles maintained to be the most efficient and engaging efficient 
driving habits (completing all errands at the same time rather than making multiple 
trips). Organizations in Bend, like the Environmental Center, do fantastic jobs at 
educating the public, but it seems like the peak interest happens at special events like 
Earth Day. Year round public awareness campaigns can keep different commute 
strategies present in Bend’s mind, rather than a revolving fad at certain times of the 
year. Portland also uses employer­based programs to incentivize employees to use 
transit through transit pass programs, offering special parking for bicycles, and setting 
up employee carpool programs. The City of Bend employees these similar strategies for 
their employees, but as a whole, the city could benefit from offering similar programs 
across different sectors and industries.  
 
Page | 19  


Conclusion 
 
Throughout the research performed, it was obvious that Bend’s journey to creating a 
community and city with reduced carbon emissions is a relatively new and fresh idea. 
Supplemental data was useful to drive points home for Bend specifically, and much of 
the city’s new infrastructure is still new or under construction, so there isn’t a whole lot 
of data present for infrastructure as well.  
But what was apparent is the city’s dedication to creating a sustainable community with 
comprehensive transit and density that can maximize the precious space we have to 
build on, while also taking advantage of new technology and planning to make 
multi­use, walkable, and clean spaces. The other important aspect to making this 
happen ­­ the citizens of Bend ­­ also appear to be warming up to the idea of making an 
environmentally sound city, even though it’s not a process that happens overnight.  
Portland obviously leads the state in green development, but it’s essentially comparing 
apples to oranges because Portland is such an enormous metro area compared to 
Bend, the funding and support takes a little more work on this side of the mountains. But 
after researching, interviewing, and doing even more researching for these last few 
months, it’s not even a question as to if Bend is capable of becoming an 
environmentally sound city and community, it’s a matter of when.  
And from what has been seen, it’s not too far off in the future.  
Page | 20  
 

More Related Content

Viewers also liked

Going Global: What Businesses Need to Know About Intellectual Property Laws A...
Going Global: What Businesses Need to Know About Intellectual Property Laws A...Going Global: What Businesses Need to Know About Intellectual Property Laws A...
Going Global: What Businesses Need to Know About Intellectual Property Laws A...lorrainefleck
 
Descarga planilla de notas AAT 2009
Descarga planilla de notas AAT 2009Descarga planilla de notas AAT 2009
Descarga planilla de notas AAT 2009guest0853af25a
 
A Pilot study on KAP of the people in Araihazar Upazilla
A Pilot study on KAP of the people in Araihazar UpazillaA Pilot study on KAP of the people in Araihazar Upazilla
A Pilot study on KAP of the people in Araihazar UpazillaFZare
 
Optimization of sample configurations for spatial trend estimation
Optimization of sample configurations for spatial trend estimationOptimization of sample configurations for spatial trend estimation
Optimization of sample configurations for spatial trend estimationAlessandro Samuel-Rosa
 
Social Media 2017: Meistern Sie diese Herausforderungen
Social Media 2017: Meistern Sie diese Herausforderungen Social Media 2017: Meistern Sie diese Herausforderungen
Social Media 2017: Meistern Sie diese Herausforderungen TWT
 
Indicadores da Economia Brasileira: Setor Externo 2016
Indicadores da Economia Brasileira: Setor Externo 2016Indicadores da Economia Brasileira: Setor Externo 2016
Indicadores da Economia Brasileira: Setor Externo 2016Fundação Dom Cabral - FDC
 

Viewers also liked (11)

How does Web2.0 affect the trial process?
How does Web2.0 affect the trial process?How does Web2.0 affect the trial process?
How does Web2.0 affect the trial process?
 
Going Global: What Businesses Need to Know About Intellectual Property Laws A...
Going Global: What Businesses Need to Know About Intellectual Property Laws A...Going Global: What Businesses Need to Know About Intellectual Property Laws A...
Going Global: What Businesses Need to Know About Intellectual Property Laws A...
 
Descarga planilla de notas AAT 2009
Descarga planilla de notas AAT 2009Descarga planilla de notas AAT 2009
Descarga planilla de notas AAT 2009
 
A Pilot study on KAP of the people in Araihazar Upazilla
A Pilot study on KAP of the people in Araihazar UpazillaA Pilot study on KAP of the people in Araihazar Upazilla
A Pilot study on KAP of the people in Araihazar Upazilla
 
Optimization of sample configurations for spatial trend estimation
Optimization of sample configurations for spatial trend estimationOptimization of sample configurations for spatial trend estimation
Optimization of sample configurations for spatial trend estimation
 
Social Media 2017: Meistern Sie diese Herausforderungen
Social Media 2017: Meistern Sie diese Herausforderungen Social Media 2017: Meistern Sie diese Herausforderungen
Social Media 2017: Meistern Sie diese Herausforderungen
 
Japan power point
Japan power pointJapan power point
Japan power point
 
La robotica
La roboticaLa robotica
La robotica
 
Flower headbands-page-2
Flower headbands-page-2Flower headbands-page-2
Flower headbands-page-2
 
Flower hair- clips-page-3
Flower hair- clips-page-3Flower hair- clips-page-3
Flower hair- clips-page-3
 
Indicadores da Economia Brasileira: Setor Externo 2016
Indicadores da Economia Brasileira: Setor Externo 2016Indicadores da Economia Brasileira: Setor Externo 2016
Indicadores da Economia Brasileira: Setor Externo 2016
 

GreenhouseGasEmissionsReportBendOR