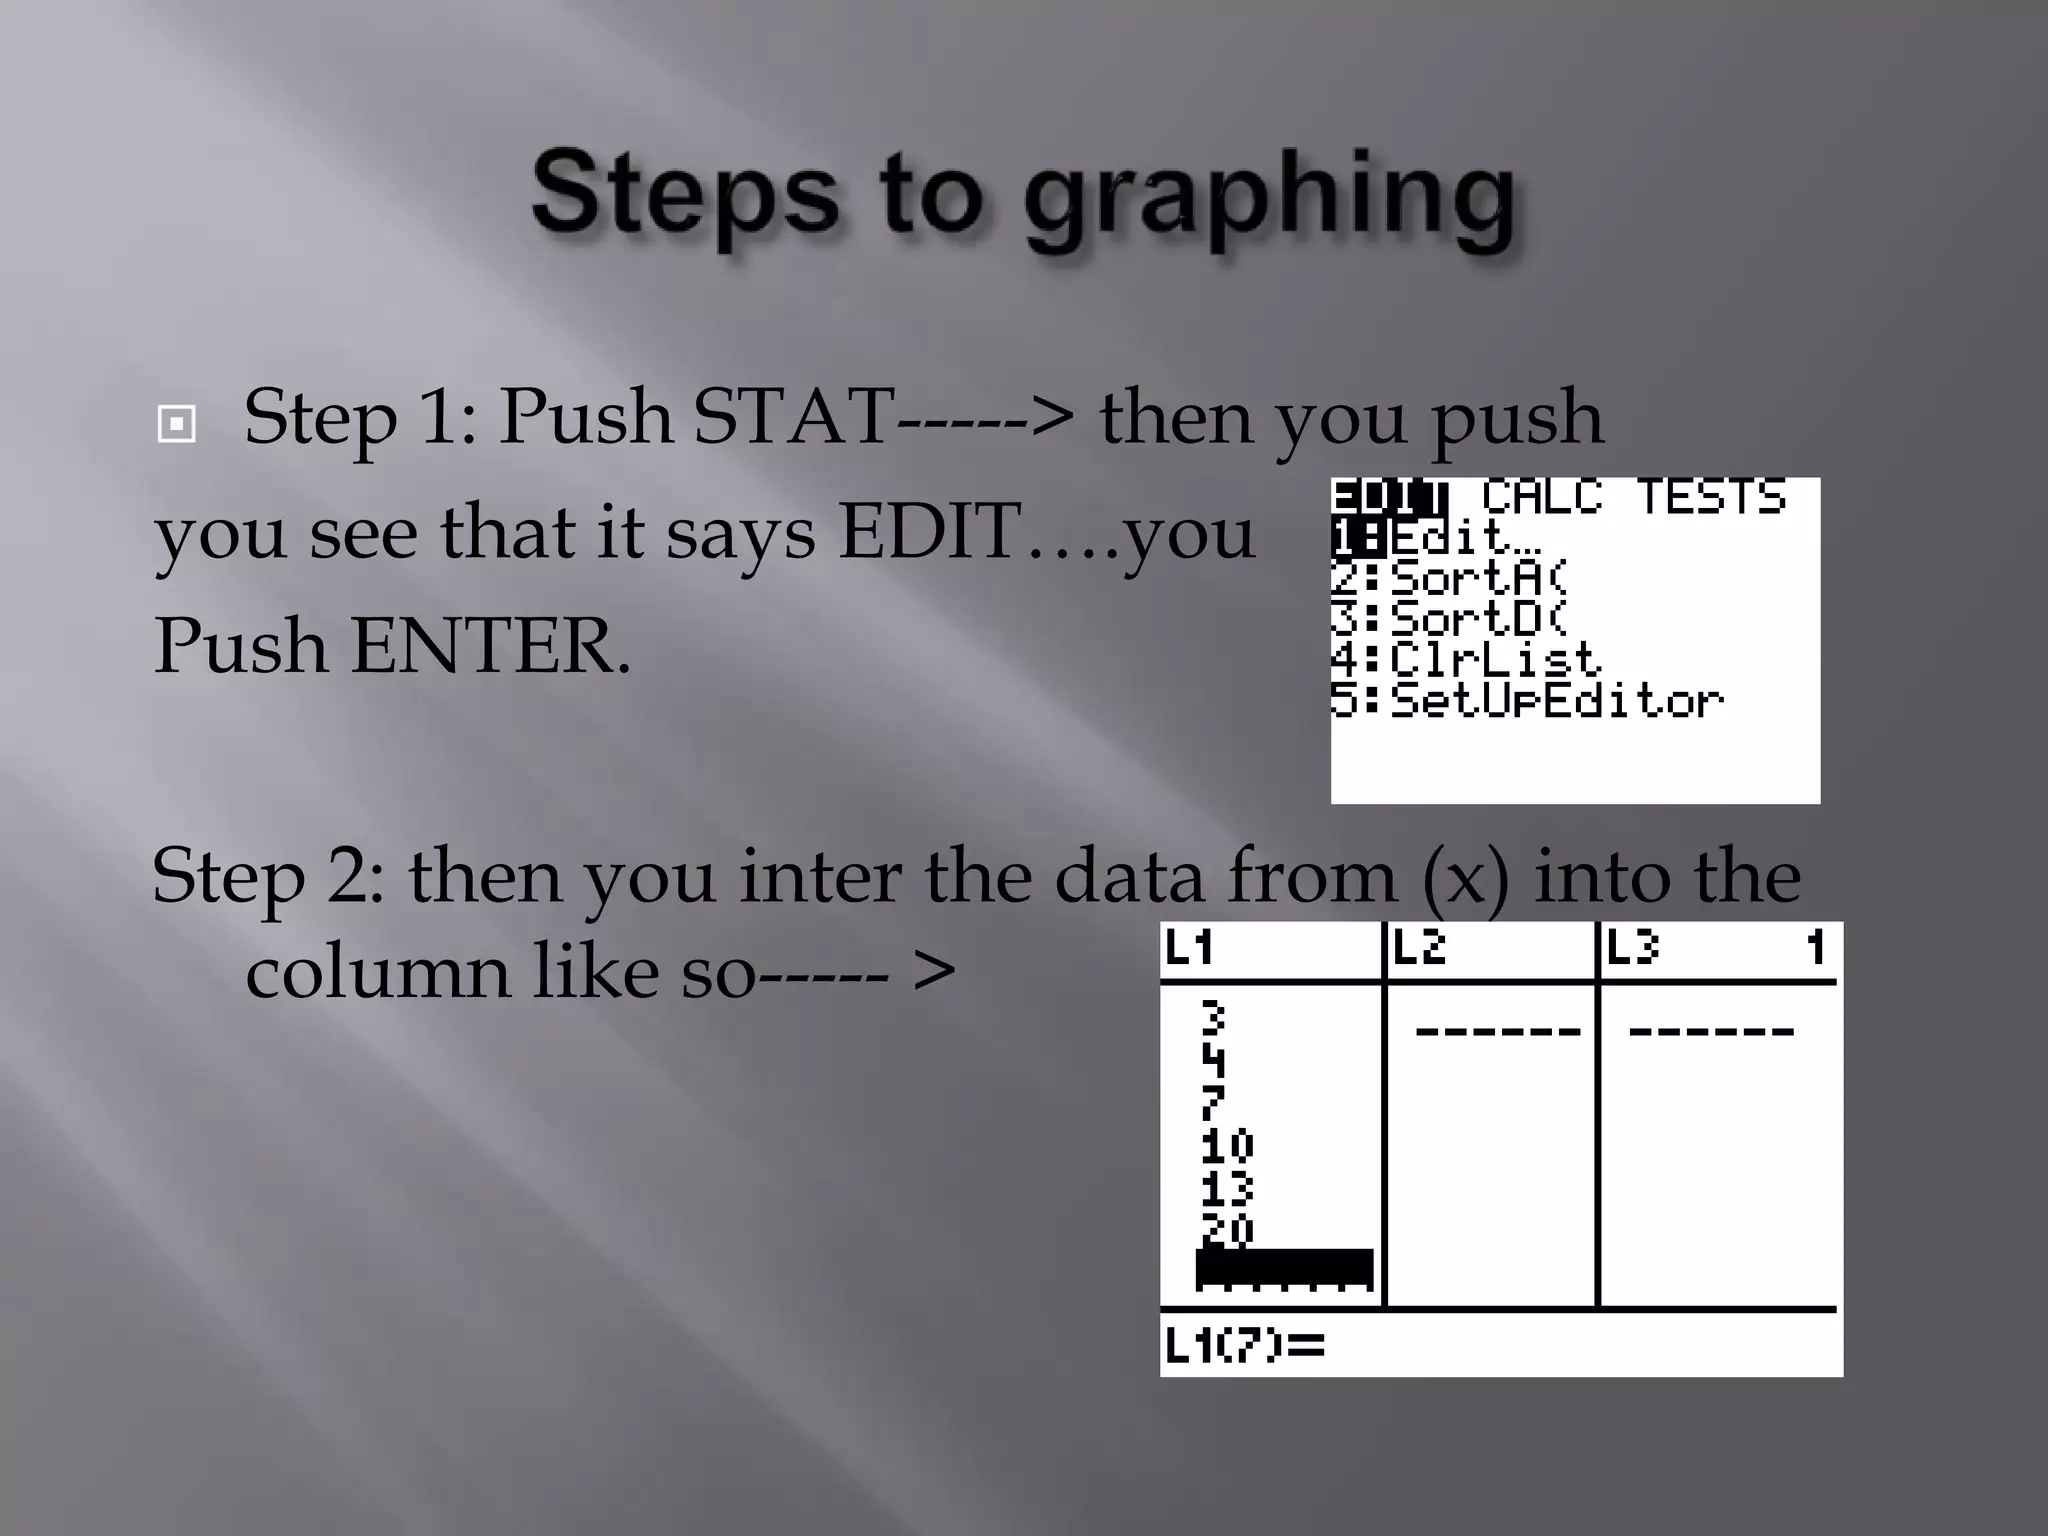
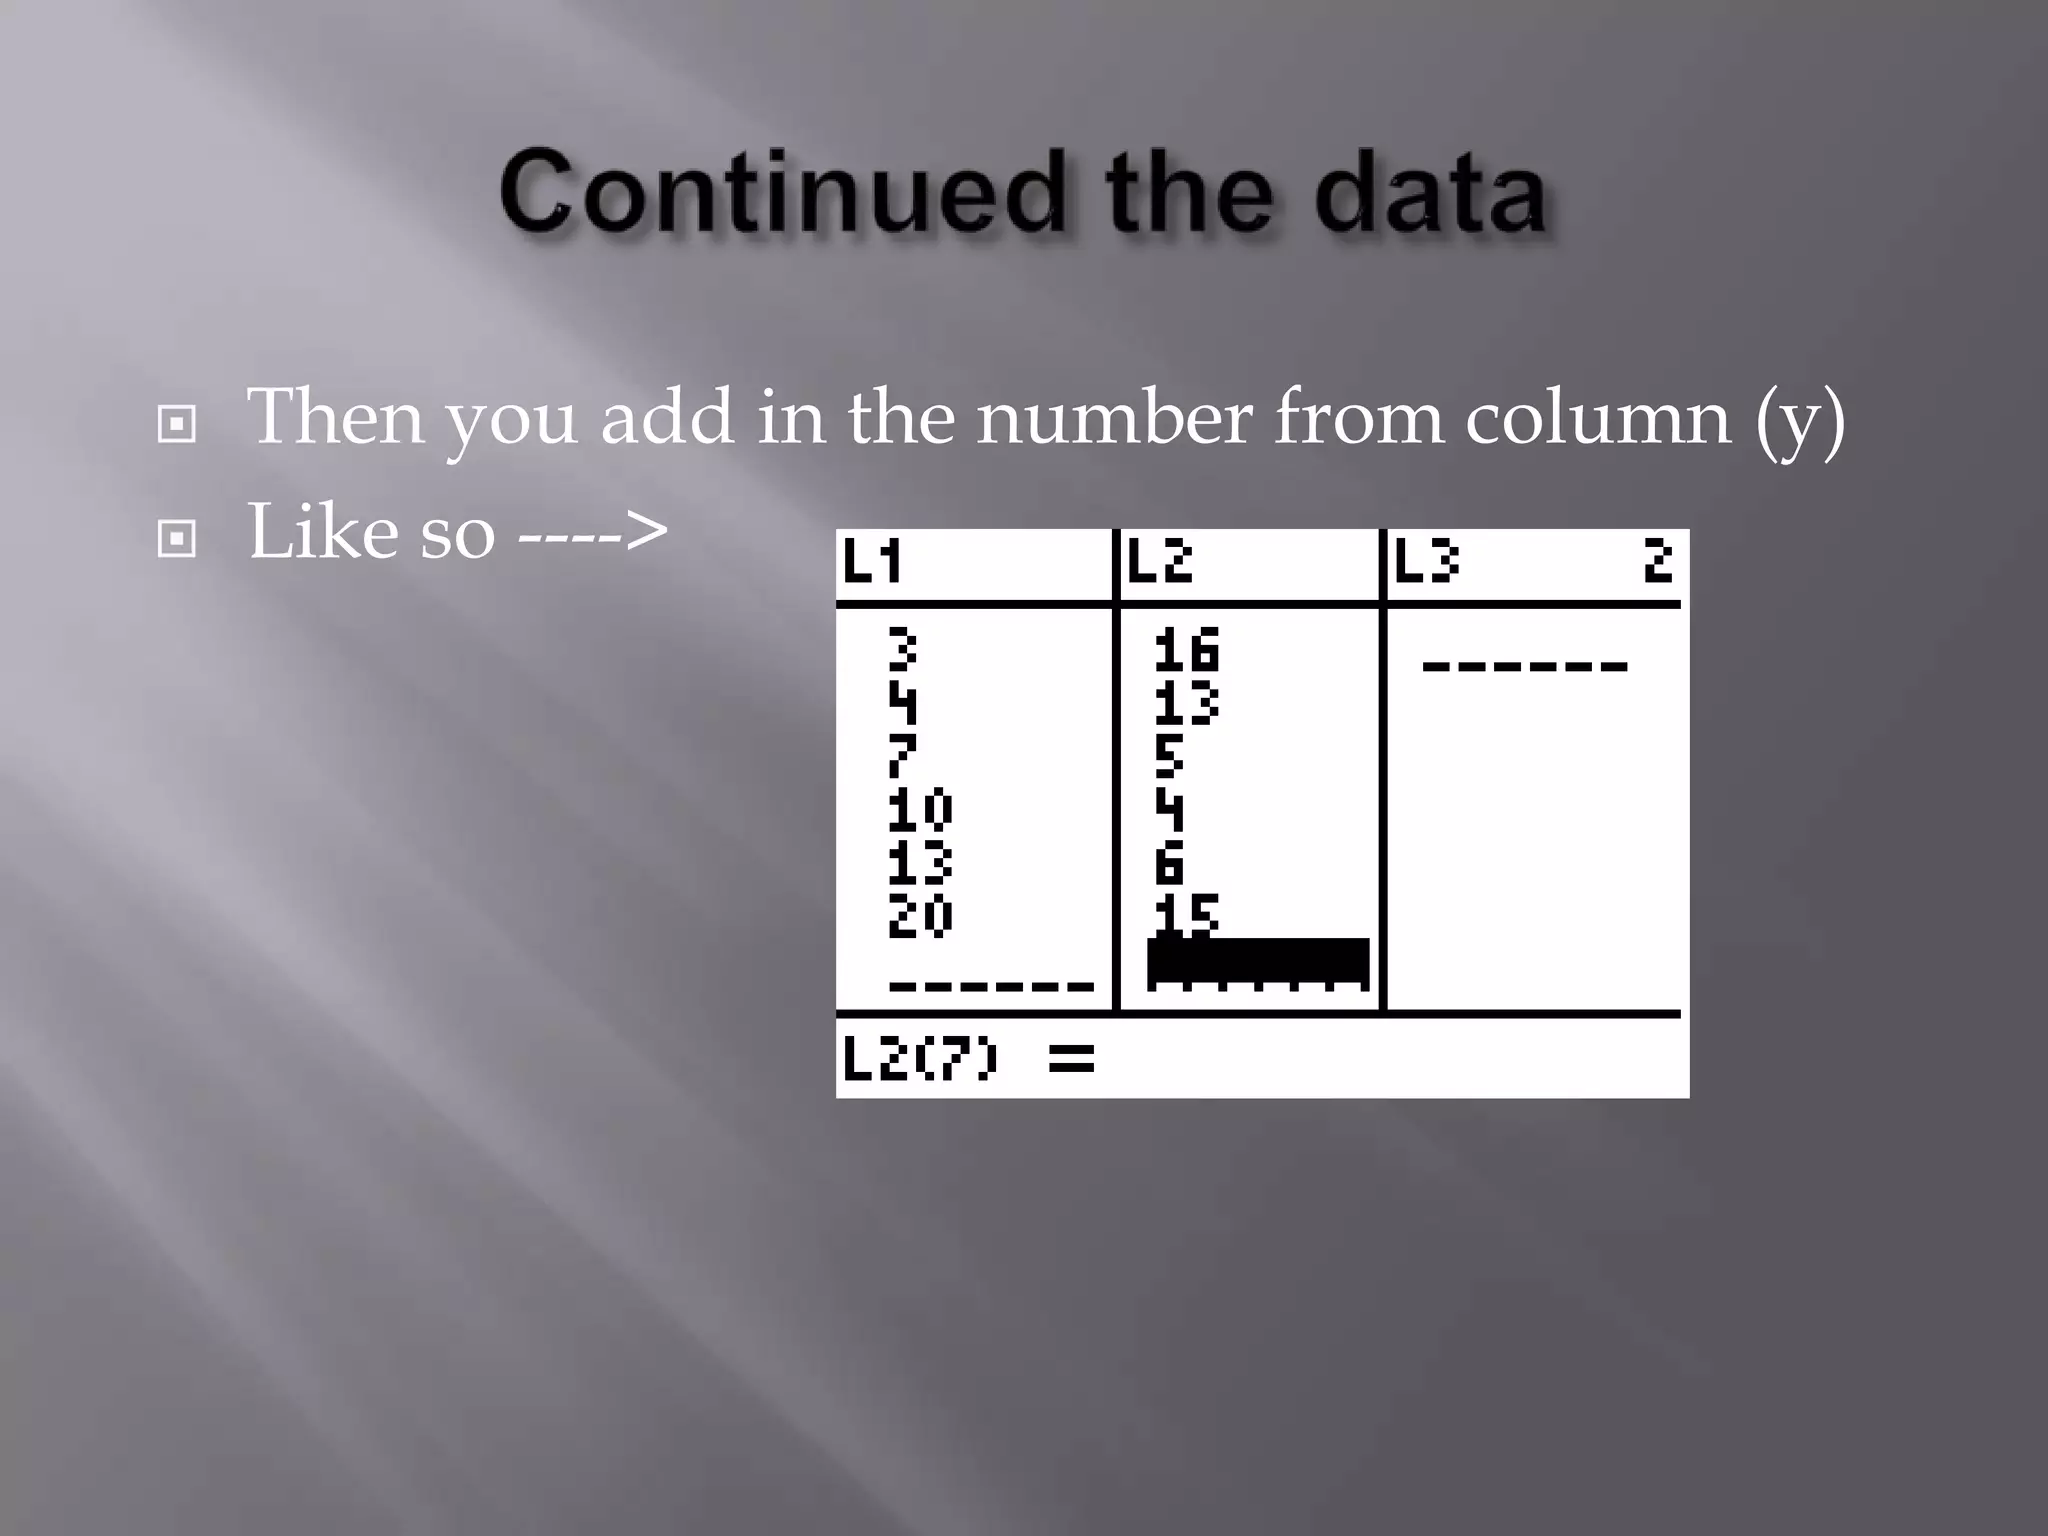
1) The document provides step-by-step instructions for graphing data using a graphing calculator. It explains how to enter data into the calculator, set the window parameters, plot the graph, find the vertex and another point to generate an equation, and check the equation against the original graph.
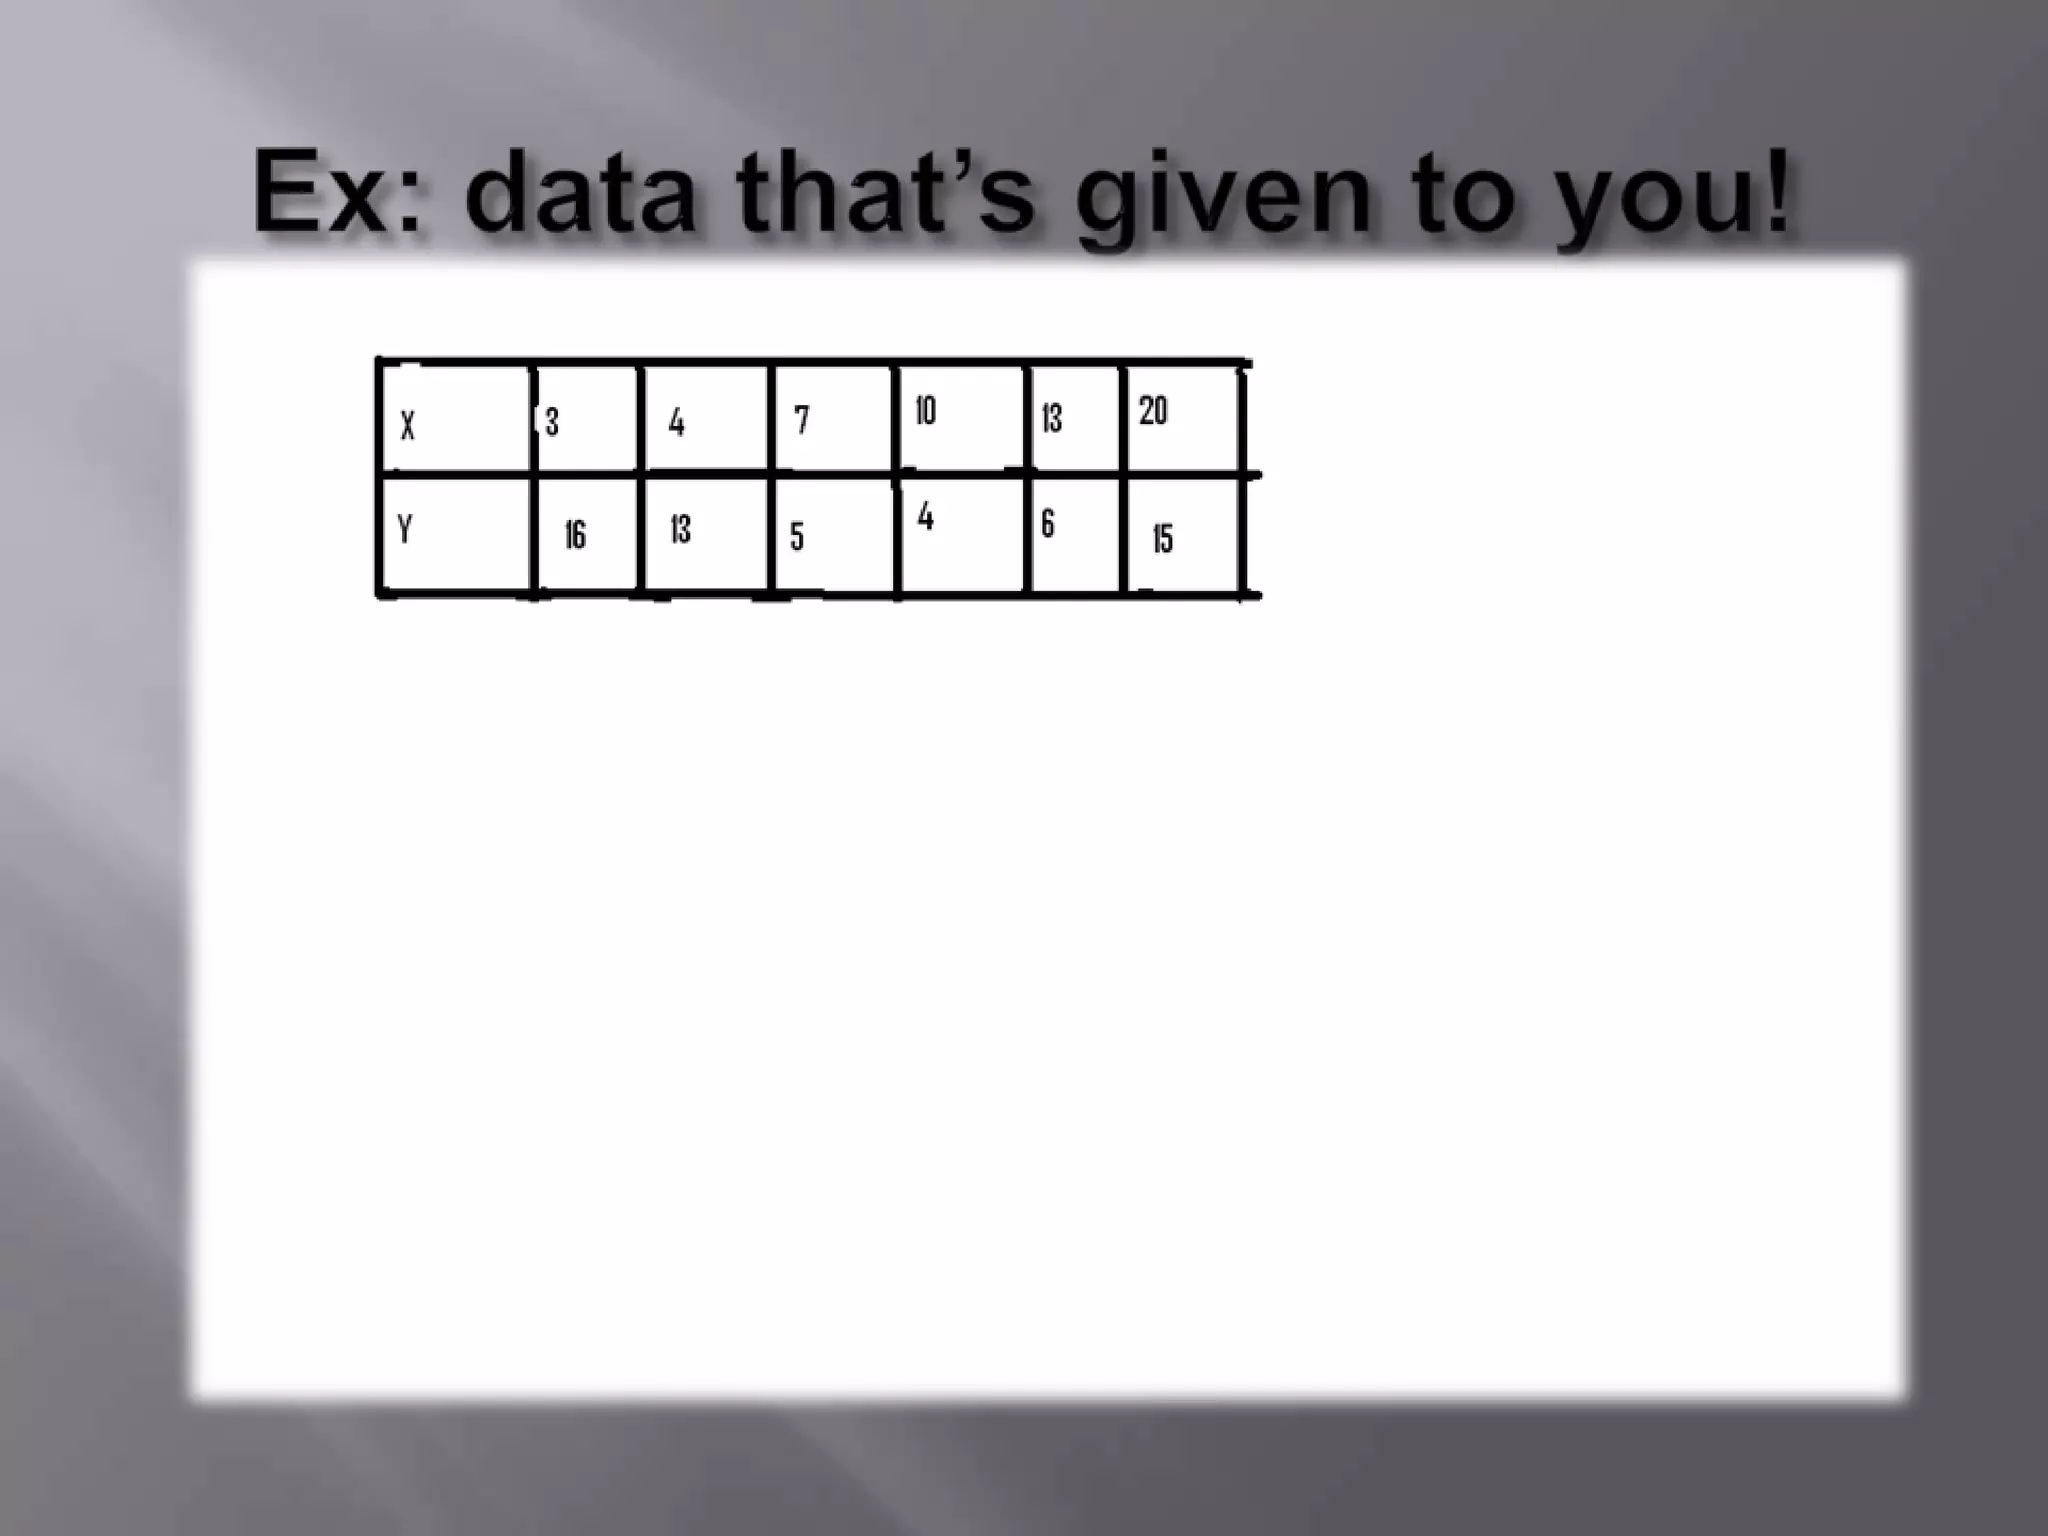
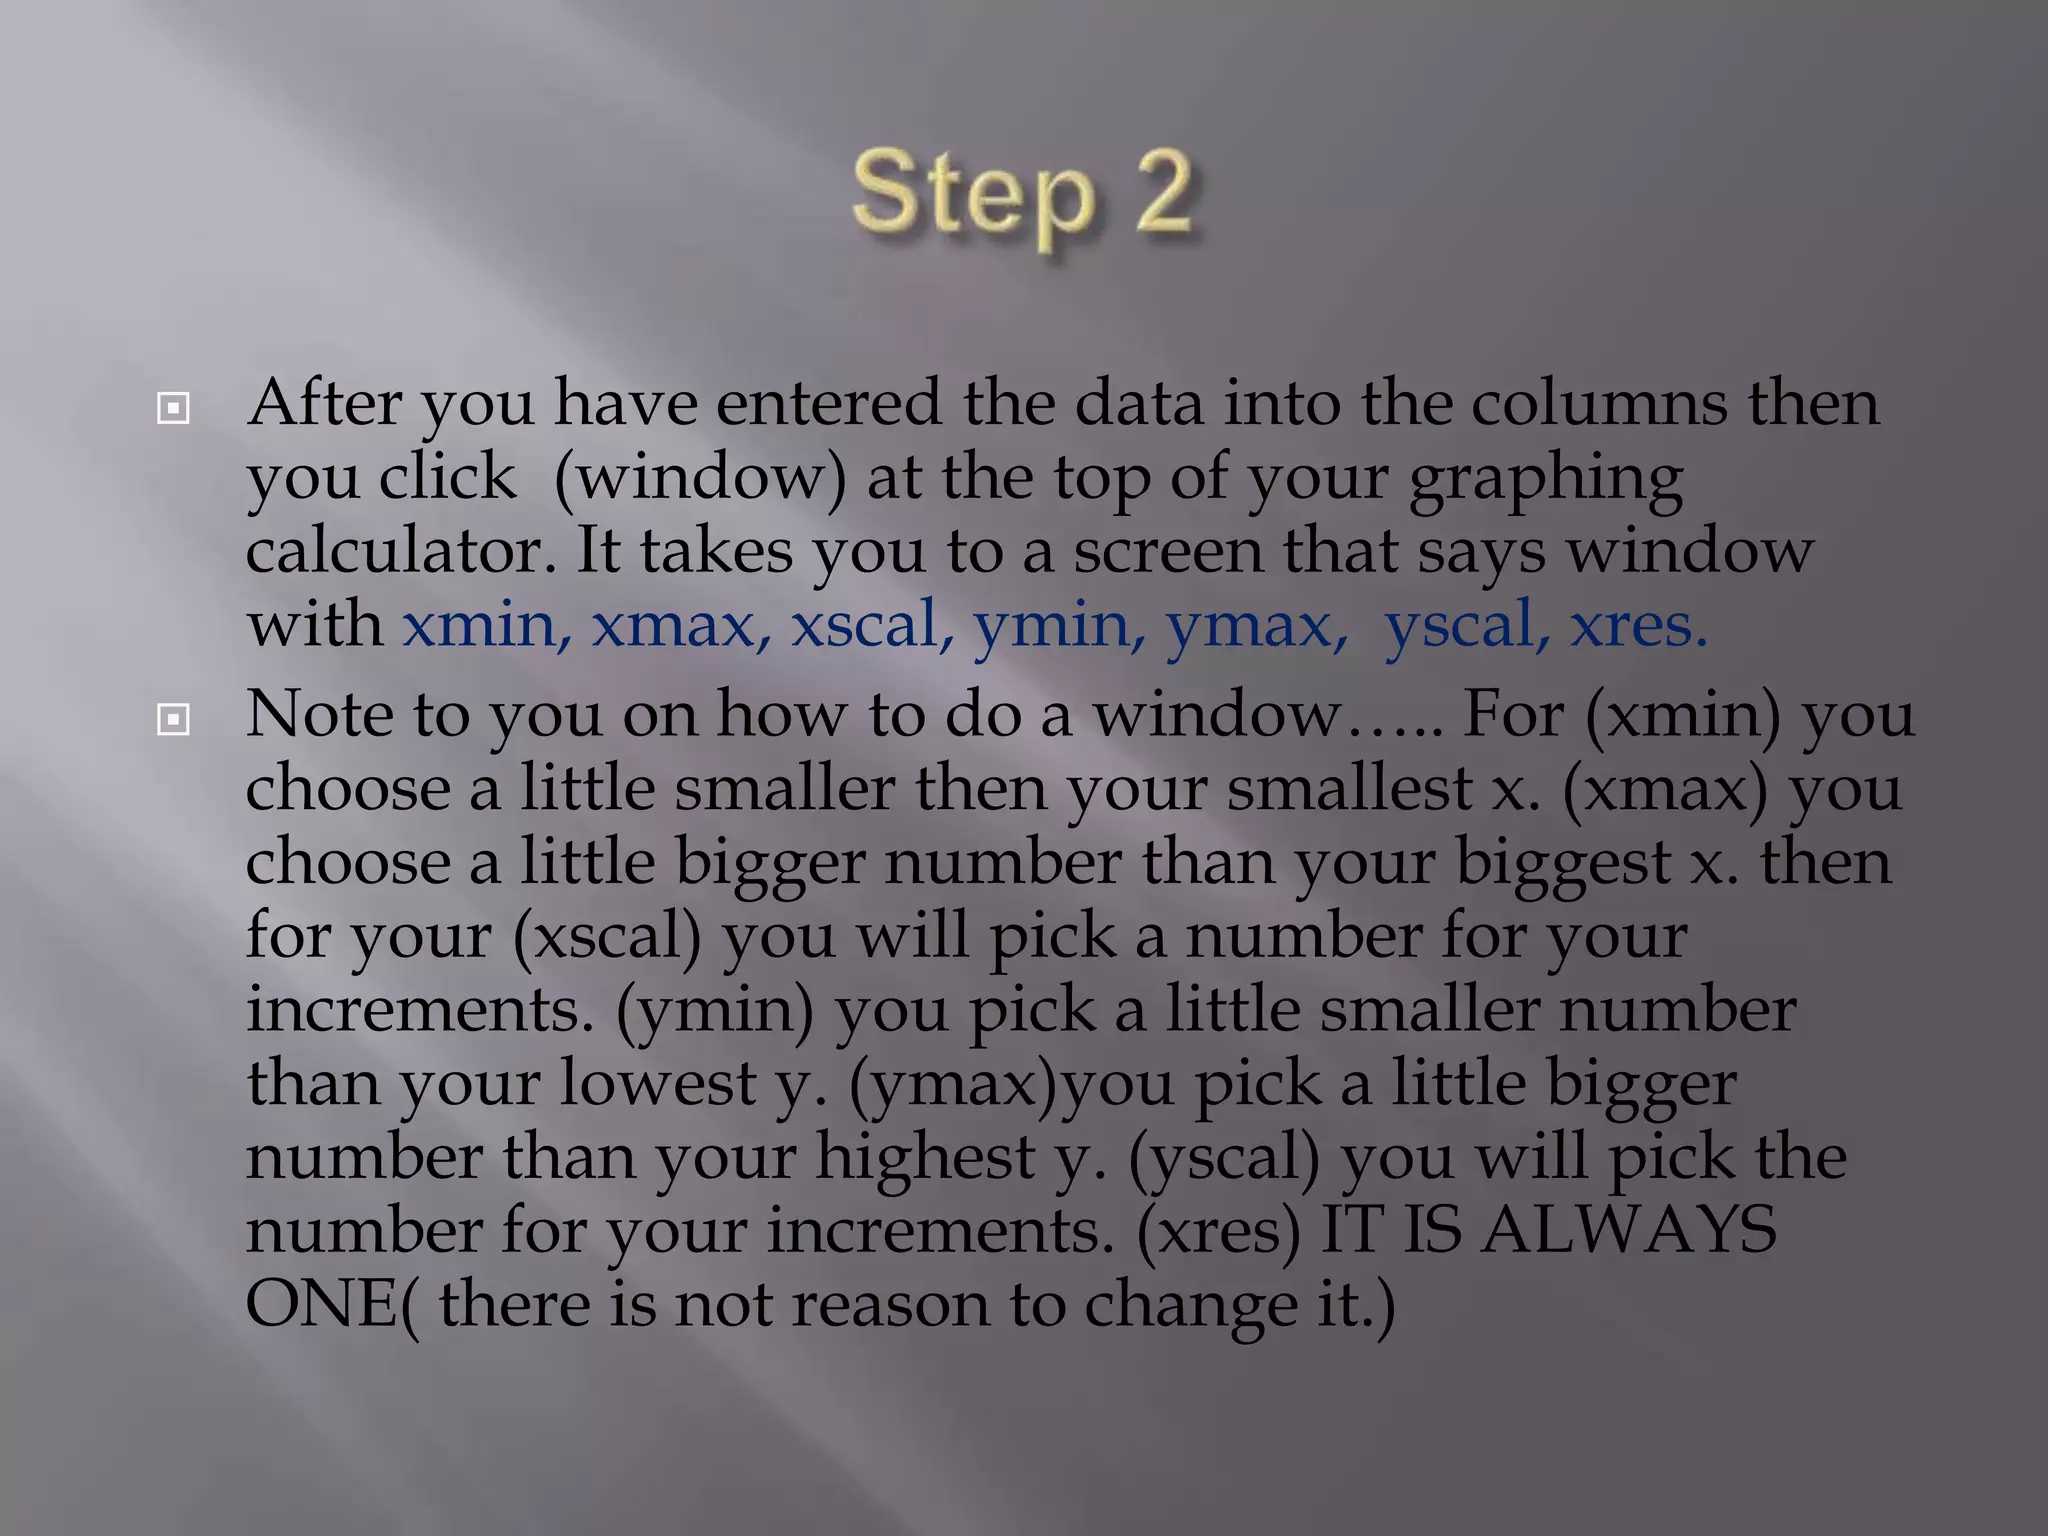
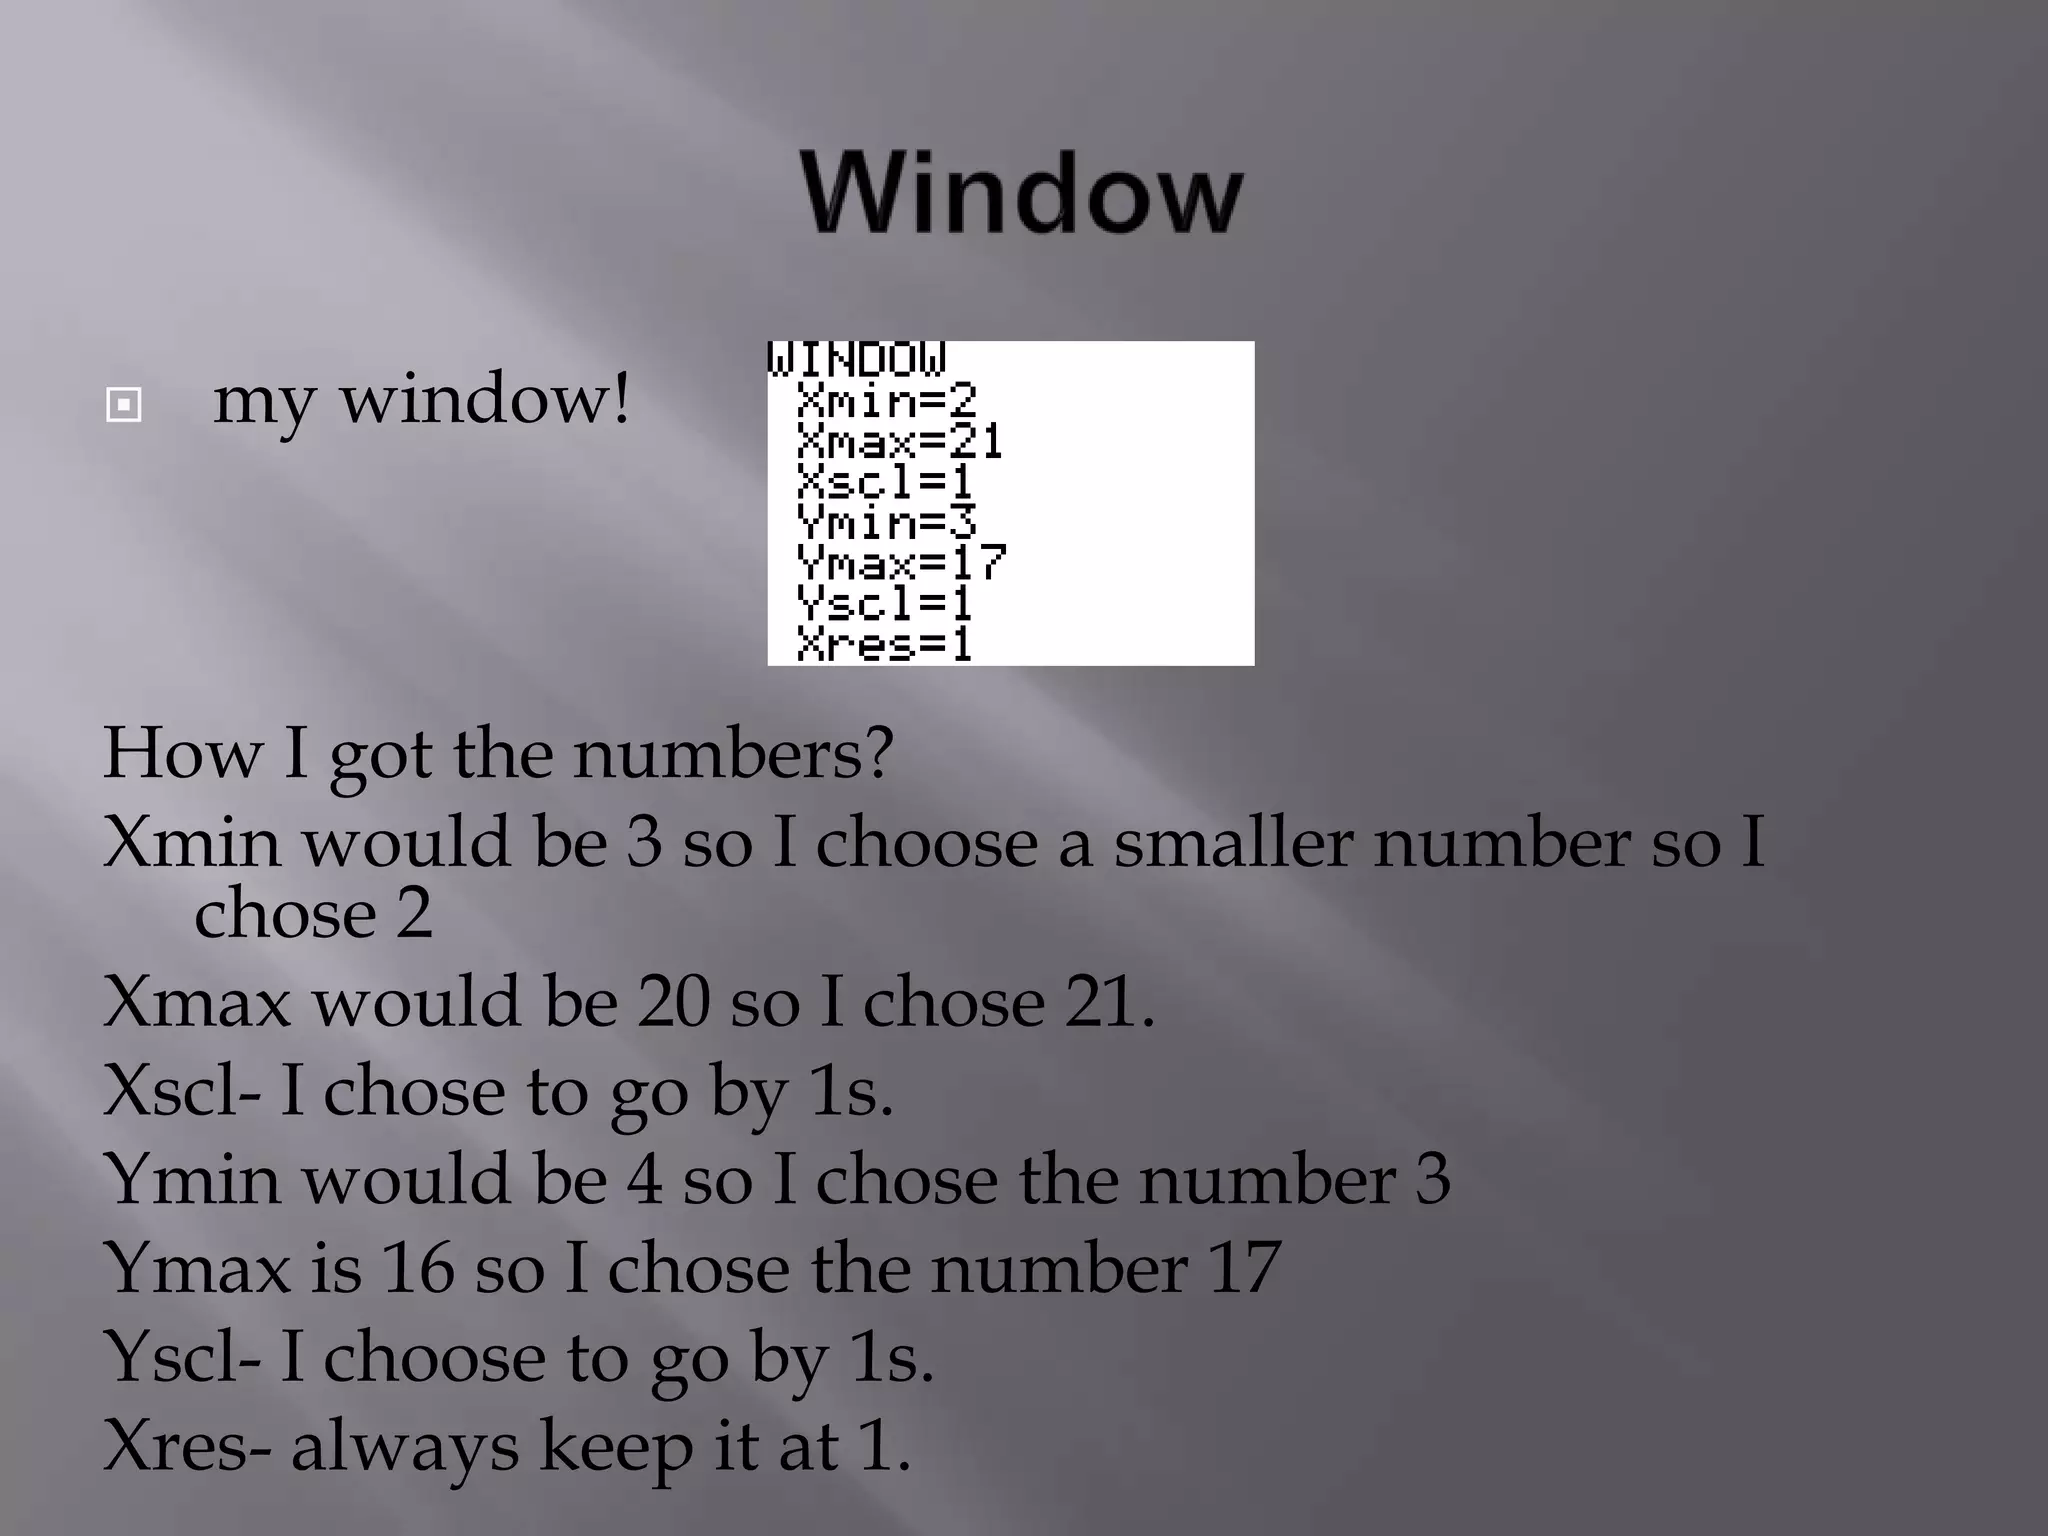
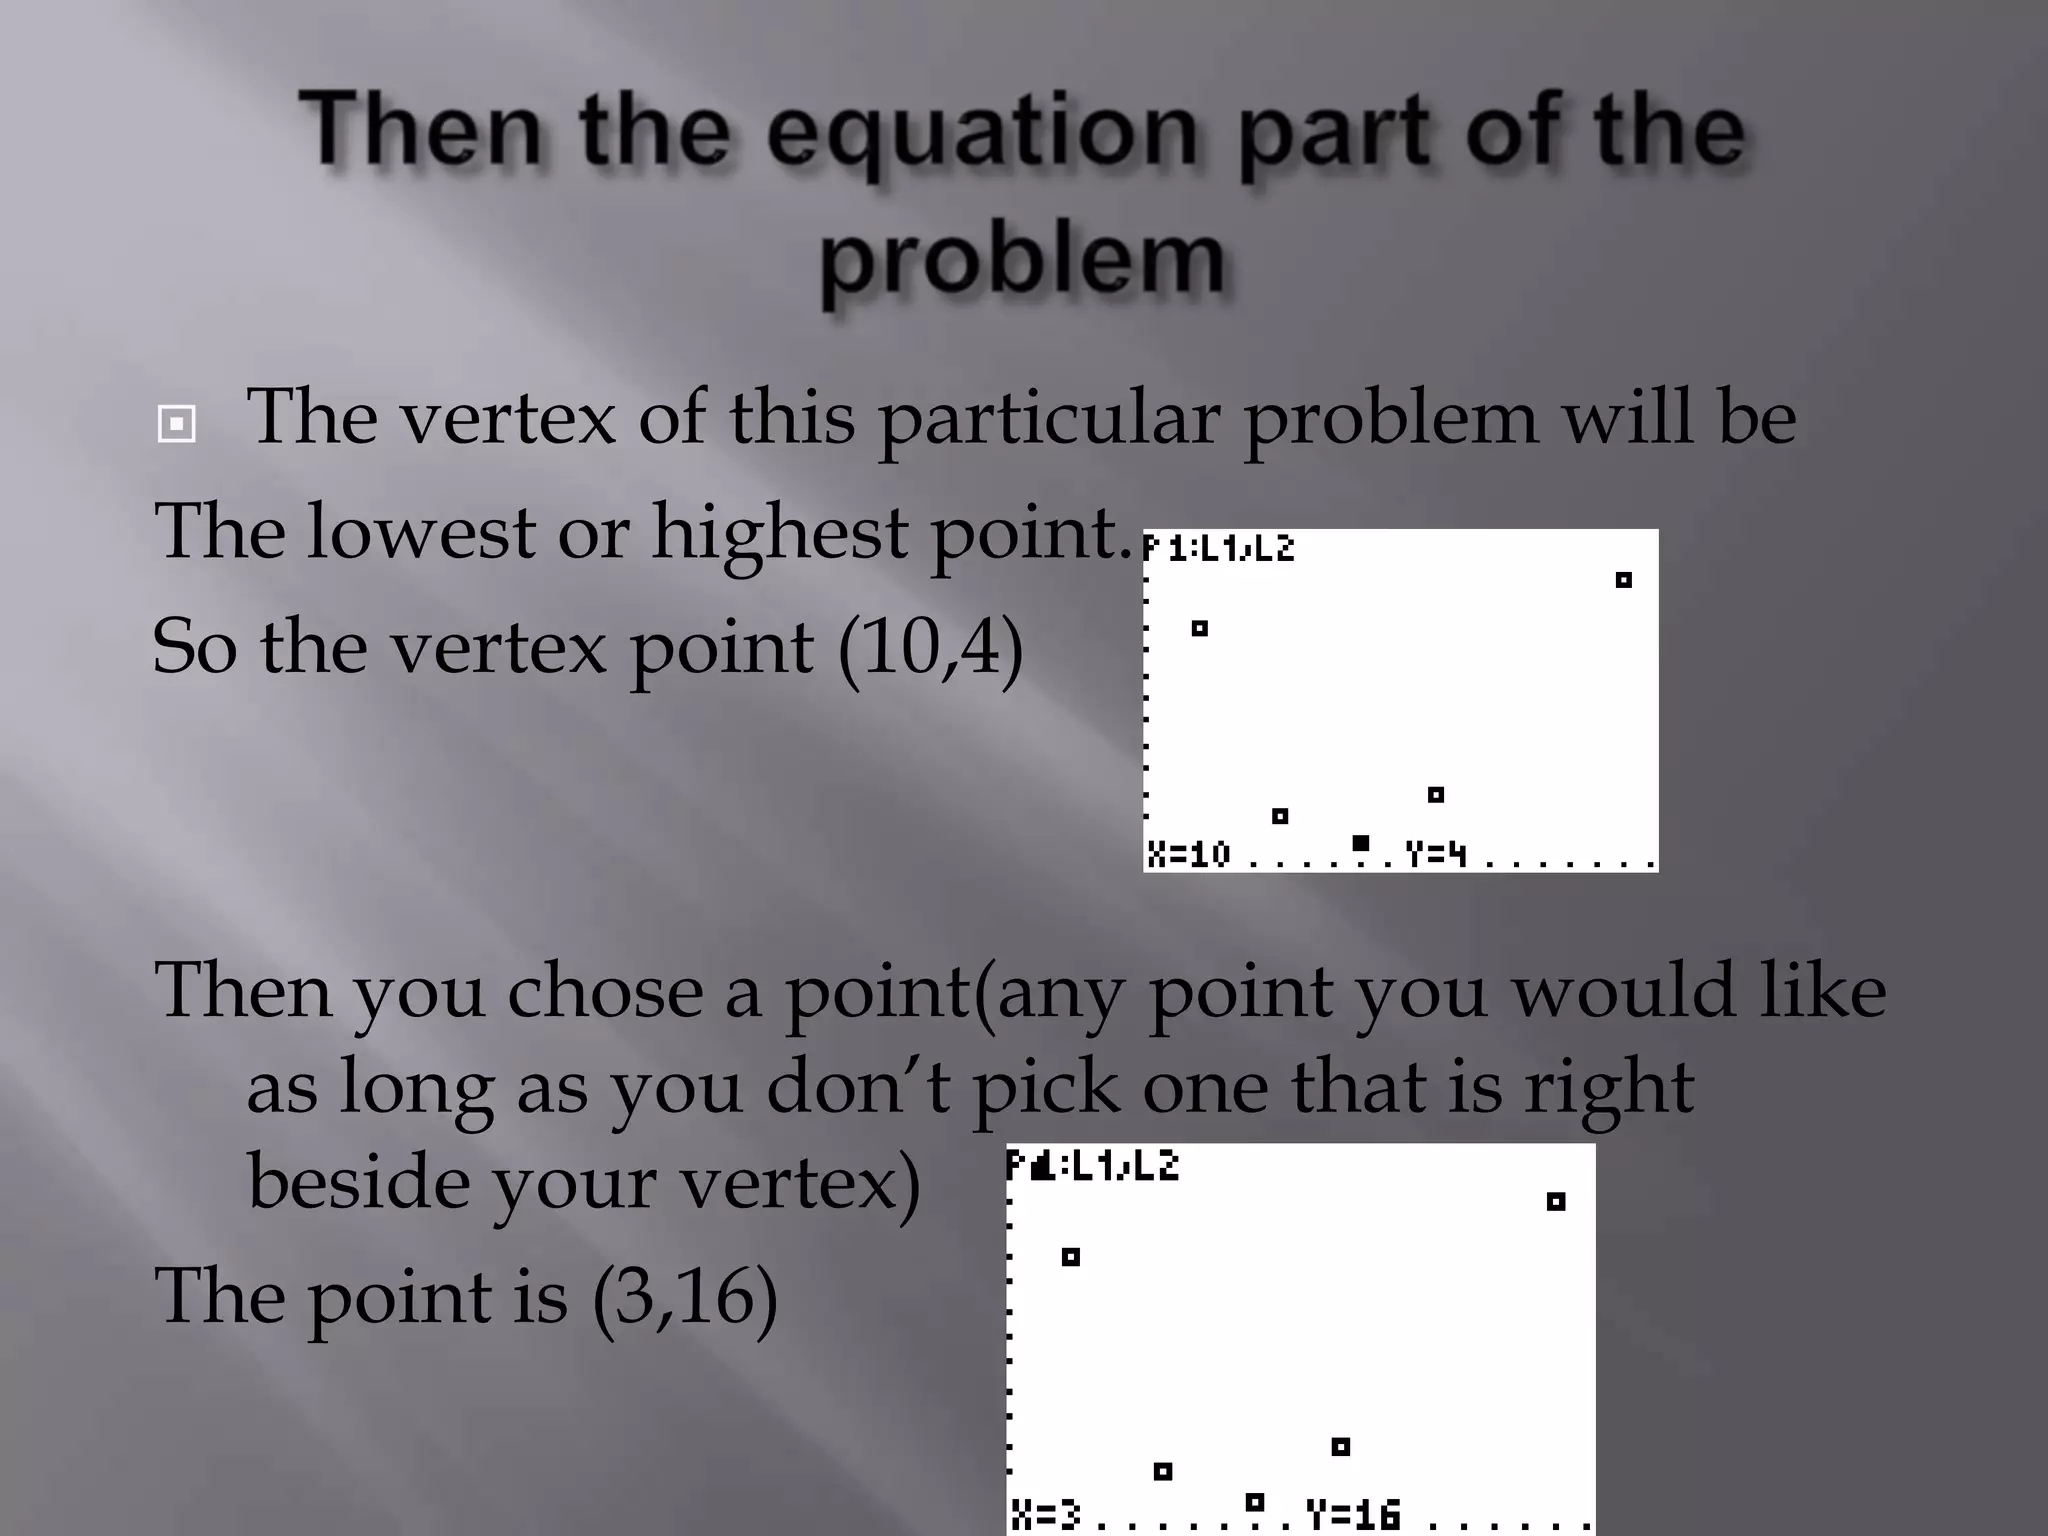
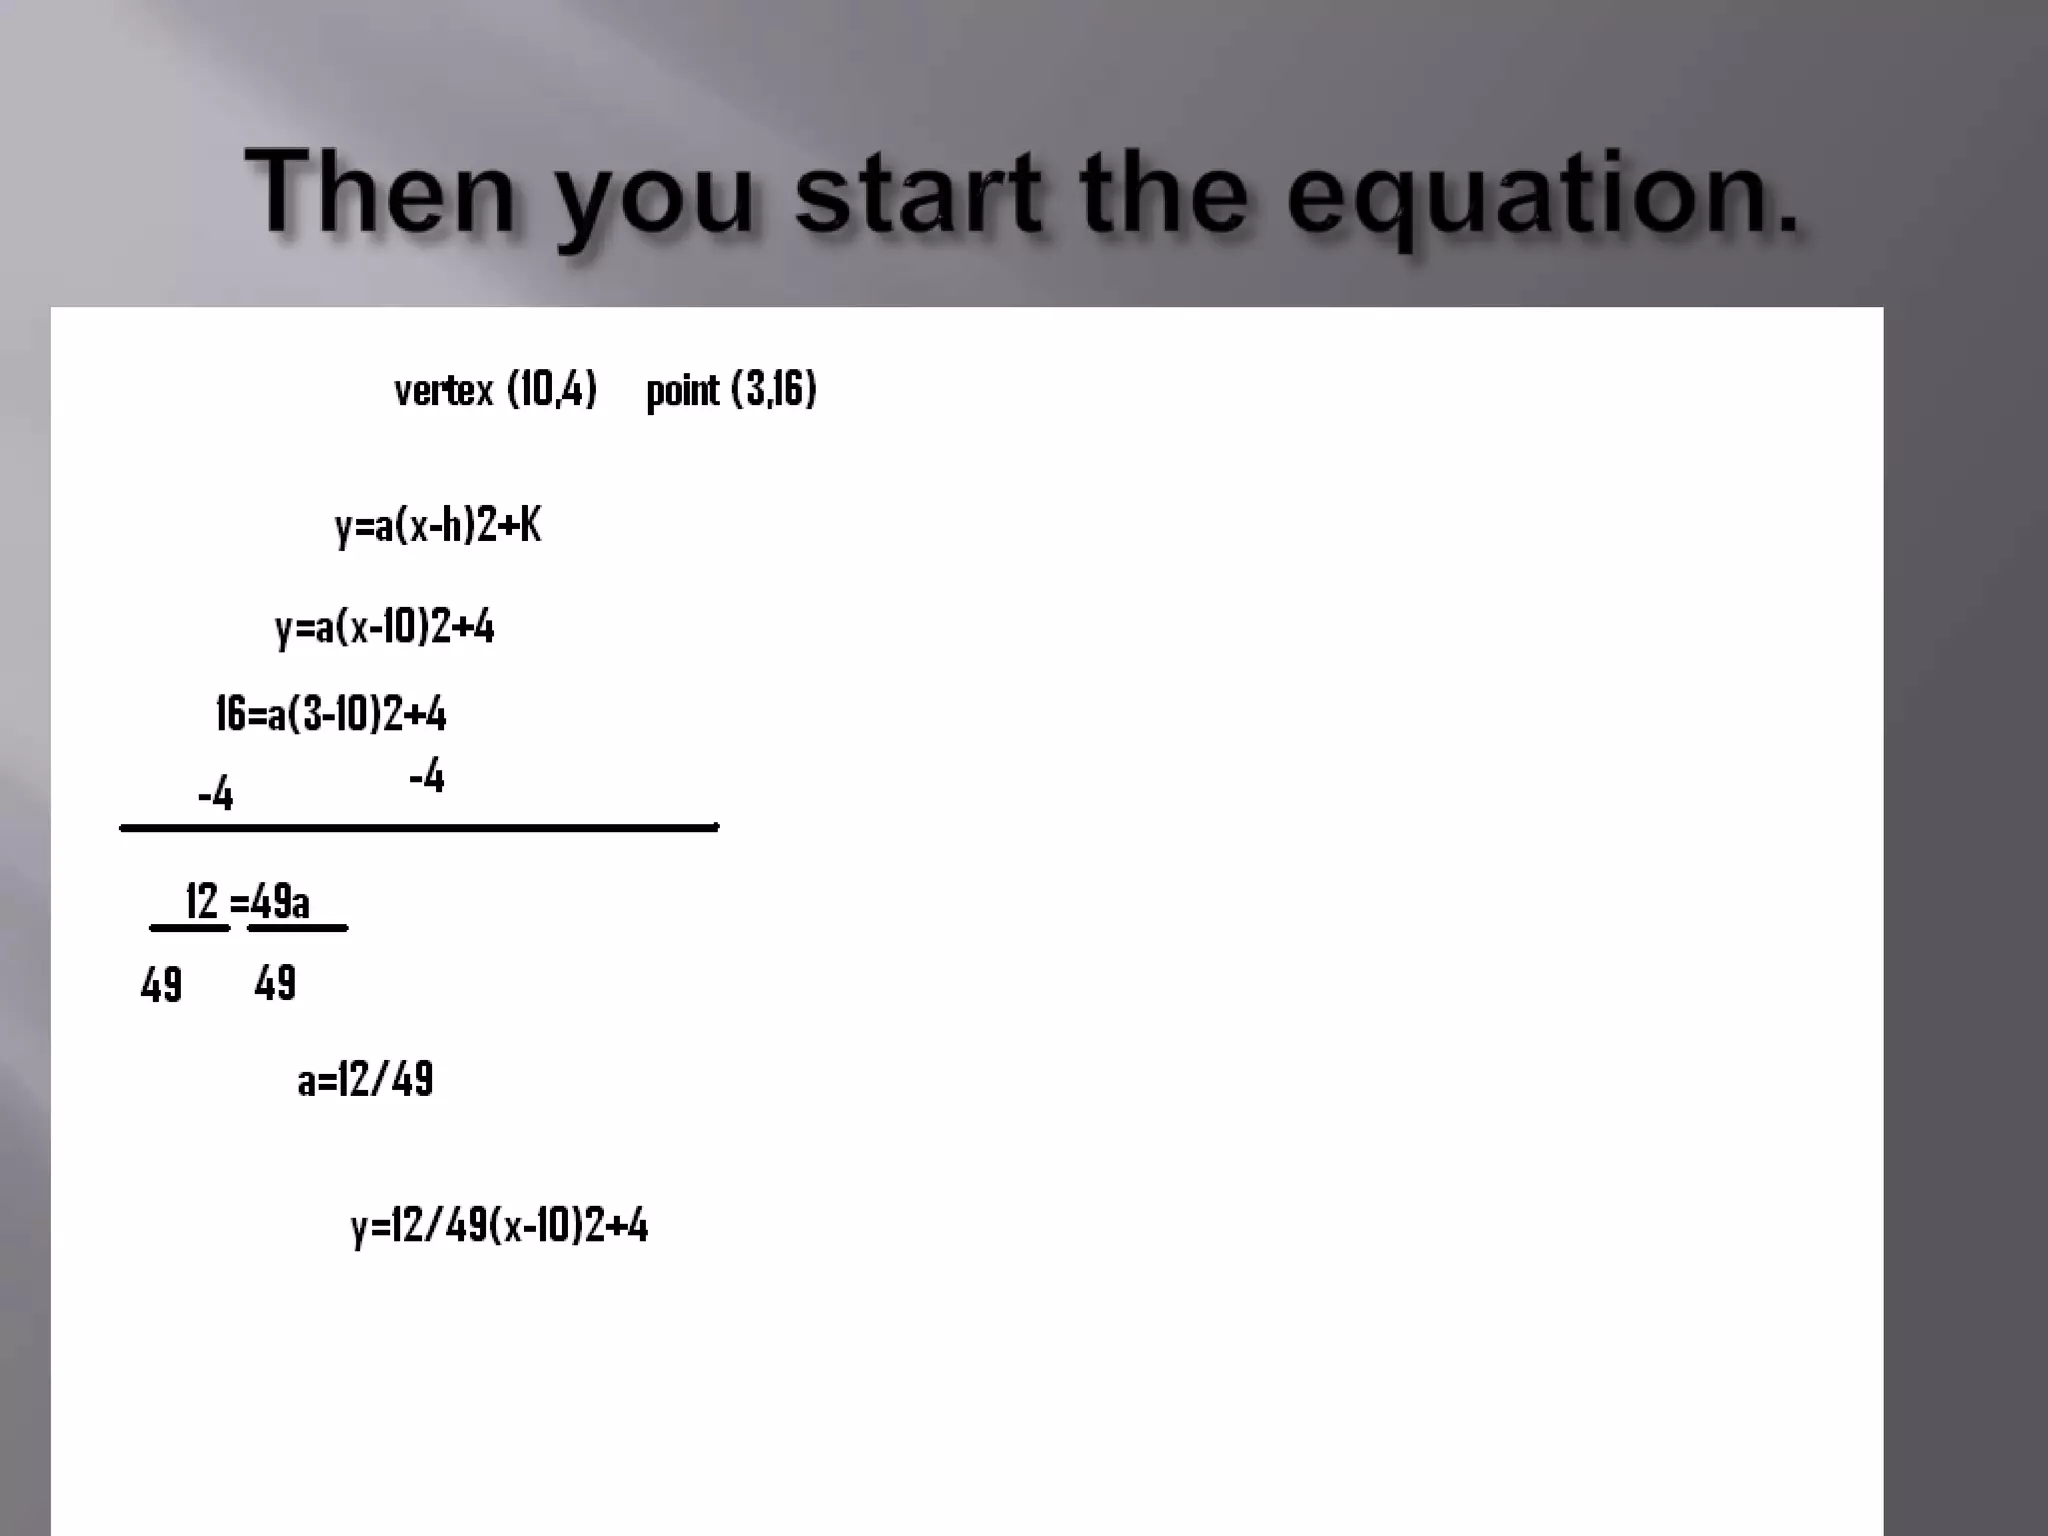
2) A key step is setting the window parameters like xmin, xmax, ymin and ymax to appropriately scale the graph. The example uses data points (3,16) and (10,4) to find the vertex and generate a quadratic equation.
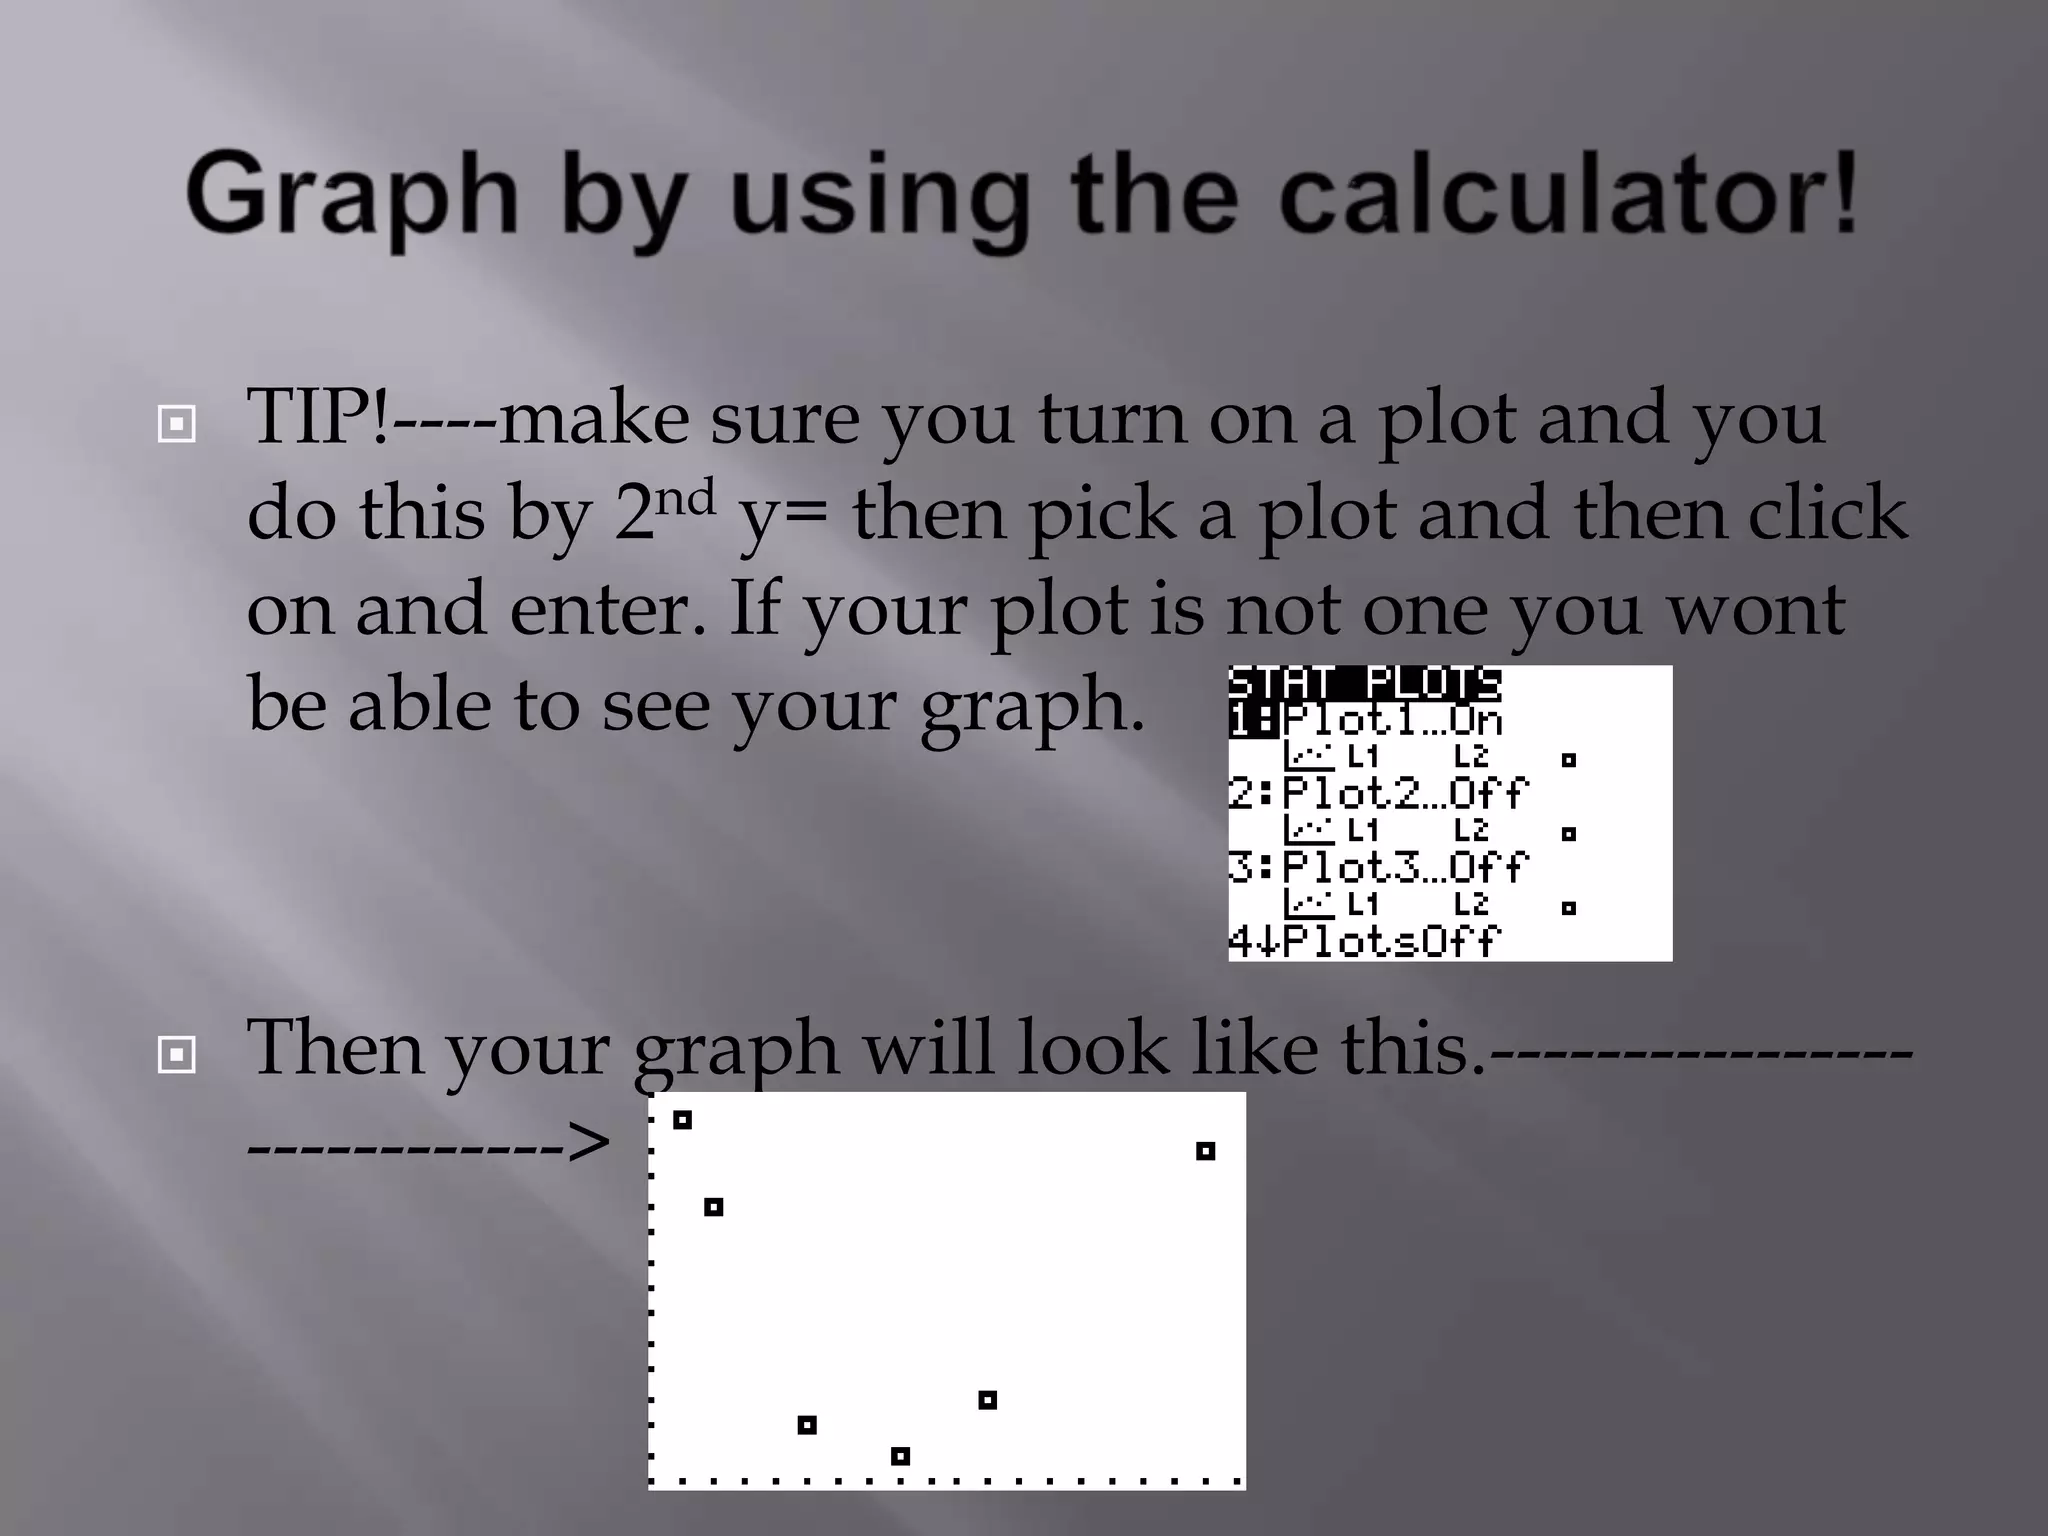
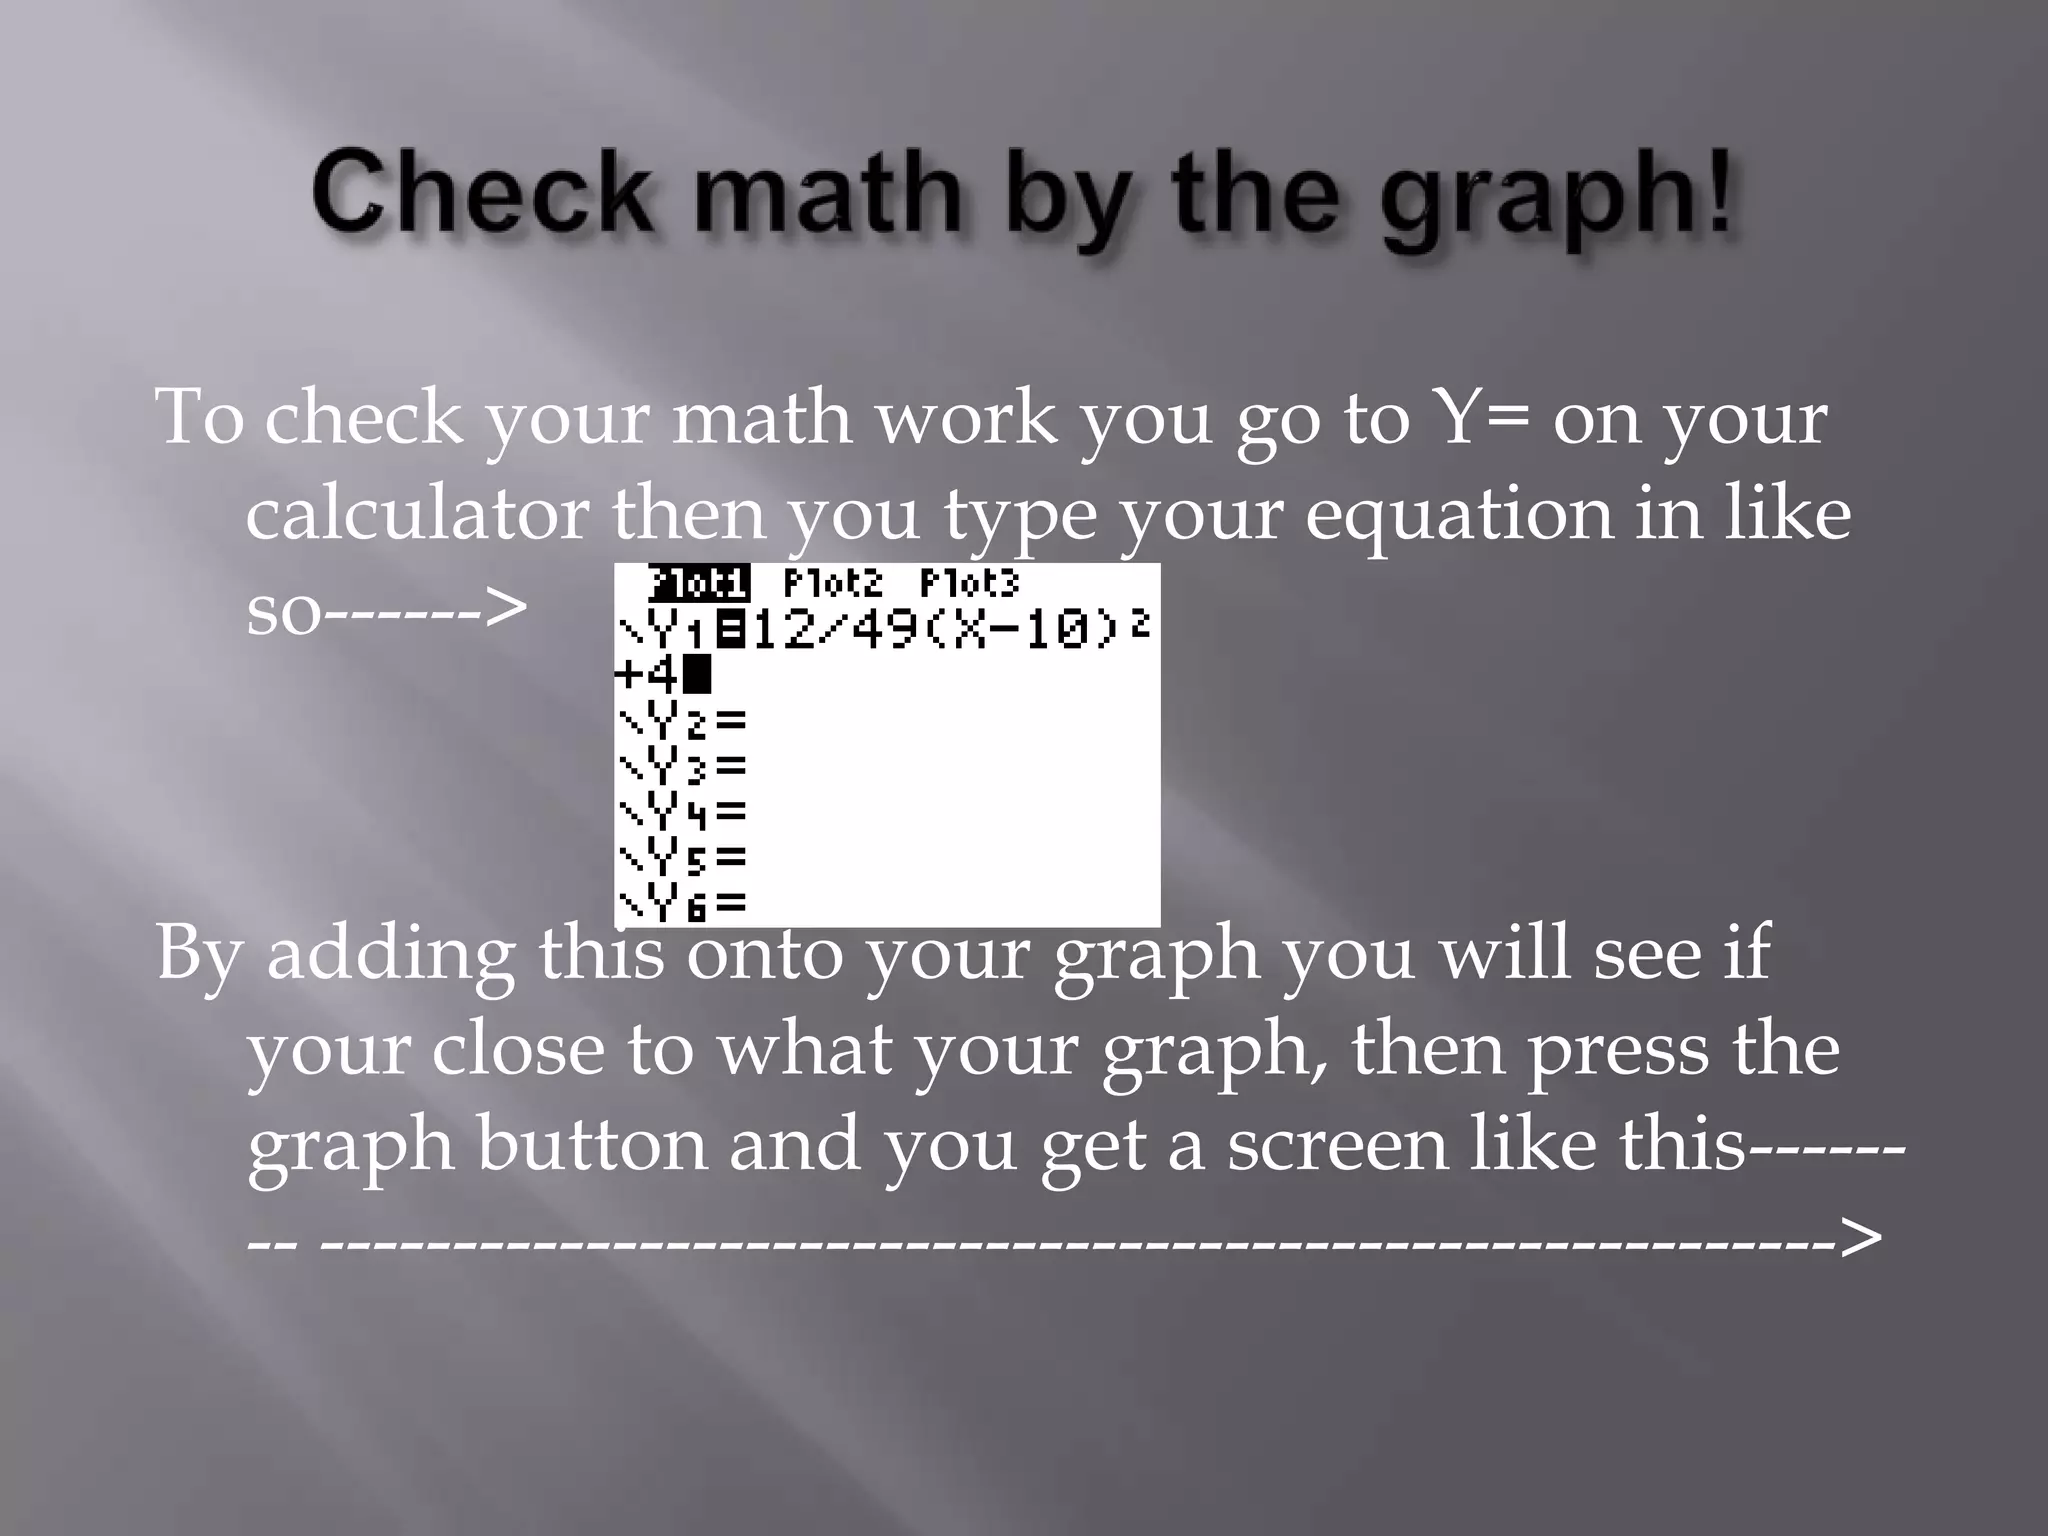
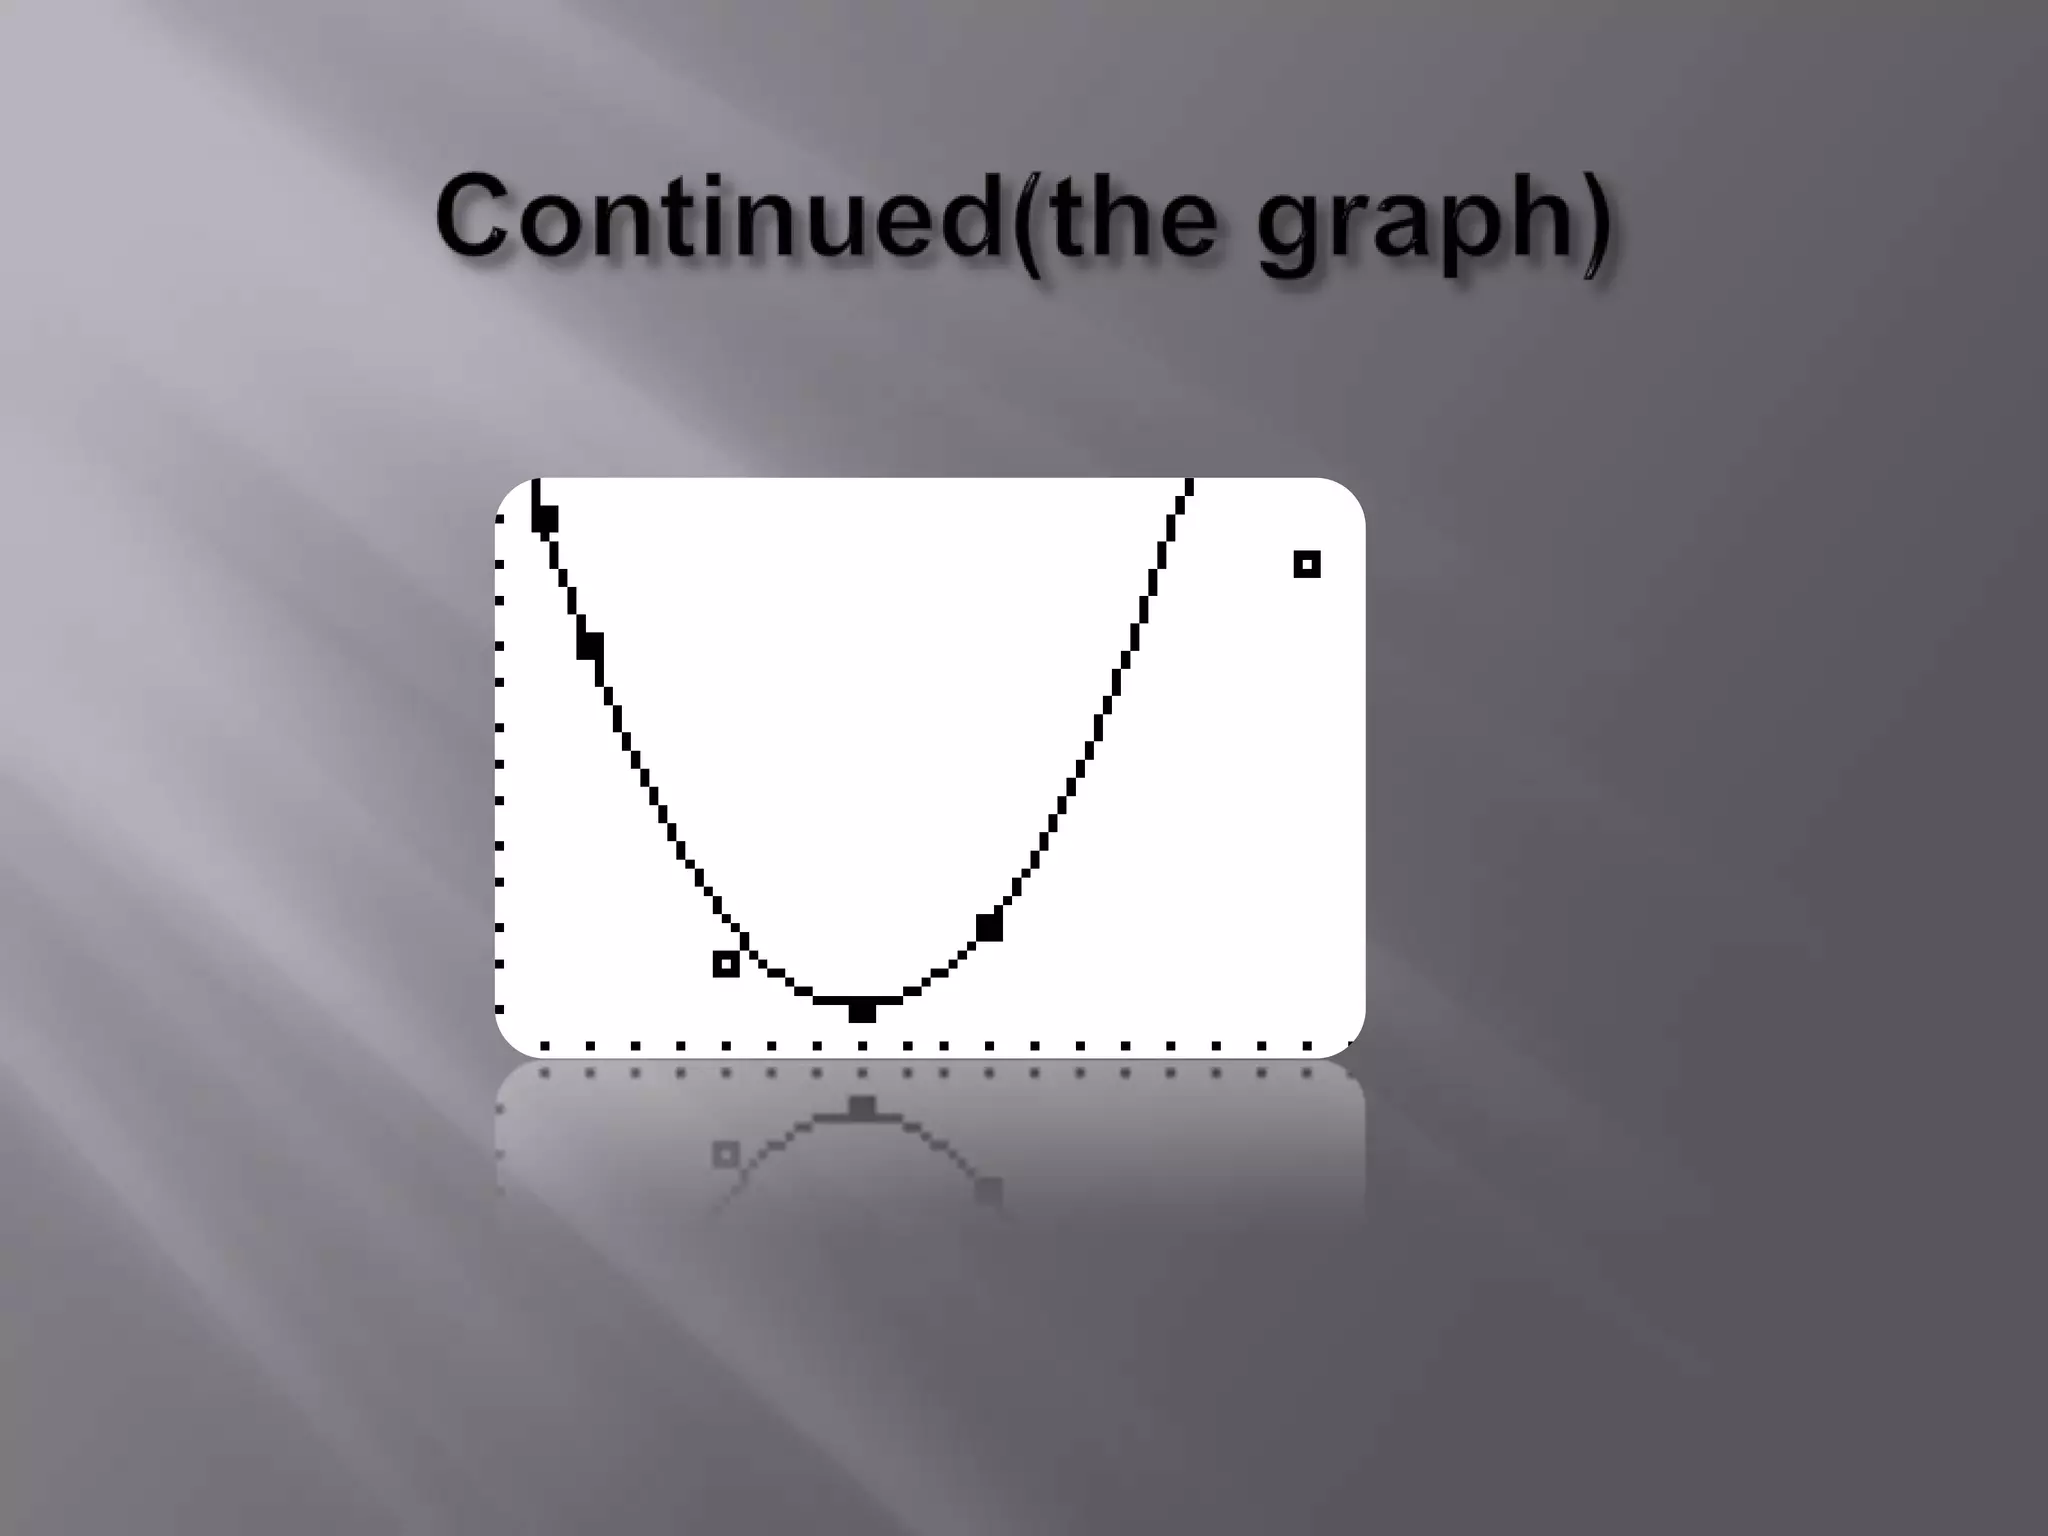
3) The final step is using the calculator's Y= feature to plot the equation, allowing users to check if the equation accurately fits the original graphed data


![Rightand wrong[1]](https://cdn.slidesharecdn.com/ss_thumbnails/rightandwrong1-100503113137-phpapp01-thumbnail.jpg?width=640&height=640&fit=bounds)