Quadratic 1
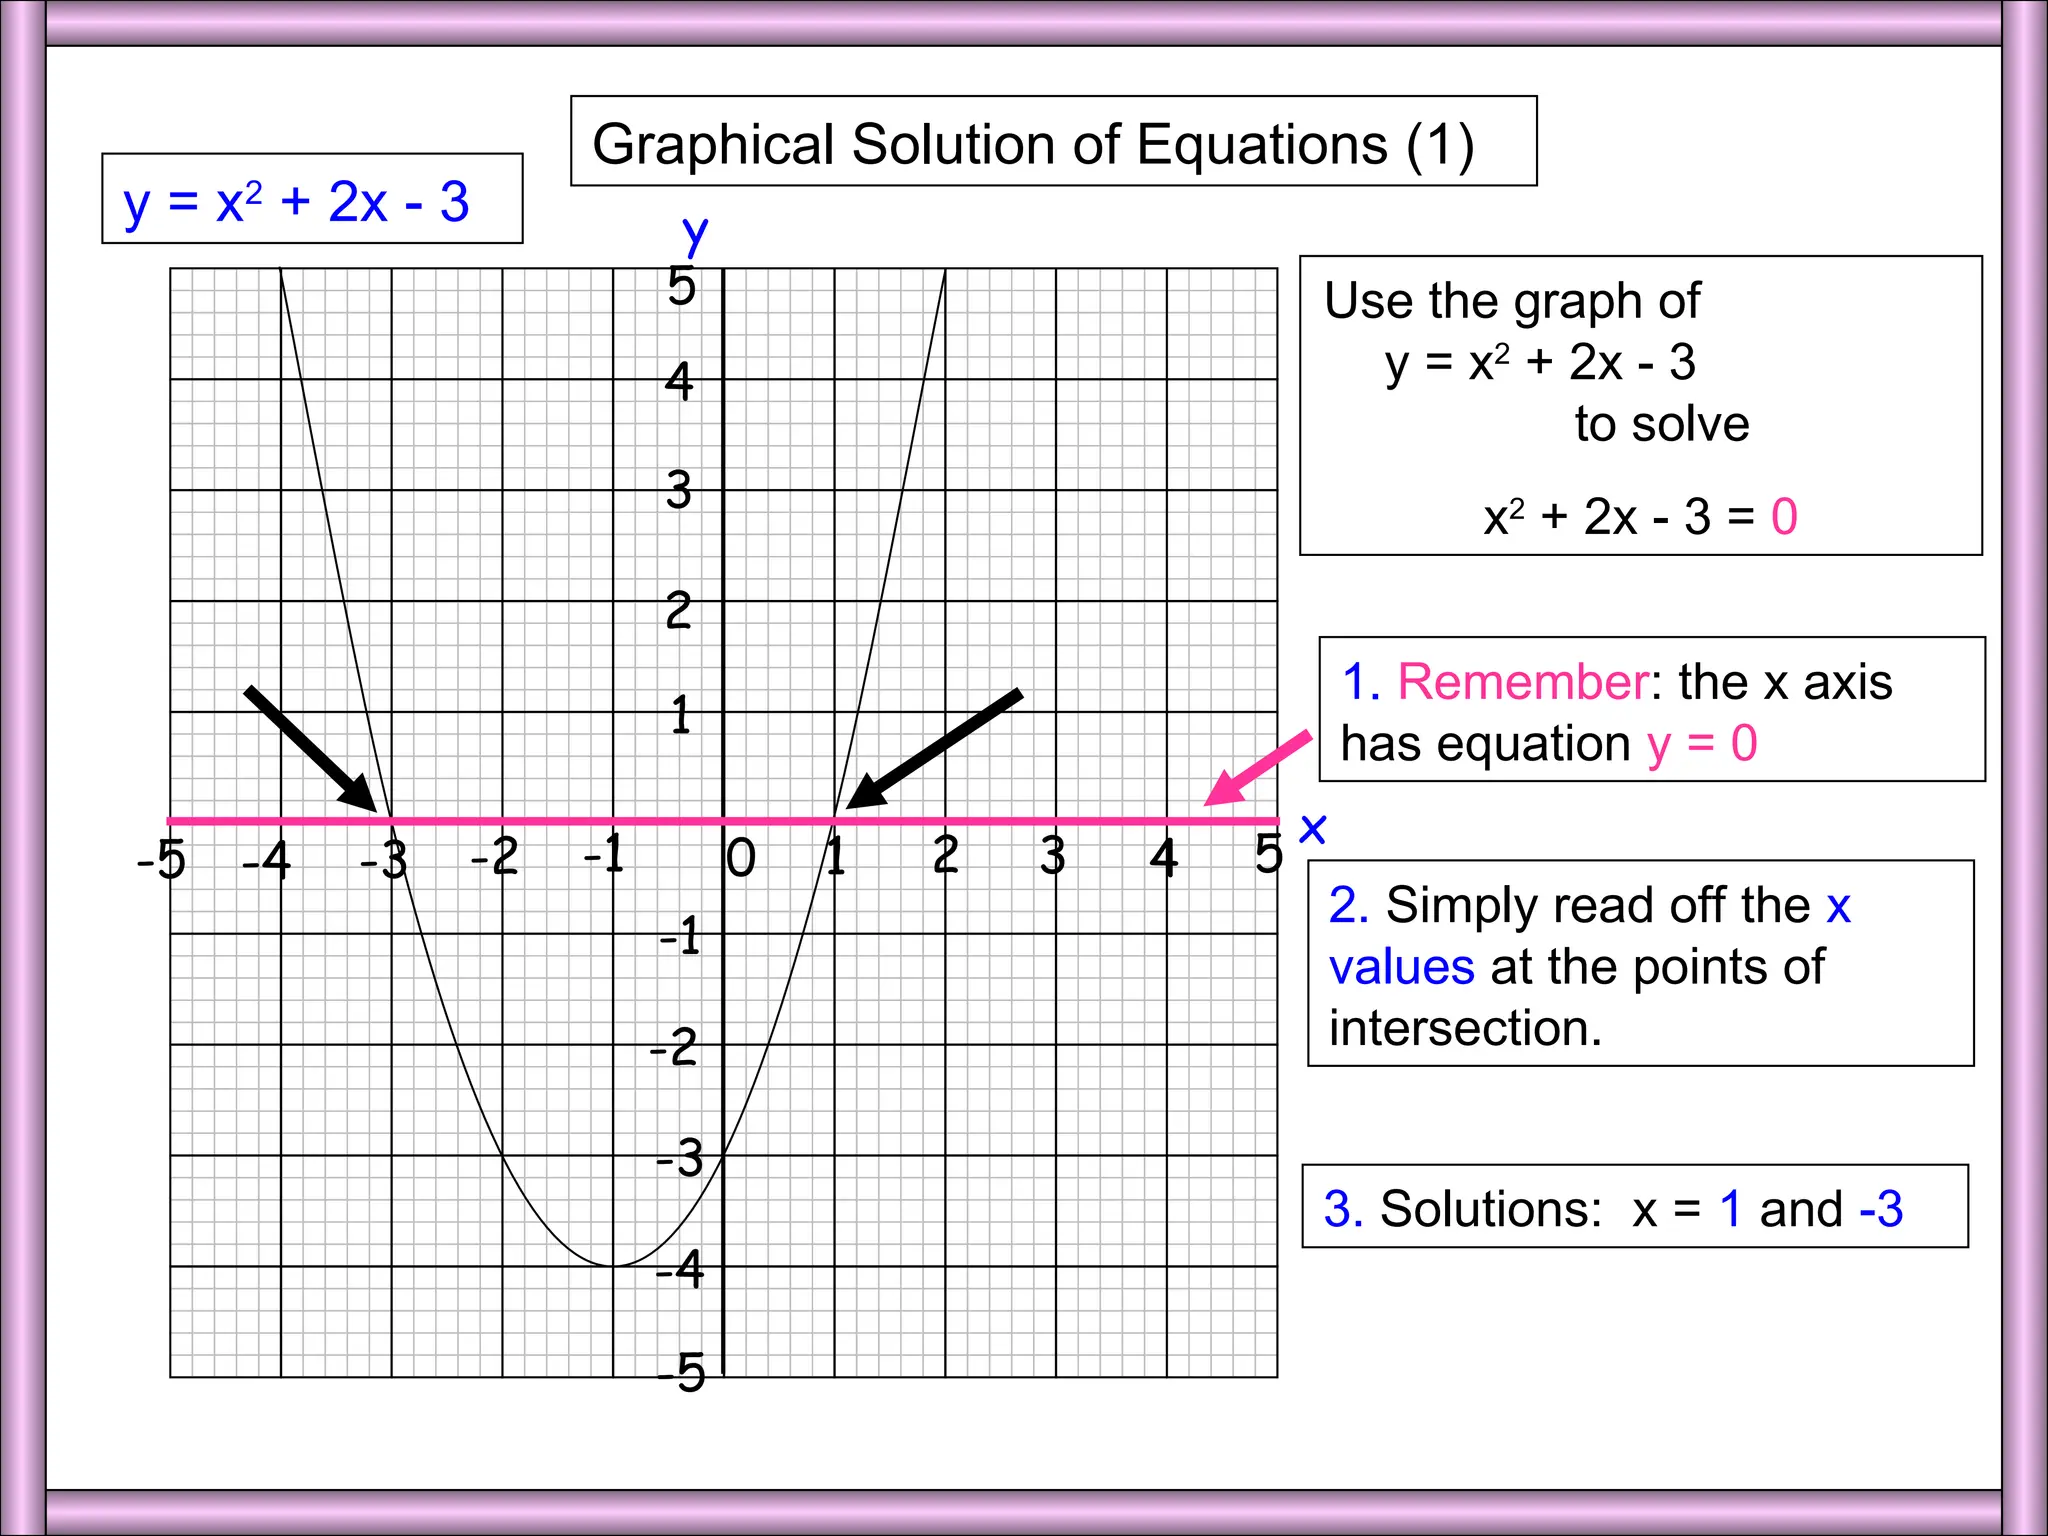
Graphical Solutionof Equations (1)
1 2 3 4 5
0
-1
-2
-3
-4
-5
x
2
1
3
4
5
y
-1
-2
-3
-4
-5
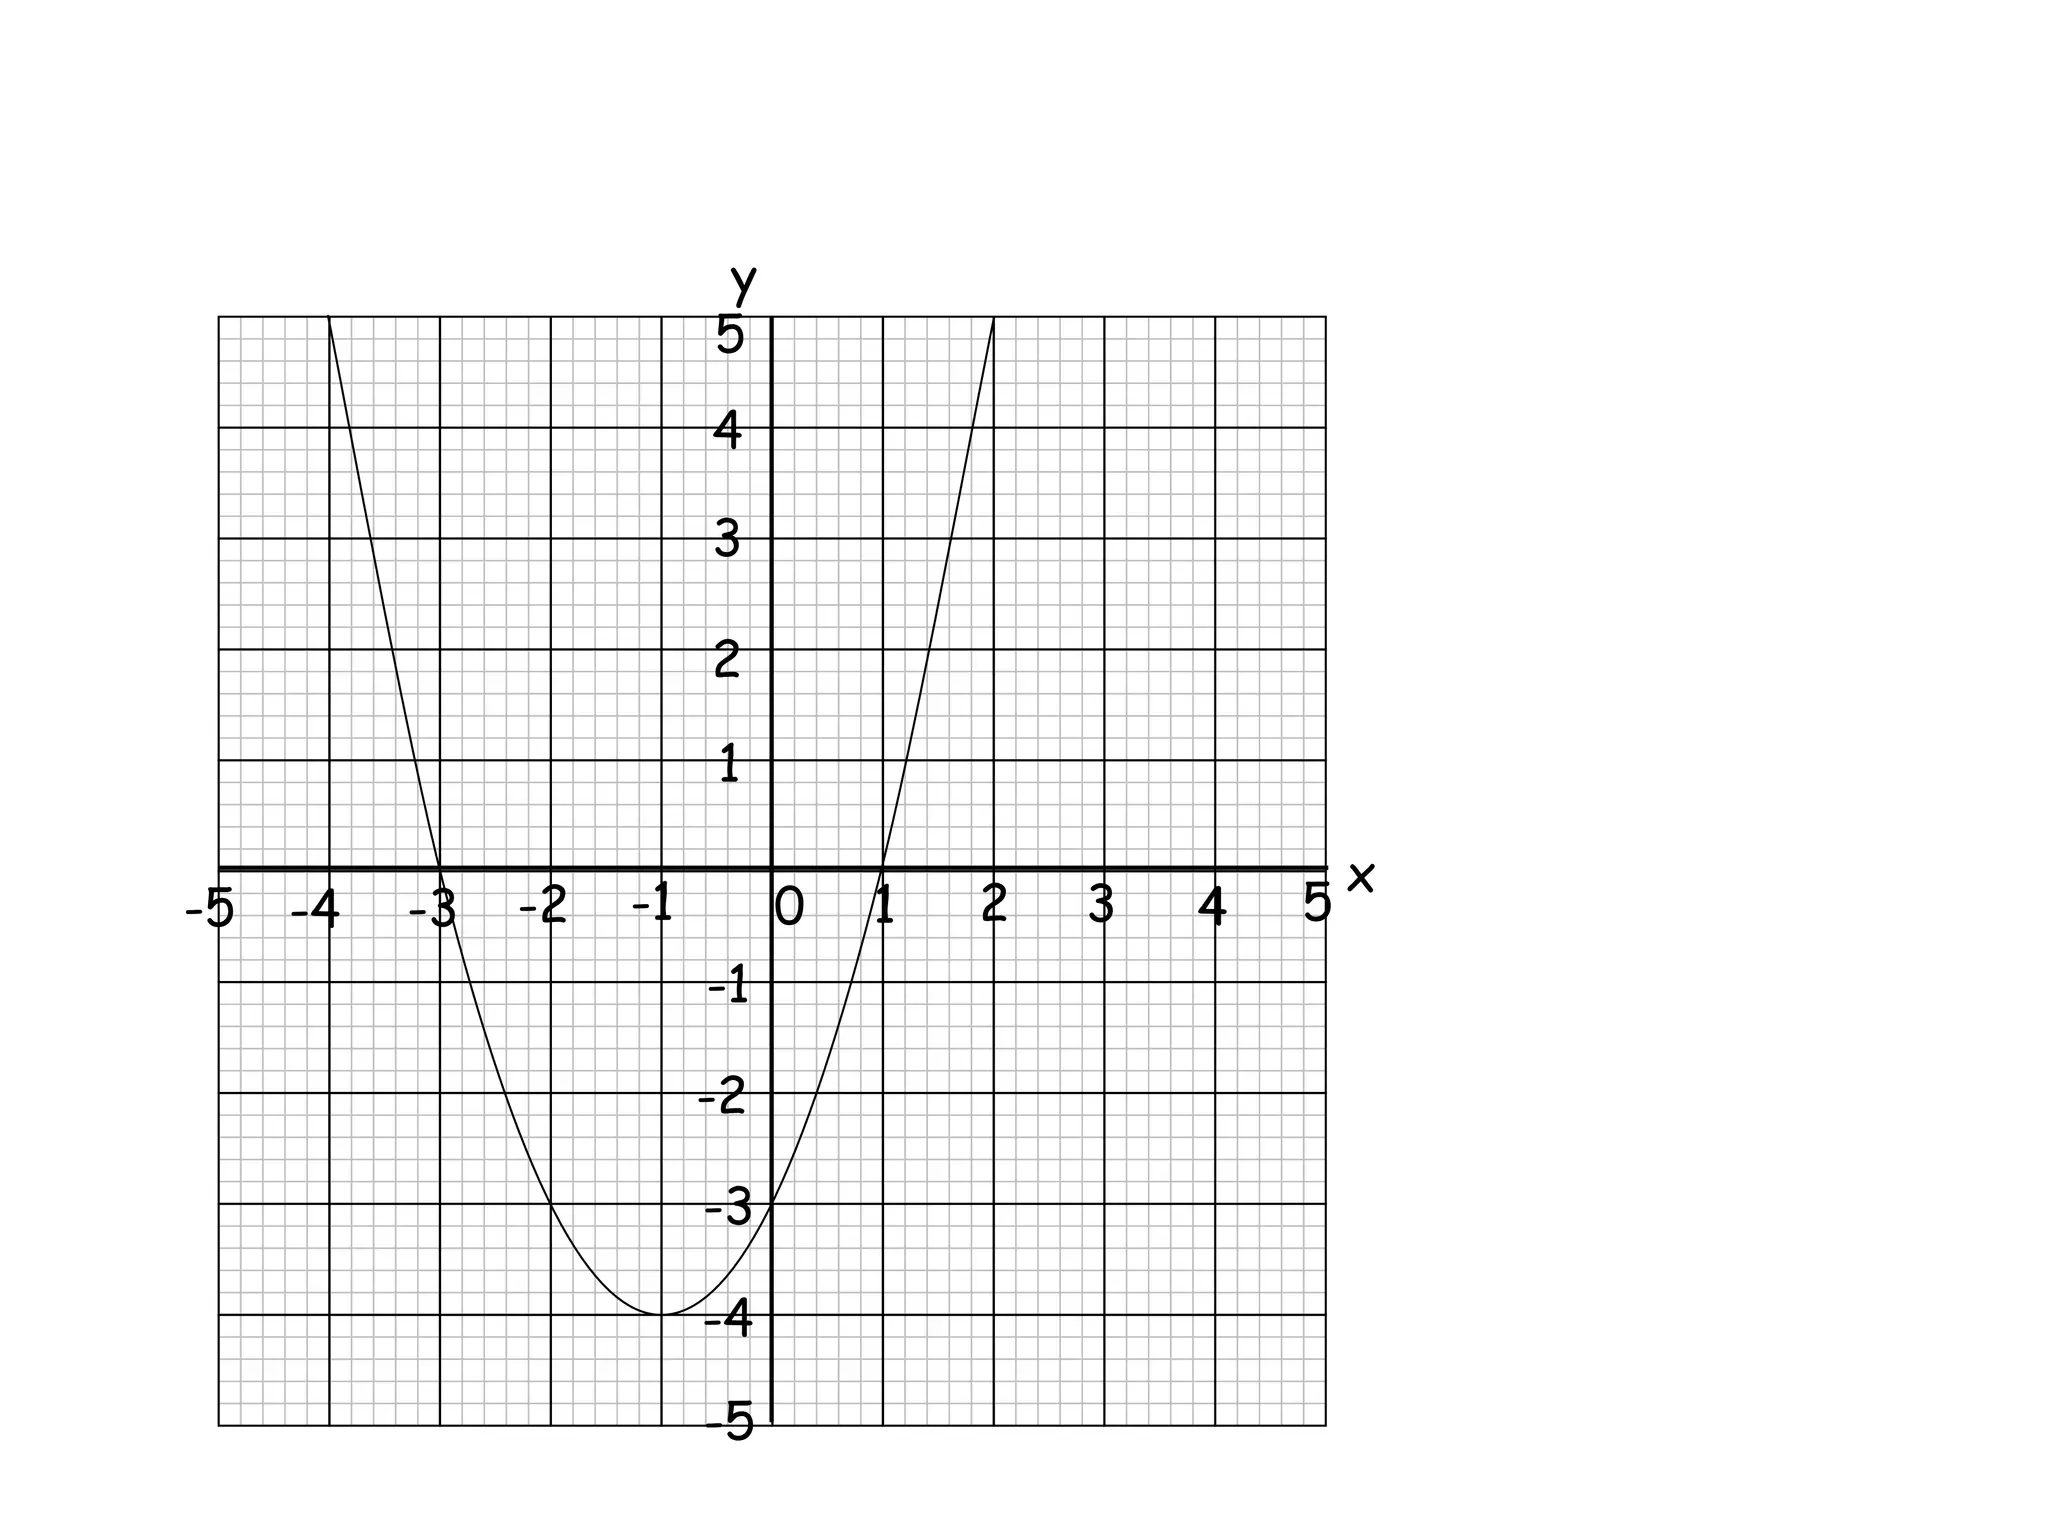
y = x2
+ 2x - 3
Use the graph of
y = x2
+ 2x - 3
to solve
x2
+ 2x - 3 = 0
2. Simply read off the x
values at the points of
intersection.
3. Solutions: x = 1 and -3
1. Remember: the x axis
has equation y = 0
3.
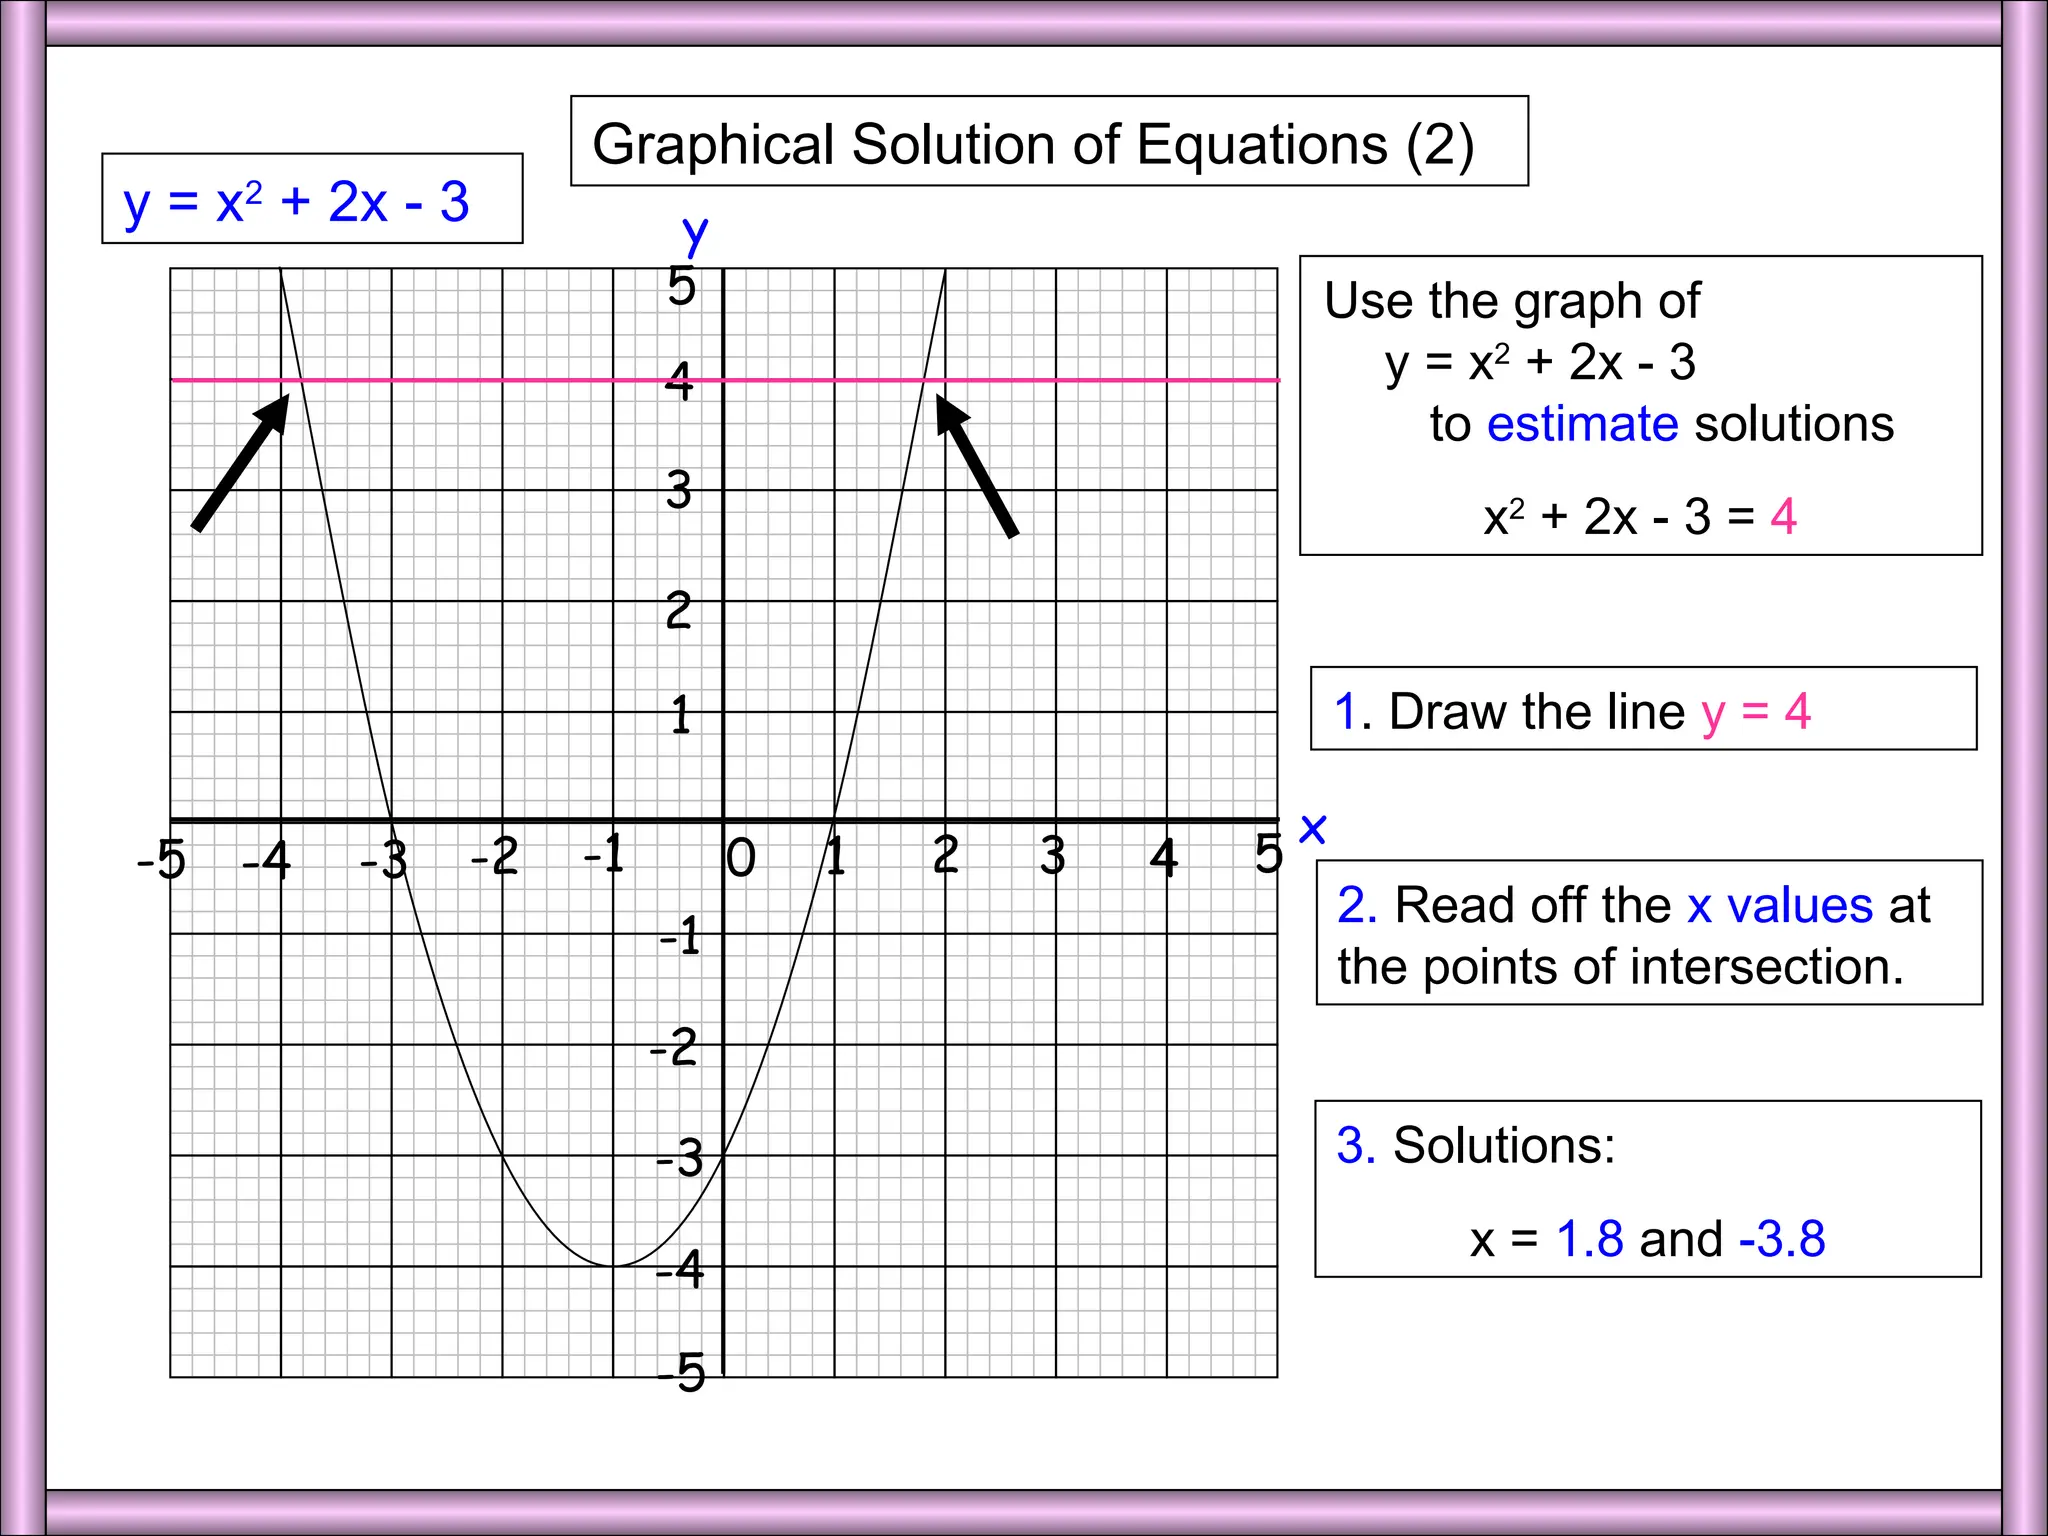
Graphical Solution ofEquations (2)
1 2 3 4 5
0
-1
-2
-3
-4
-5
x
2
1
3
4
5
y
-1
-2
-3
-4
-5
y = x2
+ 2x - 3
1. Draw the line y = 4
2. Read off the x values at
the points of intersection.
3. Solutions:
x = 1.8 and -3.8
Use the graph of
y = x2
+ 2x - 3
to estimate solutions
x2
+ 2x - 3 = 4
4.
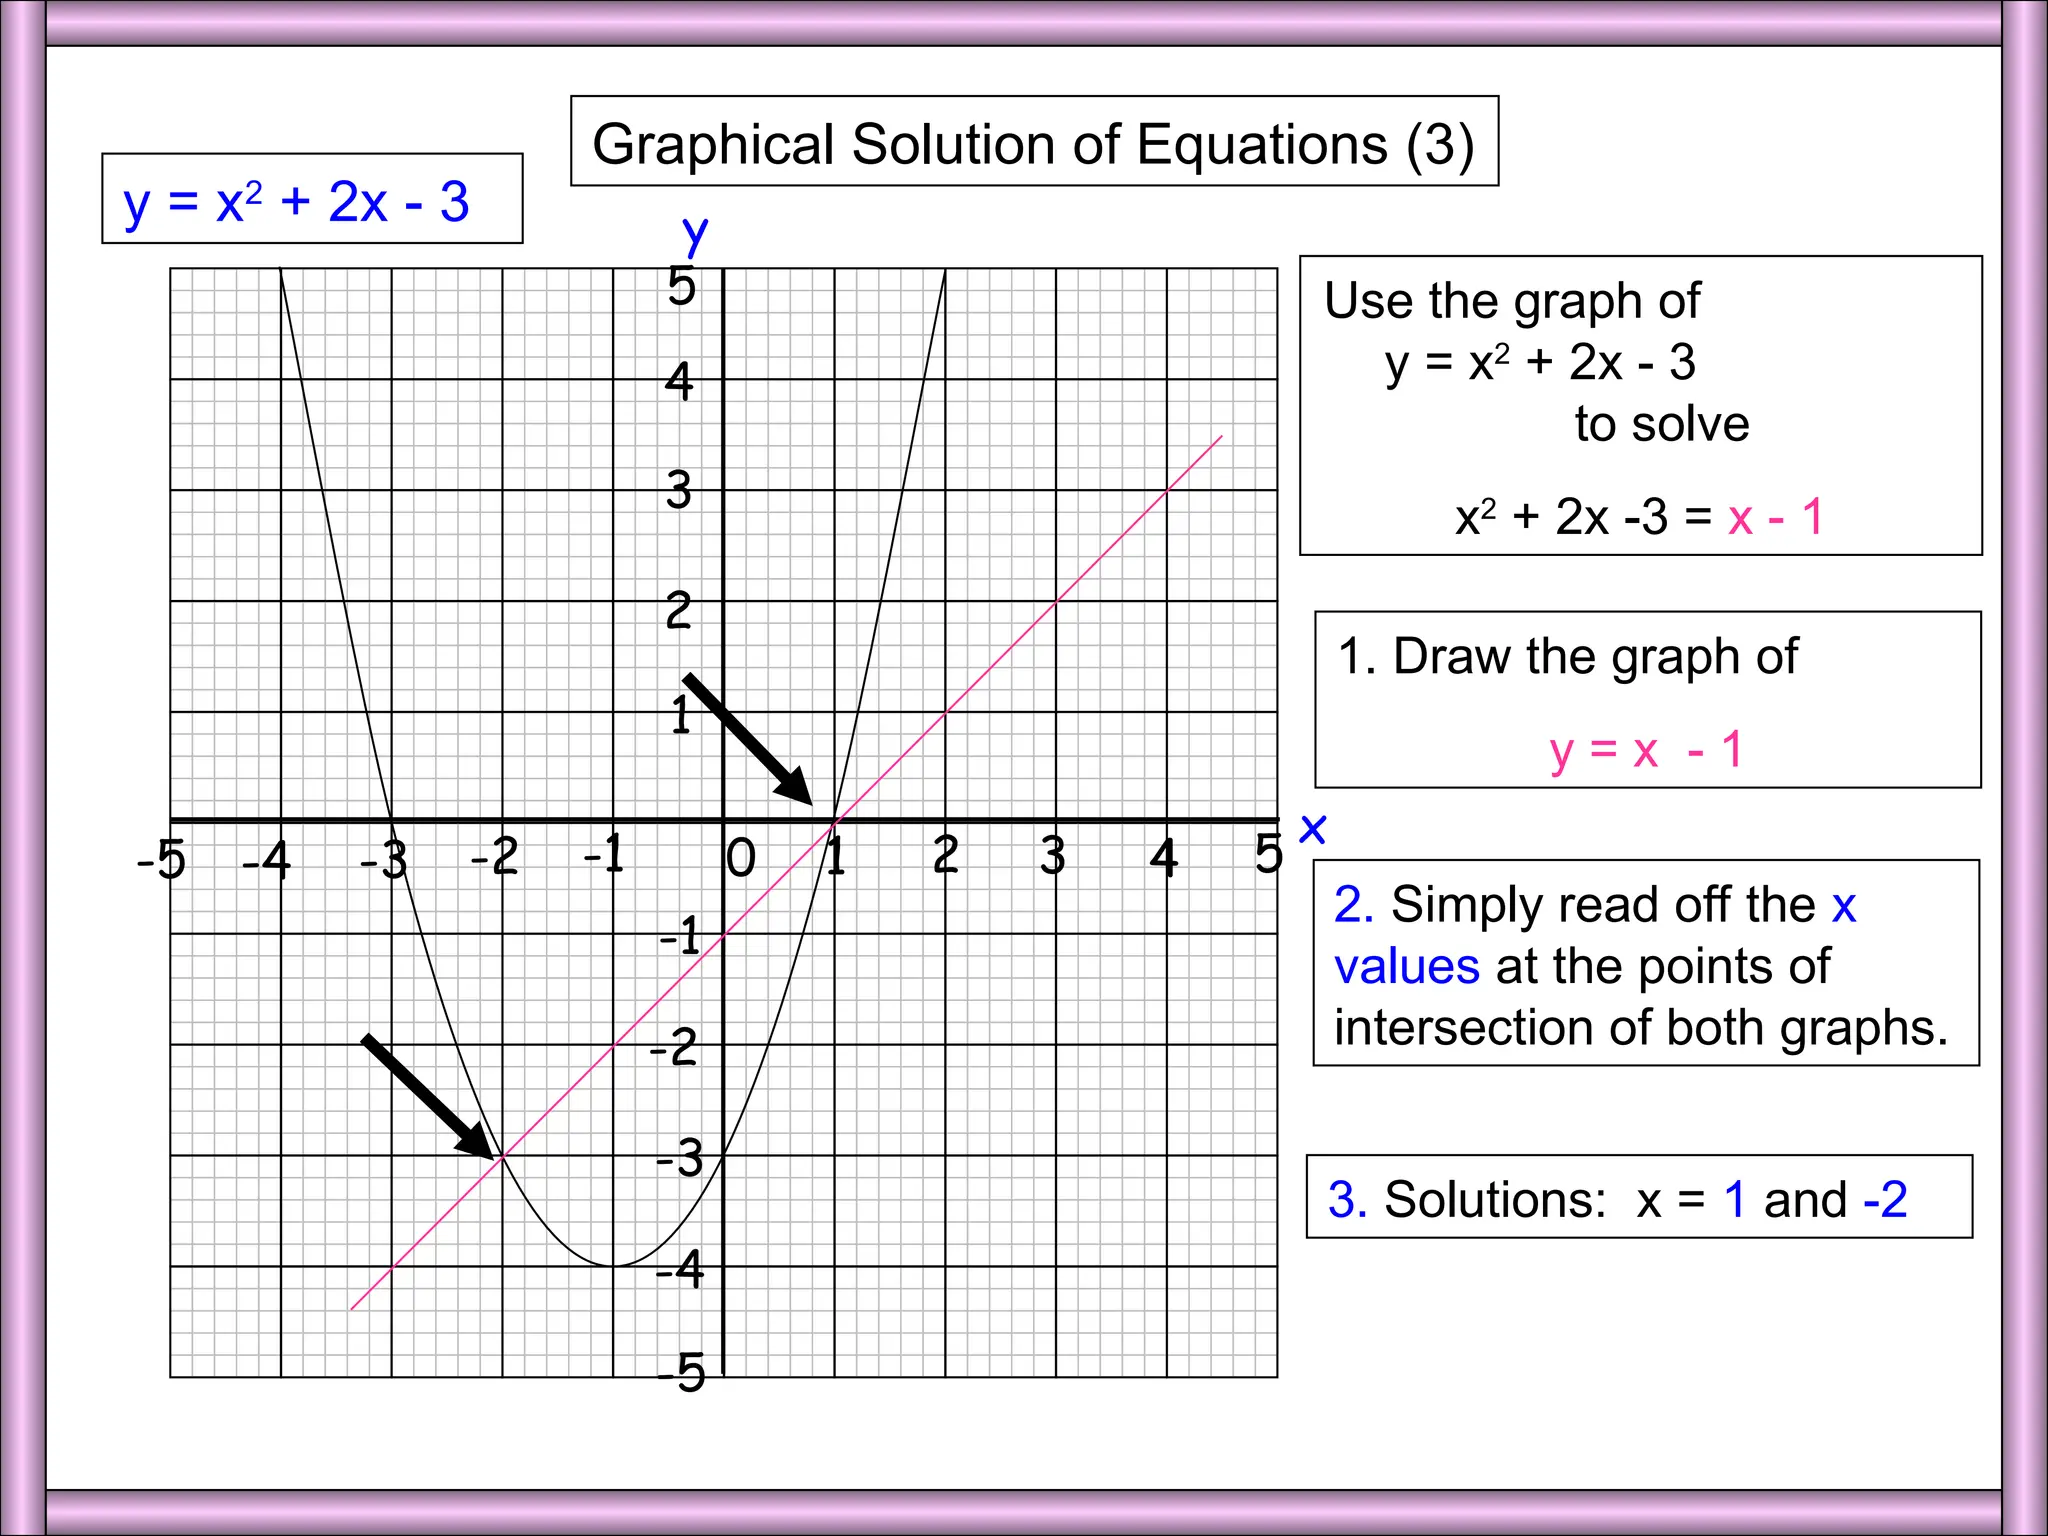
Graphical Solution ofEquations (3)
1 2 3 4 5
0
-1
-2
-3
-4
-5
x
2
1
3
4
5
y
-1
-2
-3
-4
-5
y = x2
+ 2x - 3
1. Draw the graph of
y = x - 1
2. Simply read off the x
values at the points of
intersection of both graphs.
3. Solutions: x = 1 and -2
Use the graph of
y = x2
+ 2x - 3
to solve
x2
+ 2x -3 = x - 1
5.
Cubic 1
1 23 4 5
0
-1
-2
-3
-4
-5
x
10
5
15
20
25
y
-5
-10
-15
-20
-25
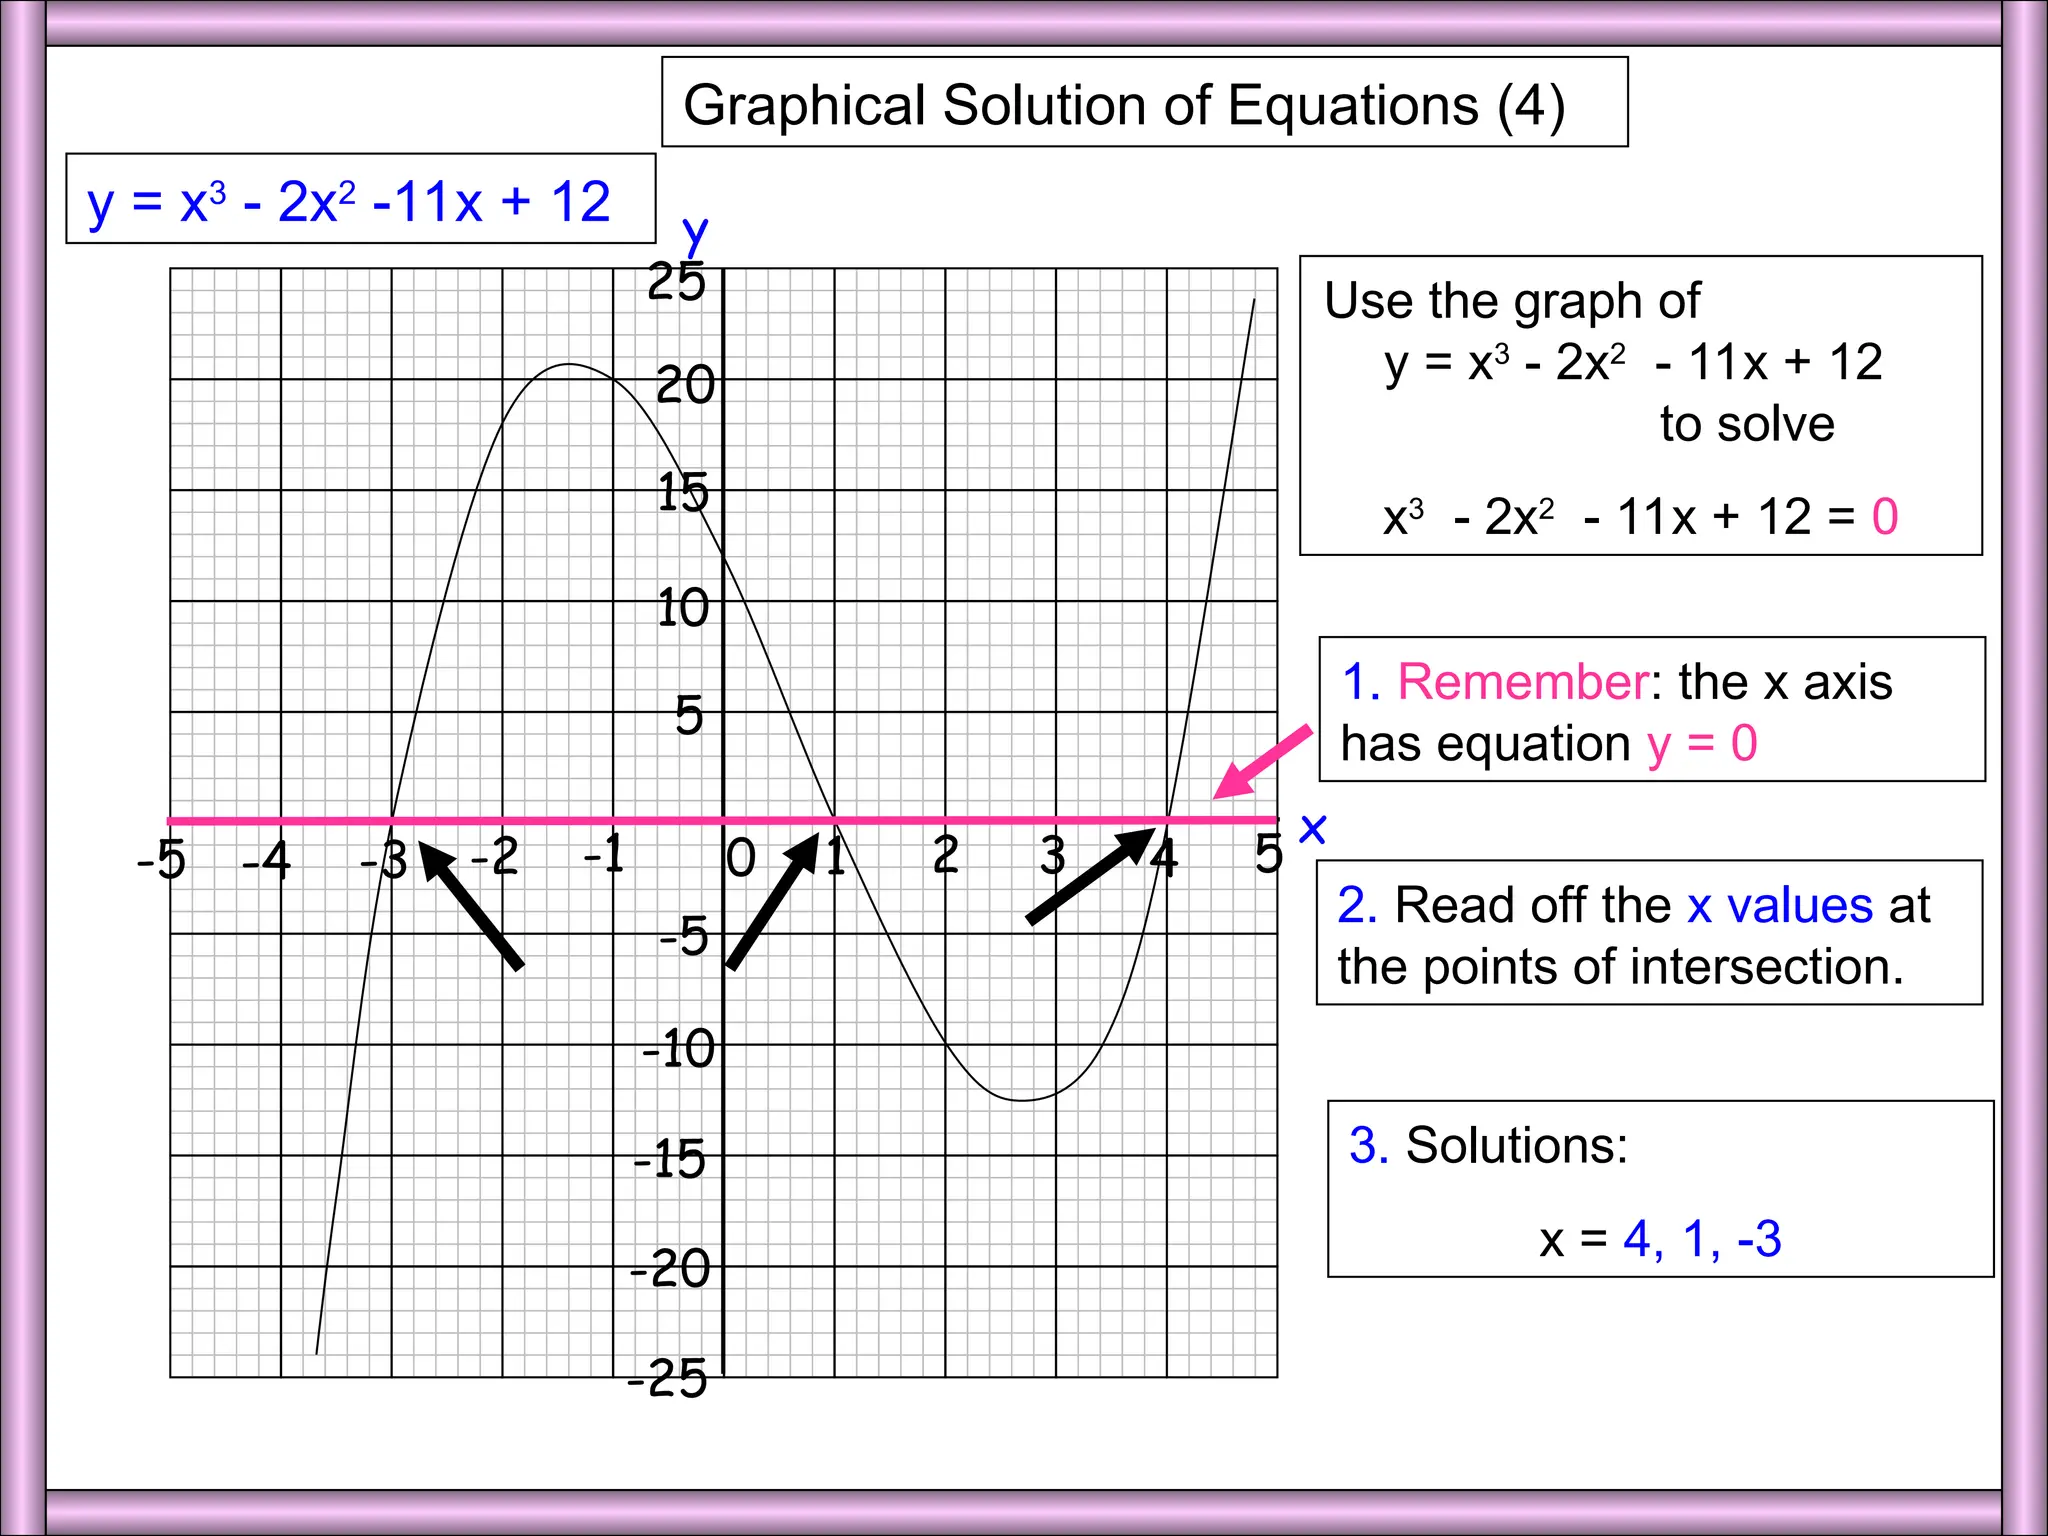
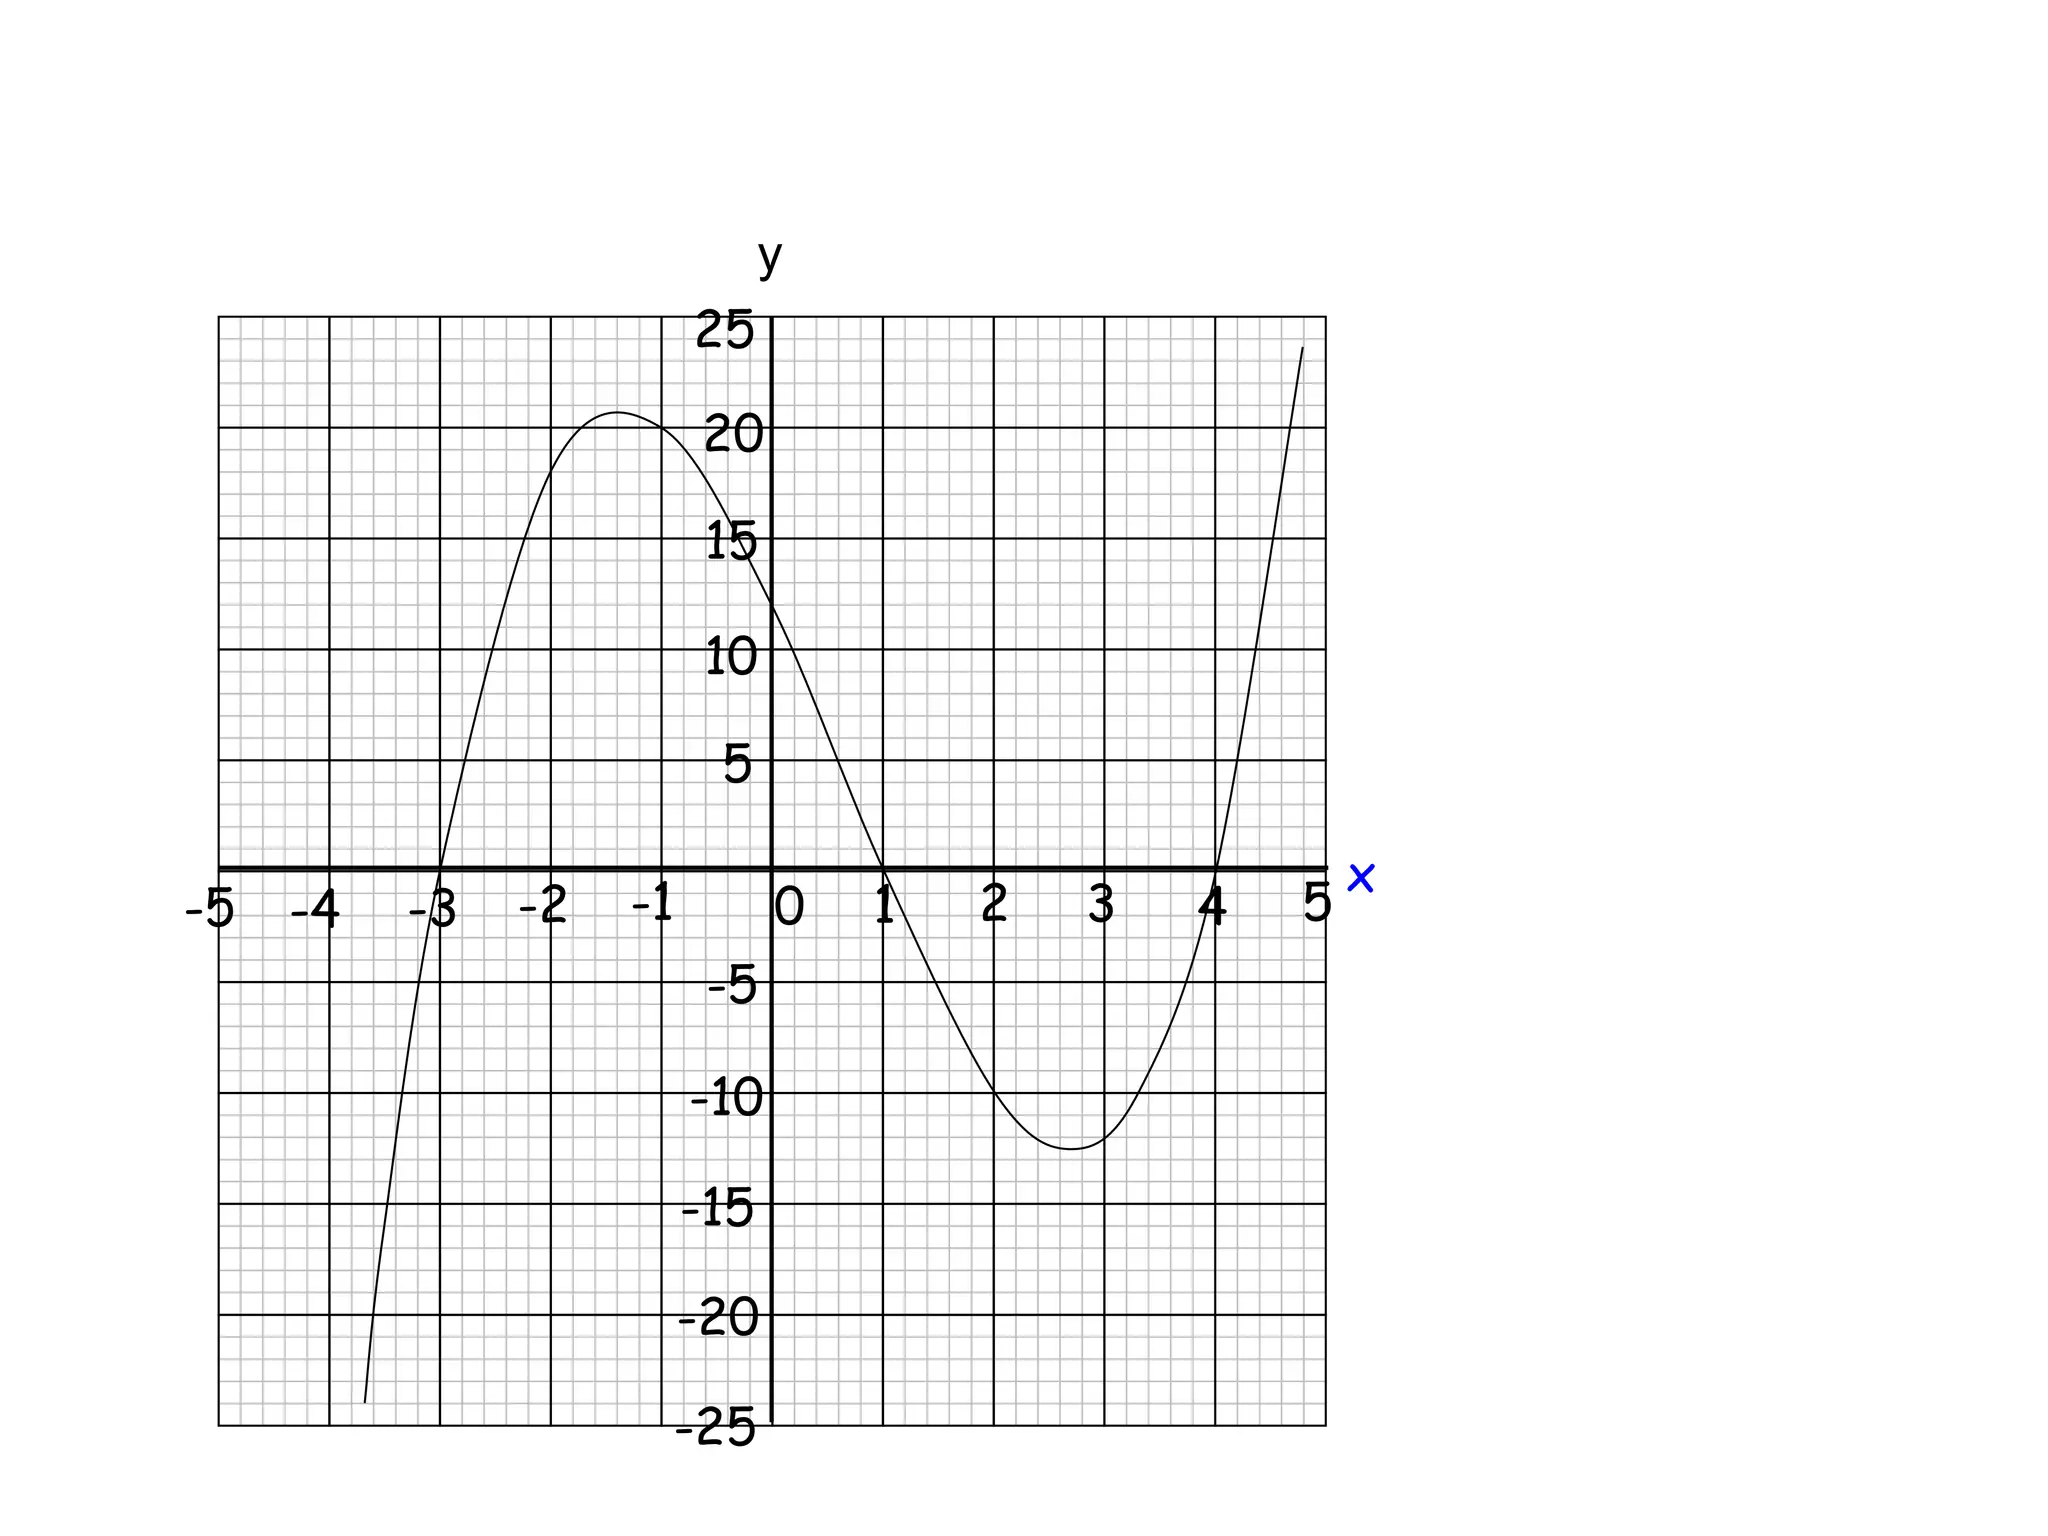
Graphical Solution of Equations (4)
y = x3
- 2x2
-11x + 12
2. Read off the x values at
the points of intersection.
3. Solutions:
x = 4, 1, -3
Use the graph of
y = x3
- 2x2
- 11x + 12
to solve
x3
- 2x2
- 11x + 12 = 0
1. Remember: the x axis
has equation y = 0
6.
1 2 34 5
0
-1
-2
-3
-4
-5
x
10
5
15
20
25
y
-5
-10
-15
-20
-25
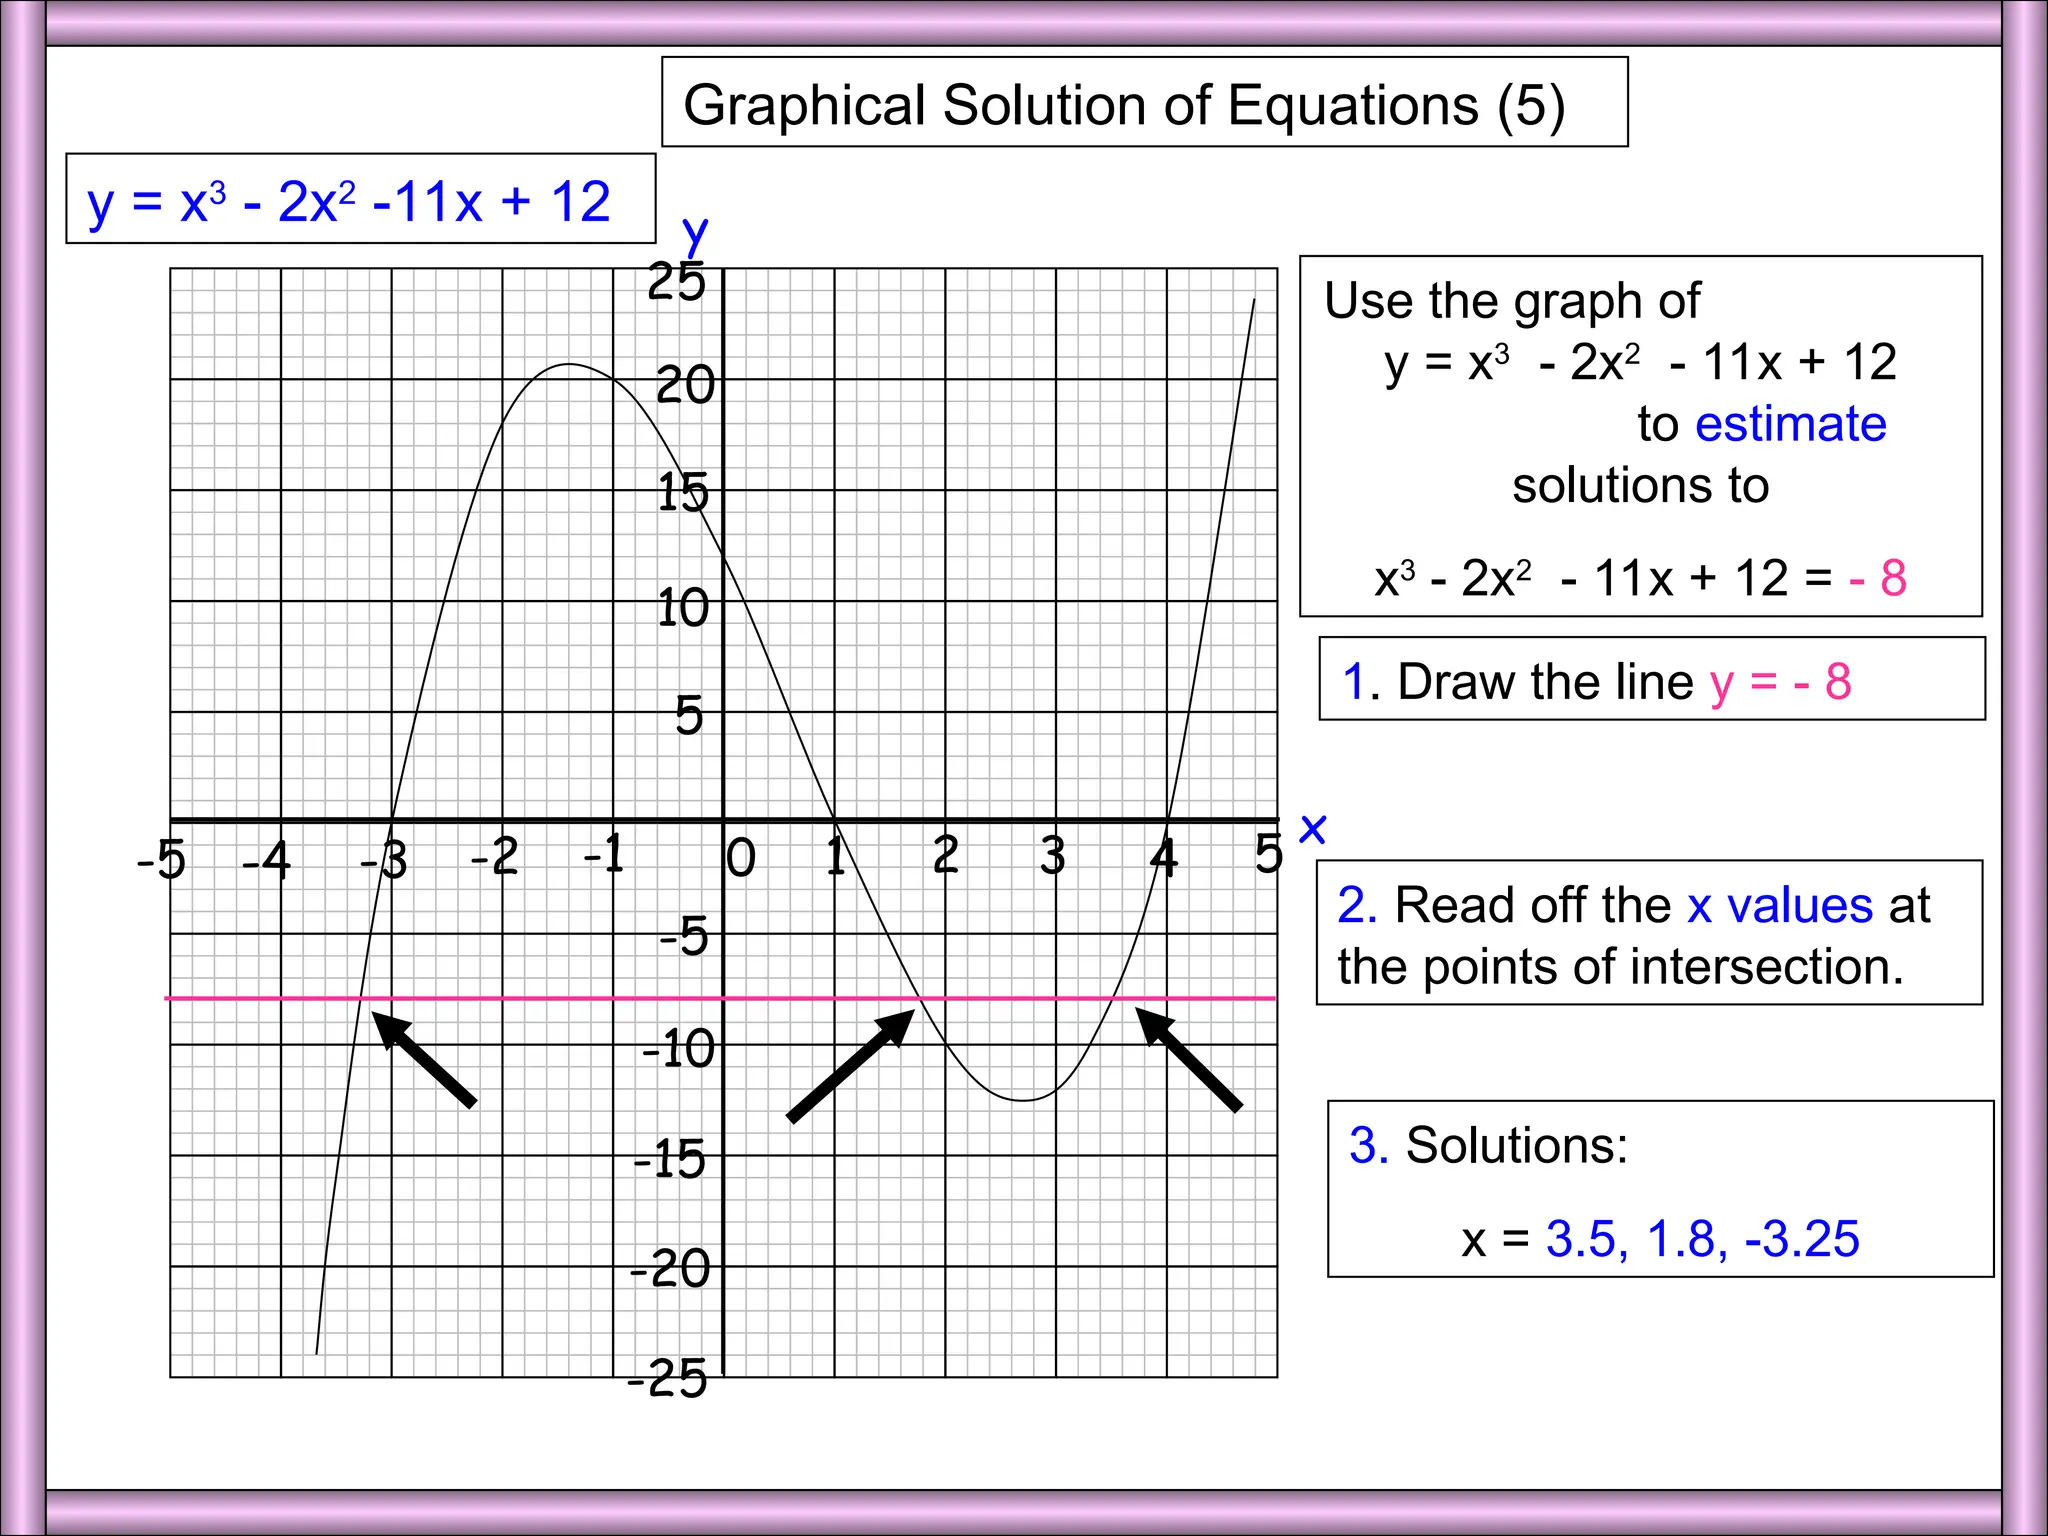
Graphical Solution of Equations (5)
y = x3
- 2x2
-11x + 12
2. Read off the x values at
the points of intersection.
3. Solutions:
x = 3.5, 1.8, -3.25
Use the graph of
y = x3
- 2x2
- 11x + 12
to estimate
solutions to
x3
- 2x2
- 11x + 12 = - 8
1. Draw the line y = - 8
7.
1 2 34 5
0
-1
-2
-3
-4
-5
x
10
5
15
20
25
y
-5
-10
-15
-20
-25
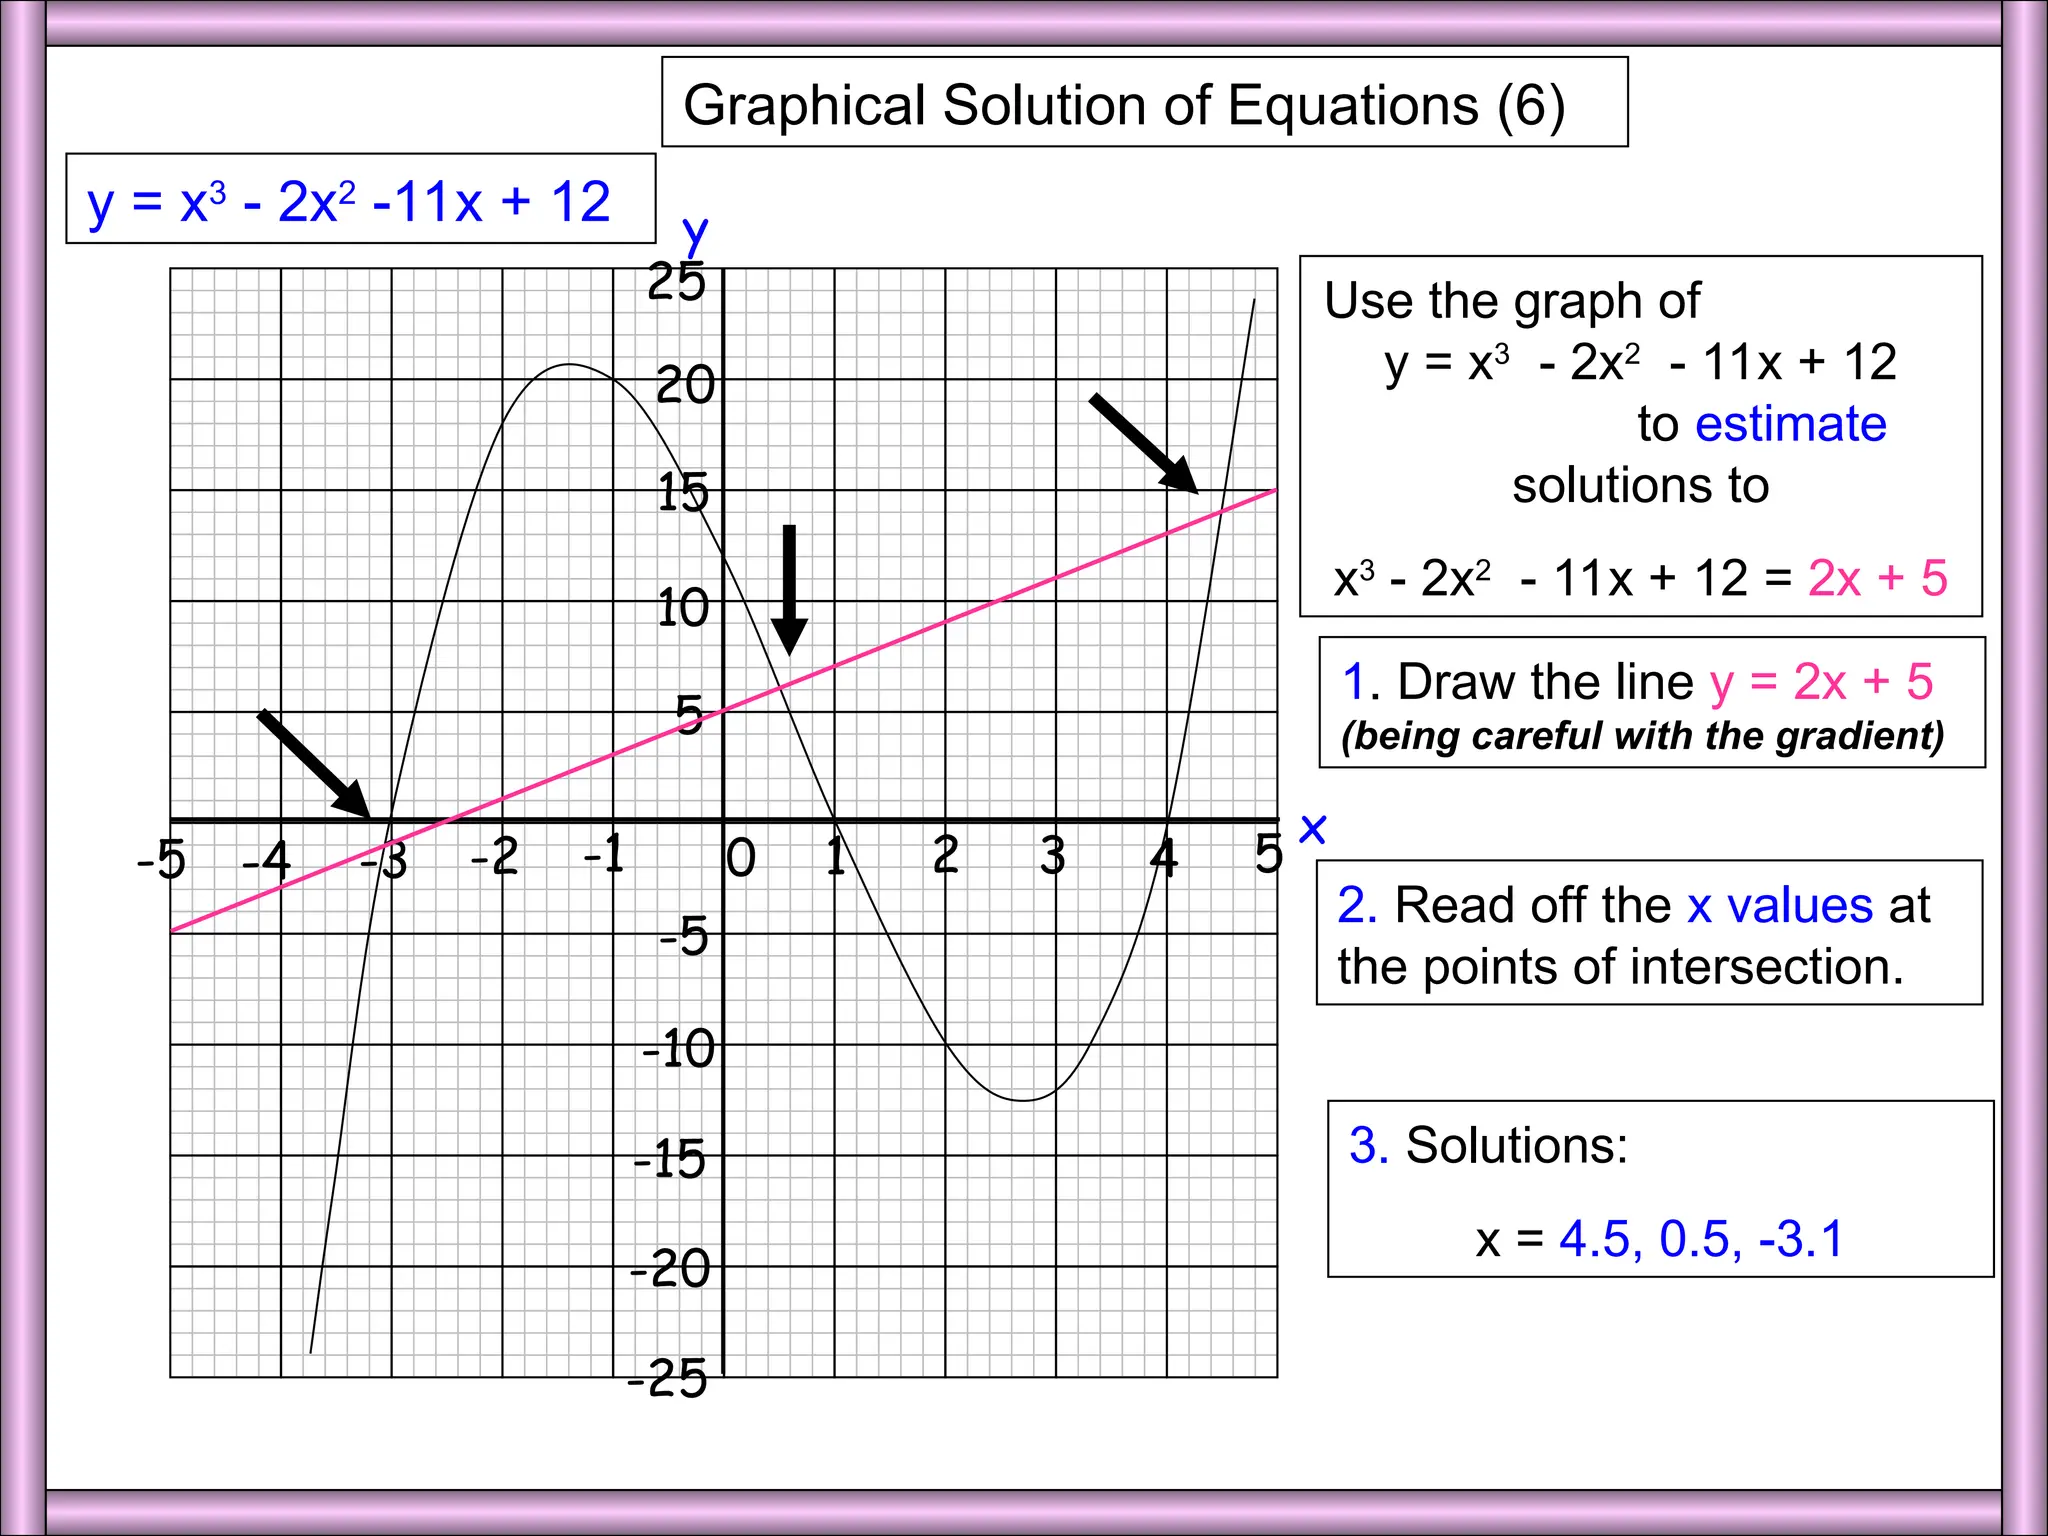
Graphical Solution of Equations (6)
y = x3
- 2x2
-11x + 12
2. Read off the x values at
the points of intersection.
3. Solutions:
x = 4.5, 0.5, -3.1
Use the graph of
y = x3
- 2x2
- 11x + 12
to estimate
solutions to
x3
- 2x2
- 11x + 12 = 2x + 5
1. Draw the line y = 2x + 5
(being careful with the gradient)
8.
Quadratic Change
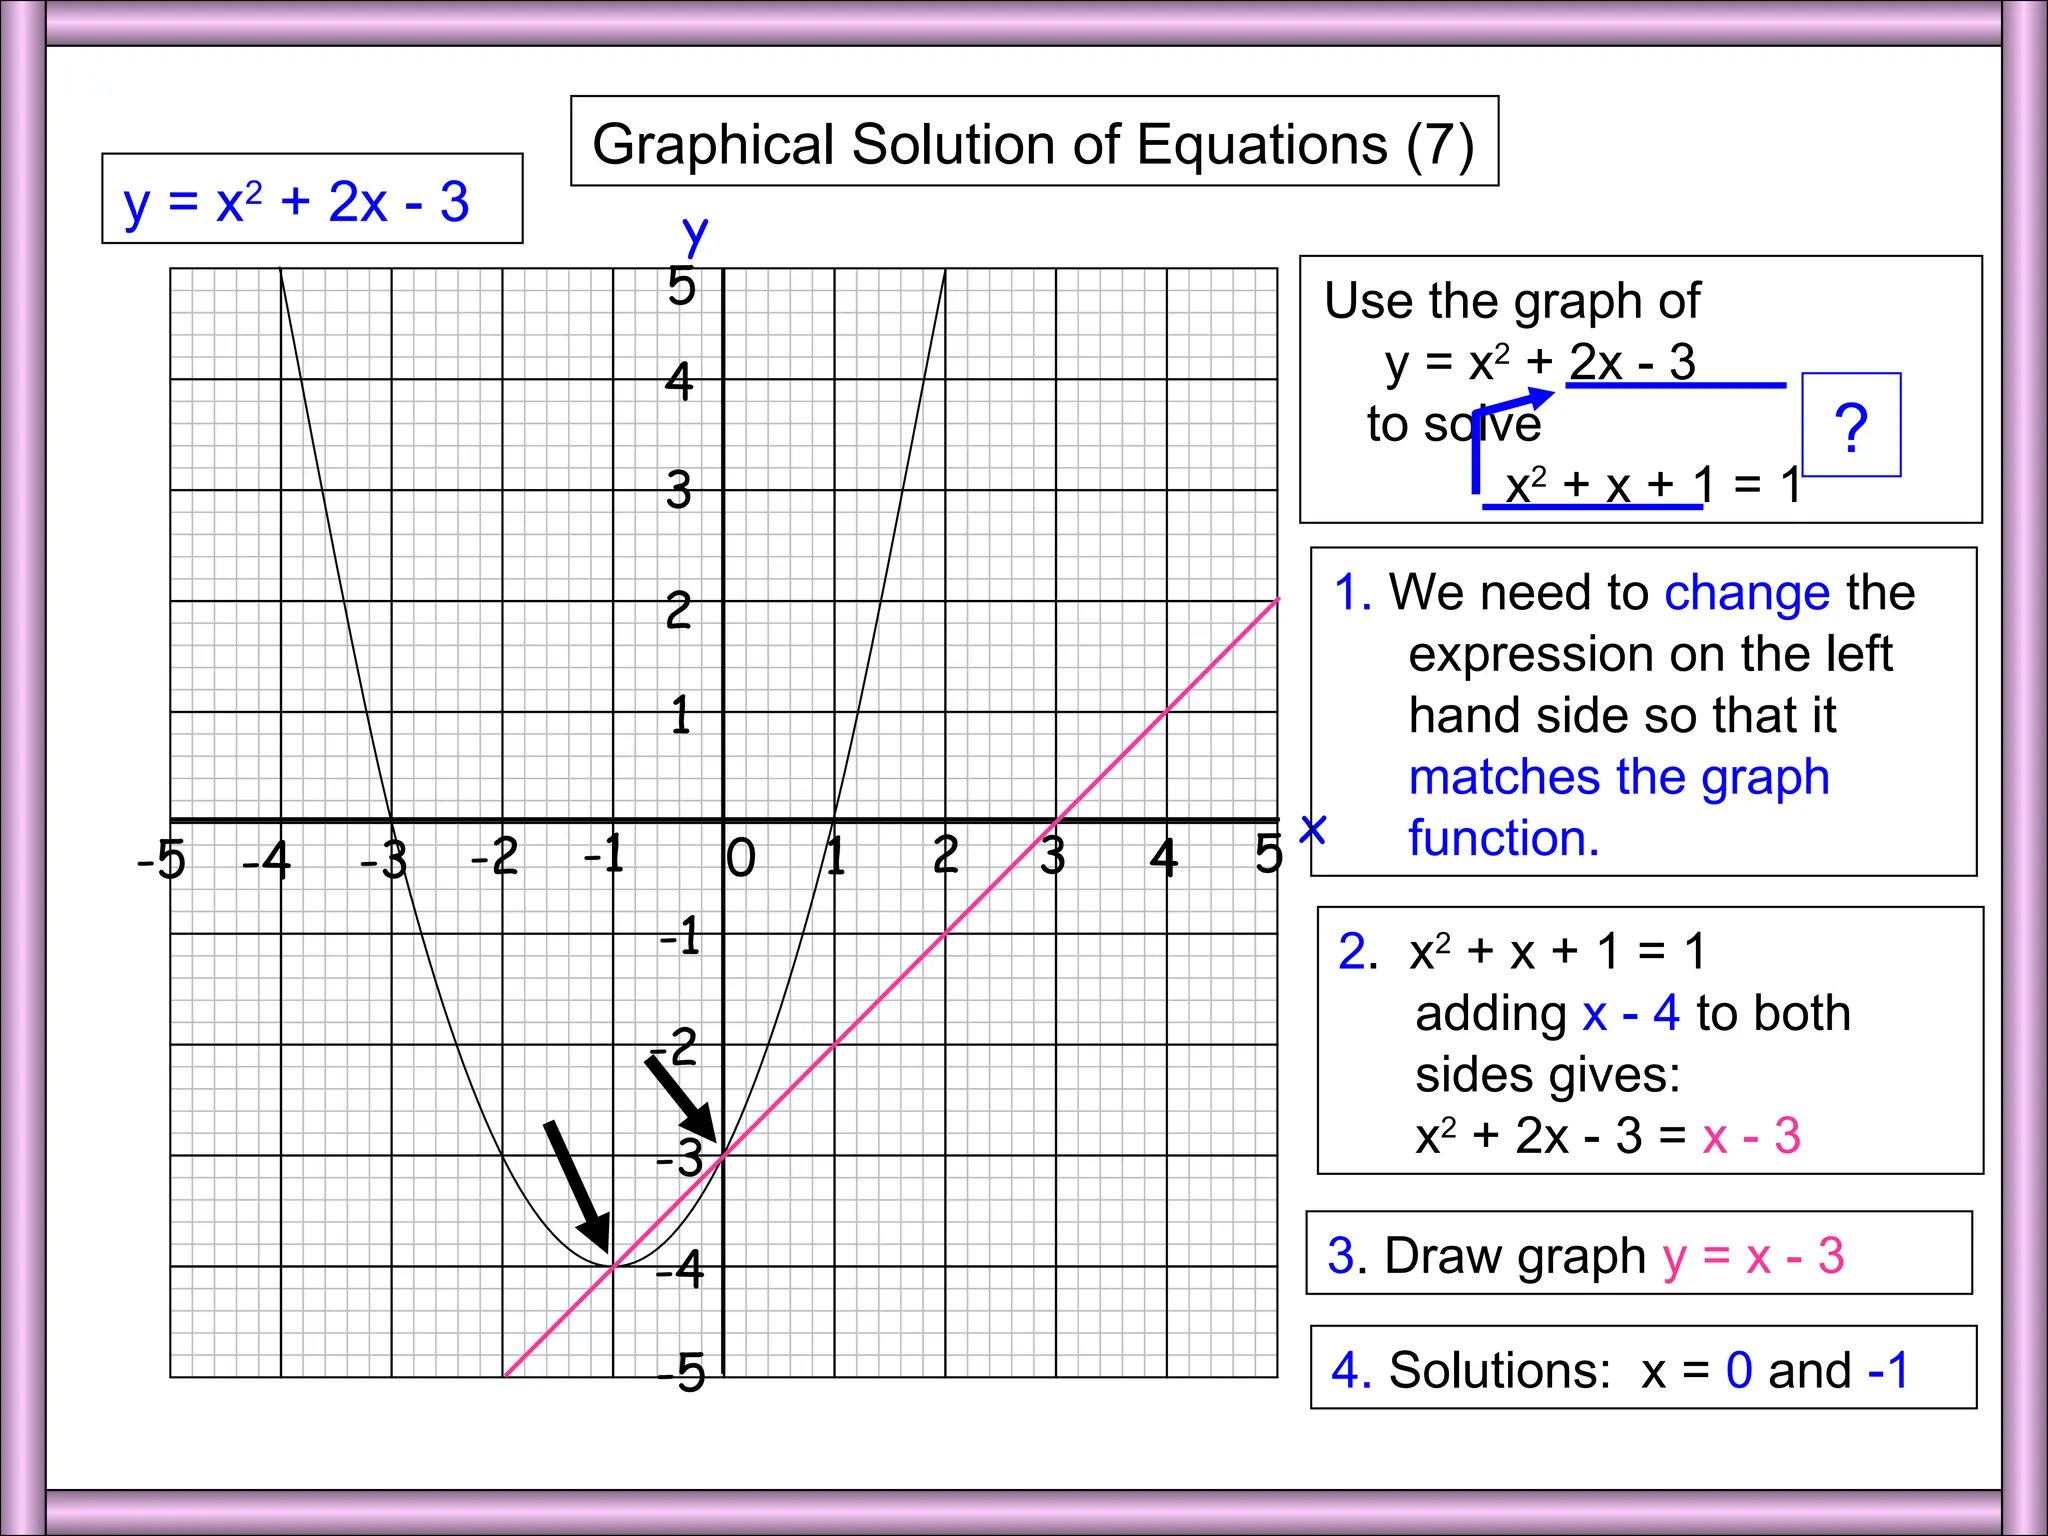
Graphical Solutionof Equations (7)
1 2 3 4 5
0
-1
-2
-3
-4
-5
x
2
1
3
4
5
y
-1
-2
-3
-4
-5
y = x2
+ 2x - 3
1. We need to change the
expression on the left
hand side so that it
matches the graph
function.
2. x2
+ x + 1 = 1
adding x - 4 to both
sides gives:
x2
+ 2x - 3 = x - 3
4. Solutions: x = 0 and -1
Use the graph of
y = x2
+ 2x - 3
to solve
x2
+ x + 1 = 1
3. Draw graph y = x - 3
?
9.
Cubic
Change
1 2 34 5
0
-1
-2
-3
-4
-5
x
10
5
15
20
25
y
-5
-10
-15
-20
-25
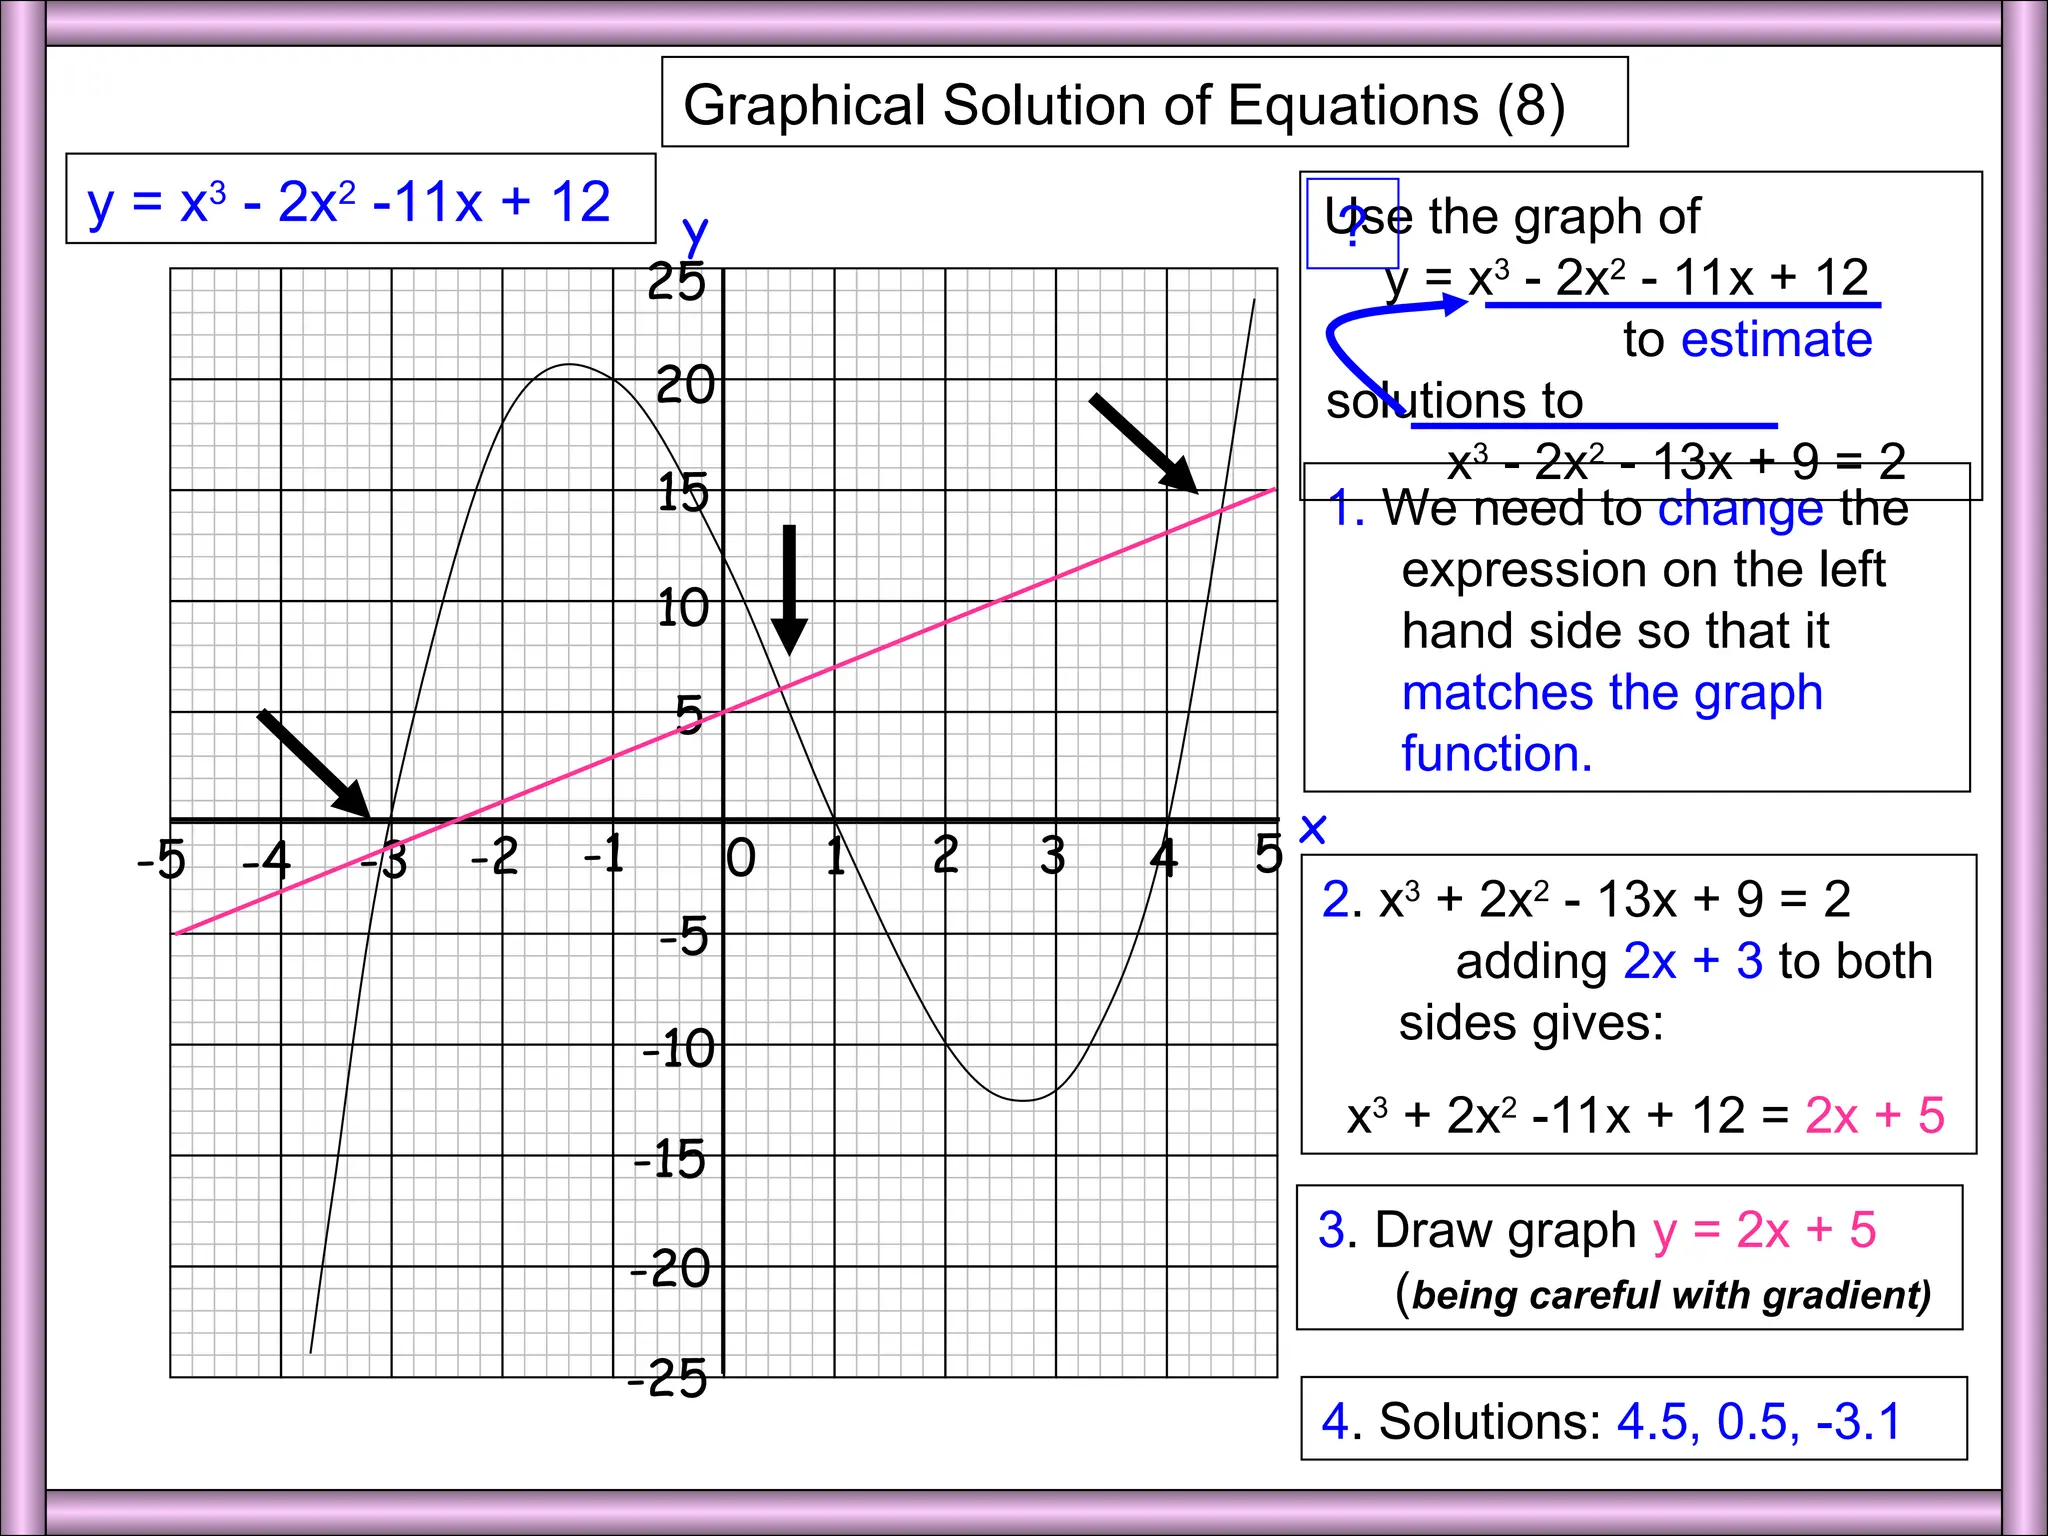
Graphical Solution of Equations (8)
y = x3
- 2x2
-11x + 12
1. We need to change the
expression on the left
hand side so that it
matches the graph
function.
2. x3
+ 2x2
- 13x + 9 = 2
adding 2x + 3 to both
sides gives:
x3
+ 2x2
-11x + 12 = 2x + 5
Use the graph of
y = x3
- 2x2
- 11x + 12
to estimate
solutions to
x3
- 2x2
- 13x + 9 = 2
3. Draw graph y = 2x + 5
(being careful with gradient)
4. Solutions: 4.5, 0.5, -3.1
?