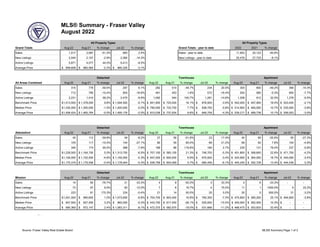
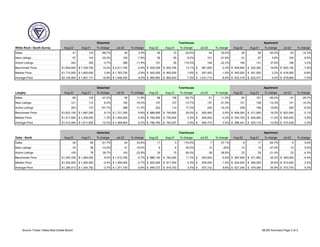
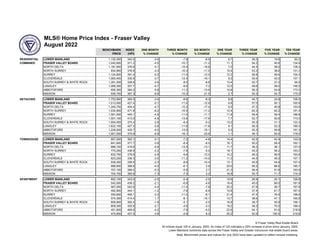
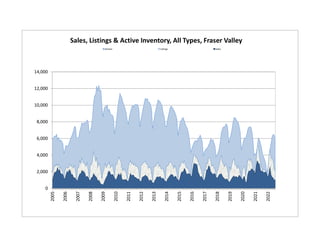
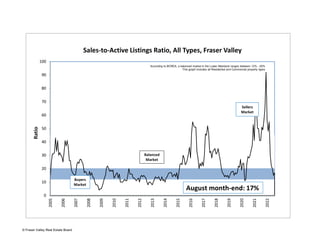
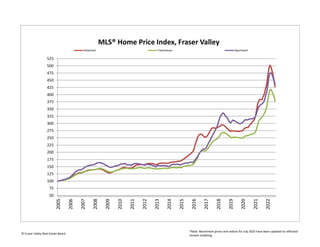
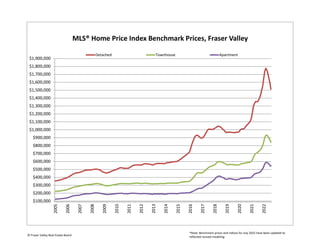
Fraser Valley Real Estate Board
Monthly Statistics Package
August 2022
Note: Benchmark prices and indices for July 2022 have been
updated to reflect revised modeling.
News Release
Fraser Valley Real Estate Board
Contact lilian.choi@fvreb.bc.ca
Lilian Choi, Communications Manager Telephone 604.930.7656
Fraser Valley Real Estate Board www.fvreb.bc.ca
www.fvreb100.ca
For Immediate Release: September 2, 2022
Fraser Valley housing market signals further settling as sales
continue to stall in response to interest rate rises
SURREY, BC – Robust active listings and relative steady sales activity continued to bring balance to the Fraser
Valley real estate market in August. The past several months of rising inventory combined with a slowing trend in
sales has also seen benchmark prices return to levels not seen since last year.
In August, the Fraser Valley Real Estate Board (FVREB) processed 1,017 sales on its Multiple Listing Service®
(MLS®), an increase of 2.4 per cent compared to last month and a 51.3 per cent decrease compared to this time
last year.
The Board received 2,045 new listings in August, a decrease of 14.3 per cent compared to July, and only 2.9 per
cent less than August 2021. The month ended with a total active inventory of 5,871, a decrease of 8.5 per cent
from last month but up by 44 percent compared to August 2021. Once again August saw a balanced market in the
Fraser Valley with an overall sales-to-active ratio of 17 per cent (the market is considered balanced when the sales-
to-active ratio is between 12 per cent and 20 per cent).
“For the past three months we’ve seen the local market return to a more balanced state,” said Board President,
Sandra Benz. “With the Fraser Valley continuing to settle after months of record sales and prices, we expect to see
more activity this coming fall as buyers look to capitalize on the region’s reputation for providing greater value for
the real estate dollar.”
Benchmark prices continued to fall across all property categories, bringing them in relative line with prices from
December 2021 and eating into year-over year gains.
“With possible further hikes in interest rates this fall, homebuyers need to augment their decisions with critical
advice and guidance,” said Baldev Gill, Board CEO. “Along with other professionals such as mortgage brokers and
lawyers, Fraser Valley REALTORS® are a vital part of the team advising buyers and sellers on market realities and
identifying potential opportunities that align with their objectives.”
Across the Fraser Valley in August, the average number of days to sell a single-family detached home increased to
33 and for townhomes to 26 days. Apartments took, on average, 25 days to sell.
MLS® HPI Benchmark Price Activity
• Single Family Detached: At $1,513,500, the Benchmark price for an FVREB single-family detached home
decreased 5.1 per cent compared to July 2022 and increased 9.8 per cent compared to August 2021.
• Townhomes: At $841,900, the Benchmark price for an FVREB townhome decreased 3.9 per cent compared to
July 2022 and increased 16.1 per cent compared to August 2021.
• Apartments: At $542,000 the Benchmark price for an FVREB apartment/condo decreased 2.1 per cent
compared to July 2022 and increased 18.4 per cent compared to August 2021.
—30 —
The Fraser Valley Real Estate Board is an association of 4,888 real estate professionals who live and work in the BC communities of
Abbotsford, Langley, Mission, North Delta, Surrey, and White Rock.
MLS® Summary - Fraser Valley
August 2022
All Property Types All Property Types
Grand Totals Aug-22 Aug-21 % change Jul-22 % change Grand Totals - year to date 2022 2021 % change
Sales 1,017 2,087 -51.3% 993 2.4% Sales - year to date 11,943 20,122 -40.6%
New Listings 2,045 2,107 -2.9% 2,385 -14.3% New Listings - year to date 25,476 27,725 -8.1%
Active Listings 5,871 4,077 44.0% 6,413 -8.5%
Average Price 959,608
$ 982,582
$ -2.3% 990,325
$ -3.1%
Detached Townhouse Apartment
All Areas Combined Aug-22 Aug-21 % change Jul-22 % change Aug-22 Aug-21 % change Jul-22 % change Aug-22 Aug-21 % change Jul-22 % change
Sales 315 778 -59.5% 297 6.1% 282 510 -44.7% 234 20.5% 305 600 -49.2% 356 -14.3%
New Listings 712 795 -10.4% 854 -16.6% 461 453 1.8% 572 -19.4% 554 585 -5.3% 600 -7.7%
Active Listings 2,231 1,410 58.2% 2,475 -9.9% 1,092 544 100.7% 1,281 -14.8% 1,208 912 32.5% 1,278 -5.5%
Benchmark Price 1,513,500
$ 1,378,000
$ 9.8% 1,594,500
$ -5.1% 841,900
$ 725,000
$ 16.1% 876,500
$ -3.9% 542,000
$ 457,900
$ 18.4% 553,400
$ -2.1%
Median Price 1,330,000
$ 1,350,000
$ -1.5% 1,400,000
$ -5.0% 790,000
$ 733,750
$ 7.7% 838,750
$ -5.8% 514,900
$ 465,000
$ 10.7% 535,000
$ -3.8%
Average Price 1,458,424
$ 1,465,764
$ -0.5% 1,495,176
$ -2.5% 810,038
$ 737,934
$ 9.8% 846,759
$ -4.3% 539,217
$ 489,738
$ 10.1% 556,003
$ -3.0%
Detached Townhouse Apartment
Abbotsford Aug-22 Aug-21 % change Jul-22 % change Aug-22 Aug-21 % change Jul-22 % change Aug-22 Aug-21 % change Jul-22 % change
Sales 45 112 -59.8% 49 -8.2% 27 56 -51.8% 23 17.4% 40 90 -55.6% 55 -27.3%
New Listings 105 117 -10.3% 144 -27.1% 80 50 60.0% 66 21.2% 99 92 7.6% 104 -4.8%
Active Listings 340 174 95.4% 368 -7.6% 189 86 119.8% 184 2.7% 235 131 79.4% 237 -0.8%
Benchmark Price 1,228,500
$ 1,164,700
$ 5.5% 1,313,700
$ -6.5% 707,100
$ 583,100
$ 21.3% 746,700
$ -5.3% 451,800
$ 368,600
$ 22.6% 471,700
$ -4.2%
Median Price 1,100,000
$ 1,152,500
$ -4.6% 1,150,000
$ -4.3% 647,000
$ 605,000
$ 6.9% 670,000
$ -3.4% 424,950
$ 364,000
$ 16.7% 440,000
$ -3.4%
Average Price 1,175,319
$ 1,179,556
$ -0.4% 1,178,944
$ -0.3% 638,799
$ 604,069
$ 5.7% 680,456
$ -6.1% 445,240
$ 392,728
$ 13.4% 444,536
$ 0.2%
Detached Townhouse Apartment
Mission Aug-22 Aug-21 % change Jul-22 % change Aug-22 Aug-21 % change Jul-22 % change Aug-22 Aug-21 % change Jul-22 % change
Sales 14 60 -76.7% 21 -33.3% 4 8 -50.0% 3 33.3% 4 6 -33.3% - -
New Listings 73 67 9.0% 83 -12.0% 7 6 16.7% 4 75.0% 11 1 1000.0% 9 22.2%
Active Listings 223 81 175.3% 224 -0.4% 21 14 50.0% 20 5.0% 30 5 500.0% 31 -3.2%
Benchmark Price 1,001,000
$ 990,600
$ 1.0% 1,073,600
$ -6.8% 704,700
$ 603,400
$ 16.8% 760,300
$ -7.3% 475,800
$ 380,200
$ 25.1% 494,600
$ -3.8%
Median Price 957,500
$ 927,500
$ 3.2% 960,000
$ -0.3% 443,750
$ 617,450
$ -28.1% 525,000
$ -15.5% 400,000
$ 362,500
$ 10.3% -
$ -
Average Price 995,369
$ 972,147
$ 2.4% 1,083,311
$ -8.1% 472,375
$ 582,975
$ -19.0% 531,666
$ -11.2% 468,475
$ 353,833
$ 32.4% -
$ -
Source: Fraser Valley Real Estate Board MLS® Summary Page 1 of 3
Detached Townhouse Apartment
White Rock / South Surrey Aug-22 Aug-21 % change Jul-22 % change Aug-22 Aug-21 % change Jul-22 % change Aug-22 Aug-21 % change Jul-22 % change
Sales 41 123 -66.7% 40 2.5% 55 72 -23.6% 44 25.0% 54 99 -45.5% 63 -14.3%
New Listings 97 143 -32.2% 105 -7.6% 59 65 -9.2% 101 -41.6% 91 87 4.6% 100 -9.0%
Active Listings 342 355 -3.7% 388 -11.9% 151 55 174.5% 194 -22.2% 194 141 37.6% 188 3.2%
Benchmark Price 1,954,000
$ 1,726,700
$ 13.2% 2,011,700
$ -2.9% 939,300
$ 830,700
$ 13.1% 961,000
$ -2.3% 609,900
$ 522,300
$ 16.8% 620,100
$ -1.6%
Median Price 1,715,000
$ 1,650,000
$ 3.9% 1,763,750
$ -2.8% 920,000
$ 855,000
$ 7.6% 937,450
$ -1.9% 563,500
$ 551,500
$ 2.2% 618,000
$ -8.8%
Average Price 2,105,065
$ 1,801,171
$ 16.9% 1,948,320
$ 8.0% 960,892
$ 893,540
$ 7.5% 1,031,713
$ -6.9% 632,318
$ 632,477
$ 0.0% 679,684
$ -7.0%
Detached Townhouse Apartment
Langley Aug-22 Aug-21 % change Jul-22 % change Aug-22 Aug-21 % change Jul-22 % change Aug-22 Aug-21 % change Jul-22 % change
Sales 66 125 -47.2% 59 11.9% 68 138 -50.7% 61 11.5% 64 161 -60.2% 91 -29.7%
New Listings 121 112 8.0% 150 -19.3% 107 127 -15.7% 137 -21.9% 121 138 -12.3% 141 -14.2%
Active Listings 353 137 157.7% 398 -11.3% 202 114 77.2% 250 -19.2% 238 199 19.6% 260 -8.5%
Benchmark Price 1,622,100
$ 1,487,200
$ 9.1% 1,721,300
$ -5.8% 888,900
$ 740,800
$ 20.0% 925,400
$ -3.9% 609,300
$ 511,000
$ 19.2% 622,500
$ -2.1%
Median Price 1,317,500
$ 1,335,000
$ -1.3% 1,400,000
$ -5.9% 790,000
$ 750,000
$ 5.3% 825,000
$ -4.2% 554,750
$ 500,000
$ 11.0% 550,000
$ 0.9%
Average Price 1,412,484
$ 1,611,829
$ -12.4% 1,489,804
$ -5.2% 786,760
$ 764,267
$ 2.9% 845,772
$ -7.0% 586,441
$ 520,118
$ 12.8% 573,426
$ 2.3%
Detached Townhouse Apartment
Delta - North Aug-22 Aug-21 % change Jul-22 % change Aug-22 Aug-21 % change Jul-22 % change Aug-22 Aug-21 % change Jul-22 % change
Sales 29 60 -51.7% 24 20.8% 11 4 175.0% 7 57.1% 6 17 -64.7% 6 0.0%
New Listings 33 38 -13.2% 41 -19.5% 9 6 50.0% 12 -25% 10 19 -47.4% 10 0.0%
Active Listings 109 78 39.7% 143 -23.8% 24 15 60.0% 38 -36.8% 22 28 -21.4% 23 -4.3%
Benchmark Price 1,345,700
$ 1,264,000
$ 6.5% 1,412,700
$ -4.7% 886,100
$ 793,400
$ 11.7% 942,000
$ -5.9% 567,000
$ 471,800
$ 20.2% 593,000
$ -4.4%
Median Price 1,255,000
$ 1,285,500
$ -2.4% 1,290,000
$ -2.7% 920,000
$ 917,500
$ 0.3% 934,000
$ -1.5% 624,500
$ 460,000
$ 35.8% 610,000
$ 2.4%
Average Price 1,295,413
$ 1,344,762
$ -3.7% 1,371,700
$ -5.6% 949,727
$ 918,750
$ 3.4% 873,142
$ 8.8% 627,344
$ 479,364
$ 30.9% 573,735
$ 9.3%
Source: Fraser Valley Real Estate Board MLS® Summary Page 2 of 3
Detached Townhouse Apartment
City of Surrey - Combined* Aug-22 Aug-21 % change Jul-22 % change Aug-22 Aug-21 % change Jul-22 % change Aug-22 Aug-21 % change Jul-22 % change
Sales 153 390 -60.8% 135 13.3% 166 301 -44.9% 137 21.2% 169 290 -41.7% 167 1.2%
Benchmark Price 1,655,900
$ 1,475,200
$ 12.2% 1,732,700
$ -4.4% 852,600
$ 749,000
$ 13.8% 884,400
$ -3.6% 533,100
$ 461,300
$ 15.6% 541,300
$ -1.5%
Average Price 1,636,086
$ 1,564,060
$ 4.6% 1,662,928
$ -1.6% 837,902
$ 749,588
$ 11.8% 876,585
$ -4.4% 539,597
$ 473,507
$ 14.0% 540,651
$ -0.2%
*North Surrey, Central Surrey, Cloverdale and South Surrey, excl. White Rock
Detached Townhouse Apartment
Surrey - Central Aug-22 Aug-21 % change Jul-22 % change Aug-22 Aug-21 % change Jul-22 % change Aug-22 Aug-21 % change Jul-22 % change
Sales 52 158 -67.1% 50 4.0% 64 152 -57.9% 56 14.3% 30 36 -16.7% 20 50.0%
New Listings 146 171 -14.6% 164 -11.0% 122 123 -0.8% 137 -10.9% 61 43 41.9% 49 24.5%
Active Listings 454 293 54.9% 495 -8.3% 337 190 77.4% 390 -13.6% 115 78 47.4% 113 1.8%
Benchmark Price 1,561,000
$ 1,396,200
$ 11.8% 1,642,100
$ -4.9% 832,700
$ 729,200
$ 14.2% 875,100
$ -4.8% 550,600
$ 453,600
$ 21.4% 569,300
$ -3.3%
Median Price 1,414,000
$ 1,454,500
$ -2.8% 1,603,500
$ -11.8% 785,000
$ 740,000
$ 6.1% 847,500
$ -7.4% 520,000
$ 427,500
$ 21.6% 525,000
$ -1.0%
Average Price 1,518,038
$ 1,496,999
$ 1.4% 1,706,074
$ -11.0% 785,539
$ 725,273
$ 8.3% 829,348
$ -5.3% 520,741
$ 447,395
$ 16.4% 512,060
$ 1.7%
Detached Townhouse Apartment
Surrey - Cloverdale Aug-22 Aug-21 % change Jul-22 % change Aug-22 Aug-21 % change Jul-22 % change Aug-22 Aug-21 % change Jul-22 % change
Sales 36 56 -35.7% 29 24.1% 28 42 -33.3% 33 -15.2% 15 27 -44.4% 11 36.4%
New Listings 58 40 45.0% 70 -17.1% 47 36 30.6% 66 -28.8% 22 19 15.8% 31 -29.0%
Active Listings 127 52 144.2% 148 -14.2% 94 32 193.8% 114 -17.5% 49 20 145.0% 56 -12.5%
Benchmark Price 1,501,100
$ 1,394,300
$ 7.7% 1,576,300
$ -4.8% 823,200
$ 739,800
$ 11.3% 853,300
$ -3.5% 574,300
$ 505,300
$ 13.7% 564,600
$ 1.7%
Median Price 1,265,000
$ 1,415,238
$ -10.6% 1,405,000
$ -10.0% 817,500
$ 720,000
$ 13.5% 795,000
$ 2.8% 503,000
$ 457,420
$ 10.0% 515,000
$ -2.3%
Average Price 1,356,463
$ 1,449,872
$ -6.4% 1,404,998
$ -3.5% 811,901
$ 699,197
$ 16.1% 798,648
$ 1.7% 493,966
$ 453,848
$ 8.8% 509,045
$ -3.0%
Detached Townhouse Apartment
Surrey - North Aug-22 Aug-21 % change Jul-22 % change Aug-22 Aug-21 % change Jul-22 % change Aug-22 Aug-21 % change Jul-22 % change
Sales 31 84 -63.1% 25 24.0% 23 38 -39.5% 7 228.6% 91 164 -44.5% 110 -17.3%
New Listings 73 107 -31.8% 95 -23.2% 30 40 -25.0% 49 -38.8% 139 186 -25.3% 156 -10.9%
Active Listings 276 240 15.0% 305 -9.5% 74 38 94.7% 89 -16.9% 324 310 4.5% 367 -11.7%
Benchmark Price 1,534,800
$ 1,365,400
$ 12.4% 1,635,900
$ -6.2% 770,200
$ 647,000
$ 19.0% 787,300
$ -2.2% 492,900
$ 425,800
$ 15.8% 499,100
$ -1.2%
Median Price 1,392,000
$ 1,390,000
$ 0.1% 1,425,000
$ -2.3% 680,000
$ 607,500
$ 11.9% 720,000
$ -5.6% 500,000
$ 427,500
$ 17.0% 530,000
$ -5.7%
Average Price 1,528,093
$ 1,529,745
$ -0.1% 1,549,952
$ -1.4% 743,699
$ 651,800
$ 14.1% 713,985
$ 4.2% 505,599
$ 448,238
$ 12.8% 538,205
$ -6.1%
Source: Fraser Valley Real Estate Board MLS® Summary Page 3 of 3
MLS® Home Price Index - Fraser Valley
August 2022
BENCHMARK INDEX ONE MONTH THREE MONTH SIX MONTH ONE YEAR THREE YEAR FIVE YEAR TEN YEAR
PRICE (HPI) % CHANGE % CHANGE % CHANGE % CHANGE % CHANGE % CHANGE % CHANGE
RESIDENTIAL LOWER MAINLAND 1,130,300 342.5 -3.0 -7.9 -6.9 8.7 39.3 19.6 92.2
COMBINED FRASER VALLEY BOARD 1,042,600 371.2 -4.5 -10.7 -11.2 11.1 54.2 40.6 134.9
NORTH DELTA 1,181,500 376.8 -5.1 -15.4 -16.8 7.0 44.4 38.0 138.3
NORTH SURREY 834,900 376.6 -4.3 -10.3 -11.0 10.4 53.3 38.6 131.2
SURREY 1,124,800 391.4 -5.0 -11.0 -12.0 12.2 56.8 49.6 154.3
CLOVERDALE 1,060,400 335.9 -3.7 -12.4 -16.1 9.3 50.4 42.0 137.1
SOUTH SURREY & WHITE ROCK 1,261,200 328.8 -2.6 -8.5 -6.6 13.4 52.7 27.2 94.0
LANGLEY 1,066,300 357.7 -4.7 -9.6 -7.3 12.0 49.8 39.0 146.5
ABBOTSFORD 856,300 384.2 -5.8 -11.2 -13.6 10.8 58.3 54.9 173.5
MISSION 936,700 367.3 -6.8 -15.2 -21.5 2.7 50.3 55.7 175.5
DETACHED LOWER MAINLAND 1,753,900 384.0 -3.4 -8.6 -8.3 8.8 44.7 24.9 106.0
FRASER VALLEY BOARD 1,513,500 427.4 -5.1 -11.6 -12.9 9.8 57.0 50.1 165.8
NORTH DELTA 1,345,700 404.4 -4.7 -15.3 -17.4 6.5 47.2 40.9 153.9
NORTH SURREY 1,534,800 471.8 -6.2 -10.5 -11.2 12.4 62.3 62.2 191.4
SURREY 1,561,000 445.1 -4.9 -11.0 -11.7 11.8 59.4 59.4 186.8
CLOVERDALE 1,501,100 413.0 -4.8 -13.6 -17.6 7.7 52.7 50.6 173.0
SOUTH SURREY & WHITE ROCK 1,954,000 375.4 -2.9 -8.4 -5.2 13.2 50.3 31.1 122.3
LANGLEY 1,622,100 427.3 -5.8 -11.8 -11.6 9.1 56.3 52.3 189.3
ABBOTSFORD 1,228,500 420.7 -6.5 -13.5 -19.1 5.5 55.3 59.8 191.3
MISSION 1,001,000 370.9 -6.8 -16.1 -23.8 1.1 49.1 55.0 178.5
TOWNHOUSE LOWER MAINLAND 957,000 362.1 -3.1 -7.2 -4.8 14.4 42.5 42.4 133.0
FRASER VALLEY BOARD 841,900 377.7 -3.9 -8.4 -6.5 16.1 50.2 58.4 162.1
NORTH DELTA 886,100 419.8 -5.9 -13.5 -13.1 11.7 36.2 36.1 137.0
NORTH SURREY 770,200 436.9 -2.2 -7.8 -5.0 19.1 45.2 56.2 193.2
SURREY 832,700 378.8 -4.9 -9.8 -12.0 14.2 48.2 56.9 163.8
CLOVERDALE 823,200 336.3 -3.5 -11.2 -14.0 11.3 44.5 49.3 157.1
SOUTH SURREY & WHITE ROCK 939,300 299.9 -2.3 -8.9 -10.4 13.1 45.9 44.6 107.4
LANGLEY 888,900 388.8 -4.0 -6.1 2.9 20.0 56.2 68.6 185.7
ABBOTSFORD 707,100 389.4 -5.3 -5.8 2.7 21.3 58.4 81.8 193.9
MISSION 704,700 360.8 -7.3 -7.5 5.2 16.8 55.7 71.7 174.0
APARTMENT LOWER MAINLAND 692,100 343.0 -2.0 -5.4 -2.5 10.6 26.9 25.1 106.8
FRASER VALLEY BOARD 542,000 438.2 -2.1 -6.8 -4.8 18.4 45.0 66.0 181.8
NORTH DELTA 567,000 542.6 -4.4 -11.5 -7.8 20.2 27.9 39.7 197.8
NORTH SURREY 492,900 444.1 -1.2 -7.6 -6.9 15.8 37.4 61.7 167.4
SURREY 550,600 495.1 -3.3 -11.0 -8.1 21.4 47.4 76.9 196.6
CLOVERDALE 574,300 414.4 1.7 -8.1 -10.1 13.7 36.6 47.1 165.8
SOUTH SURREY & WHITE ROCK 609,900 362.4 -1.6 -5.1 -2.0 16.8 38.7 55.9 156.1
LANGLEY 609,300 420.8 -2.1 -4.9 -3.3 19.2 49.3 70.5 188.4
ABBOTSFORD 451,800 469.6 -4.2 -7.9 -4.5 22.6 54.1 91.6 218.8
MISSION 475,800 427.5 -3.8 -2.6 8.3 25.2 52.5 100.5 219.8
© Fraser Valley Real Estate Board
All indices equal 100 in January, 2005. An index of 120 indicates a 20% increase in price since January, 2005.
Lower Mainland combines data across the Fraser Valley and Greater Vancouver real estate board areas.
Note: Benchmark prices and indices for July 2022 have been updated to reflect revised modeling.
0
2,000
4,000
6,000
8,000
10,000
12,000
14,000
2005
2006
2007
2008
2009
2010
2011
2012
2013
2014
2015
2016
2017
2018
2019
2020
2021
2022
Sales, Listings & Active Inventory, All Types, Fraser Valley
Actives Listings Sales
0
10
20
30
40
50
60
70
80
90
100
2005
2006
2007
2008
2009
2010
2011
2012
2013
2014
2015
2016
2017
2018
2019
2020
2021
2022
Ratio
Sales-to-Active Listings Ratio, All Types, Fraser Valley
According to BCREA, a balanced market in the Lower Mainland ranges between 12% - 20%
This graph includes all Residential and Commercial property types
Sellers
Market
Balanced
Market
Buyers
Market
August month-end: 17%
© Fraser Valley Real Estate Board
50
75
100
125
150
175
200
225
250
275
300
325
350
375
400
425
450
475
500
525 2005
2006
2007
2008
2009
2010
2011
2012
2013
2014
2015
2016
2017
2018
2019
2020
2021
2022
MLS® Home Price Index, Fraser Valley
Detached Townhouse Apartment
*Note: Benchmark prices and indices for July 2022 have been updated to reflected
revised modeling.
© Fraser Valley Real Estate Board
$100,000
$200,000
$300,000
$400,000
$500,000
$600,000
$700,000
$800,000
$900,000
$1,000,000
$1,100,000
$1,200,000
$1,300,000
$1,400,000
$1,500,000
$1,600,000
$1,700,000
$1,800,000
$1,900,000
2005
2006
2007
2008
2009
2010
2011
2012
2013
2014
2015
2016
2017
2018
2019
2020
2021
2022
MLS® Home Price Index Benchmark Prices, Fraser Valley
Detached Townhouse Apartment
© Fraser Valley Real Estate Board
*Note: Benchmark prices and indices for July 2022 have been updated to
reflected revised modeling.
$0
$200,000
$400,000
$600,000
$800,000
$1,000,000
$1,200,000
$1,400,000
$1,600,000
$1,800,000
$2,000,000
1979
1980
1981
1982
1983
1984
1985
1986
1987
1988
1989
1990
1991
1992
1993
1994
1995
1996
1997
1998
1999
2000
2001
2002
2003
2004
2005
2006
2007
2008
2009
2010
2011
2012
2013
2014
2015
2016
2017
2018
2019
2020
2021
2022
Average Price, Residential Detached, all Fraser Valley
© Fraser Valley Real Estate Board
$-
$200,000
$400,000
$600,000
$800,000
$1,000,000
$1,200,000
-
5,000
10,000
15,000
20,000
25,000
30,000
35,000
40,000
1990
1991
1992
1993
1994
1995
1996
1997
1998
1999
2000
2001
2002
2003
2004
2005
2006
2007
2008
2009
2010
2011
2012
2013
2014
2015
2016
2017
2018
2019
2020
2021
Annual Sales, New Listings, Average Price
All Property Types, Fraser Valley
Sales New Listings Average Price
© Fraser Valley Real Estate Board

FVREB August 2022 Statistics Package

  • 1.
    Fraser Valley RealEstate Board Monthly Statistics Package August 2022 Note: Benchmark prices and indices for July 2022 have been updated to reflect revised modeling.
  • 2.
    News Release Fraser ValleyReal Estate Board Contact lilian.choi@fvreb.bc.ca Lilian Choi, Communications Manager Telephone 604.930.7656 Fraser Valley Real Estate Board www.fvreb.bc.ca www.fvreb100.ca For Immediate Release: September 2, 2022 Fraser Valley housing market signals further settling as sales continue to stall in response to interest rate rises SURREY, BC – Robust active listings and relative steady sales activity continued to bring balance to the Fraser Valley real estate market in August. The past several months of rising inventory combined with a slowing trend in sales has also seen benchmark prices return to levels not seen since last year. In August, the Fraser Valley Real Estate Board (FVREB) processed 1,017 sales on its Multiple Listing Service® (MLS®), an increase of 2.4 per cent compared to last month and a 51.3 per cent decrease compared to this time last year. The Board received 2,045 new listings in August, a decrease of 14.3 per cent compared to July, and only 2.9 per cent less than August 2021. The month ended with a total active inventory of 5,871, a decrease of 8.5 per cent from last month but up by 44 percent compared to August 2021. Once again August saw a balanced market in the Fraser Valley with an overall sales-to-active ratio of 17 per cent (the market is considered balanced when the sales- to-active ratio is between 12 per cent and 20 per cent). “For the past three months we’ve seen the local market return to a more balanced state,” said Board President, Sandra Benz. “With the Fraser Valley continuing to settle after months of record sales and prices, we expect to see more activity this coming fall as buyers look to capitalize on the region’s reputation for providing greater value for the real estate dollar.” Benchmark prices continued to fall across all property categories, bringing them in relative line with prices from December 2021 and eating into year-over year gains. “With possible further hikes in interest rates this fall, homebuyers need to augment their decisions with critical advice and guidance,” said Baldev Gill, Board CEO. “Along with other professionals such as mortgage brokers and lawyers, Fraser Valley REALTORS® are a vital part of the team advising buyers and sellers on market realities and identifying potential opportunities that align with their objectives.” Across the Fraser Valley in August, the average number of days to sell a single-family detached home increased to 33 and for townhomes to 26 days. Apartments took, on average, 25 days to sell. MLS® HPI Benchmark Price Activity • Single Family Detached: At $1,513,500, the Benchmark price for an FVREB single-family detached home decreased 5.1 per cent compared to July 2022 and increased 9.8 per cent compared to August 2021. • Townhomes: At $841,900, the Benchmark price for an FVREB townhome decreased 3.9 per cent compared to July 2022 and increased 16.1 per cent compared to August 2021. • Apartments: At $542,000 the Benchmark price for an FVREB apartment/condo decreased 2.1 per cent compared to July 2022 and increased 18.4 per cent compared to August 2021. —30 — The Fraser Valley Real Estate Board is an association of 4,888 real estate professionals who live and work in the BC communities of Abbotsford, Langley, Mission, North Delta, Surrey, and White Rock.
  • 3.
    MLS® Summary -Fraser Valley August 2022 All Property Types All Property Types Grand Totals Aug-22 Aug-21 % change Jul-22 % change Grand Totals - year to date 2022 2021 % change Sales 1,017 2,087 -51.3% 993 2.4% Sales - year to date 11,943 20,122 -40.6% New Listings 2,045 2,107 -2.9% 2,385 -14.3% New Listings - year to date 25,476 27,725 -8.1% Active Listings 5,871 4,077 44.0% 6,413 -8.5% Average Price 959,608 $ 982,582 $ -2.3% 990,325 $ -3.1% Detached Townhouse Apartment All Areas Combined Aug-22 Aug-21 % change Jul-22 % change Aug-22 Aug-21 % change Jul-22 % change Aug-22 Aug-21 % change Jul-22 % change Sales 315 778 -59.5% 297 6.1% 282 510 -44.7% 234 20.5% 305 600 -49.2% 356 -14.3% New Listings 712 795 -10.4% 854 -16.6% 461 453 1.8% 572 -19.4% 554 585 -5.3% 600 -7.7% Active Listings 2,231 1,410 58.2% 2,475 -9.9% 1,092 544 100.7% 1,281 -14.8% 1,208 912 32.5% 1,278 -5.5% Benchmark Price 1,513,500 $ 1,378,000 $ 9.8% 1,594,500 $ -5.1% 841,900 $ 725,000 $ 16.1% 876,500 $ -3.9% 542,000 $ 457,900 $ 18.4% 553,400 $ -2.1% Median Price 1,330,000 $ 1,350,000 $ -1.5% 1,400,000 $ -5.0% 790,000 $ 733,750 $ 7.7% 838,750 $ -5.8% 514,900 $ 465,000 $ 10.7% 535,000 $ -3.8% Average Price 1,458,424 $ 1,465,764 $ -0.5% 1,495,176 $ -2.5% 810,038 $ 737,934 $ 9.8% 846,759 $ -4.3% 539,217 $ 489,738 $ 10.1% 556,003 $ -3.0% Detached Townhouse Apartment Abbotsford Aug-22 Aug-21 % change Jul-22 % change Aug-22 Aug-21 % change Jul-22 % change Aug-22 Aug-21 % change Jul-22 % change Sales 45 112 -59.8% 49 -8.2% 27 56 -51.8% 23 17.4% 40 90 -55.6% 55 -27.3% New Listings 105 117 -10.3% 144 -27.1% 80 50 60.0% 66 21.2% 99 92 7.6% 104 -4.8% Active Listings 340 174 95.4% 368 -7.6% 189 86 119.8% 184 2.7% 235 131 79.4% 237 -0.8% Benchmark Price 1,228,500 $ 1,164,700 $ 5.5% 1,313,700 $ -6.5% 707,100 $ 583,100 $ 21.3% 746,700 $ -5.3% 451,800 $ 368,600 $ 22.6% 471,700 $ -4.2% Median Price 1,100,000 $ 1,152,500 $ -4.6% 1,150,000 $ -4.3% 647,000 $ 605,000 $ 6.9% 670,000 $ -3.4% 424,950 $ 364,000 $ 16.7% 440,000 $ -3.4% Average Price 1,175,319 $ 1,179,556 $ -0.4% 1,178,944 $ -0.3% 638,799 $ 604,069 $ 5.7% 680,456 $ -6.1% 445,240 $ 392,728 $ 13.4% 444,536 $ 0.2% Detached Townhouse Apartment Mission Aug-22 Aug-21 % change Jul-22 % change Aug-22 Aug-21 % change Jul-22 % change Aug-22 Aug-21 % change Jul-22 % change Sales 14 60 -76.7% 21 -33.3% 4 8 -50.0% 3 33.3% 4 6 -33.3% - - New Listings 73 67 9.0% 83 -12.0% 7 6 16.7% 4 75.0% 11 1 1000.0% 9 22.2% Active Listings 223 81 175.3% 224 -0.4% 21 14 50.0% 20 5.0% 30 5 500.0% 31 -3.2% Benchmark Price 1,001,000 $ 990,600 $ 1.0% 1,073,600 $ -6.8% 704,700 $ 603,400 $ 16.8% 760,300 $ -7.3% 475,800 $ 380,200 $ 25.1% 494,600 $ -3.8% Median Price 957,500 $ 927,500 $ 3.2% 960,000 $ -0.3% 443,750 $ 617,450 $ -28.1% 525,000 $ -15.5% 400,000 $ 362,500 $ 10.3% - $ - Average Price 995,369 $ 972,147 $ 2.4% 1,083,311 $ -8.1% 472,375 $ 582,975 $ -19.0% 531,666 $ -11.2% 468,475 $ 353,833 $ 32.4% - $ - Source: Fraser Valley Real Estate Board MLS® Summary Page 1 of 3
  • 4.
    Detached Townhouse Apartment WhiteRock / South Surrey Aug-22 Aug-21 % change Jul-22 % change Aug-22 Aug-21 % change Jul-22 % change Aug-22 Aug-21 % change Jul-22 % change Sales 41 123 -66.7% 40 2.5% 55 72 -23.6% 44 25.0% 54 99 -45.5% 63 -14.3% New Listings 97 143 -32.2% 105 -7.6% 59 65 -9.2% 101 -41.6% 91 87 4.6% 100 -9.0% Active Listings 342 355 -3.7% 388 -11.9% 151 55 174.5% 194 -22.2% 194 141 37.6% 188 3.2% Benchmark Price 1,954,000 $ 1,726,700 $ 13.2% 2,011,700 $ -2.9% 939,300 $ 830,700 $ 13.1% 961,000 $ -2.3% 609,900 $ 522,300 $ 16.8% 620,100 $ -1.6% Median Price 1,715,000 $ 1,650,000 $ 3.9% 1,763,750 $ -2.8% 920,000 $ 855,000 $ 7.6% 937,450 $ -1.9% 563,500 $ 551,500 $ 2.2% 618,000 $ -8.8% Average Price 2,105,065 $ 1,801,171 $ 16.9% 1,948,320 $ 8.0% 960,892 $ 893,540 $ 7.5% 1,031,713 $ -6.9% 632,318 $ 632,477 $ 0.0% 679,684 $ -7.0% Detached Townhouse Apartment Langley Aug-22 Aug-21 % change Jul-22 % change Aug-22 Aug-21 % change Jul-22 % change Aug-22 Aug-21 % change Jul-22 % change Sales 66 125 -47.2% 59 11.9% 68 138 -50.7% 61 11.5% 64 161 -60.2% 91 -29.7% New Listings 121 112 8.0% 150 -19.3% 107 127 -15.7% 137 -21.9% 121 138 -12.3% 141 -14.2% Active Listings 353 137 157.7% 398 -11.3% 202 114 77.2% 250 -19.2% 238 199 19.6% 260 -8.5% Benchmark Price 1,622,100 $ 1,487,200 $ 9.1% 1,721,300 $ -5.8% 888,900 $ 740,800 $ 20.0% 925,400 $ -3.9% 609,300 $ 511,000 $ 19.2% 622,500 $ -2.1% Median Price 1,317,500 $ 1,335,000 $ -1.3% 1,400,000 $ -5.9% 790,000 $ 750,000 $ 5.3% 825,000 $ -4.2% 554,750 $ 500,000 $ 11.0% 550,000 $ 0.9% Average Price 1,412,484 $ 1,611,829 $ -12.4% 1,489,804 $ -5.2% 786,760 $ 764,267 $ 2.9% 845,772 $ -7.0% 586,441 $ 520,118 $ 12.8% 573,426 $ 2.3% Detached Townhouse Apartment Delta - North Aug-22 Aug-21 % change Jul-22 % change Aug-22 Aug-21 % change Jul-22 % change Aug-22 Aug-21 % change Jul-22 % change Sales 29 60 -51.7% 24 20.8% 11 4 175.0% 7 57.1% 6 17 -64.7% 6 0.0% New Listings 33 38 -13.2% 41 -19.5% 9 6 50.0% 12 -25% 10 19 -47.4% 10 0.0% Active Listings 109 78 39.7% 143 -23.8% 24 15 60.0% 38 -36.8% 22 28 -21.4% 23 -4.3% Benchmark Price 1,345,700 $ 1,264,000 $ 6.5% 1,412,700 $ -4.7% 886,100 $ 793,400 $ 11.7% 942,000 $ -5.9% 567,000 $ 471,800 $ 20.2% 593,000 $ -4.4% Median Price 1,255,000 $ 1,285,500 $ -2.4% 1,290,000 $ -2.7% 920,000 $ 917,500 $ 0.3% 934,000 $ -1.5% 624,500 $ 460,000 $ 35.8% 610,000 $ 2.4% Average Price 1,295,413 $ 1,344,762 $ -3.7% 1,371,700 $ -5.6% 949,727 $ 918,750 $ 3.4% 873,142 $ 8.8% 627,344 $ 479,364 $ 30.9% 573,735 $ 9.3% Source: Fraser Valley Real Estate Board MLS® Summary Page 2 of 3
  • 5.
    Detached Townhouse Apartment Cityof Surrey - Combined* Aug-22 Aug-21 % change Jul-22 % change Aug-22 Aug-21 % change Jul-22 % change Aug-22 Aug-21 % change Jul-22 % change Sales 153 390 -60.8% 135 13.3% 166 301 -44.9% 137 21.2% 169 290 -41.7% 167 1.2% Benchmark Price 1,655,900 $ 1,475,200 $ 12.2% 1,732,700 $ -4.4% 852,600 $ 749,000 $ 13.8% 884,400 $ -3.6% 533,100 $ 461,300 $ 15.6% 541,300 $ -1.5% Average Price 1,636,086 $ 1,564,060 $ 4.6% 1,662,928 $ -1.6% 837,902 $ 749,588 $ 11.8% 876,585 $ -4.4% 539,597 $ 473,507 $ 14.0% 540,651 $ -0.2% *North Surrey, Central Surrey, Cloverdale and South Surrey, excl. White Rock Detached Townhouse Apartment Surrey - Central Aug-22 Aug-21 % change Jul-22 % change Aug-22 Aug-21 % change Jul-22 % change Aug-22 Aug-21 % change Jul-22 % change Sales 52 158 -67.1% 50 4.0% 64 152 -57.9% 56 14.3% 30 36 -16.7% 20 50.0% New Listings 146 171 -14.6% 164 -11.0% 122 123 -0.8% 137 -10.9% 61 43 41.9% 49 24.5% Active Listings 454 293 54.9% 495 -8.3% 337 190 77.4% 390 -13.6% 115 78 47.4% 113 1.8% Benchmark Price 1,561,000 $ 1,396,200 $ 11.8% 1,642,100 $ -4.9% 832,700 $ 729,200 $ 14.2% 875,100 $ -4.8% 550,600 $ 453,600 $ 21.4% 569,300 $ -3.3% Median Price 1,414,000 $ 1,454,500 $ -2.8% 1,603,500 $ -11.8% 785,000 $ 740,000 $ 6.1% 847,500 $ -7.4% 520,000 $ 427,500 $ 21.6% 525,000 $ -1.0% Average Price 1,518,038 $ 1,496,999 $ 1.4% 1,706,074 $ -11.0% 785,539 $ 725,273 $ 8.3% 829,348 $ -5.3% 520,741 $ 447,395 $ 16.4% 512,060 $ 1.7% Detached Townhouse Apartment Surrey - Cloverdale Aug-22 Aug-21 % change Jul-22 % change Aug-22 Aug-21 % change Jul-22 % change Aug-22 Aug-21 % change Jul-22 % change Sales 36 56 -35.7% 29 24.1% 28 42 -33.3% 33 -15.2% 15 27 -44.4% 11 36.4% New Listings 58 40 45.0% 70 -17.1% 47 36 30.6% 66 -28.8% 22 19 15.8% 31 -29.0% Active Listings 127 52 144.2% 148 -14.2% 94 32 193.8% 114 -17.5% 49 20 145.0% 56 -12.5% Benchmark Price 1,501,100 $ 1,394,300 $ 7.7% 1,576,300 $ -4.8% 823,200 $ 739,800 $ 11.3% 853,300 $ -3.5% 574,300 $ 505,300 $ 13.7% 564,600 $ 1.7% Median Price 1,265,000 $ 1,415,238 $ -10.6% 1,405,000 $ -10.0% 817,500 $ 720,000 $ 13.5% 795,000 $ 2.8% 503,000 $ 457,420 $ 10.0% 515,000 $ -2.3% Average Price 1,356,463 $ 1,449,872 $ -6.4% 1,404,998 $ -3.5% 811,901 $ 699,197 $ 16.1% 798,648 $ 1.7% 493,966 $ 453,848 $ 8.8% 509,045 $ -3.0% Detached Townhouse Apartment Surrey - North Aug-22 Aug-21 % change Jul-22 % change Aug-22 Aug-21 % change Jul-22 % change Aug-22 Aug-21 % change Jul-22 % change Sales 31 84 -63.1% 25 24.0% 23 38 -39.5% 7 228.6% 91 164 -44.5% 110 -17.3% New Listings 73 107 -31.8% 95 -23.2% 30 40 -25.0% 49 -38.8% 139 186 -25.3% 156 -10.9% Active Listings 276 240 15.0% 305 -9.5% 74 38 94.7% 89 -16.9% 324 310 4.5% 367 -11.7% Benchmark Price 1,534,800 $ 1,365,400 $ 12.4% 1,635,900 $ -6.2% 770,200 $ 647,000 $ 19.0% 787,300 $ -2.2% 492,900 $ 425,800 $ 15.8% 499,100 $ -1.2% Median Price 1,392,000 $ 1,390,000 $ 0.1% 1,425,000 $ -2.3% 680,000 $ 607,500 $ 11.9% 720,000 $ -5.6% 500,000 $ 427,500 $ 17.0% 530,000 $ -5.7% Average Price 1,528,093 $ 1,529,745 $ -0.1% 1,549,952 $ -1.4% 743,699 $ 651,800 $ 14.1% 713,985 $ 4.2% 505,599 $ 448,238 $ 12.8% 538,205 $ -6.1% Source: Fraser Valley Real Estate Board MLS® Summary Page 3 of 3
  • 6.
    MLS® Home PriceIndex - Fraser Valley August 2022 BENCHMARK INDEX ONE MONTH THREE MONTH SIX MONTH ONE YEAR THREE YEAR FIVE YEAR TEN YEAR PRICE (HPI) % CHANGE % CHANGE % CHANGE % CHANGE % CHANGE % CHANGE % CHANGE RESIDENTIAL LOWER MAINLAND 1,130,300 342.5 -3.0 -7.9 -6.9 8.7 39.3 19.6 92.2 COMBINED FRASER VALLEY BOARD 1,042,600 371.2 -4.5 -10.7 -11.2 11.1 54.2 40.6 134.9 NORTH DELTA 1,181,500 376.8 -5.1 -15.4 -16.8 7.0 44.4 38.0 138.3 NORTH SURREY 834,900 376.6 -4.3 -10.3 -11.0 10.4 53.3 38.6 131.2 SURREY 1,124,800 391.4 -5.0 -11.0 -12.0 12.2 56.8 49.6 154.3 CLOVERDALE 1,060,400 335.9 -3.7 -12.4 -16.1 9.3 50.4 42.0 137.1 SOUTH SURREY & WHITE ROCK 1,261,200 328.8 -2.6 -8.5 -6.6 13.4 52.7 27.2 94.0 LANGLEY 1,066,300 357.7 -4.7 -9.6 -7.3 12.0 49.8 39.0 146.5 ABBOTSFORD 856,300 384.2 -5.8 -11.2 -13.6 10.8 58.3 54.9 173.5 MISSION 936,700 367.3 -6.8 -15.2 -21.5 2.7 50.3 55.7 175.5 DETACHED LOWER MAINLAND 1,753,900 384.0 -3.4 -8.6 -8.3 8.8 44.7 24.9 106.0 FRASER VALLEY BOARD 1,513,500 427.4 -5.1 -11.6 -12.9 9.8 57.0 50.1 165.8 NORTH DELTA 1,345,700 404.4 -4.7 -15.3 -17.4 6.5 47.2 40.9 153.9 NORTH SURREY 1,534,800 471.8 -6.2 -10.5 -11.2 12.4 62.3 62.2 191.4 SURREY 1,561,000 445.1 -4.9 -11.0 -11.7 11.8 59.4 59.4 186.8 CLOVERDALE 1,501,100 413.0 -4.8 -13.6 -17.6 7.7 52.7 50.6 173.0 SOUTH SURREY & WHITE ROCK 1,954,000 375.4 -2.9 -8.4 -5.2 13.2 50.3 31.1 122.3 LANGLEY 1,622,100 427.3 -5.8 -11.8 -11.6 9.1 56.3 52.3 189.3 ABBOTSFORD 1,228,500 420.7 -6.5 -13.5 -19.1 5.5 55.3 59.8 191.3 MISSION 1,001,000 370.9 -6.8 -16.1 -23.8 1.1 49.1 55.0 178.5 TOWNHOUSE LOWER MAINLAND 957,000 362.1 -3.1 -7.2 -4.8 14.4 42.5 42.4 133.0 FRASER VALLEY BOARD 841,900 377.7 -3.9 -8.4 -6.5 16.1 50.2 58.4 162.1 NORTH DELTA 886,100 419.8 -5.9 -13.5 -13.1 11.7 36.2 36.1 137.0 NORTH SURREY 770,200 436.9 -2.2 -7.8 -5.0 19.1 45.2 56.2 193.2 SURREY 832,700 378.8 -4.9 -9.8 -12.0 14.2 48.2 56.9 163.8 CLOVERDALE 823,200 336.3 -3.5 -11.2 -14.0 11.3 44.5 49.3 157.1 SOUTH SURREY & WHITE ROCK 939,300 299.9 -2.3 -8.9 -10.4 13.1 45.9 44.6 107.4 LANGLEY 888,900 388.8 -4.0 -6.1 2.9 20.0 56.2 68.6 185.7 ABBOTSFORD 707,100 389.4 -5.3 -5.8 2.7 21.3 58.4 81.8 193.9 MISSION 704,700 360.8 -7.3 -7.5 5.2 16.8 55.7 71.7 174.0 APARTMENT LOWER MAINLAND 692,100 343.0 -2.0 -5.4 -2.5 10.6 26.9 25.1 106.8 FRASER VALLEY BOARD 542,000 438.2 -2.1 -6.8 -4.8 18.4 45.0 66.0 181.8 NORTH DELTA 567,000 542.6 -4.4 -11.5 -7.8 20.2 27.9 39.7 197.8 NORTH SURREY 492,900 444.1 -1.2 -7.6 -6.9 15.8 37.4 61.7 167.4 SURREY 550,600 495.1 -3.3 -11.0 -8.1 21.4 47.4 76.9 196.6 CLOVERDALE 574,300 414.4 1.7 -8.1 -10.1 13.7 36.6 47.1 165.8 SOUTH SURREY & WHITE ROCK 609,900 362.4 -1.6 -5.1 -2.0 16.8 38.7 55.9 156.1 LANGLEY 609,300 420.8 -2.1 -4.9 -3.3 19.2 49.3 70.5 188.4 ABBOTSFORD 451,800 469.6 -4.2 -7.9 -4.5 22.6 54.1 91.6 218.8 MISSION 475,800 427.5 -3.8 -2.6 8.3 25.2 52.5 100.5 219.8 © Fraser Valley Real Estate Board All indices equal 100 in January, 2005. An index of 120 indicates a 20% increase in price since January, 2005. Lower Mainland combines data across the Fraser Valley and Greater Vancouver real estate board areas. Note: Benchmark prices and indices for July 2022 have been updated to reflect revised modeling.
  • 7.
  • 8.
    0 10 20 30 40 50 60 70 80 90 100 2005 2006 2007 2008 2009 2010 2011 2012 2013 2014 2015 2016 2017 2018 2019 2020 2021 2022 Ratio Sales-to-Active Listings Ratio,All Types, Fraser Valley According to BCREA, a balanced market in the Lower Mainland ranges between 12% - 20% This graph includes all Residential and Commercial property types Sellers Market Balanced Market Buyers Market August month-end: 17% © Fraser Valley Real Estate Board
  • 9.
    50 75 100 125 150 175 200 225 250 275 300 325 350 375 400 425 450 475 500 525 2005 2006 2007 2008 2009 2010 2011 2012 2013 2014 2015 2016 2017 2018 2019 2020 2021 2022 MLS® HomePrice Index, Fraser Valley Detached Townhouse Apartment *Note: Benchmark prices and indices for July 2022 have been updated to reflected revised modeling. © Fraser Valley Real Estate Board
  • 10.
    $100,000 $200,000 $300,000 $400,000 $500,000 $600,000 $700,000 $800,000 $900,000 $1,000,000 $1,100,000 $1,200,000 $1,300,000 $1,400,000 $1,500,000 $1,600,000 $1,700,000 $1,800,000 $1,900,000 2005 2006 2007 2008 2009 2010 2011 2012 2013 2014 2015 2016 2017 2018 2019 2020 2021 2022 MLS® Home PriceIndex Benchmark Prices, Fraser Valley Detached Townhouse Apartment © Fraser Valley Real Estate Board *Note: Benchmark prices and indices for July 2022 have been updated to reflected revised modeling.
  • 11.
  • 12.