Friday January 8
•Download as PPT, PDF•
1 like•561 views
This document discusses various types of graphs that can be used to visualize different types of data including: a histogram to show the frequency distribution, a frequency polygon drawn over a histogram, an ogive, a Pareto chart of blood type data, a time series graph, a pie chart of blood type data, and a stem-and-leaf plot of protein data columns.
Report
Share
Report
Share

Recommended
Drawing Frequency Histogram Polygon
The document describes the steps to create a frequency histogram polygon from a frequency table. It involves plotting the scores on the horizontal axis with equal intervals, plotting the frequencies on the vertical axis starting from 0 and increasing by the same interval up to the maximum frequency, placing dots in the middle of each histogram bar, and joining the dots with straight lines to form the polygon.
Boards March15 17
The document discusses the benefits of exercise for mental health. Regular physical activity can help reduce anxiety and depression and improve mood and cognitive functioning. Exercise causes chemical changes in the brain that may help protect against mental illness and improve symptoms.
March 3 Boards
This document discusses statistical tests for small sample sizes and compares means and proportions. It explains that for samples less than 30, the standard deviations must first be tested for equality before selecting the appropriate t-test to compare means. It also describes finding the average difference of paired samples and computing a weighted estimate of population proportion when comparing two proportions from small samples.
March 1 Boards
This document discusses statistical techniques for comparing two sample means, including calculating a confidence interval for the difference between two means to determine if they could be the same or different, and provides examples of how to perform these calculations and interpret the results.
February 24 Blackboards
This document provides examples of statistical hypothesis tests including small sample tests with unknown standard deviation, tests on proportions, chi-squared tests for standard deviation that can be one-tailed or two-tailed, examples of right-tailed and left-tailed tests for standard deviation, and an example of using a confidence interval to test a hypothesis. It includes examples of each type of test.
February 22 Blackboards
The document discusses hypothesis testing and outlines several key steps and concepts:
1) It introduces the concept of determining how likely the sample mean (X-bar) is if the null hypothesis that the sampling distribution is centered on a particular value (mu) is true.
2) It notes that either the null hypothesis or alternative hypothesis could be claimed and that the null is assumed true unless evidence suggests otherwise.
3) Examples are provided to illustrate the traditional method and P-value method of hypothesis testing and their steps.
4) It emphasizes that there is always a chance of making a Type 1 error in hypothesis testing and outlines strategies for one-tailed vs two-tailed tests.
February 17 Blackboards
The document discusses confidence intervals for means and proportions. It provides formulas for calculating confidence intervals for a mean when sample sizes are both larger and smaller than 30, and the population standard deviation is both known and unknown. It also provides the formula for calculating a confidence interval for a sample proportion when the sample size is large enough. Examples are given of finding confidence intervals for means, proportions, variances, and standard deviations. The margin of error is defined as half the width of the confidence interval.
February 3 Blackboards
This document introduces the concept of sampling distributions of sample means and provides examples of constructing these distributions. It demonstrates using normal distributions to approximate probabilities for sampling distributions and the binomial distribution when sample sizes are large. Notational errors are noted regarding using X-bar minus mu-sub-X-bar instead of mu-sub-X-bar minus mu in the calculation of z-scores for these distributions.
January 27 Boards
The document discusses the binomial distribution formula for calculating the probability of getting X heads out of n coin flips. It notes that X heads can occur in different orders, so the probabilities of each arrangement must be combined using combinations. The binomial distribution accounts for all possible arrangements of getting X heads out of n trials.
January 25 Boards
The document discusses a tree diagram showing the possible outcomes of flipping a coin 3 times and the probability distribution of heads. It also discusses statistics from a survey including the mean number of credit cards owned and standard deviation. Finally, it compares the expected values of two bonds, concluding that Bond X has a better expected value than Bond Y, making it the better investment given its risk and reward.
January 20 Blackboards
To pick a team of 3 people out of 5 in a particular order, we use the fundamental counting rule which states that the number of possible sequences is equal to the number of choices at each step multiplied together. In this case, for the first pick there are 5 options, for the second there are 4, and for the third there are 3, so by multiplying these together (5 * 4 * 3 = 60) there are 60 possible teams of 3 that can be selected from 5 people in a particular order.
January 18 Blackboards
The document discusses probability concepts like sample spaces, empirical probabilities, addition rules for mutually exclusive and non-mutually exclusive events. It provides examples using data on prison sentences, endangered species, and classical probability to illustrate computing probabilities for mutually exclusive events by addition and accounting for overlap when events are not mutually exclusive.
Jan13 Boards
Chebyshev's theorem states that at least 1-1/k^2 of data is within k standard deviations of the mean, no matter the distribution. The document discusses calculating z-scores, percentiles, standard deviation, and using a 5-number summary to create a boxplot comparing the variability in heights of the tallest buildings in New York and Hong Kong.
Monday January 11
This document discusses various statistical methods for analyzing paint data from two brands, including calculating the mean, median, mode, variance, and standard deviation using both the table method and shortcut method. It also discusses how the mean, median and mode differ for symmetric versus skewed distributions.
❼❷⓿❺❻❷❽❷❼❽ Dpboss Matka Result Satta Matka Guessing Satta Fix jodi Kalyan Fin...
❼❷⓿❺❻❷❽❷❼❽ Dpboss Matka Result Satta Matka Guessing Satta Fix jodi Kalyan Fin...❼❷⓿❺❻❷❽❷❼❽ Dpboss Kalyan Satta Matka Guessing Matka Result Main Bazar chart
❼❷⓿❺❻❷❽❷❼❽ Dpboss Matka Result Satta Matka Guessing Satta Fix jodi Kalyan Final ank Satta Matka Dpbos Final ank Satta Matta Matka 143 Kalyan Matka Guessing Final Matka Final ank Today Matka 420 Satta Batta Satta 143 Kalyan Chart Main Bazar Chart vip Matka Guessing Dpboss 143 Guessing Kalyan night NIMA2024 | De toegevoegde waarde van DEI en ESG in campagnes | Nathalie Lam |...
Nathalie zal delen hoe DEI en ESG een fundamentele rol kunnen spelen in je merkstrategie en je de juiste aansluiting kan creëren met je doelgroep. Door middel van voorbeelden en simpele handvatten toont ze hoe dit in jouw organisatie toegepast kan worden.
Industrial Tech SW: Category Renewal and Creation
Every industrial revolution has created a new set of categories and a new set of players.
Multiple new technologies have emerged, but Samsara and C3.ai are only two companies which have gone public so far.
Manufacturing startups constitute the largest pipeline share of unicorns and IPO candidates in the SF Bay Area, and software startups dominate in Germany.
Sustainable Logistics for Cost Reduction_ IPLTech Electric's Eco-Friendly Tra...
Sustainable Logistics for Cost Reduction_ IPLTech Electric's Eco-Friendly Transport Solution
The Genesis of BriansClub.cm Famous Dark WEb Platform
BriansClub.cm, a famous platform on the dark web, has become one of the most infamous carding marketplaces, specializing in the sale of stolen credit card data.
Best Competitive Marble Pricing in Dubai - ☎ 9928909666
Stone Art Hub offers the best competitive Marble Pricing in Dubai, ensuring affordability without compromising quality. With a wide range of exquisite marble options to choose from, you can enhance your spaces with elegance and sophistication. For inquiries or orders, contact us at ☎ 9928909666. Experience luxury at unbeatable prices.
欧洲杯赌球-欧洲杯赌球买球官方官网-欧洲杯赌球比赛投注官网|【网址🎉ac55.net🎉】
【网址🎉ac55.net🎉】欧洲杯赌球是世界上历史最悠久的博彩公司之一。其历史可以追溯到十九世纪末,确切时间是1886年。这家英国公司拥有超过15000名员工,是博彩行业规模最大的公司。欧洲杯赌球是英国最受欢迎的实体博彩公司之一,其排名仅次于欧洲杯赌球,旗下2800家投注站遍布全英国。
Business storytelling: key ingredients to a story
Storytelling is an incredibly valuable tool to share data and information. To get the most impact from stories there are a number of key ingredients. These are based on science and human nature. Using these elements in a story you can deliver information impactfully, ensure action and drive change.
Discover the Beauty and Functionality of The Expert Remodeling Service
Unlock your kitchen's true potential with expert remodeling services from O'Brien Group Inc. Transform your space into a functional, modern, and luxurious haven with their experienced professionals. From layout reconfiguration to high-end upgrades, they deliver stunning results tailored to your style and needs. Visit obriengroupinc.com to elevate your kitchen's beauty and functionality today.
More Related Content
More from yukondawn
March 1 Boards
This document discusses statistical techniques for comparing two sample means, including calculating a confidence interval for the difference between two means to determine if they could be the same or different, and provides examples of how to perform these calculations and interpret the results.
February 24 Blackboards
This document provides examples of statistical hypothesis tests including small sample tests with unknown standard deviation, tests on proportions, chi-squared tests for standard deviation that can be one-tailed or two-tailed, examples of right-tailed and left-tailed tests for standard deviation, and an example of using a confidence interval to test a hypothesis. It includes examples of each type of test.
February 22 Blackboards
The document discusses hypothesis testing and outlines several key steps and concepts:
1) It introduces the concept of determining how likely the sample mean (X-bar) is if the null hypothesis that the sampling distribution is centered on a particular value (mu) is true.
2) It notes that either the null hypothesis or alternative hypothesis could be claimed and that the null is assumed true unless evidence suggests otherwise.
3) Examples are provided to illustrate the traditional method and P-value method of hypothesis testing and their steps.
4) It emphasizes that there is always a chance of making a Type 1 error in hypothesis testing and outlines strategies for one-tailed vs two-tailed tests.
February 17 Blackboards
The document discusses confidence intervals for means and proportions. It provides formulas for calculating confidence intervals for a mean when sample sizes are both larger and smaller than 30, and the population standard deviation is both known and unknown. It also provides the formula for calculating a confidence interval for a sample proportion when the sample size is large enough. Examples are given of finding confidence intervals for means, proportions, variances, and standard deviations. The margin of error is defined as half the width of the confidence interval.
February 3 Blackboards
This document introduces the concept of sampling distributions of sample means and provides examples of constructing these distributions. It demonstrates using normal distributions to approximate probabilities for sampling distributions and the binomial distribution when sample sizes are large. Notational errors are noted regarding using X-bar minus mu-sub-X-bar instead of mu-sub-X-bar minus mu in the calculation of z-scores for these distributions.
January 27 Boards
The document discusses the binomial distribution formula for calculating the probability of getting X heads out of n coin flips. It notes that X heads can occur in different orders, so the probabilities of each arrangement must be combined using combinations. The binomial distribution accounts for all possible arrangements of getting X heads out of n trials.
January 25 Boards
The document discusses a tree diagram showing the possible outcomes of flipping a coin 3 times and the probability distribution of heads. It also discusses statistics from a survey including the mean number of credit cards owned and standard deviation. Finally, it compares the expected values of two bonds, concluding that Bond X has a better expected value than Bond Y, making it the better investment given its risk and reward.
January 20 Blackboards
To pick a team of 3 people out of 5 in a particular order, we use the fundamental counting rule which states that the number of possible sequences is equal to the number of choices at each step multiplied together. In this case, for the first pick there are 5 options, for the second there are 4, and for the third there are 3, so by multiplying these together (5 * 4 * 3 = 60) there are 60 possible teams of 3 that can be selected from 5 people in a particular order.
January 18 Blackboards
The document discusses probability concepts like sample spaces, empirical probabilities, addition rules for mutually exclusive and non-mutually exclusive events. It provides examples using data on prison sentences, endangered species, and classical probability to illustrate computing probabilities for mutually exclusive events by addition and accounting for overlap when events are not mutually exclusive.
Jan13 Boards
Chebyshev's theorem states that at least 1-1/k^2 of data is within k standard deviations of the mean, no matter the distribution. The document discusses calculating z-scores, percentiles, standard deviation, and using a 5-number summary to create a boxplot comparing the variability in heights of the tallest buildings in New York and Hong Kong.
Monday January 11
This document discusses various statistical methods for analyzing paint data from two brands, including calculating the mean, median, mode, variance, and standard deviation using both the table method and shortcut method. It also discusses how the mean, median and mode differ for symmetric versus skewed distributions.
More from yukondawn (11)
Recently uploaded
❼❷⓿❺❻❷❽❷❼❽ Dpboss Matka Result Satta Matka Guessing Satta Fix jodi Kalyan Fin...
❼❷⓿❺❻❷❽❷❼❽ Dpboss Matka Result Satta Matka Guessing Satta Fix jodi Kalyan Fin...❼❷⓿❺❻❷❽❷❼❽ Dpboss Kalyan Satta Matka Guessing Matka Result Main Bazar chart
❼❷⓿❺❻❷❽❷❼❽ Dpboss Matka Result Satta Matka Guessing Satta Fix jodi Kalyan Final ank Satta Matka Dpbos Final ank Satta Matta Matka 143 Kalyan Matka Guessing Final Matka Final ank Today Matka 420 Satta Batta Satta 143 Kalyan Chart Main Bazar Chart vip Matka Guessing Dpboss 143 Guessing Kalyan night NIMA2024 | De toegevoegde waarde van DEI en ESG in campagnes | Nathalie Lam |...
Nathalie zal delen hoe DEI en ESG een fundamentele rol kunnen spelen in je merkstrategie en je de juiste aansluiting kan creëren met je doelgroep. Door middel van voorbeelden en simpele handvatten toont ze hoe dit in jouw organisatie toegepast kan worden.
Industrial Tech SW: Category Renewal and Creation
Every industrial revolution has created a new set of categories and a new set of players.
Multiple new technologies have emerged, but Samsara and C3.ai are only two companies which have gone public so far.
Manufacturing startups constitute the largest pipeline share of unicorns and IPO candidates in the SF Bay Area, and software startups dominate in Germany.
Sustainable Logistics for Cost Reduction_ IPLTech Electric's Eco-Friendly Tra...
Sustainable Logistics for Cost Reduction_ IPLTech Electric's Eco-Friendly Transport Solution
The Genesis of BriansClub.cm Famous Dark WEb Platform
BriansClub.cm, a famous platform on the dark web, has become one of the most infamous carding marketplaces, specializing in the sale of stolen credit card data.
Best Competitive Marble Pricing in Dubai - ☎ 9928909666
Stone Art Hub offers the best competitive Marble Pricing in Dubai, ensuring affordability without compromising quality. With a wide range of exquisite marble options to choose from, you can enhance your spaces with elegance and sophistication. For inquiries or orders, contact us at ☎ 9928909666. Experience luxury at unbeatable prices.
欧洲杯赌球-欧洲杯赌球买球官方官网-欧洲杯赌球比赛投注官网|【网址🎉ac55.net🎉】
【网址🎉ac55.net🎉】欧洲杯赌球是世界上历史最悠久的博彩公司之一。其历史可以追溯到十九世纪末,确切时间是1886年。这家英国公司拥有超过15000名员工,是博彩行业规模最大的公司。欧洲杯赌球是英国最受欢迎的实体博彩公司之一,其排名仅次于欧洲杯赌球,旗下2800家投注站遍布全英国。
Business storytelling: key ingredients to a story
Storytelling is an incredibly valuable tool to share data and information. To get the most impact from stories there are a number of key ingredients. These are based on science and human nature. Using these elements in a story you can deliver information impactfully, ensure action and drive change.
Discover the Beauty and Functionality of The Expert Remodeling Service
Unlock your kitchen's true potential with expert remodeling services from O'Brien Group Inc. Transform your space into a functional, modern, and luxurious haven with their experienced professionals. From layout reconfiguration to high-end upgrades, they deliver stunning results tailored to your style and needs. Visit obriengroupinc.com to elevate your kitchen's beauty and functionality today.
The Steadfast and Reliable Bull: Taurus Zodiac Sign
Explore the steadfast and reliable nature of the Taurus Zodiac Sign. Discover the personality traits, key dates, and horoscope insights that define the determined and practical Taurus, and learn how their grounded nature makes them the anchor of the zodiac.
Cover Story - China's Investment Leader - Dr. Alyce SU
In World Expo 2010 Shanghai – the most visited Expo in the World History
https://www.britannica.com/event/Expo-Shanghai-2010
China’s official organizer of the Expo, CCPIT (China Council for the Promotion of International Trade https://en.ccpit.org/) has chosen Dr. Alyce Su as the Cover Person with Cover Story, in the Expo’s official magazine distributed throughout the Expo, showcasing China’s New Generation of Leaders to the World.
Kirill Klip GEM Royalty TNR Gold Copper Presentation
Tesla Energy rEVolution And The Golden Age For Copper: Kirill Klip GEM Royalty TNR Gold Copper Presentation
AI Transformation Playbook: Thinking AI-First for Your Business
I dive into how businesses can stay competitive by integrating AI into their core processes. From identifying the right approach to building collaborative teams and recognizing common pitfalls, this guide has got you covered. AI transformation is a journey, and this playbook is here to help you navigate it successfully.
Digital Transformation Frameworks: Driving Digital Excellence
[To download this presentation, visit:
https://www.oeconsulting.com.sg/training-presentations]
This presentation is a curated compilation of PowerPoint diagrams and templates designed to illustrate 20 different digital transformation frameworks and models. These frameworks are based on recent industry trends and best practices, ensuring that the content remains relevant and up-to-date.
Key highlights include Microsoft's Digital Transformation Framework, which focuses on driving innovation and efficiency, and McKinsey's Ten Guiding Principles, which provide strategic insights for successful digital transformation. Additionally, Forrester's framework emphasizes enhancing customer experiences and modernizing IT infrastructure, while IDC's MaturityScape helps assess and develop organizational digital maturity. MIT's framework explores cutting-edge strategies for achieving digital success.
These materials are perfect for enhancing your business or classroom presentations, offering visual aids to supplement your insights. Please note that while comprehensive, these slides are intended as supplementary resources and may not be complete for standalone instructional purposes.
Frameworks/Models included:
Microsoft’s Digital Transformation Framework
McKinsey’s Ten Guiding Principles of Digital Transformation
Forrester’s Digital Transformation Framework
IDC’s Digital Transformation MaturityScape
MIT’s Digital Transformation Framework
Gartner’s Digital Transformation Framework
Accenture’s Digital Strategy & Enterprise Frameworks
Deloitte’s Digital Industrial Transformation Framework
Capgemini’s Digital Transformation Framework
PwC’s Digital Transformation Framework
Cisco’s Digital Transformation Framework
Cognizant’s Digital Transformation Framework
DXC Technology’s Digital Transformation Framework
The BCG Strategy Palette
McKinsey’s Digital Transformation Framework
Digital Transformation Compass
Four Levels of Digital Maturity
Design Thinking Framework
Business Model Canvas
Customer Journey Map
Kirill Klip GEM Royalty TNR Gold Lithium Presentation
Lithium Will Power Us For The Next 50 Years And Then Robots: Kirill Klip GEM Royalty TNR Gold Lithium Presentation
The latest Heat Pump Manual from Newentide
𝐔𝐧𝐯𝐞𝐢𝐥 𝐭𝐡𝐞 𝐅𝐮𝐭𝐮𝐫𝐞 𝐨𝐟 𝐄𝐧𝐞𝐫𝐠𝐲 𝐄𝐟𝐟𝐢𝐜𝐢𝐞𝐧𝐜𝐲 𝐰𝐢𝐭𝐡 𝐍𝐄𝐖𝐍𝐓𝐈𝐃𝐄’𝐬 𝐋𝐚𝐭𝐞𝐬𝐭 𝐎𝐟𝐟𝐞𝐫𝐢𝐧𝐠𝐬
Explore the details in our newly released product manual, which showcases NEWNTIDE's advanced heat pump technologies. Delve into our energy-efficient and eco-friendly solutions tailored for diverse global markets.
PM Surya Ghar Muft Bijli Yojana: Online Application, Eligibility, Subsidies &...
PM Surya Ghar Muft Bijli Yojana: Online Application, Eligibility, Subsidies &...Ksquare Energy Pvt. Ltd.
During the budget session of 2024-25, the finance minister, Nirmala Sitharaman, introduced the “solar Rooftop scheme,” also known as “PM Surya Ghar Muft Bijli Yojana.” It is a subsidy offered to those who wish to put up solar panels in their homes using domestic power systems. Additionally, adopting photovoltaic technology at home allows you to lower your monthly electricity expenses. Today in this blog we will talk all about what is the PM Surya Ghar Muft Bijli Yojana. How does it work? Who is eligible for this yojana and all the other things related to this scheme?Recently uploaded (20)
❼❷⓿❺❻❷❽❷❼❽ Dpboss Matka Result Satta Matka Guessing Satta Fix jodi Kalyan Fin...
❼❷⓿❺❻❷❽❷❼❽ Dpboss Matka Result Satta Matka Guessing Satta Fix jodi Kalyan Fin...
NIMA2024 | De toegevoegde waarde van DEI en ESG in campagnes | Nathalie Lam |...
NIMA2024 | De toegevoegde waarde van DEI en ESG in campagnes | Nathalie Lam |...
Sustainable Logistics for Cost Reduction_ IPLTech Electric's Eco-Friendly Tra...
Sustainable Logistics for Cost Reduction_ IPLTech Electric's Eco-Friendly Tra...
The Genesis of BriansClub.cm Famous Dark WEb Platform
The Genesis of BriansClub.cm Famous Dark WEb Platform
Best Competitive Marble Pricing in Dubai - ☎ 9928909666
Best Competitive Marble Pricing in Dubai - ☎ 9928909666
Discover the Beauty and Functionality of The Expert Remodeling Service
Discover the Beauty and Functionality of The Expert Remodeling Service
The Steadfast and Reliable Bull: Taurus Zodiac Sign
The Steadfast and Reliable Bull: Taurus Zodiac Sign
Cover Story - China's Investment Leader - Dr. Alyce SU
Cover Story - China's Investment Leader - Dr. Alyce SU
Kirill Klip GEM Royalty TNR Gold Copper Presentation
Kirill Klip GEM Royalty TNR Gold Copper Presentation
AI Transformation Playbook: Thinking AI-First for Your Business
AI Transformation Playbook: Thinking AI-First for Your Business
Digital Transformation Frameworks: Driving Digital Excellence
Digital Transformation Frameworks: Driving Digital Excellence
Kirill Klip GEM Royalty TNR Gold Lithium Presentation
Kirill Klip GEM Royalty TNR Gold Lithium Presentation
PM Surya Ghar Muft Bijli Yojana: Online Application, Eligibility, Subsidies &...
PM Surya Ghar Muft Bijli Yojana: Online Application, Eligibility, Subsidies &...
Friday January 8
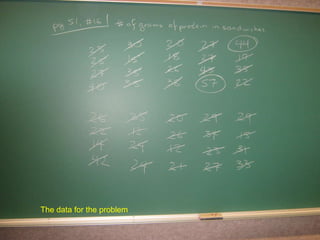
- 1. The data for the problem
- 3. Histogram
- 4. Frequency polygon (drawn over top of histogram)
- 5. Ogive
- 6. Pareto chart of blood type data
- 8. Pie chart of the blood type data
- 9. Stem-and-leaf plot of the first two columns of the protein data