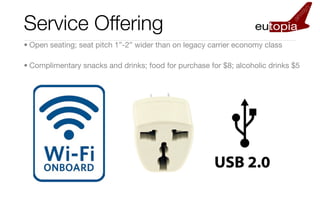
1. Service Offering
• Open seating; seat pitch 1”-2” wider than on legacy carrier economy class
• Complimentary snacks and drinks; food for purchase for $8; alcoholic drinks $5
2. Value Proposition for the Customer
Current State:
High Prices
Not-customer service focused
Future State:
Affordable Prices
Superior Customer Service
3. Market Size
2.2 millions
passengers fly 1.8 billion dollar
x $800 average fare =
New York to market
London each year
Industry average 80% load factors
3.4% market share will yield 60% load factors for FlyEutopia
Transatlantic traffic projected to
increase 4.6% per year until 2018
4. Competitors
Current: Legacy Airlines Potential Entrant: Ryan Atlantic
• Not focused on customer • Not focused on customer
service or low fares service
• High cost per available seat • Not flying major route
mile (CASM)
• Bad public perception
• No fleet commonality
FlyEutopia’s Competitive Advantages:
-super customer service and affordable fares
-flying main routes
-low-cost business model
5. Marketing Strategy
Locally Targeted Media Campaign
Focus on:
Online Ads on travel website
Viral Marketing
Billboards
Television
6. Sales Strategy
• Tickets sold by direct sale only, maximizing profit.
• Tickets may be purchased through:
• On our website
• By 800 number
• Through codeshare agreements
• Aggregator search engines
7. Product Strategy
In year three, service will be inaugurated to Paris
In year four, service will commence to Frankfurt
Expansion is possible to other European destinations:
Rome
Madrid
Zurich
Amsterdam
As well as from other Eastern US cities:
Boston
Washington
8. Important Assumptions
• Eutopia will have passenger load factors averaging 60% the first year, increasing
thereafter by 4.6% per year to industry average of 83.5%
• Average air cargo load factors will be 40% the first year, increasing thereafter to
industry average of 60%
• We will operate two roundtrip flight a day, 365 days per year to London, expanding
to Paris in year five
• Average ticket price will be $400
• 10% of passengers will buy an $5 drink; 25% of passengers will buy $8 of food
• The cost to lease a 787-300 is $320,000 per month
• The cost to rent airport space is $28 million annually
9. Table of Sales, Gross Margin, and Net Profit
Year 1 Year 2 Year 3 Year 4 Year 5
Sales $141,136,732 $153,687,173 $279,617,692 $420,929,130 $578,614,491
Gross Margin $9,967,587 $15,991,828 $39,221,197 $69,148,623 $106,694,544
Net Income -$15,914,893 -$7,084,889 $3,859,036 $19,054,900 $37,633,116
10. S.W.O.T. Analysis
Strengths Weaknesses
• low cost airline, gap in marketplace, • small airline, no brand name, no liquidity,
excellent customer service, fly popular limited destinations
routes, single-class seating
arrangement US-EU open skies
agreement
Threats
Opportunities
• legacy carriers, new low cost entrants
• codeshare agreements, expansion to RyanAtlantic, gas prices, perception
other destinations that low-cost is bad