The document provides an overview of Ricoh Leasing Company's financial results for the 2022 fiscal year (FY2021). Key points include:
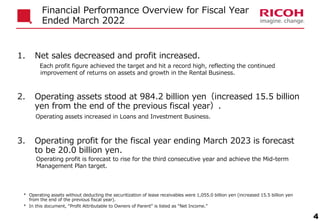
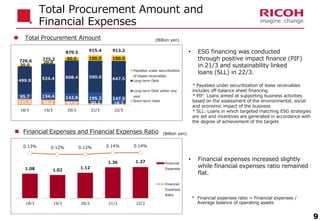
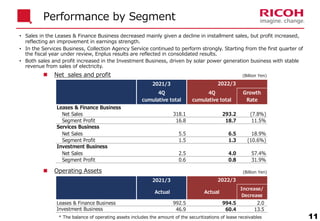
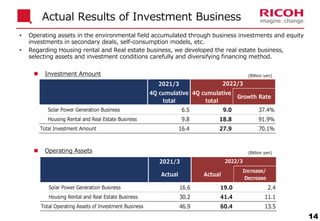
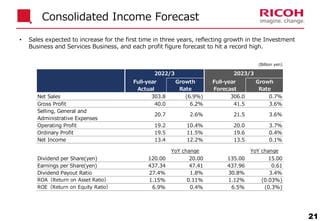
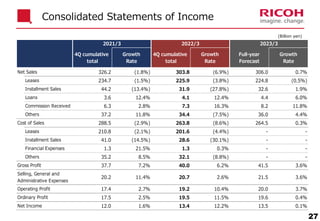
1. Net sales decreased but profit increased, hitting record highs due to continued improvement in returns on assets and rental business growth.
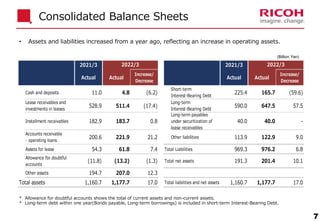
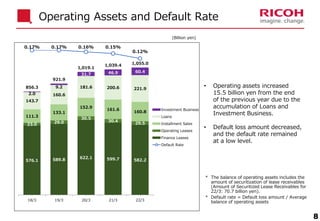
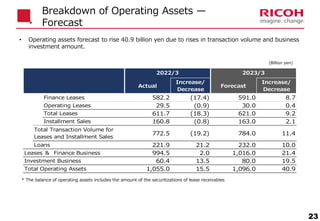
2. Operating assets increased to 984.2 billion yen due to growth in loans and investment businesses.
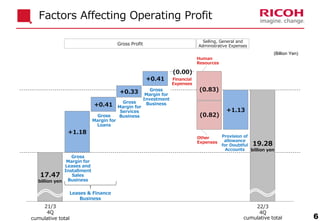
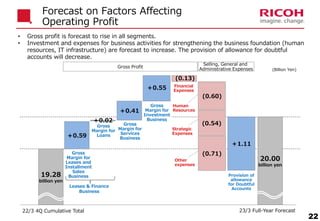
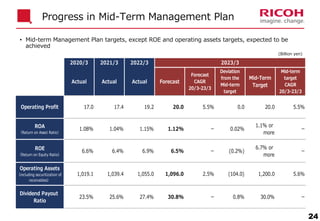
3. Operating profit for FY2023 is forecast to be 20 billion yen, rising for the third consecutive year and achieving management plan targets.

![Enhance-
ment of
organiza-
tional
strength
Business
growth
Mid-
term
Manage-
ment
Plan
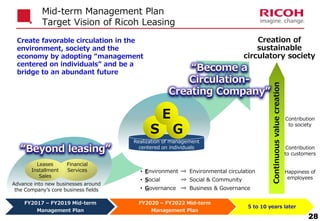
Business domains
Promotion of
Sustainability
Management
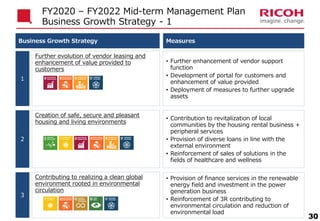
Contributing to realizing a clean
global environment rooted in
environmental circulation
Creation of safe, secure and
pleasant housing and living
environments
Further evolution of vendor
leasing and enhancement of
value provided to customers
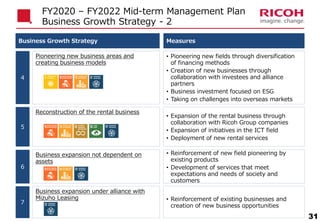
Reconstruction of the rental
business
Contributing to reasonable
environmental circulation and
restoration
Contributing to the creation of
rich and vigorous communities
Contributing to economic
activities — work, commerce,
manufacturing
[G] Business & Governance
[S] Social & Community
[E] Environmental circulation
Execution of SDGs commitment to realize CSV
Pioneering new business areas and creating business models
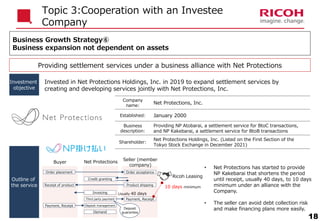
Business expansion not dependent on assets
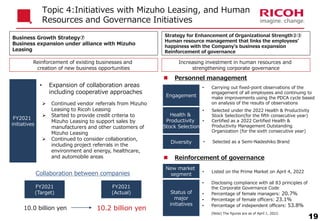
Business expansion under alliance with Mizuho Leasing
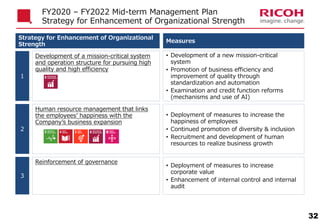
Development of a mission-critical
system and operation structure for
pursuing high quality and high
efficiency
Human resource management that
links the employees’ happiness with
the Company’s business expansion
Reinforcement of
governance
FY2020 – FY2022 Mid-term Management Plan
Scheme to Realize the Target Vision
29](https://image.slidesharecdn.com/financialhighlightsfy20214q-220520043149-5f14e65a/85/Financial_Highlights_FY20214Q-pdf-29-320.jpg)