Downloaded 2,009 times


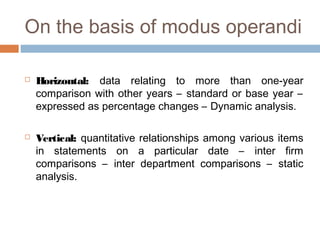
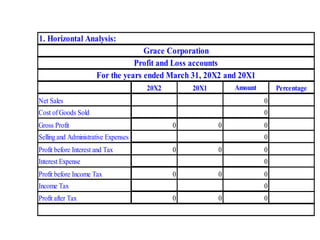
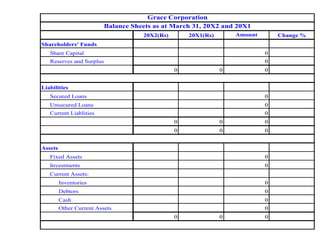
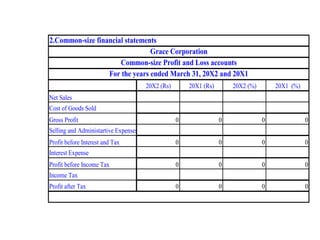
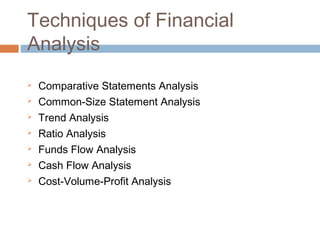
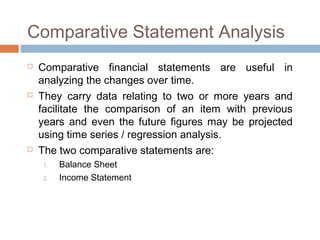
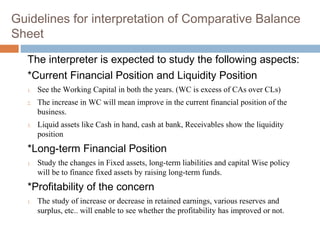
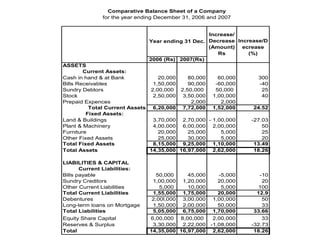
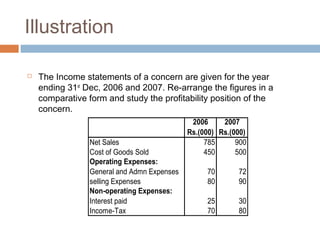
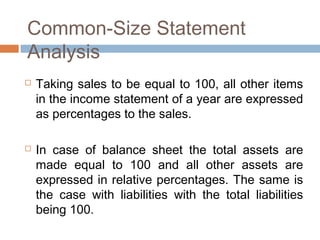
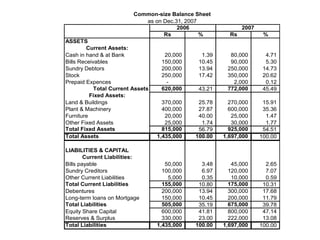
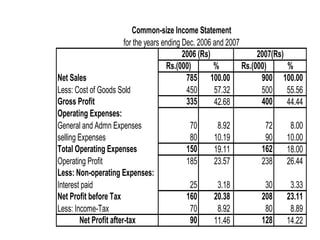
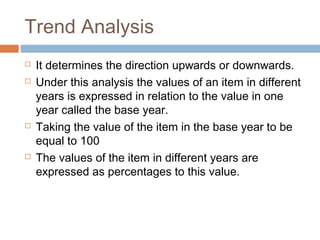
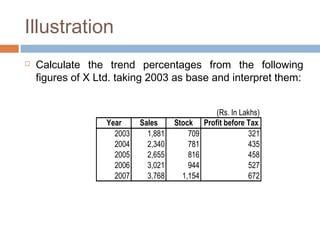
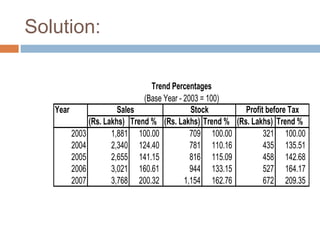
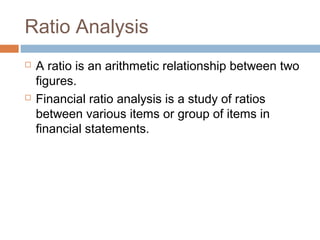
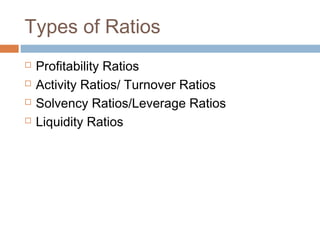
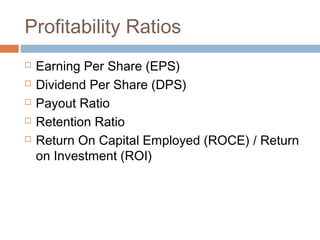

The document provides an overview of financial statement analysis. It discusses that financial analysis identifies the financial strengths and weaknesses of a firm by establishing relationships between balance sheet and profit/loss statement items. The key objectives of financial analysis are to evaluate a firm's profitability, debt servicing ability, business risk, and growth. Various techniques of financial analysis are also outlined, including comparative statements analysis, common-size analysis, trend analysis, and ratio analysis. The document aims to explain the concepts and applications of financial statement analysis.