Download as PDF, PPTX

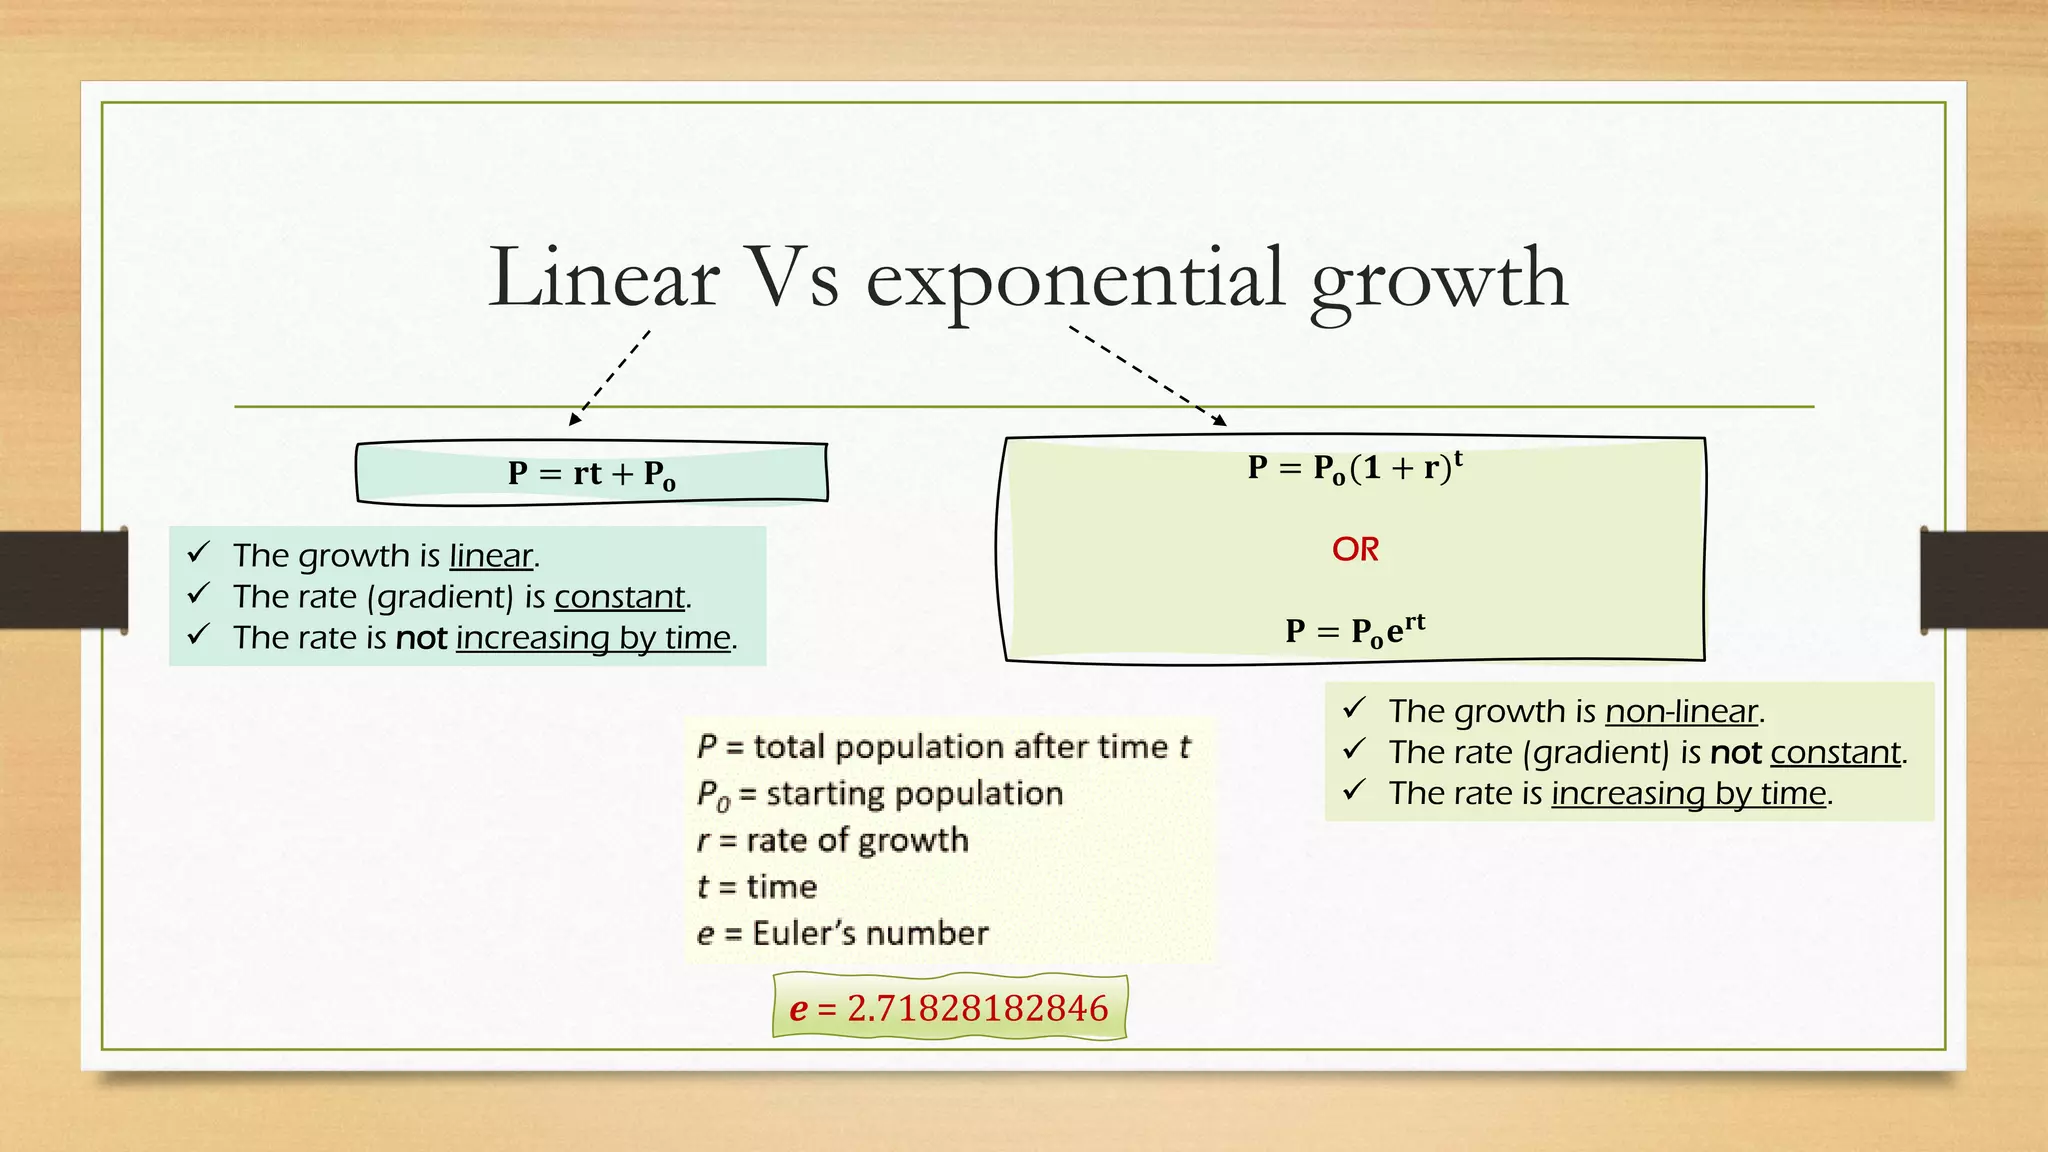
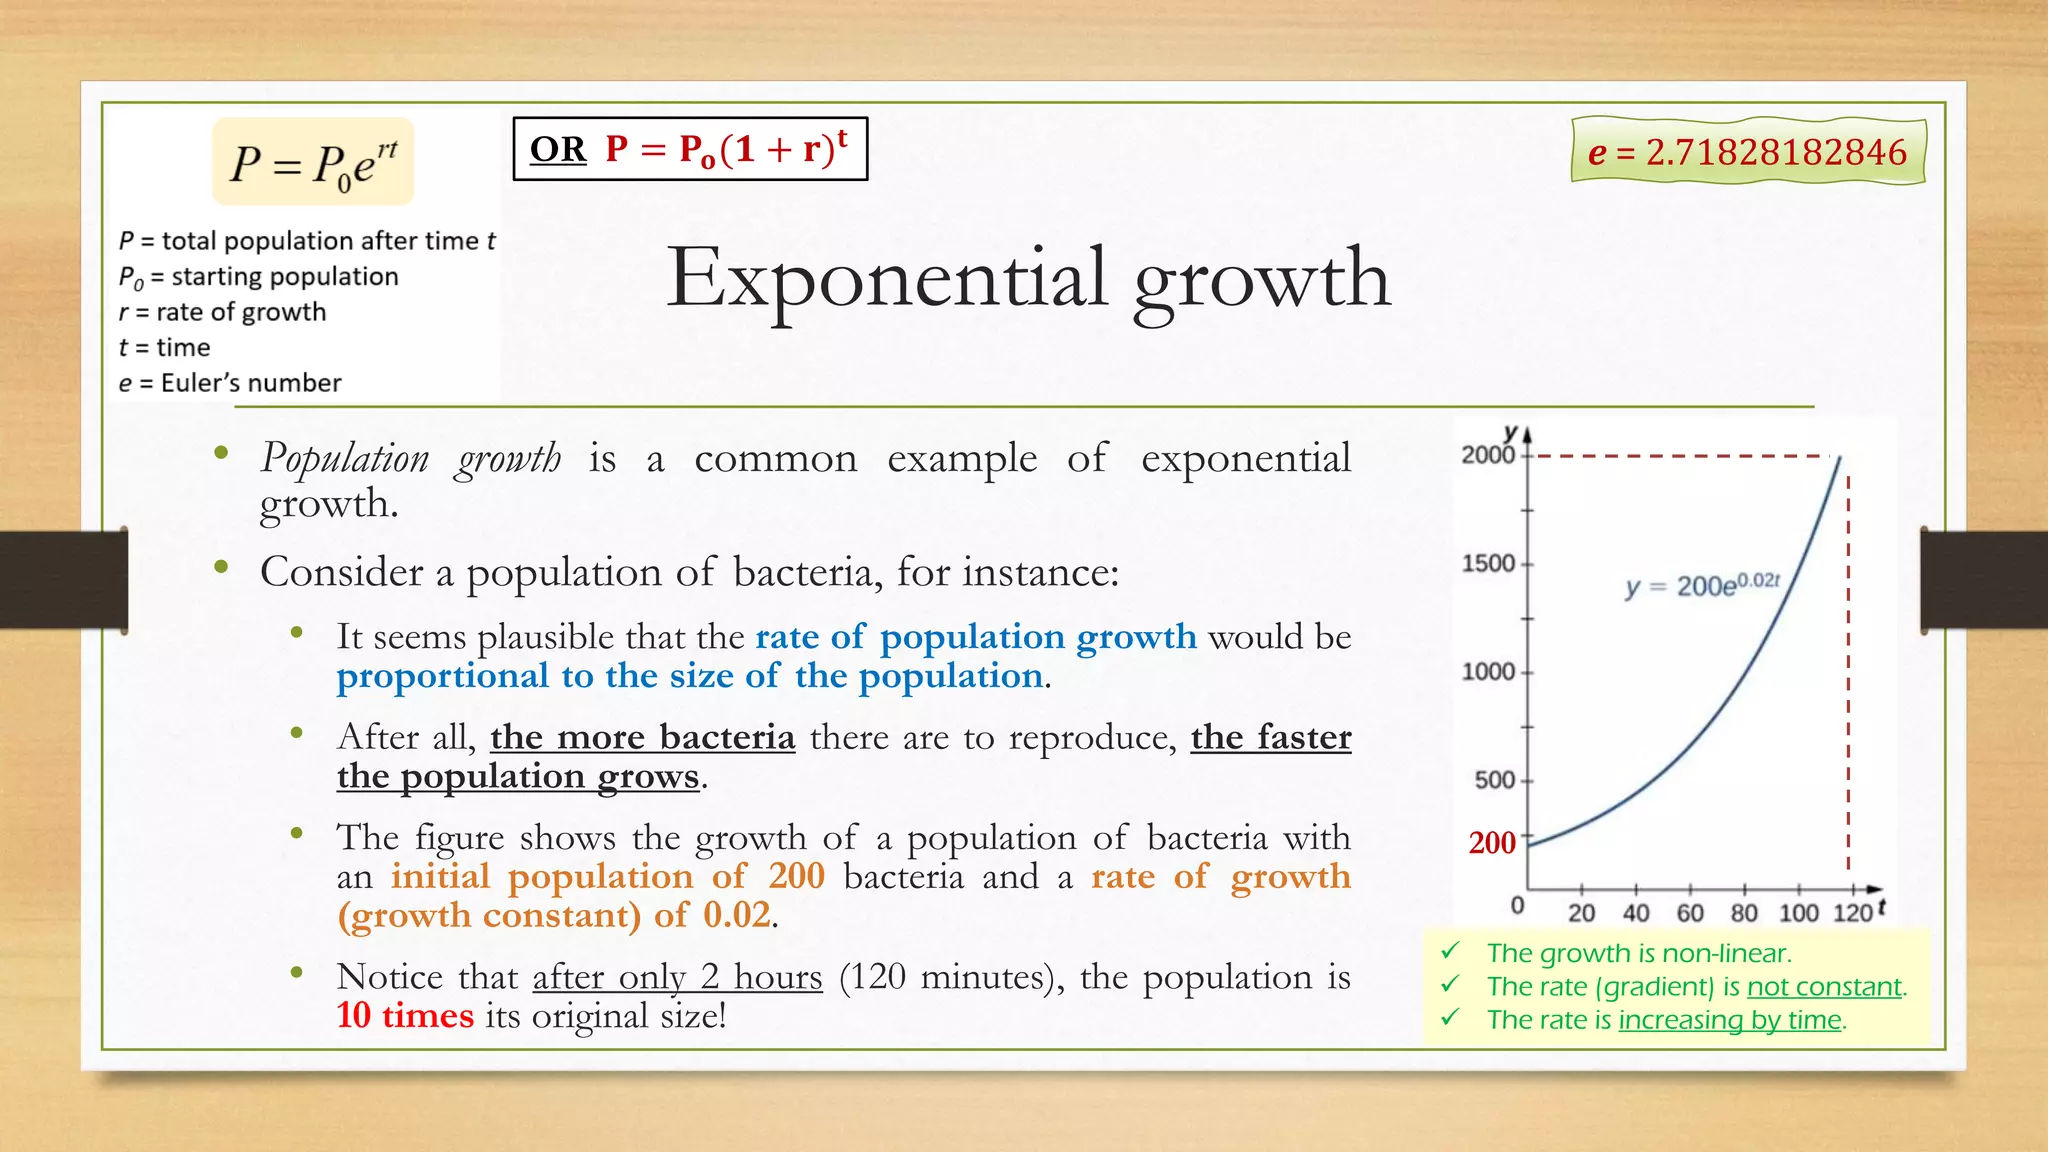


The document discusses the differences between linear and exponential growth, emphasizing that exponential growth features a non-constant rate that increases over time. It uses the population growth of bacteria and the 2009 H1N1 flu outbreak in Japan as case studies to illustrate these concepts and includes equations for calculating growth rates. The text concludes with a comparison of predictive models based on average error rates.