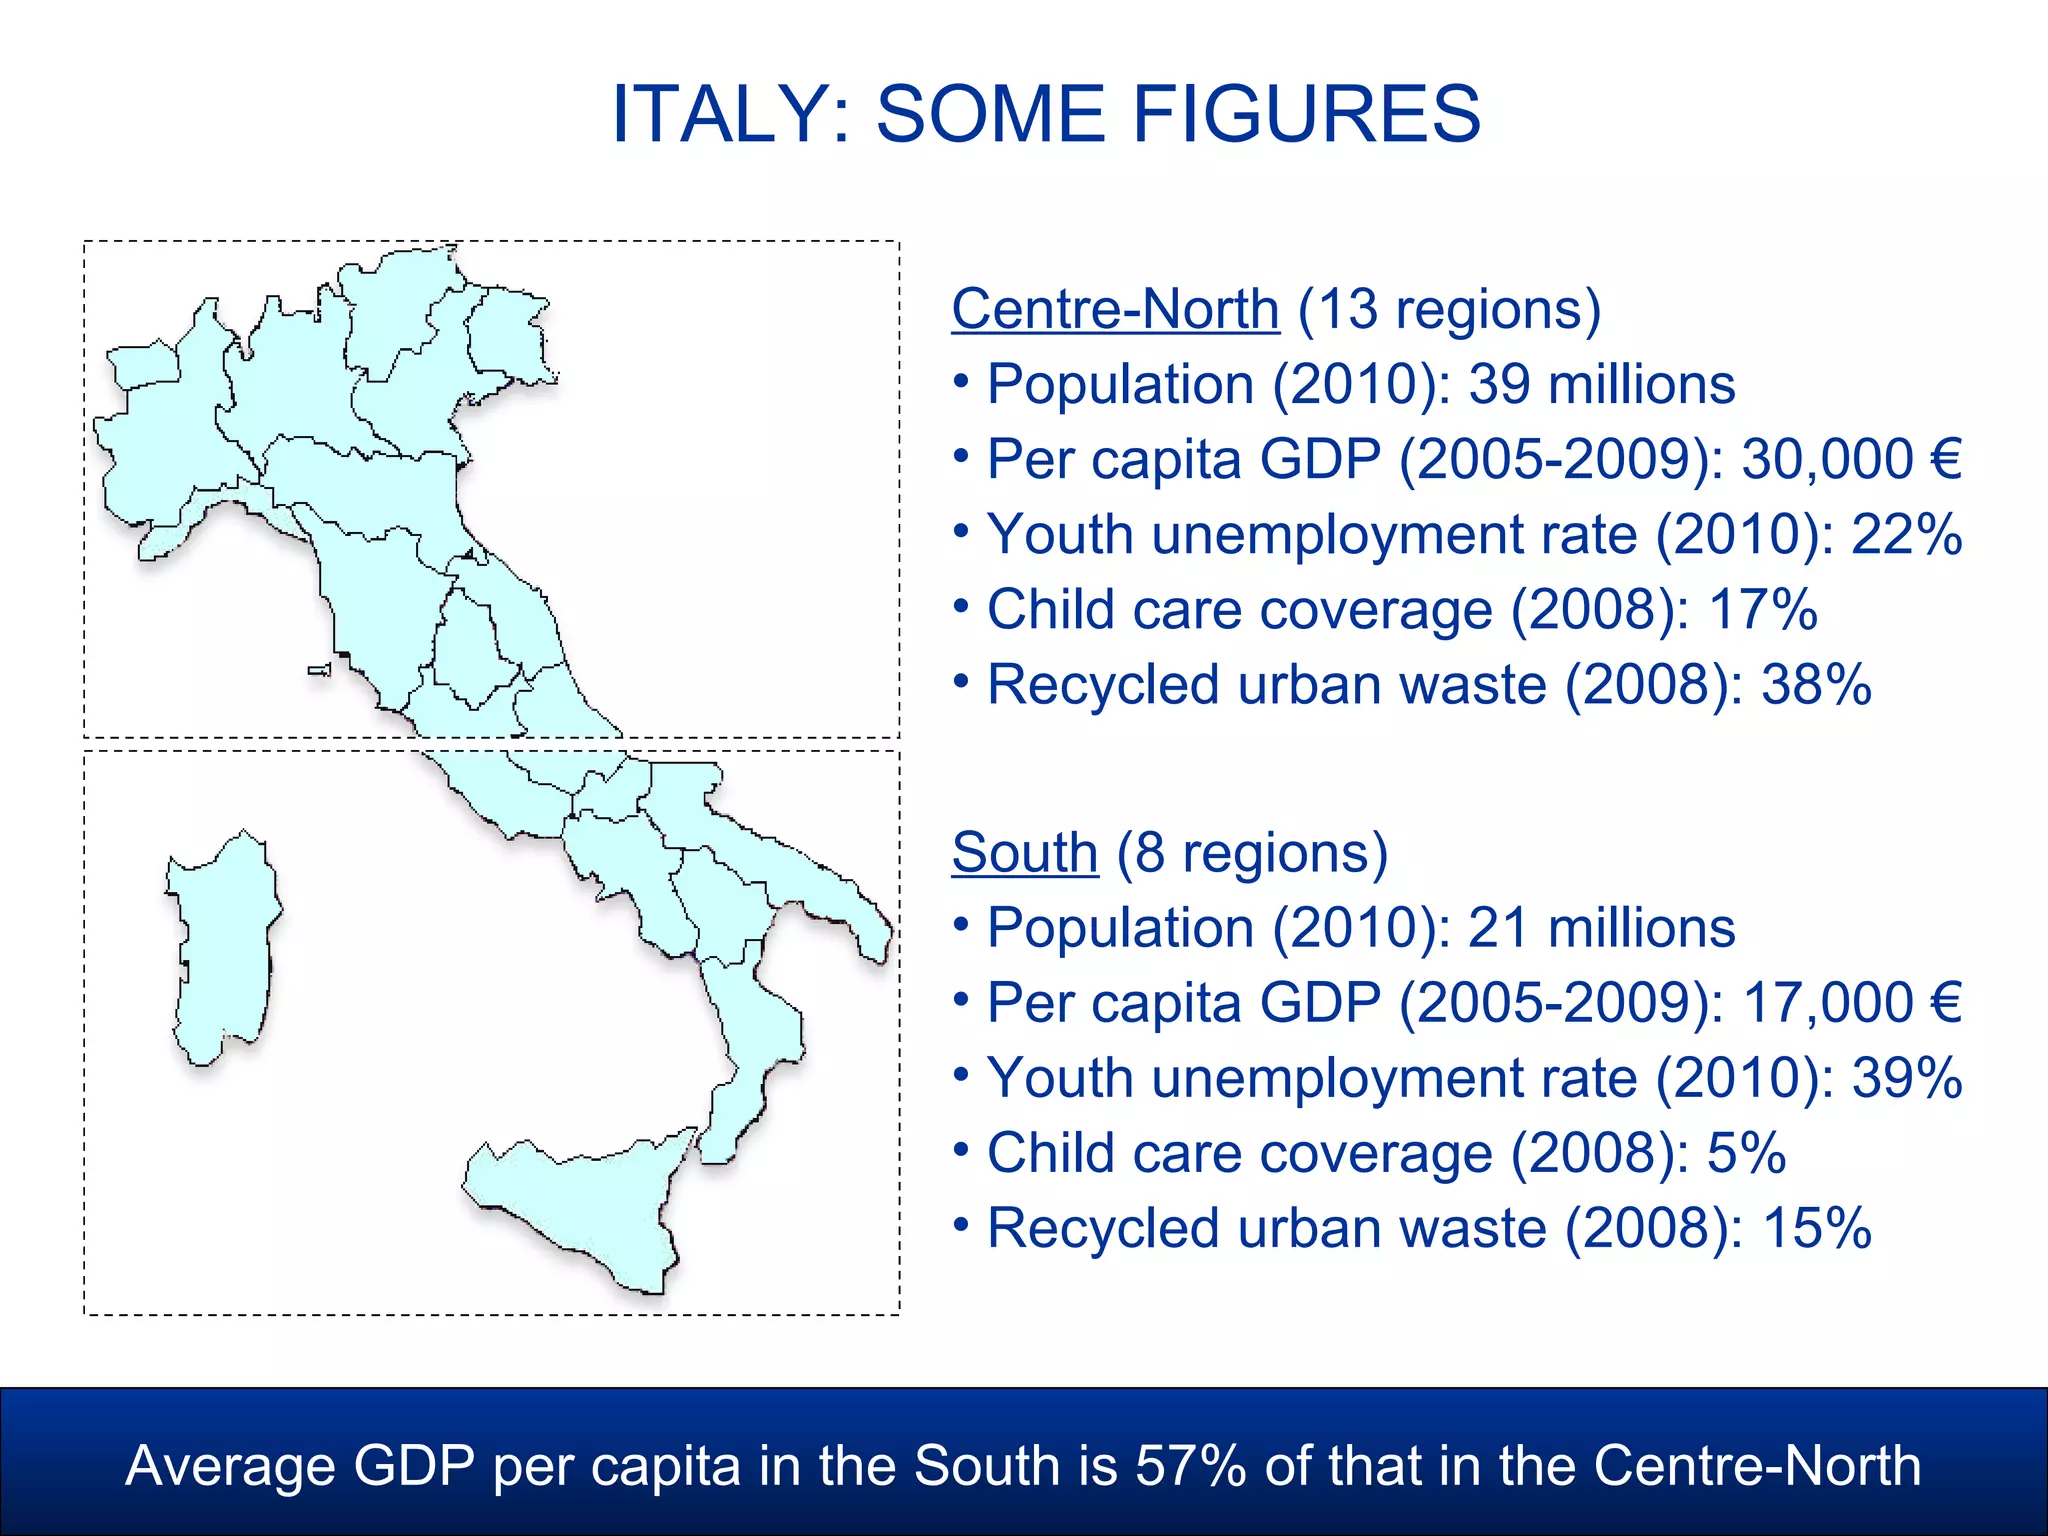
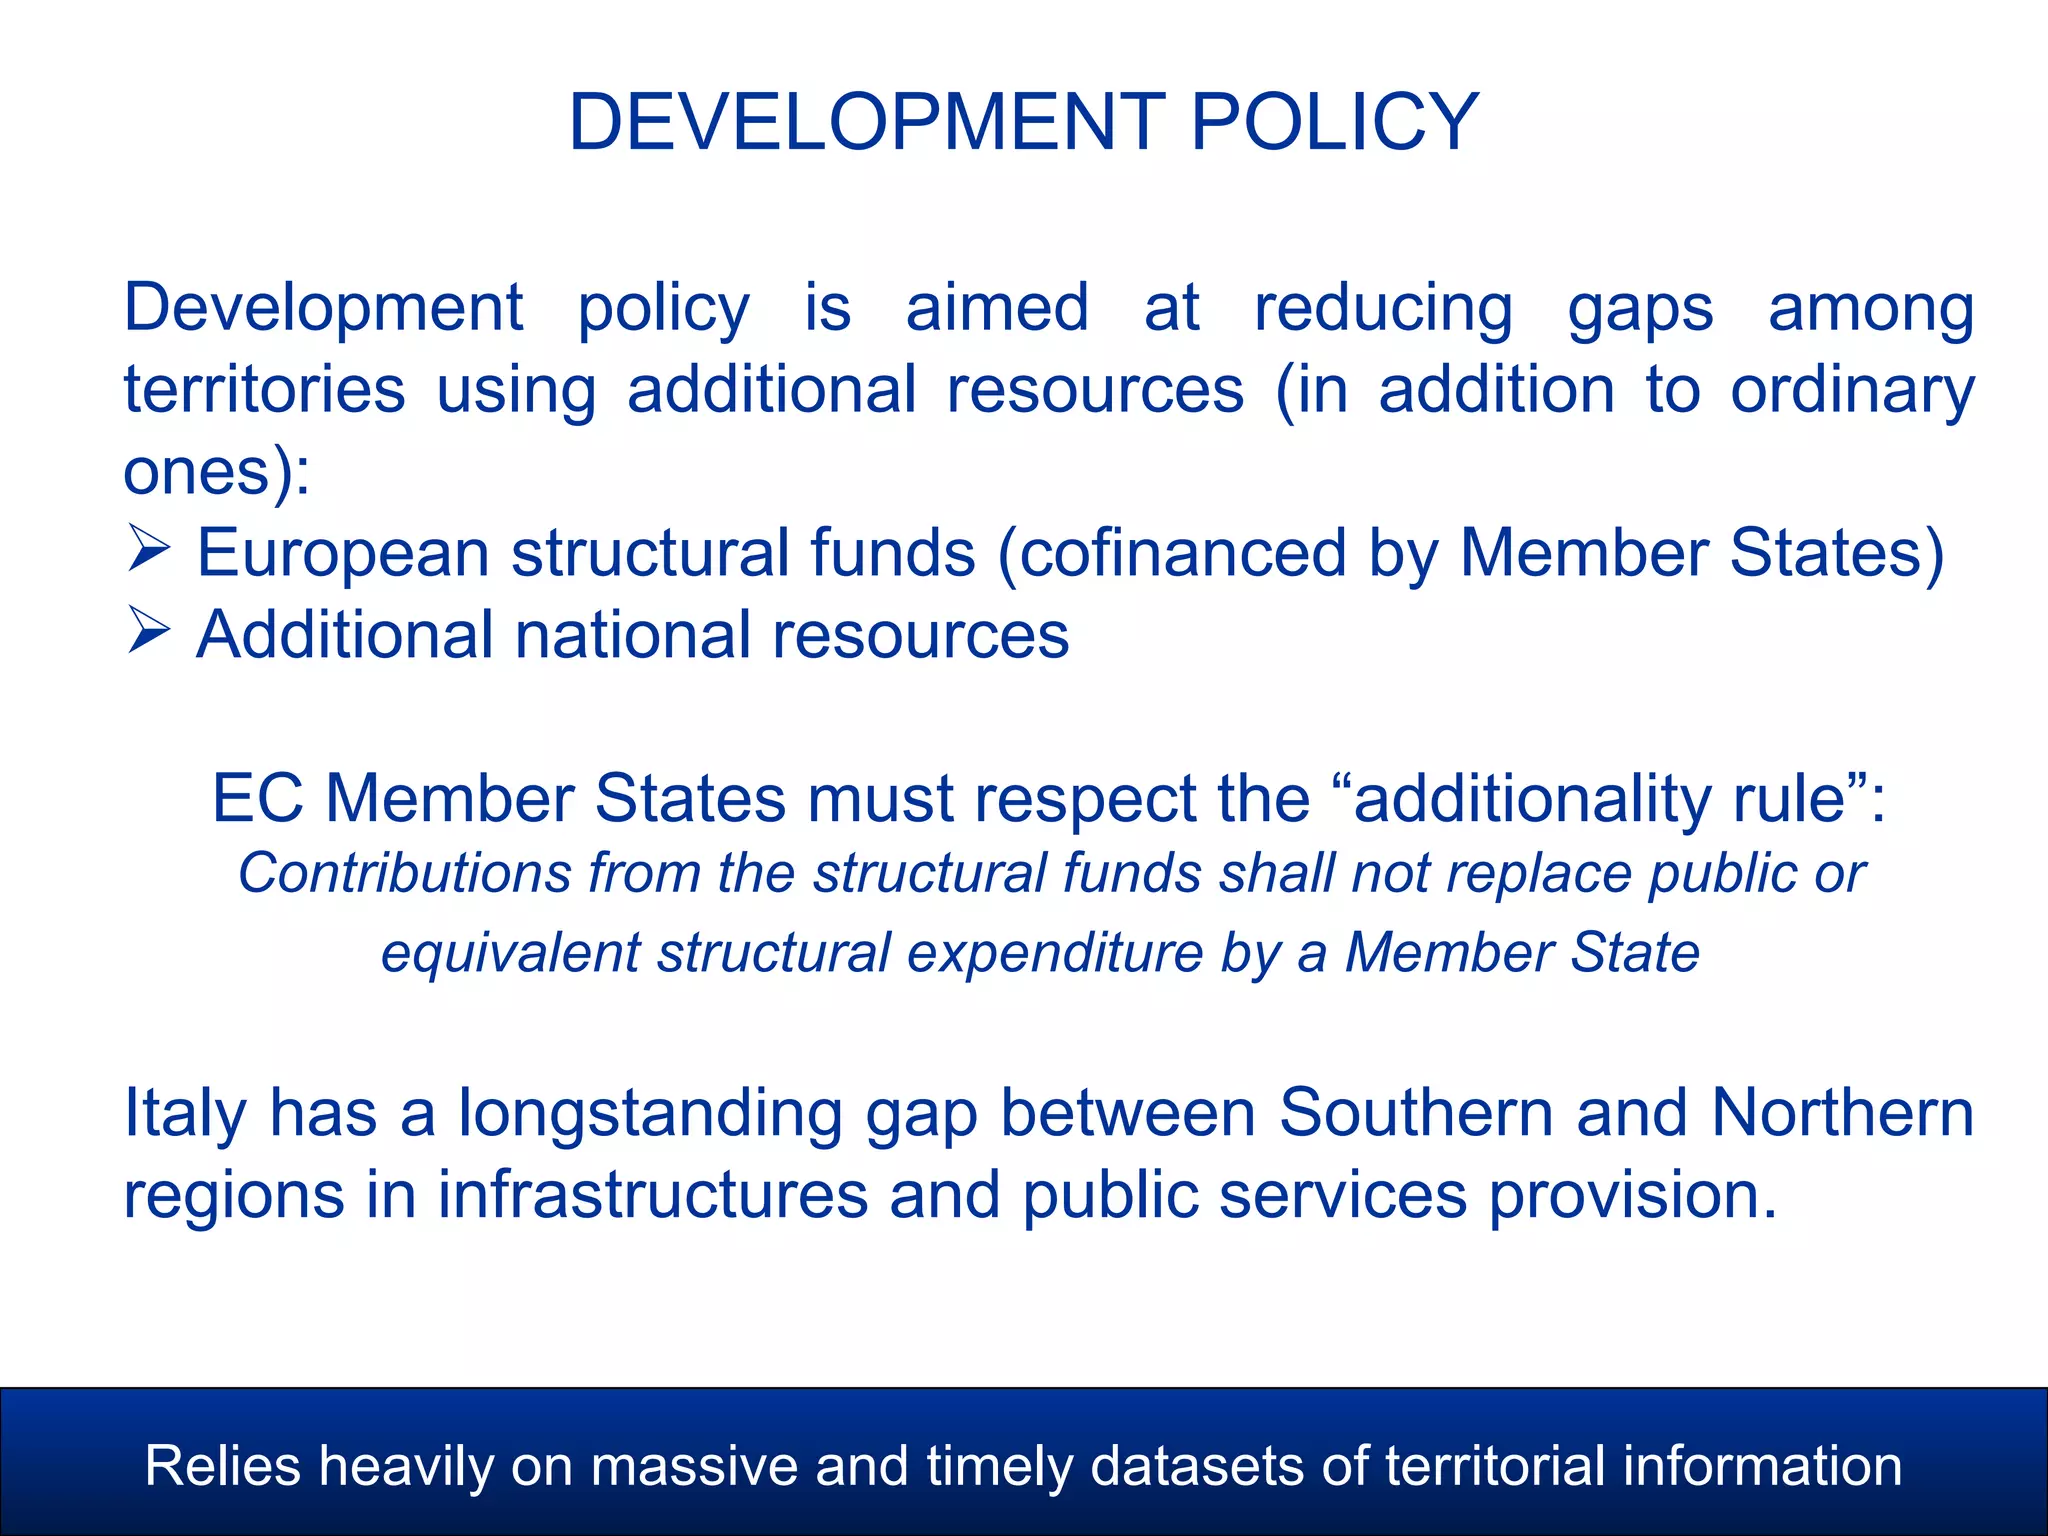
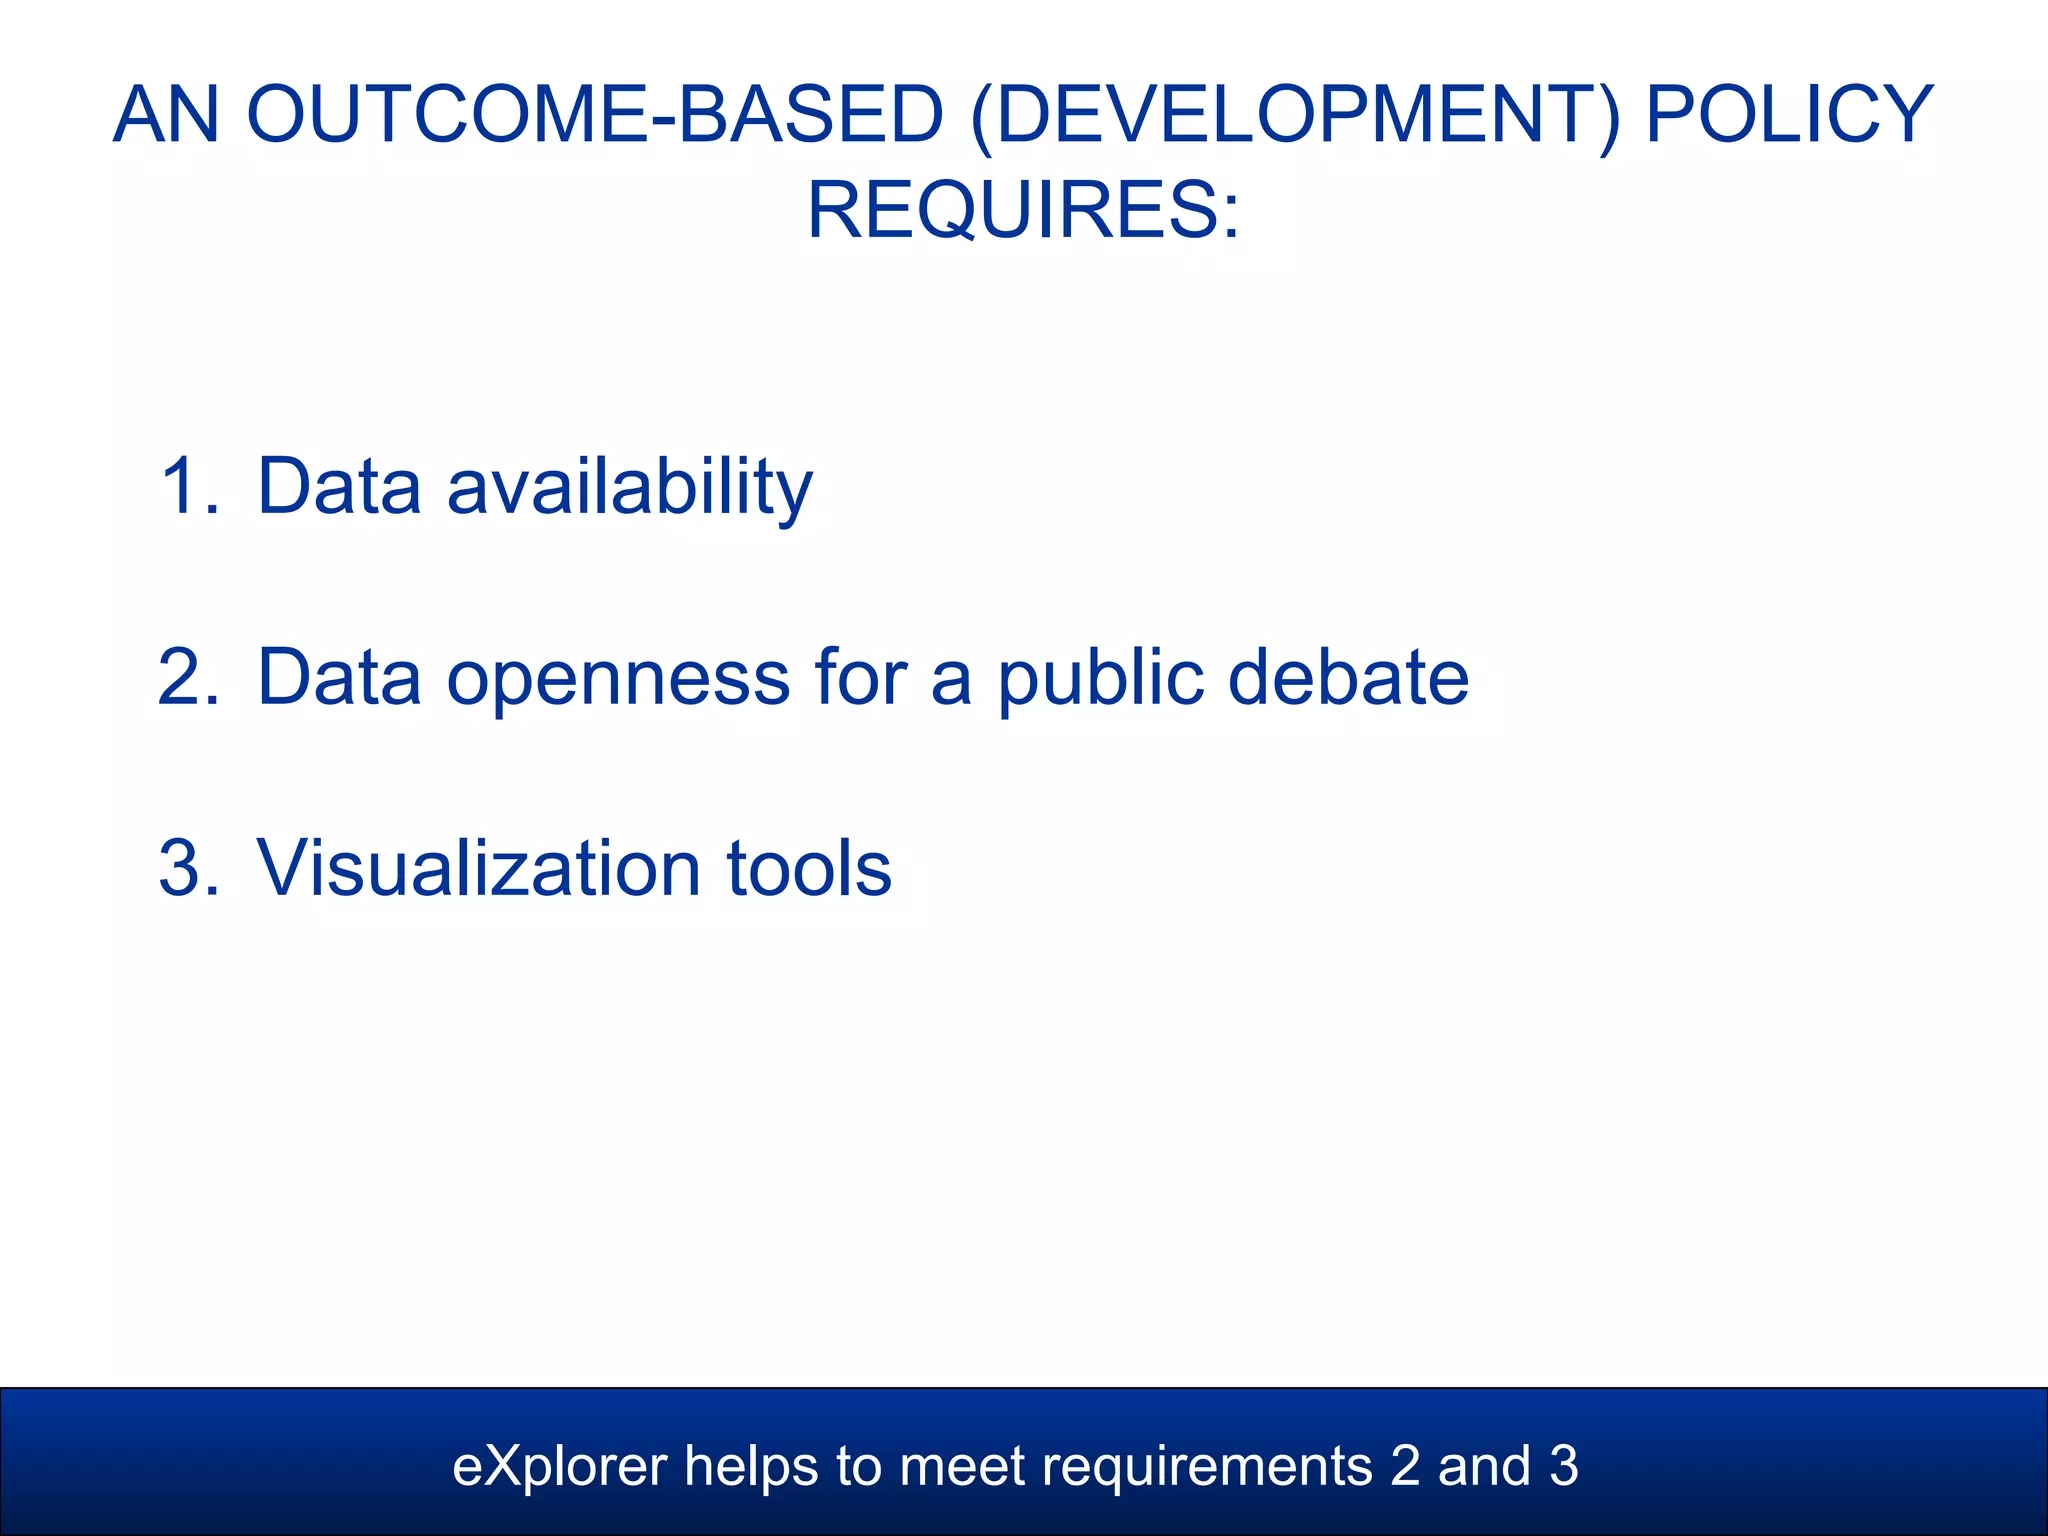
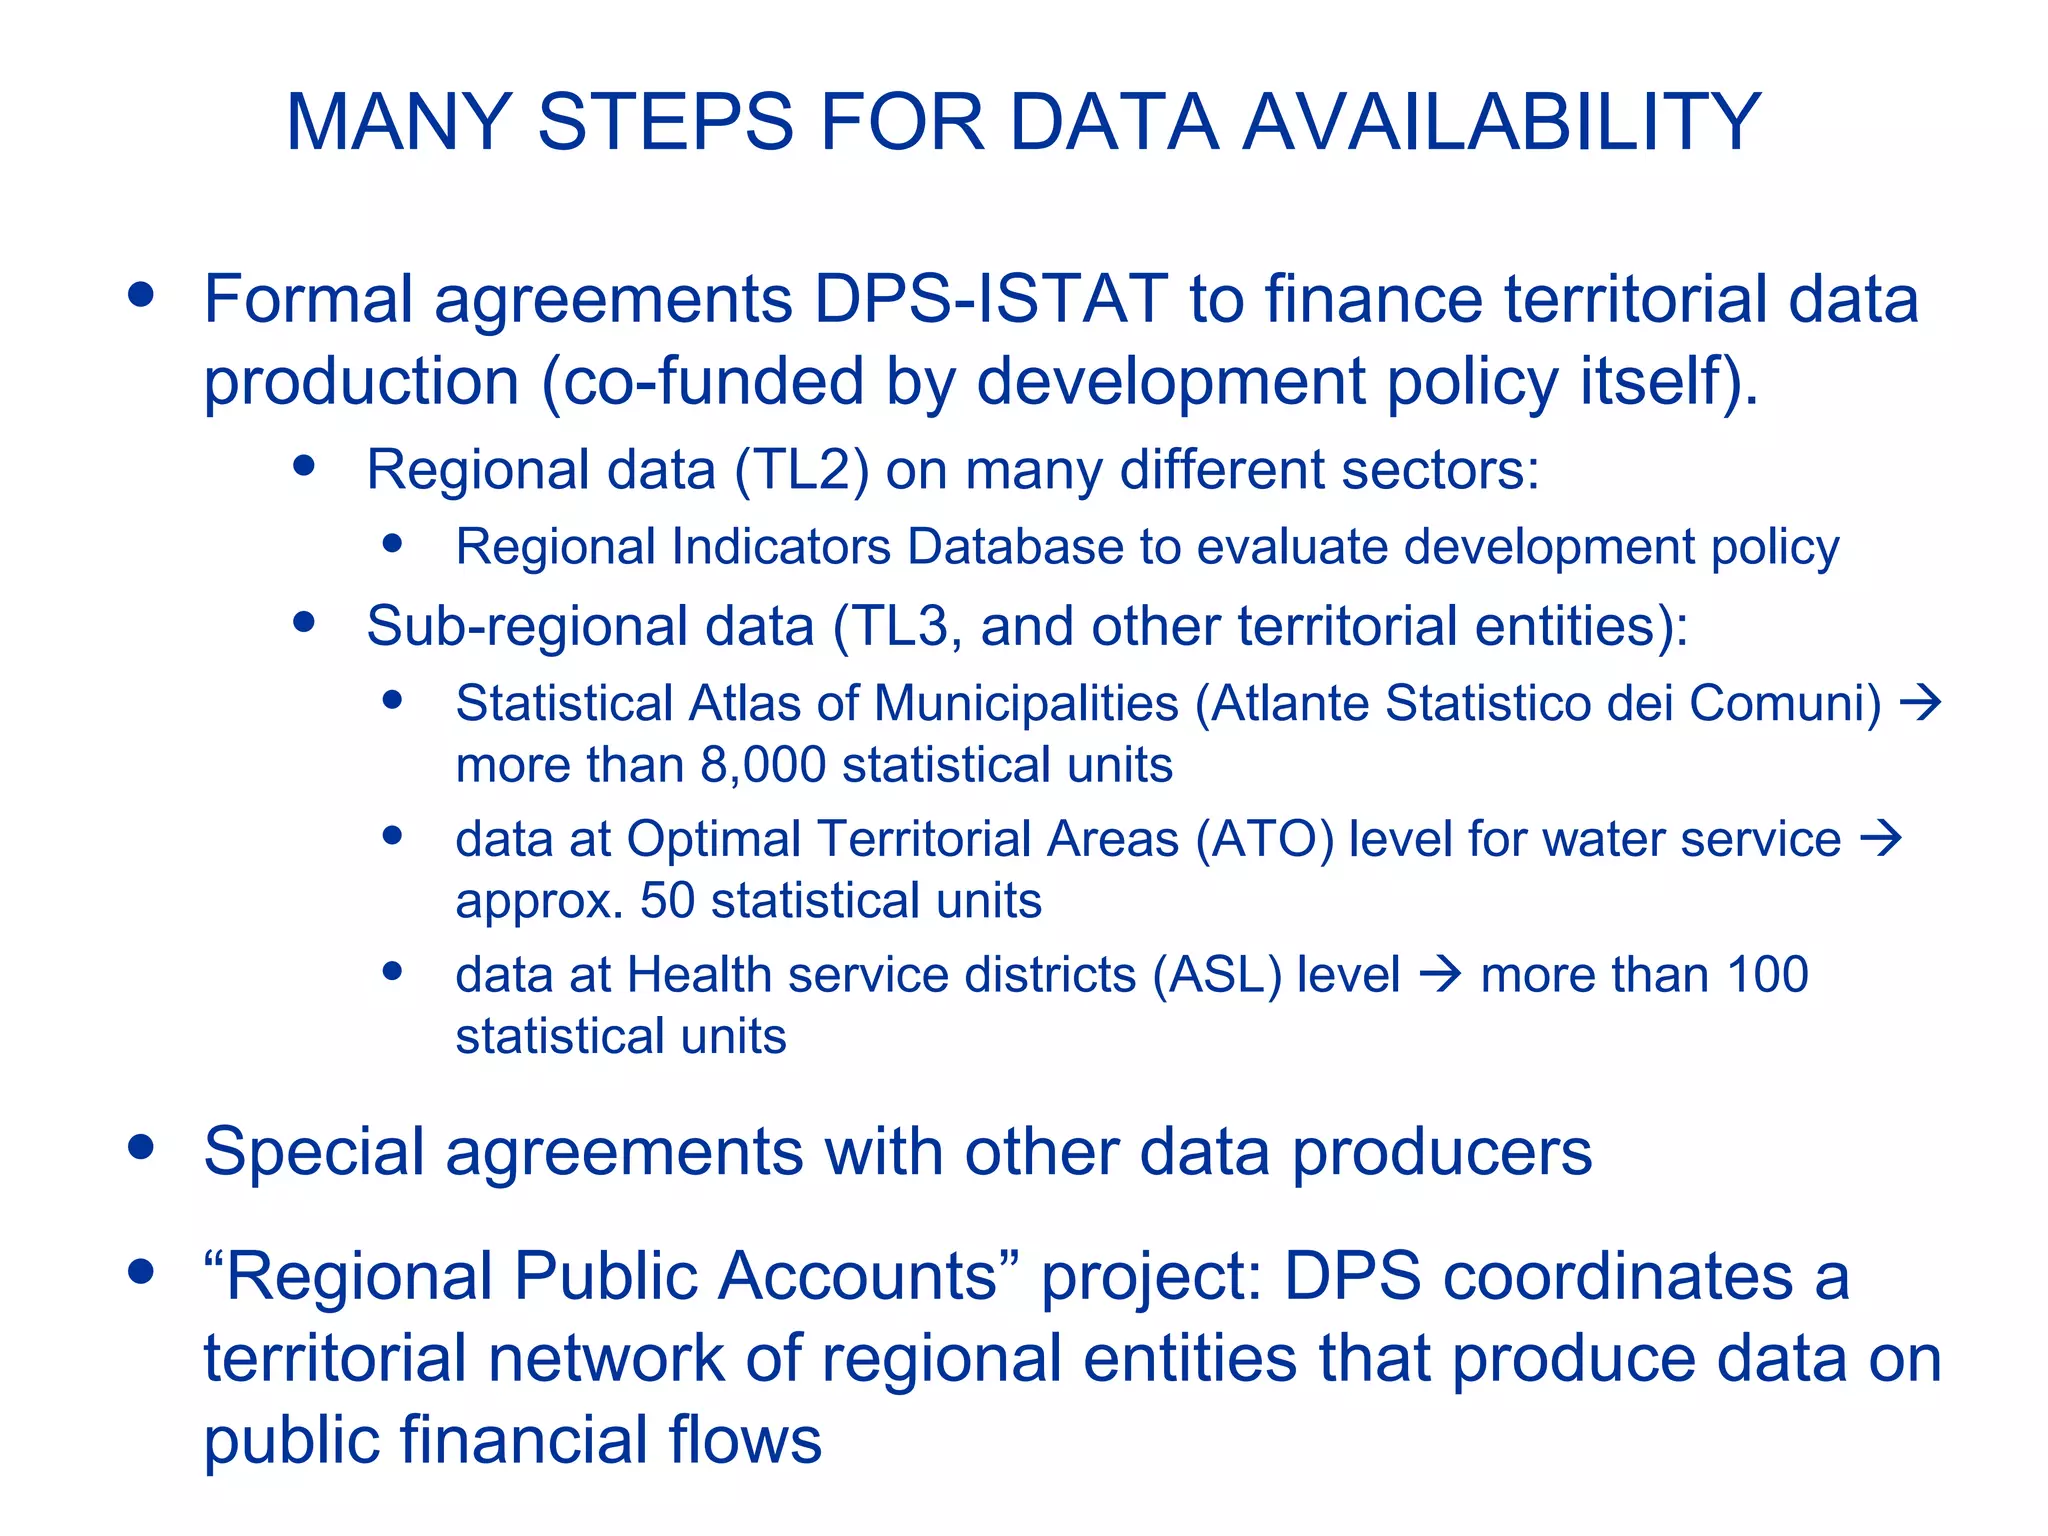
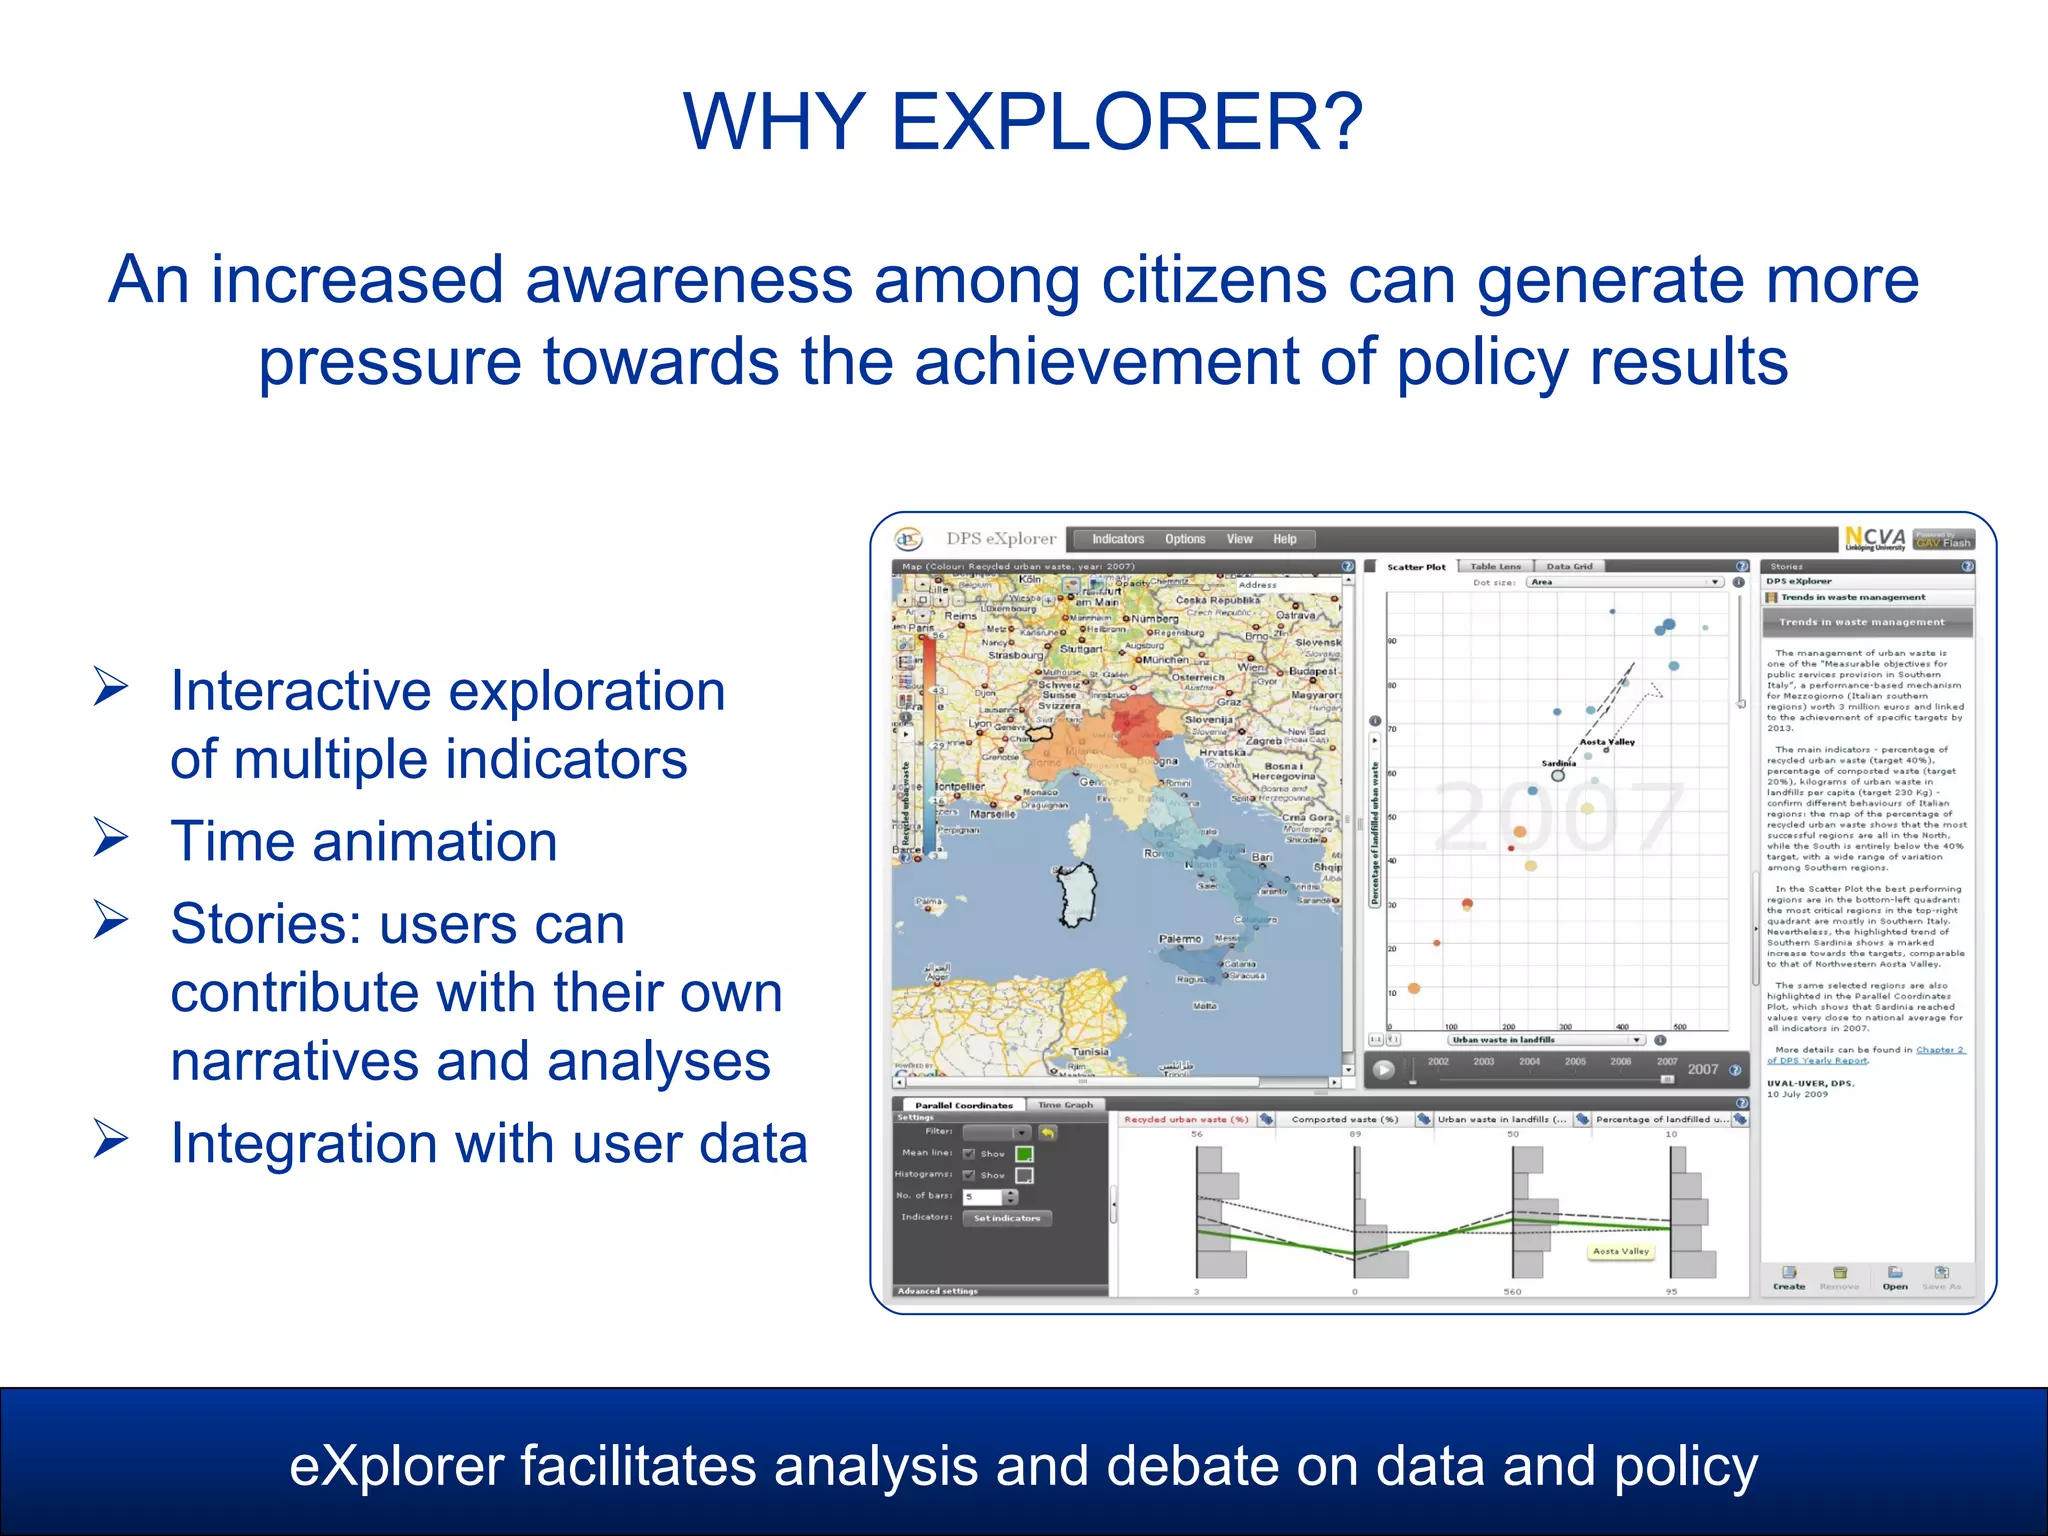
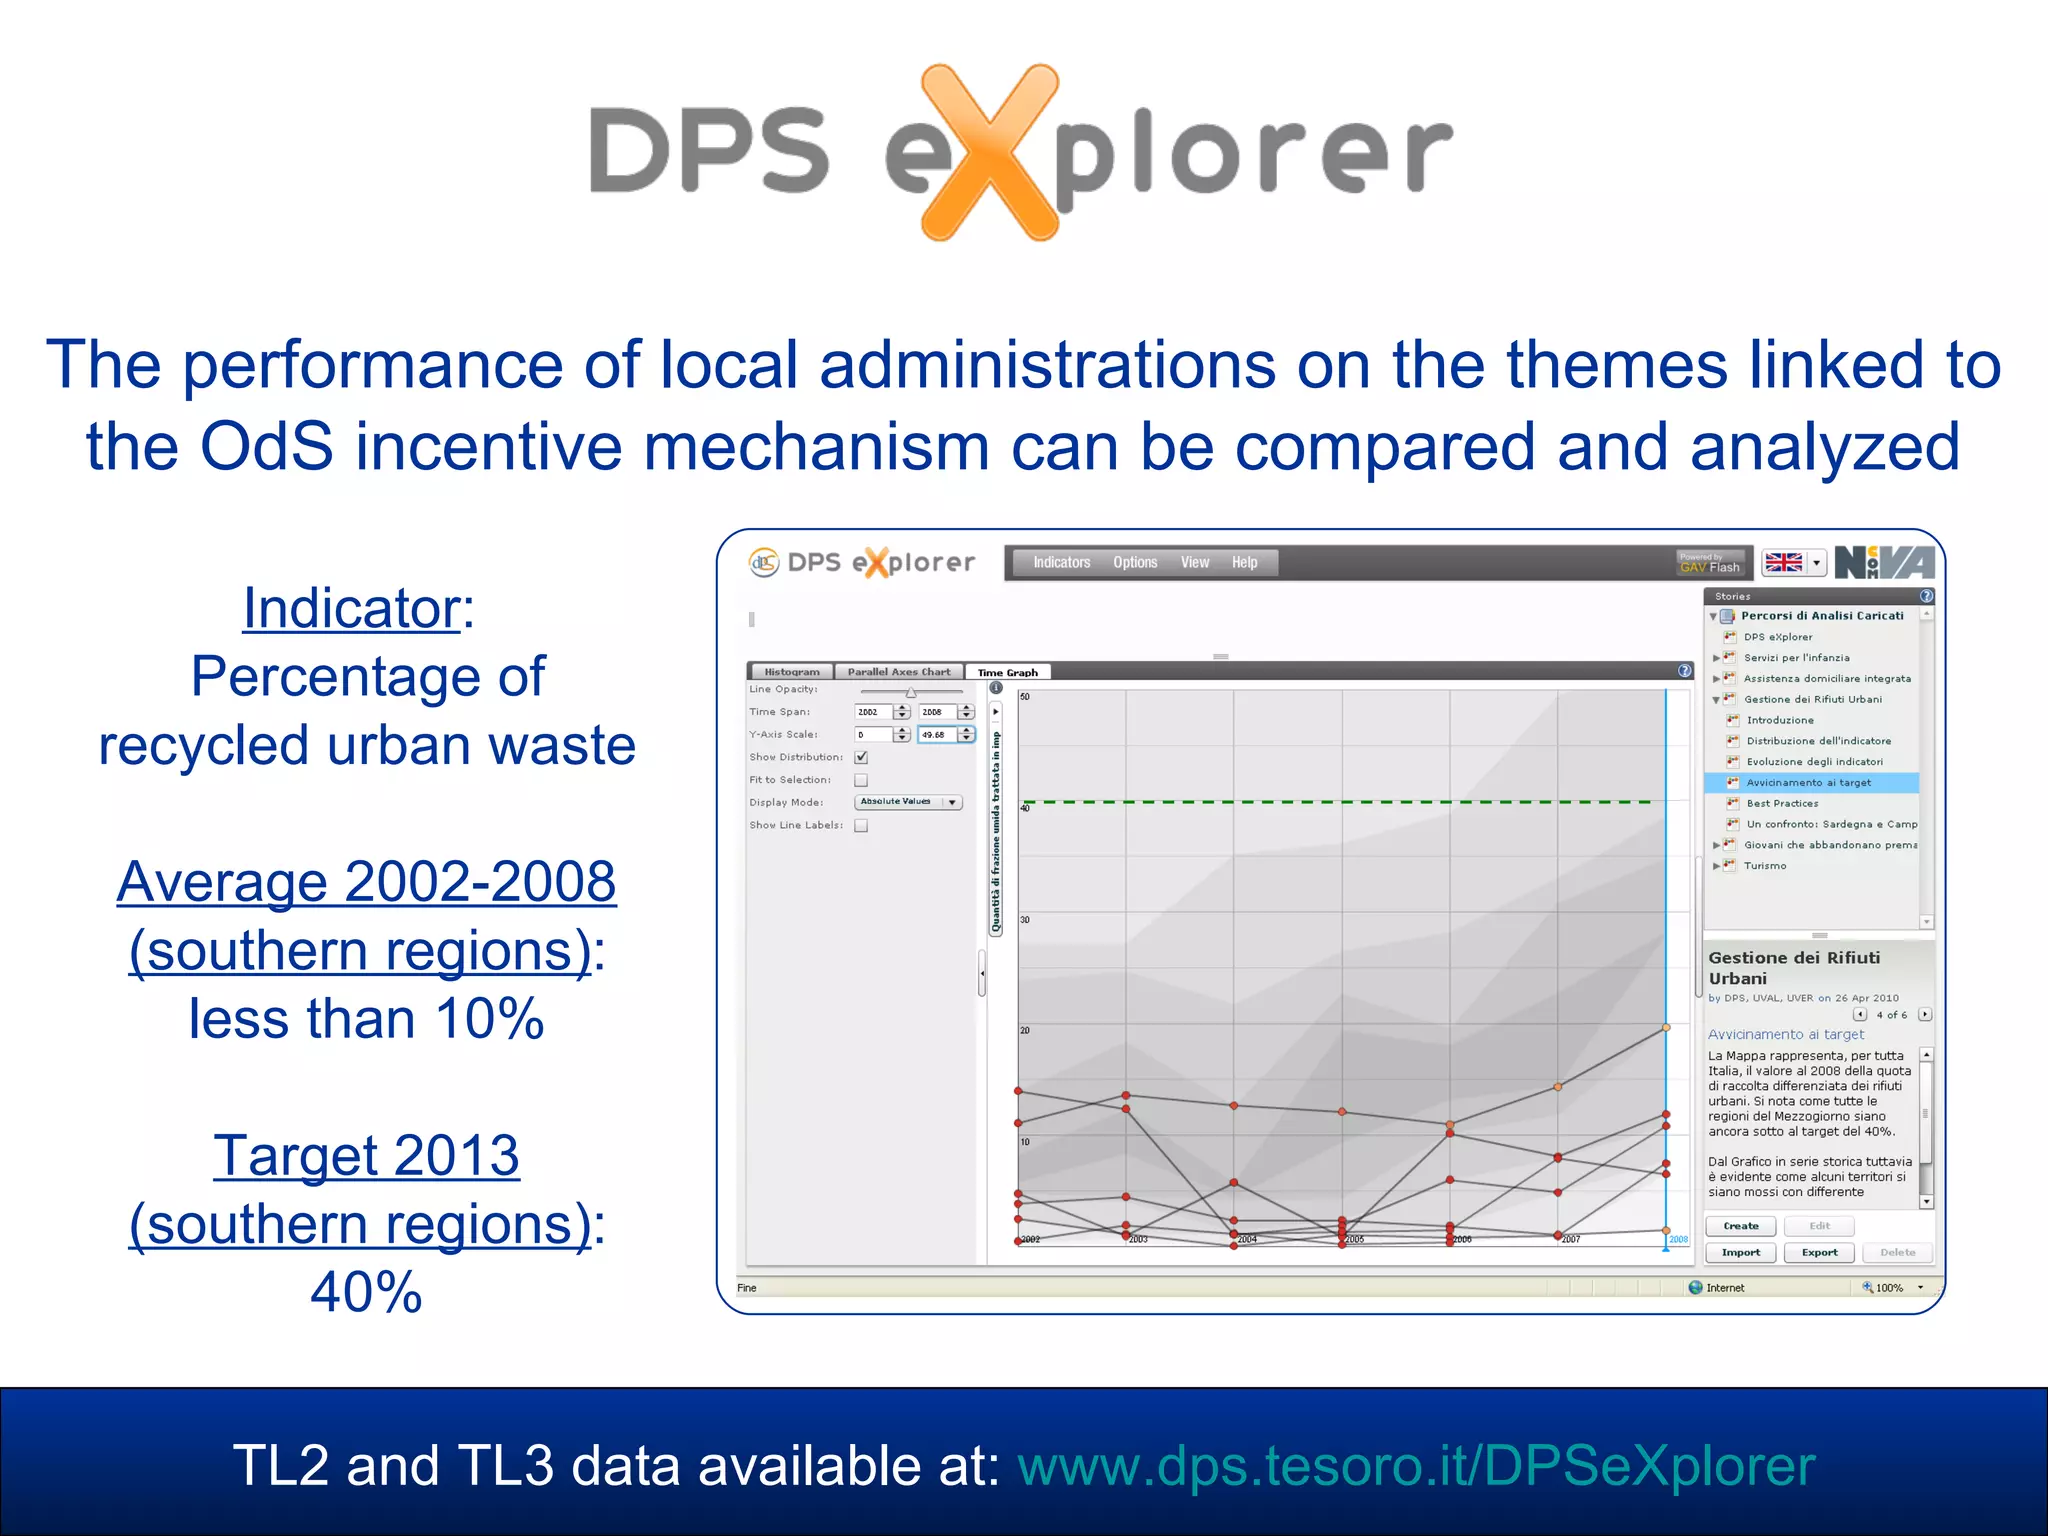
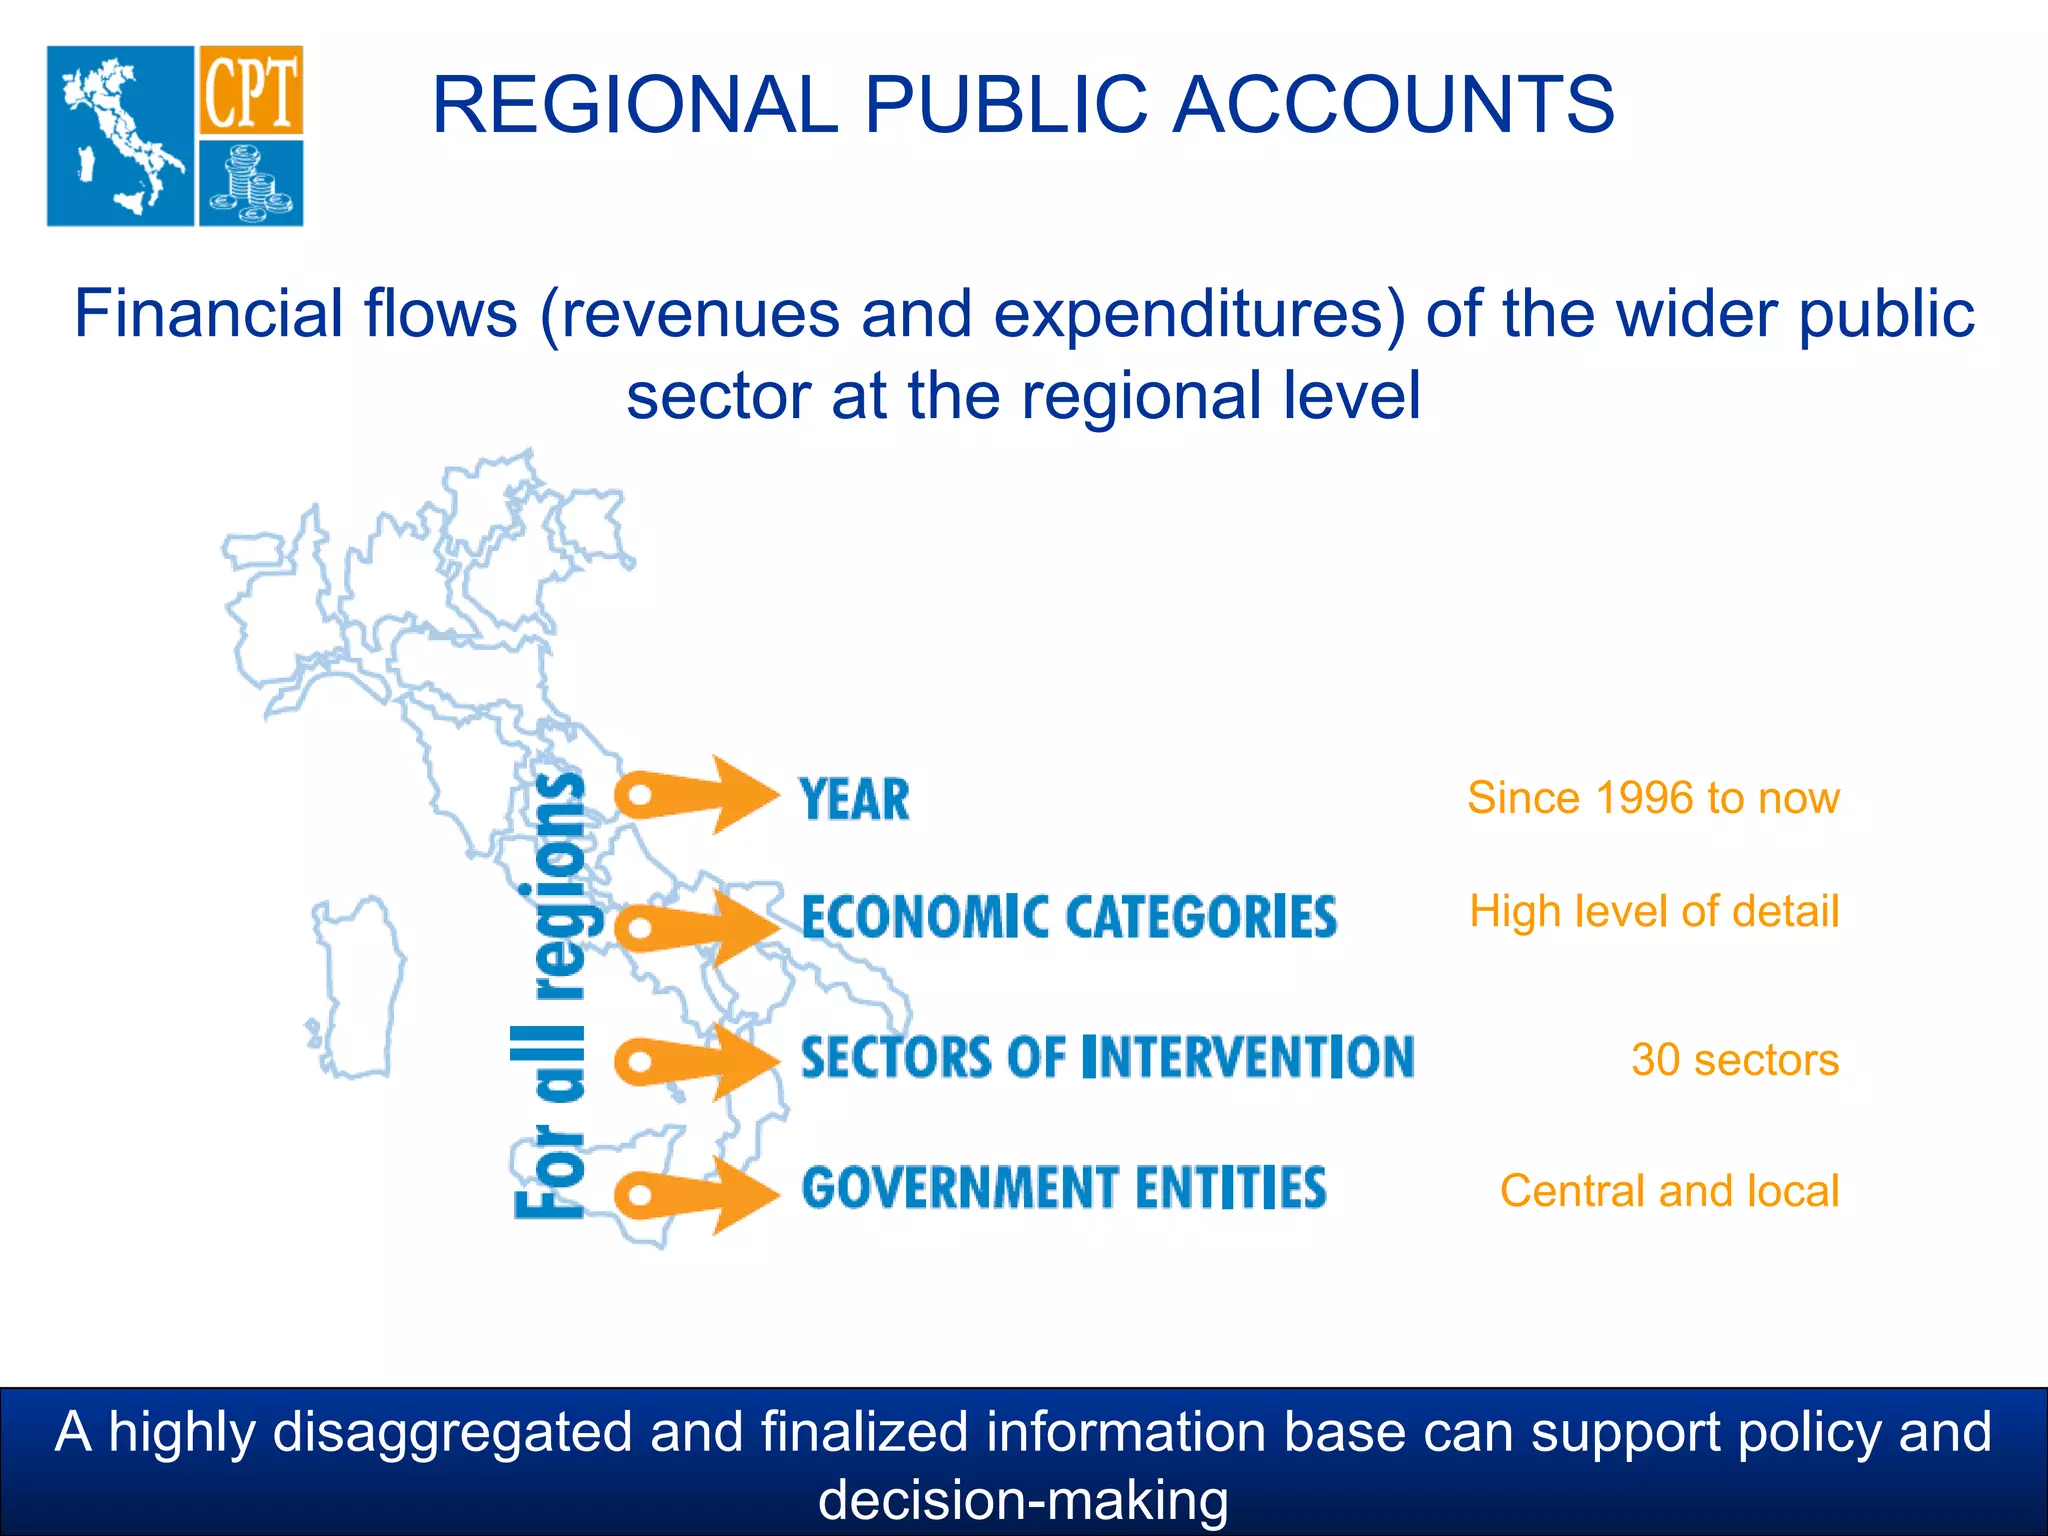
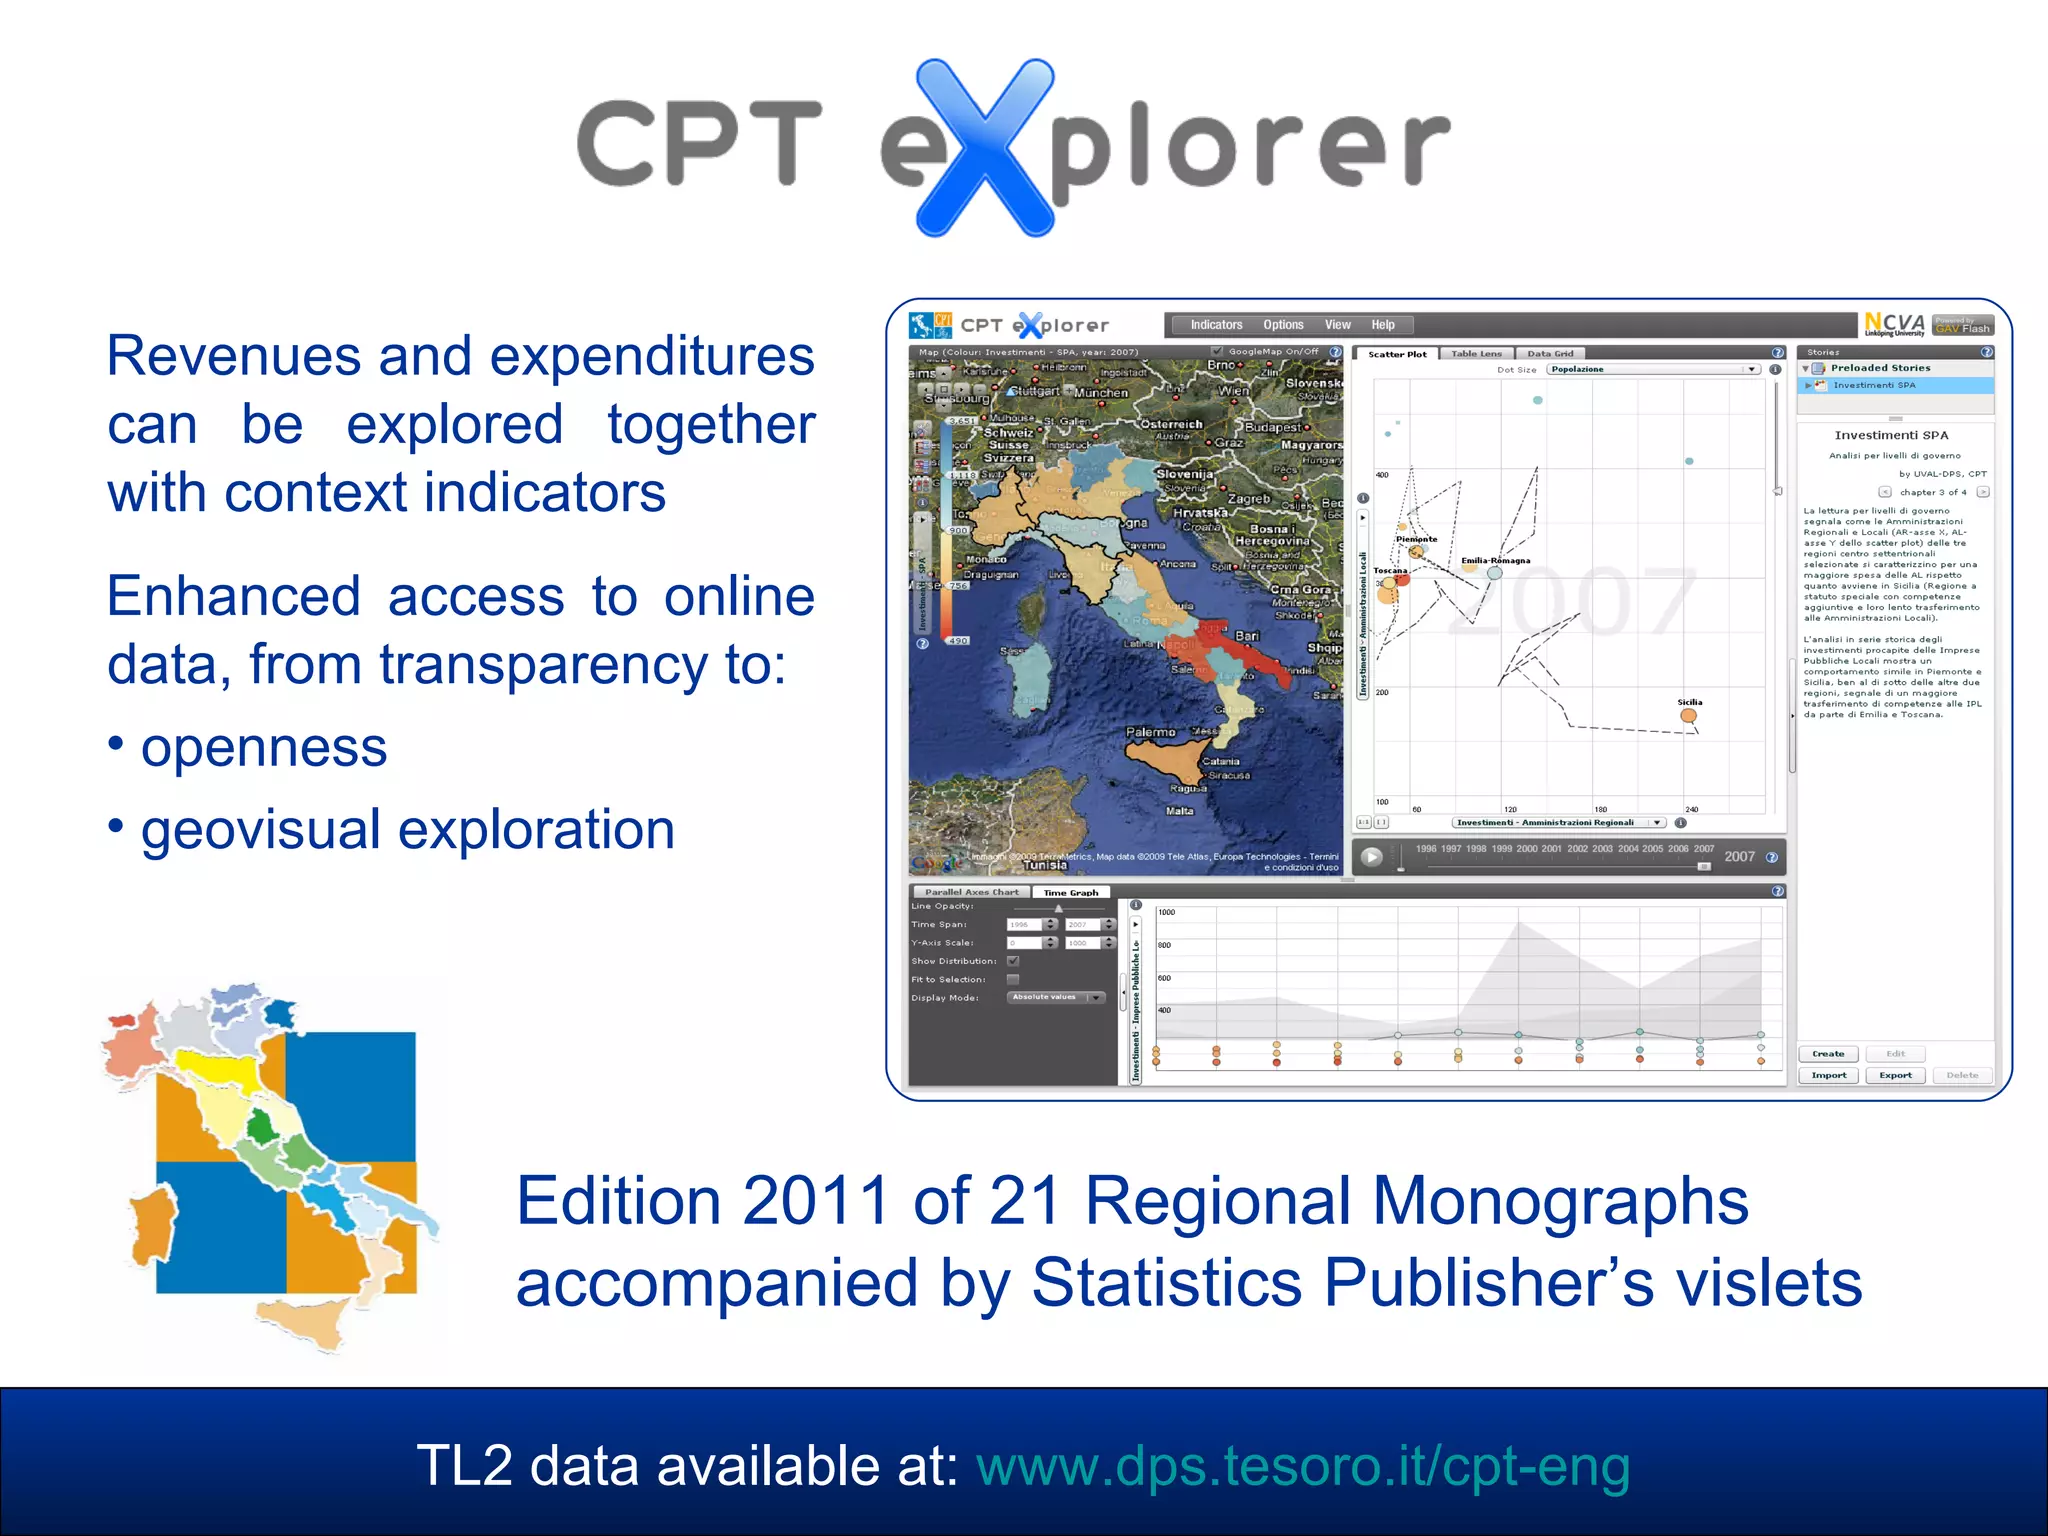
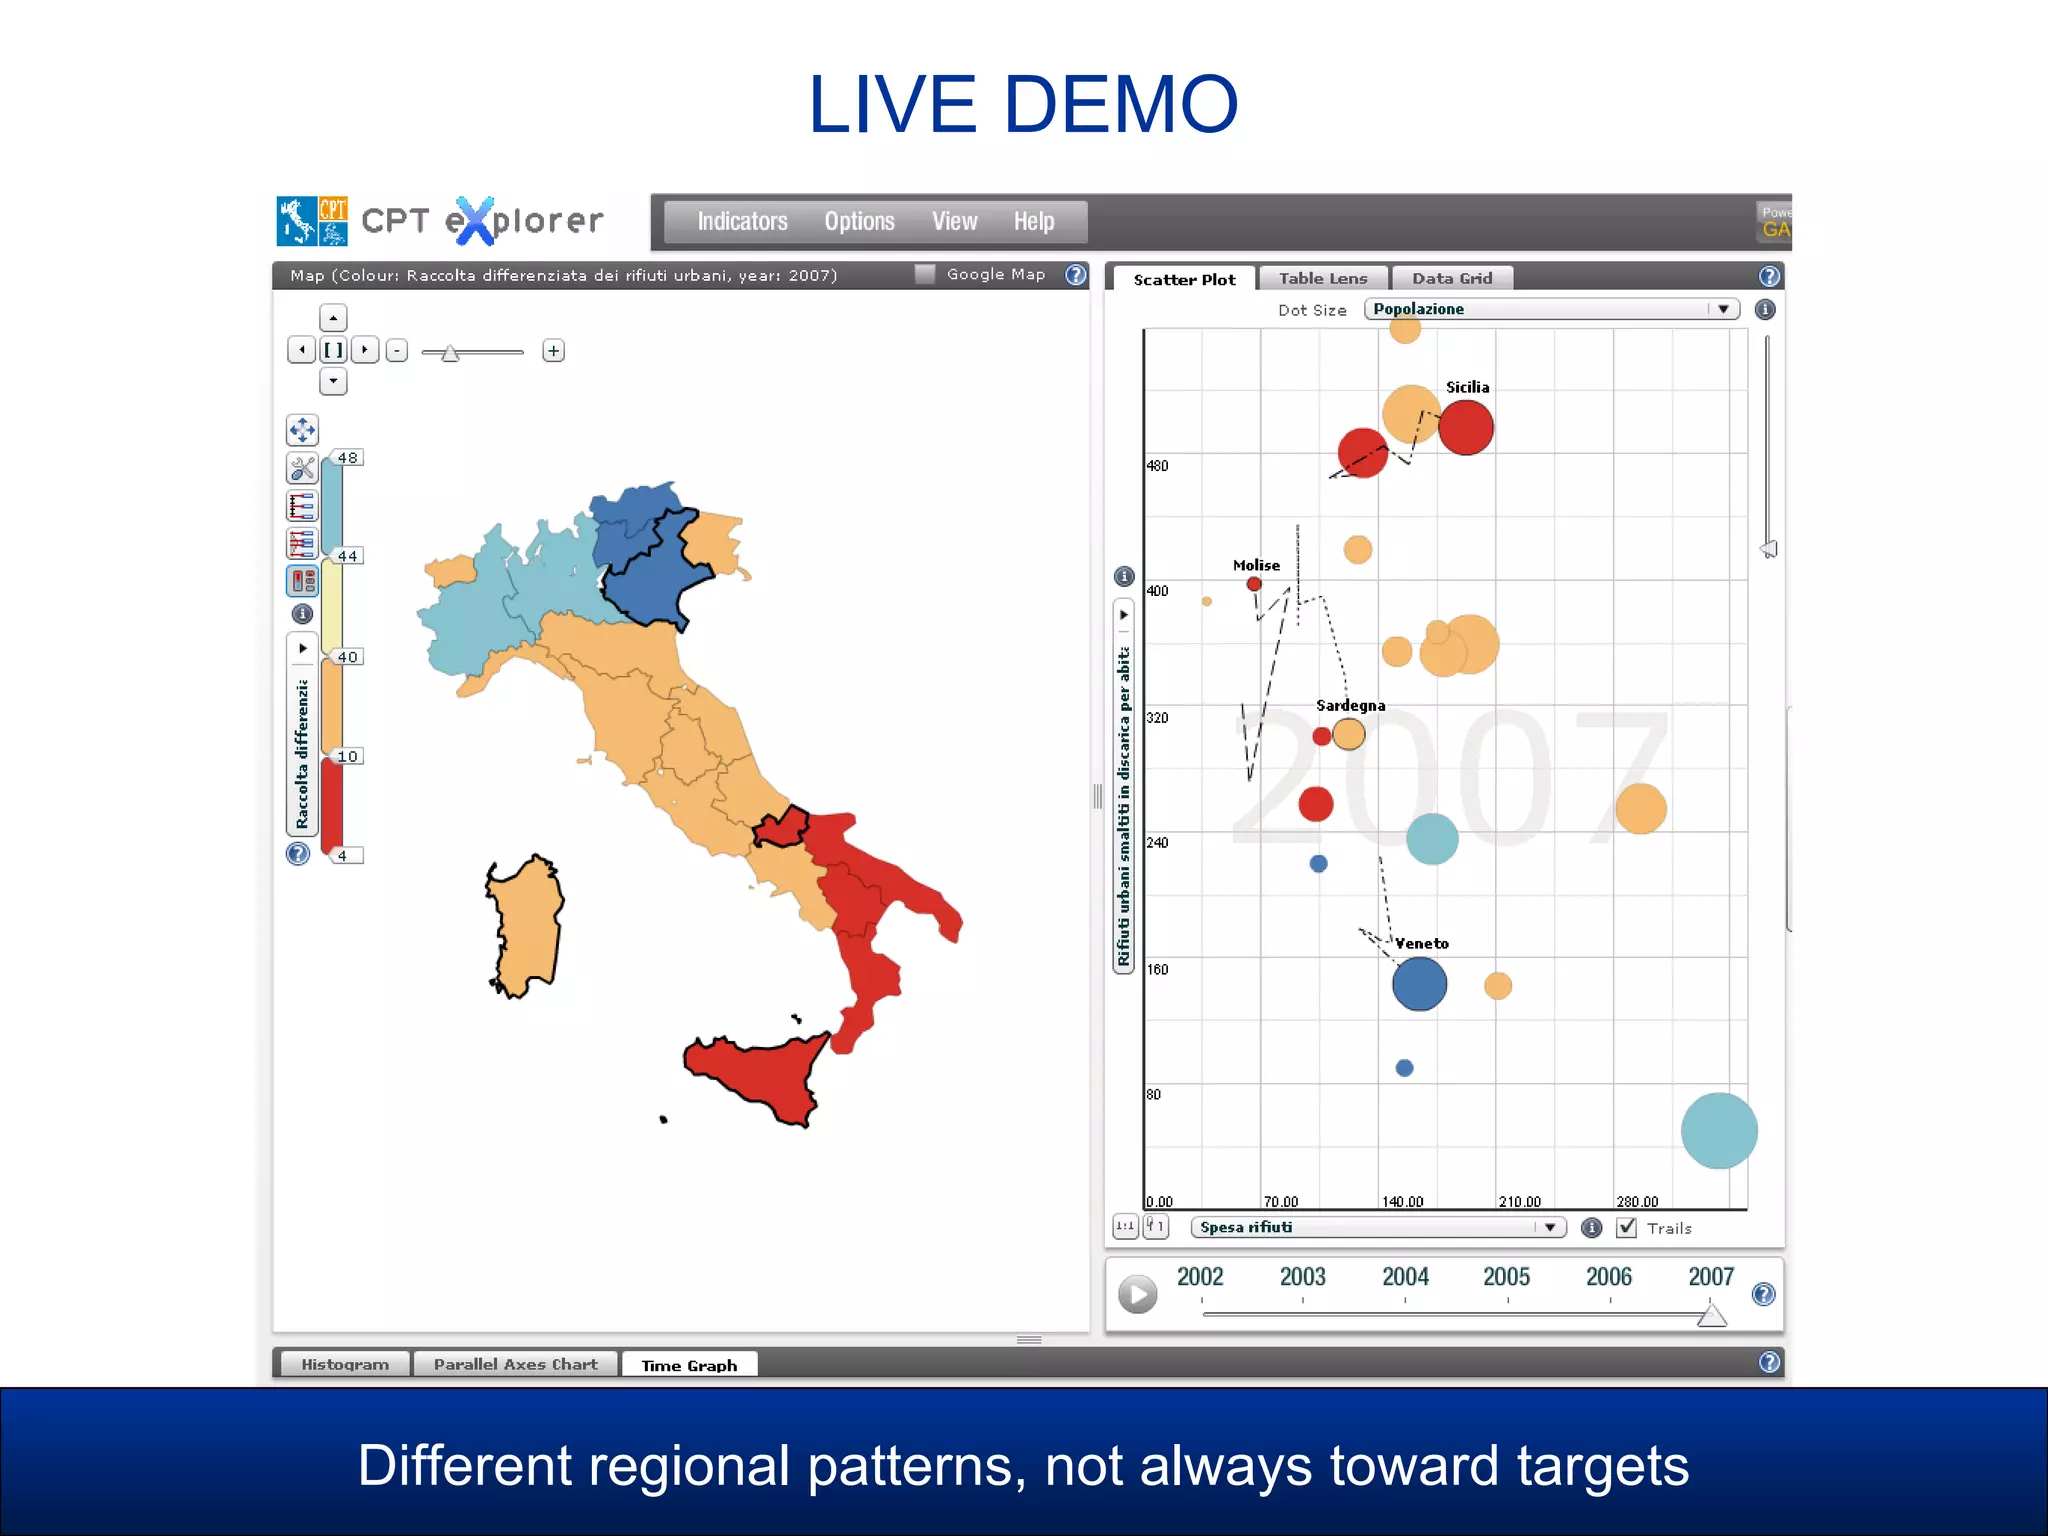
EXPLORER:
A DYNAMIC STATISTICAL DATA VISUALIZATION TOOL
TO SUPPORT ITALIAN DEVELOPMENT POLICY
Italian Ministry of Economic DevelopmentStatistics eXplorer User Meeting
Norrköping, 25-26 May 2011
Carlo Amati, Simona De Luca
Department of Development and Economic Cohesion (DPS)
Italy and development policy
The reasons for eXplorer
Two instances: DPS and CPT eXplorer
An example story
Lessons learnt
OUTLINE
South (8 regions)
• Population (2010): 21 millions
• Per capita GDP (2005-2009): 17,000 €
• Youth unemployment rate (2010): 39%
• Child care coverage (2008): 5%
• Recycled urban waste (2008): 15%
Centre-North (13 regions)
• Population (2010): 39 millions
• Per capita GDP (2005-2009): 30,000 €
• Youth unemployment rate (2010): 22%
• Child care coverage (2008): 17%
• Recycled urban waste (2008): 38%
ITALY: SOME FIGURES
Average GDP per capita in the South is 57% of that in the Centre-North
DEVELOPMENT POLICY
DEVELOPMENT POLICY
Development policy is aimed at reducing gaps among
territories using additional resources (in addition to ordinary
ones):
 European structural funds (cofinanced by Member States)
 Additional national resources
EC Member States must respect the “additionality rule”:
Contributions from the structural funds shall not replace public or
equivalent structural expenditure by a Member State
Italy has a longstanding gap between Southern and Northern
regions in infrastructures and public services provision.
Relies heavily on massive and timely datasets of territorial information
Some projects
funded by development policy
in Italy
Completion of Palermo-Messina motorway (820 M€)
Light railway system – Sassari (120 M€)
Grottaglie airport (118 M€)
Sewage treatment plant – Termoli (8M€)
Organic waste treatment plant – Urbino (2M€)
The reasons for eXplorer
1. Data availability
2. Data openness for a public debate
3. Visualization tools
AN OUTCOME-BASED (DEVELOPMENT) POLICY
REQUIRES:
eXplorer helps to meet requirements 2 and 3
MANY STEPS FOR DATA AVAILABILITY
• Formal agreements DPS-ISTAT to finance territorial data
production (co-funded by development policy itself).
• Regional data (TL2) on many different sectors:
• Regional Indicators Database to evaluate development policy
• Sub-regional data (TL3, and other territorial entities):
• Statistical Atlas of Municipalities (Atlante Statistico dei Comuni) 
more than 8,000 statistical units
• data at Optimal Territorial Areas (ATO) level for water service 
approx. 50 statistical units
• data at Health service districts (ASL) level  more than 100
statistical units
• Special agreements with other data producers
• “Regional Public Accounts” project: DPS coordinates a
territorial network of regional entities that produce data on
public financial flows
WHY EXPLORER?
eXplorer facilitates analysis and debate on data and policy
 Interactive exploration
of multiple indicators
 Time animation
 Stories: users can
contribute with their own
narratives and analyses
 Integration with user data
An increased awareness among citizens can generate more
pressure towards the achievement of policy results
EXPLORING OUR EXPLORER PATH
Launch of DPS
eXplorer
Stronger
partnership with
NComVA
DPS starts collaboration
with NCVA within the
framework of OECD
Global Project on
“Measuring the progress
of societies”
eXplorer presented at
OECD meeting on
“innovative tools to
trasform statistics into
knowledge”: towards
OECD eXplorer
Spring 2008 Spring 2009 Spring 2010 Spring 2011
Two instances of eXplorer
Targets set at minimum standard (to be reached in 2013)
Targets equal for all Regions
Sub-regional performance assessment
The governance role of DPS
 3 Billion euros
 8 Regions involved (South)
 4 Themes
 Education
 Child and elderly care
 Water service
 Urban waste
 11 Indicators
MEASURABLE OBJECTIVES
FOR PUBLIC SERVICES PROVISION
“Obiettivi di Servizio” (OdS): target outcomes for Southern regions
The performance of local administrations on the themes linked to
the OdS incentive mechanism can be compared and analyzed
TL2 and TL3 data available at: www.dps.tesoro.it/DPSeXplorer
Indicator:
Percentage of
recycled urban waste
Average 2002-2008
(southern regions):
less than 10%
Target 2013
(southern regions):
40%
REGIONAL PUBLIC ACCOUNTS
Since 1996 to now
30 sectors
Central and local
Financial flows (revenues and expenditures) of the wider public
sector at the regional level
A highly disaggregated and finalized information base can support policy and
decision-making
High level of detail
Revenues and expenditures
can be explored together
with context indicators
Enhanced access to online
data, from transparency to:
• openness
• geovisual exploration
TL2 data available at: www.dps.tesoro.it/cpt-eng
Edition 2011 of 21 Regional Monographs
accompanied by Statistics Publisher’s vislets
A story about waste
management in Italy
Different regional patterns, not always toward targets
LIVE DEMO
LESSONS LEARNT
Different skills for storytelling and
storyreading
Non-technical users need guidance (vislets
may help)
A call for stories may not be enough if not
supported by “push mode”
THANK YOU
dps.explorer@tesoro.it
carlo.amati@tesoro.it
simona.deluca@tesoro.it

eXplorer: a dynamic statistical data visualization tool to support Italian development policy

  • 1.
    EXPLORER: A DYNAMIC STATISTICALDATA VISUALIZATION TOOL TO SUPPORT ITALIAN DEVELOPMENT POLICY Italian Ministry of Economic DevelopmentStatistics eXplorer User Meeting Norrköping, 25-26 May 2011 Carlo Amati, Simona De Luca Department of Development and Economic Cohesion (DPS)
  • 2.
    Italy and developmentpolicy The reasons for eXplorer Two instances: DPS and CPT eXplorer An example story Lessons learnt OUTLINE
  • 3.
    South (8 regions) •Population (2010): 21 millions • Per capita GDP (2005-2009): 17,000 € • Youth unemployment rate (2010): 39% • Child care coverage (2008): 5% • Recycled urban waste (2008): 15% Centre-North (13 regions) • Population (2010): 39 millions • Per capita GDP (2005-2009): 30,000 € • Youth unemployment rate (2010): 22% • Child care coverage (2008): 17% • Recycled urban waste (2008): 38% ITALY: SOME FIGURES Average GDP per capita in the South is 57% of that in the Centre-North
  • 4.
    DEVELOPMENT POLICY DEVELOPMENT POLICY Developmentpolicy is aimed at reducing gaps among territories using additional resources (in addition to ordinary ones):  European structural funds (cofinanced by Member States)  Additional national resources EC Member States must respect the “additionality rule”: Contributions from the structural funds shall not replace public or equivalent structural expenditure by a Member State Italy has a longstanding gap between Southern and Northern regions in infrastructures and public services provision. Relies heavily on massive and timely datasets of territorial information
  • 5.
    Some projects funded bydevelopment policy in Italy
  • 6.
    Completion of Palermo-Messinamotorway (820 M€)
  • 7.
    Light railway system– Sassari (120 M€)
  • 8.
  • 9.
    Sewage treatment plant– Termoli (8M€)
  • 10.
    Organic waste treatmentplant – Urbino (2M€)
  • 11.
  • 12.
    1. Data availability 2.Data openness for a public debate 3. Visualization tools AN OUTCOME-BASED (DEVELOPMENT) POLICY REQUIRES: eXplorer helps to meet requirements 2 and 3
  • 13.
    MANY STEPS FORDATA AVAILABILITY • Formal agreements DPS-ISTAT to finance territorial data production (co-funded by development policy itself). • Regional data (TL2) on many different sectors: • Regional Indicators Database to evaluate development policy • Sub-regional data (TL3, and other territorial entities): • Statistical Atlas of Municipalities (Atlante Statistico dei Comuni)  more than 8,000 statistical units • data at Optimal Territorial Areas (ATO) level for water service  approx. 50 statistical units • data at Health service districts (ASL) level  more than 100 statistical units • Special agreements with other data producers • “Regional Public Accounts” project: DPS coordinates a territorial network of regional entities that produce data on public financial flows
  • 14.
    WHY EXPLORER? eXplorer facilitatesanalysis and debate on data and policy  Interactive exploration of multiple indicators  Time animation  Stories: users can contribute with their own narratives and analyses  Integration with user data An increased awareness among citizens can generate more pressure towards the achievement of policy results
  • 15.
    EXPLORING OUR EXPLORERPATH Launch of DPS eXplorer Stronger partnership with NComVA DPS starts collaboration with NCVA within the framework of OECD Global Project on “Measuring the progress of societies” eXplorer presented at OECD meeting on “innovative tools to trasform statistics into knowledge”: towards OECD eXplorer Spring 2008 Spring 2009 Spring 2010 Spring 2011
  • 16.
  • 17.
    Targets set atminimum standard (to be reached in 2013) Targets equal for all Regions Sub-regional performance assessment The governance role of DPS  3 Billion euros  8 Regions involved (South)  4 Themes  Education  Child and elderly care  Water service  Urban waste  11 Indicators MEASURABLE OBJECTIVES FOR PUBLIC SERVICES PROVISION “Obiettivi di Servizio” (OdS): target outcomes for Southern regions
  • 18.
    The performance oflocal administrations on the themes linked to the OdS incentive mechanism can be compared and analyzed TL2 and TL3 data available at: www.dps.tesoro.it/DPSeXplorer Indicator: Percentage of recycled urban waste Average 2002-2008 (southern regions): less than 10% Target 2013 (southern regions): 40%
  • 19.
    REGIONAL PUBLIC ACCOUNTS Since1996 to now 30 sectors Central and local Financial flows (revenues and expenditures) of the wider public sector at the regional level A highly disaggregated and finalized information base can support policy and decision-making High level of detail
  • 20.
    Revenues and expenditures canbe explored together with context indicators Enhanced access to online data, from transparency to: • openness • geovisual exploration TL2 data available at: www.dps.tesoro.it/cpt-eng Edition 2011 of 21 Regional Monographs accompanied by Statistics Publisher’s vislets
  • 21.
    A story aboutwaste management in Italy
  • 22.
    Different regional patterns,not always toward targets LIVE DEMO
  • 23.
    LESSONS LEARNT Different skillsfor storytelling and storyreading Non-technical users need guidance (vislets may help) A call for stories may not be enough if not supported by “push mode”
  • 24.