Downloaded 14 times


![Example
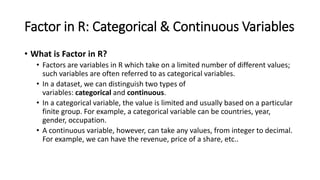
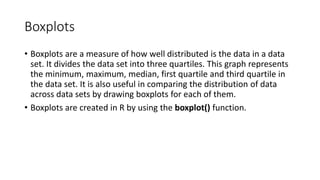
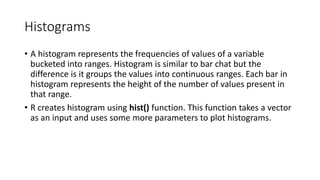
• We use the data set "mtcars" available in the R environment to create
a basic boxplot. Let's look at the columns "mpg" and "cyl" in mtcars.
input <- mtcars[,c('mpg','cyl')]
print(head(input))](https://image.slidesharecdn.com/exploratorydataanalysisusingr-200607125542/85/Exploratory-data-analysis-using-r-19-320.jpg)
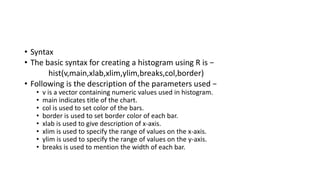


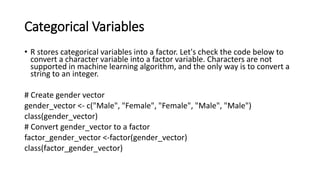
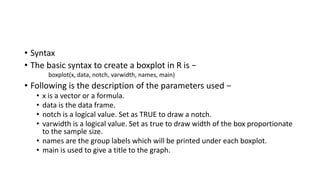
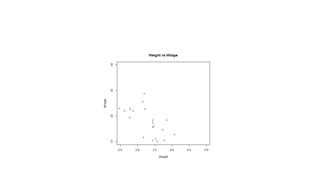
![Example- The below script will create a scatterplot graph for
the relation between wt(weight) and mpg(miles per gallon).
Live Demo
# Get the input values.
input <- mtcars[,c('wt','mpg')]
# Give the chart file a name.
png(file = "scatterplot.png")
# Plot the chart for cars with weight between 2.5 to 5 and mileage between 15 and 30.
plot(x = input$wt,y = input$mpg,
xlab = "Weight",
ylab = "Milage",
xlim = c(2.5,5),
ylim = c(15,30),
main = "Weight vs Milage"
)
# Save the file.
dev.off()](https://image.slidesharecdn.com/exploratorydataanalysisusingr-200607125542/85/Exploratory-data-analysis-using-r-34-320.jpg)


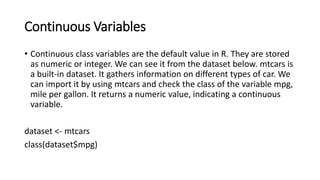
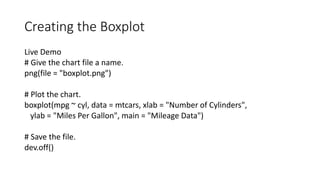
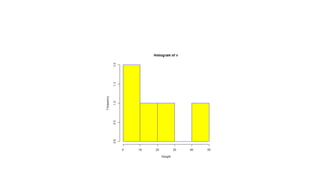
![• To identify the location or the number of NAs we can leverage the
which() and sum() functions:
# identify location of NAs in vector
which(is.na(x))
## [1] 5 8
# identify count of NAs in data frame
sum(is.na(df))
## [1] 3](https://image.slidesharecdn.com/exploratorydataanalysisusingr-200607125542/85/Exploratory-data-analysis-using-r-40-320.jpg)


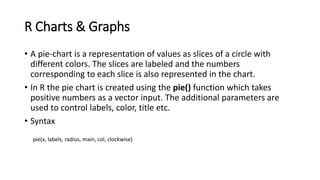
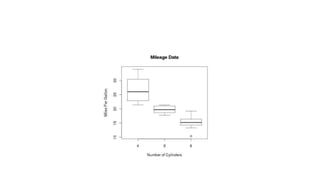
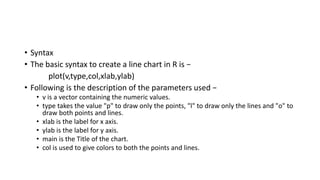
![# recode missing values with the mean
# vector with missing data
x <- c(1:4, NA, 6:7, NA)
x
## [1] 1 2 3 4 NA 6 7 NA
x[is.na(x)] <- mean(x, na.rm = TRUE)
round(x, 2)
## [1] 1.00 2.00 3.00 4.00 3.83 6.00 7.00 3.83](https://image.slidesharecdn.com/exploratorydataanalysisusingr-200607125542/85/Exploratory-data-analysis-using-r-43-320.jpg)
![# data frame that codes missing values as 99
df <- data.frame(col1 = c(1:3, 99), col2 = c(2.5, 4.2, 99, 3.2))
# change 99s to NAs
df[df == 99] <- NA
df
## col1 col2
## 1 1 2.5
## 2 2 4.2
## 3 3 NA
## 4 NA 3.2](https://image.slidesharecdn.com/exploratorydataanalysisusingr-200607125542/85/Exploratory-data-analysis-using-r-44-320.jpg)
![• If we want to recode missing values in a single data frame variable we can
subset for the missing value in that specific variable of interest and then
assign it the replacement value. For example, here we recode the missing
value in col4 with the mean value of col4.
# data frame with missing data
df <- data.frame(col1 = c(1:3, NA),
col2 = c("this", NA,"is", "text"),
col3 = c(TRUE, FALSE, TRUE, TRUE),
col4 = c(2.5, 4.2, 3.2, NA),
stringsAsFactors = FALSE)
df$col4[is.na(df$col4)] <- mean(df$col4, na.rm = TRUE)](https://image.slidesharecdn.com/exploratorydataanalysisusingr-200607125542/85/Exploratory-data-analysis-using-r-45-320.jpg)

![# A vector with missing values
x <- c(1:4, NA, 6:7, NA)
# including NA values will produce an NA output
mean(x)
## [1] NA
# excluding NA values will calculate the mathematical operation for all non-
missing values
mean(x, na.rm = TRUE)
## [1] 3.833333](https://image.slidesharecdn.com/exploratorydataanalysisusingr-200607125542/85/Exploratory-data-analysis-using-r-47-320.jpg)


The document provides an overview of exploratory data analysis in R, focusing on the distinction between categorical and continuous variables, and how to handle both types within R using factors and numeric data. It explains different visualization techniques such as pie charts, bar charts, boxplots, histograms, line graphs, and scatterplots, detailing their syntax and parameters for effective data representation. Additionally, it addresses handling missing values in datasets, showcasing methods to test for, recode, and exclude missing data.